
Abstract
Background:
Most current measures of Huntington’s disease (HD) motor symptoms are subjective, categorical, and limited to in-person visits. Wearable sensors enable objective, frequent, and remote data collection in real-world settings. However, longitudinal sensor studies in HD are lacking.
Objective:
To measure motor symptoms of HD using wearable sensors in a longitudinal study.
Methods:
Participants with HD, prodromal HD, and without a movement disorder wore five accelerometers, one on each limb and on the trunk, at up to four clinic visits over one year. After each visit, participants wore the sensors at home for two days. Based on the accelerometer data from the trunk, we calculated a “truncal Chorea Index” for periods when the participant was sitting. We also measured gait parameters and activity profiles. To measure group differences, track progression, and observe individual variability, statistical analysis of the data was conducted using a linear mixed-effects model.
Results:
Fifteen individuals with HD, five with prodromal HD, and 19 controls were enrolled. The average truncal Chorea Index was higher in individuals with HD (26.6, p < 0.001) than in controls (15.6). For participants with HD, the truncal Chorea Index showed a high intra-day variability but minimal change over 12 months. Individuals with HD walked less (HD = 3818, prodromal HD = 6957, controls = 5514 steps/day) and took longer duration steps (HD = 0.97, prodromal HD = 0.78, controls = 0.85 seconds/step) than the other groups. Individuals with HD spent over half their day lying down (HD = 51.1%, prodromal HD = 38.0%, controls = 37.1%).
Conclusions:
A novel truncal Chorea Index can assess truncal chorea at home, finds substantial variability, and suggests that truncal chorea may be present in prodromal HD. Individuals with HD walk less and slower and spend more time lying down than controls. These findings require additional investigation, could inform clinical care, and could be used to evaluate new therapies.
INTRODUCTION
Huntington’s disease (HD) [1, 2] is a rare, neurodegenerative disorder caused by an inherited genetic mutation, which results in motor, cognitive, and psychiatric symptoms. Chorea and gait dysfunction are often prominent motor features of HD. Most current measures of these symptoms, including the Unified Huntington Disease Rating Scale (UHDRS) [3], are subjective, categorical, physician-provided ratings typically performed during episodic in-person visits [4]. These metrics are vulnerable to biases such as inter-rater variability and are generally limited to in-clinic settings; thus, they might fail to accurately capture the severity, intra- and inter-day variability, and longitudinal progression of symptoms. In addition, early motor signs and symptoms may not be captured by these rating scales.
Indeed, advances in technology have led to objective motor assessments in HD such as the Quantitative-Motor (Q-Motor), an objective in-clinic assessment that has been used in HD clinical trials and found to be more sensitive than the motor measures in the UHDRS, subsequently less prone to placebo effects [5]. Similar to the Q-Motor, wearable sensors may supplement the UHDRS, increase the reliability and sensitivity of our HD study endpoints, and provide a means to capture early symptoms and monitor progression in patients with prodromal HD. While the Q-Motor is an episodic assessment limited to the clinic, mobile sensors can collect data remotely and longitudinally and further enhance our understanding of HD.
Sensors, such as audio [6], video [7, 8], wearables [9], and smartphones [10, 11] have been an attractive option used to obtain objective data to better characterize motor and non-motor symptoms in various diseases. In particular, wearable sensors can continuously capture long duration longitudinal data in both clinical and remote settings and are useful in evaluating motor symptoms. Few studies have evaluated sensors in HD and prodromal HD [10, 12–19], and the scope of these studies has been largely limited to gait and posture assessments for in-clinic settings. One study objectively measured chorea in the clinic using a grip device with an electromagnetic sensor [20]. Only one study has assessed HD motor symptoms remotely [21]. There has been, to our knowledge, no study quantifying chorea outside of the clinic.
We previously published results from our cross-sectional study [22] with focus on activity analysis for both in-clinic and in-home durations for HD, prodromal HD, and control participants. From this study, we found that individuals with HD appeared to spend a large portion of their day lying down. Building on this work, we extended the study period to 12 months and developed novel digital measures to quantify and track motor symptoms in HD.
MATERIALS AND METHODS
Study overview and design
We conducted a longitudinal, 12-month, observational study in individuals with HD, prodromal HD, and in controls without a movement disorder using accelerometers packaged in BioStampRC® wearable sensors developed by MC10 Inc (Lexington, MA, USA) [23]. The University of Rochester’s institutional review board approved the procedures used in the study, and there was full compliance with human experimentation guidelines. We recruited individuals with HD and prodromal HD from clinics, study interest registries, and regional support groups. Control participants were comprised of unaffected spouses, family members, friends, and community members. Participants with HD had self-reported clinical diagnoses with a positive family history and clinical features characteristic of the disease. Participants with prodromal HD had undergone confirmatory genetic testing (CAG trinucleotide expansion of at least 36 repeats) but did not have sufficient motor signs to warrant a diagnosis of manifest HD as determined by the investigator. All participants provided written informed consent before study participation.
In the clinic, participants underwent the Montreal Cognitive Assessment [24] and signed a video waiver form before providing basic demographic data and medical history including CAG repeat length, if known. All individuals participated in a baseline visit and were subsequently given the option to come for three follow up visits over the course of 12 months (at approximately 6 months, 9 months, and 12 months). At each visit we outfitted participants with five self-adhesive accelerometer-based wearable sensors with one on each anterior thigh, one on each anterior forearm, and one on the chest (Fig. 1). Participants were video-recorded undergoing standard clinic assessments including the Unified Huntington Disease Rating Scale [3], Timed Up-and-Go [25], Ten-Meter Walk test [26], and smartphone assessments. Two physicians experienced in HD and certified by the European Huntington Disease Network’s UHDRS-Total Motor Score online certification [27] performed all motor assessments.
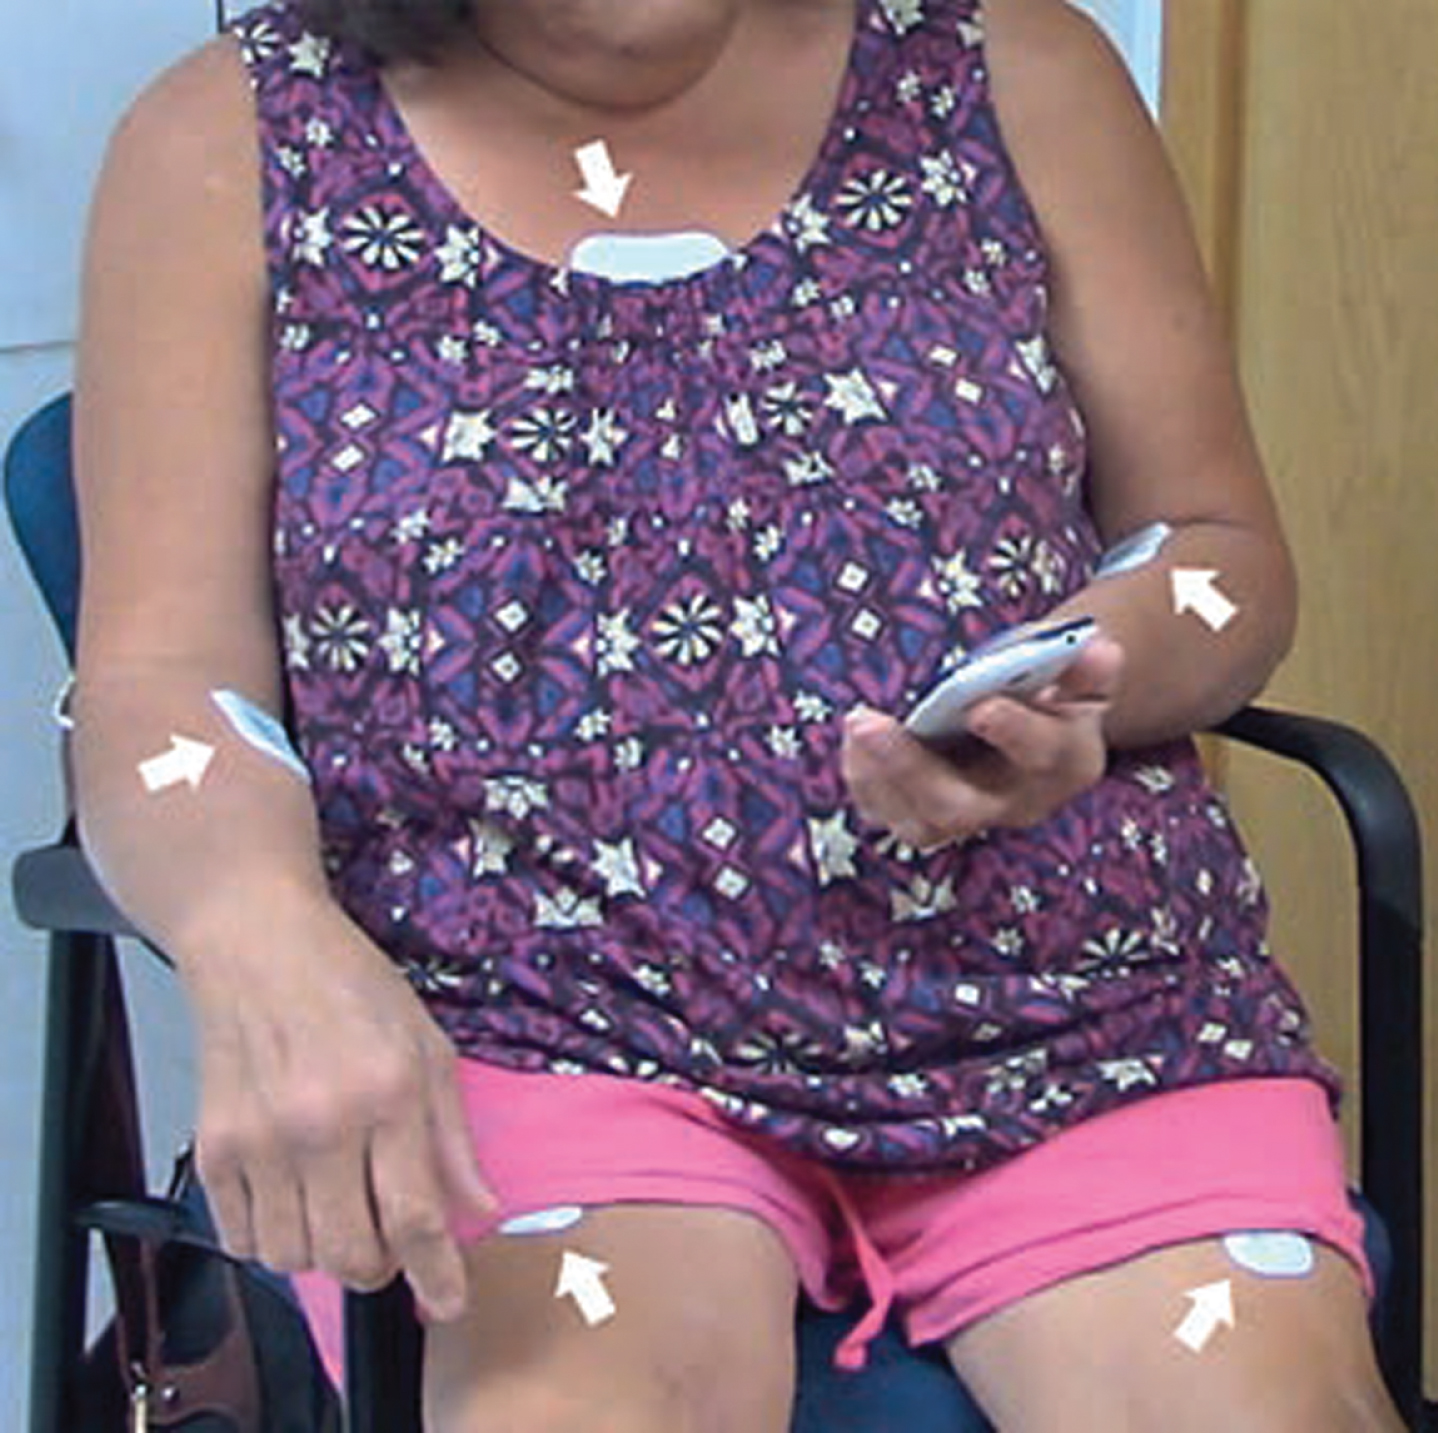
A study participant wearing the sensors at five different locations; one sensor is placed on each of the limbs and one on the trunk.
After the in-clinic assessments, participants wore the sensors at home for an additional continuous interval totaling approximately 46 hours (sensors were worn during sleep). During the in-home monitoring period, participants were asked to complete an activity log to supplement the sensor data. The activity log included information about daily activities along with information on the participant’s anti-chorea medication schedule, if applicable. At the end of the two-day in-home monitoring period, the sensors and activity logs were mailed back to the research team, and the data were extracted via Bluetooth.
Wearable sensor data collection
The tri-axial accelerometer data from sensors were collected at a sampling rate of 31.25 Hz. The chorea, gait, and activity analyses were based on activity information obtained using the data from the chest sensor and thigh sensors. The methods for data collection were described in a previous publication[22].
Chorea analysis
The chorea analysis aimed to quantify the irregular non-deliberate movements of the trunk. We derived a “truncal Chorea Index” from raw sensor data in two stages. First, the activity analysis was performed using the technique described in Adams et. al [22] to determine an individual’s primary posture. The accelerometer data from the trunk and one of the thigh sensors were divided into non-overlapping intervals of 5 seconds. For each 5-second interval, a posture was determined based on the combination of dominant axis (x-, y-, or z-) for the trunk and thigh sensors. The postures were categorized as lying down, sitting, and standing/walking. Next, we utilized the 3D accelerometer data from each 5-second sitting interval to estimate the truncal Chorea Index. For each 5-second sitting interval, we performed mean subtraction to remove the effect of gravity. From the mean subtracted 3D accelerometer data, we computed magnitude acceleration. To separate deliberate movements from non-deliberate, irregular “jerky” movements characteristic of chorea, a bandpass filter (passband 1–5 Hz) was utilized to remove the low frequency deliberate movements and high frequency noise [28] from the magnitude acceleration data. A truncal Chorea Index representing the amplitude of the jerky movements in the trunk region of the body was estimated by computing the total variation [29] in the bandpass-filtered magnitude acceleration signal. The mean truncal Chorea Index was calculated as a quantitative estimate of Huntington’s chorea in each participant. The truncal Chorea Index was normalized to a scale of 0 to 100 by linear scaling. The normalization constant was determined such that a Chorea Index value of 100 is obtained for the mean plus one standard deviation computed for un-normalized average truncal Chorea Index values for HD participants with a UHDRS maximum truncal chorea score of 3, which was the highest score in this study.
Gait analysis
Step count, step duration, step length, walk speed, and coordination between the legs while walking were quantified and compared. As mentioned previously, the activity analysis helped us identify postures like lying down, sitting, and standing/walking. Standing and walking durations were further segregated using normalized auto-correlation analysis on trunk sensor data as described in [30]. The periodicity in walking emerged as strong peaks at certain lags in the normalized auto-correlation. Total number of peaks and duration between the peaks in the normalized auto-correlation provided estimates of the number of steps taken and step duration, respectively, for each 5-second walking interval. The first and second peak magnitude of a normalized cross-correlation [30] between the recorded acceleration for the left and right thigh sensors was utilized to quantify the (lack of) coordination between legs for each 5-second walking interval. Apart from step count, step duration, and gait co-ordination, we also estimated the step length for each 5-second walking interval using an empirical method described in [31]. We utilized the step length to estimate total distance travelled and divide by total time taken to estimate walkingspeed.
Activity analysis
As described previously [22] and above, the posture (lying down, sitting, and standing/walking) of a participant was determined based on the combination of dominant acceleration axes of the trunk and thigh sensors for non-overlapping 5-second intervals. Standing and walking activity durations were further classified based on autocorrelation analysis of trunk sensor data.
Statistical analysis
To evaluate the mean differences in the truncal Chorea Index, gait, and activity parameters between groups and assess the longitudinal progression within groups, we analyzed the data using a linear mixed effects model [32] that assesses the differences in the HD and prodromal HD groups in relation to the control group. For each response variable, the linear mixed effects model used participant group (HD, prodromal HD, controls), time of clinical visit (baseline, 6, 9, 12-month), and interaction between the participant group and clinical visit as fixed effects (fixed slope and fixed intercept) and participant variability as a random effect (random intercept). The Matlab function “fitlme” [33] (release R2018b) was used for the obtaining the model fit. To evaluate the correlation between truncal Chorea Index and clinician rated UHDRS maximum truncal score, correlation analysis (Spearman correlation coefficient [34]) wasused.
RESULTS
Study population
Fifteen participants with HD, 5 participants with prodromal HD, and 19 controls were recruited for the longitudinal study. No participants were excluded from the study. In addition, we recruited 16 participants with Parkinson’s disease (results not reported). Individuals with prodromal HD were much younger (average age 38.5 years) than those with HD (55.4 years) or controls (57.6 years) (p = 0.007). Table 1 provides the baseline characteristics of the study’s participants. The number of participants at each visit varied. The Supplementary Table 1 details the number of HD, prodromal HD, and control individuals that participated in each of the four visits and the number of participants whose data were used for the analysis. Participants for whom sensor data was missing or exhibited clear anomalies were excluded from the analysis. Specifically, data from three participants with HD (one each at the baseline, 6-month, and 12-month visits) were not used due to unavailability of chest or limb sensors, which were lost or broken during mailing. Data from one participant with HD (at the 6-month visit) were excluded due to the faulty sensor measurements. The number of controls used at each time point was chosen to approximately match the number of participants with HD that were available for analysis. In total, 42.5 hours of data from in-clinic assessments and 1402 hours of data from out-of-clinic recordings were used in the analysis.
Baseline characteristics of the study population
Values are mean±standard deviation unless otherwise noted. UHDRS, Unified Huntington’s Disease Rating Scale; NA, not applicable. aHigher score indicate greater disability. bHigher score indicates greater cognitive function.
Chorea analysis
The truncal Chorea Index was calculated for the participants over the durations they were assessed to be in a sitting position. Over each approximately 46-hour period of sensor observation, the participants with HD spent an average of 11.3 hours sitting (range 5.9 to 19.4 hours), prodromal HD participants spent an average of 11.8 hours sitting (range 8.3 to 19.4 hours), and controls spent an average of 16.1 hours sitting (range 9.6 to 26.2 hours).
In the baseline study, truncal Chorea Index exhibited high variability for a participant over time and across participants as shown in Fig. 2, where histograms for the distribution of Chorea Index are presented for each of the participants. For example, for one participant (Participant 10), the 5th percentile and 95th percentile values for the truncal Chorea Index were 11.9 and 74.8, respectively. The observed distribution of the truncal Chorea Index was non-Gaussian and heterogeneous over the participant population. For statistical analysis, a log transformation was applied to the Chorea Index, which yields a distribution closer to normal.
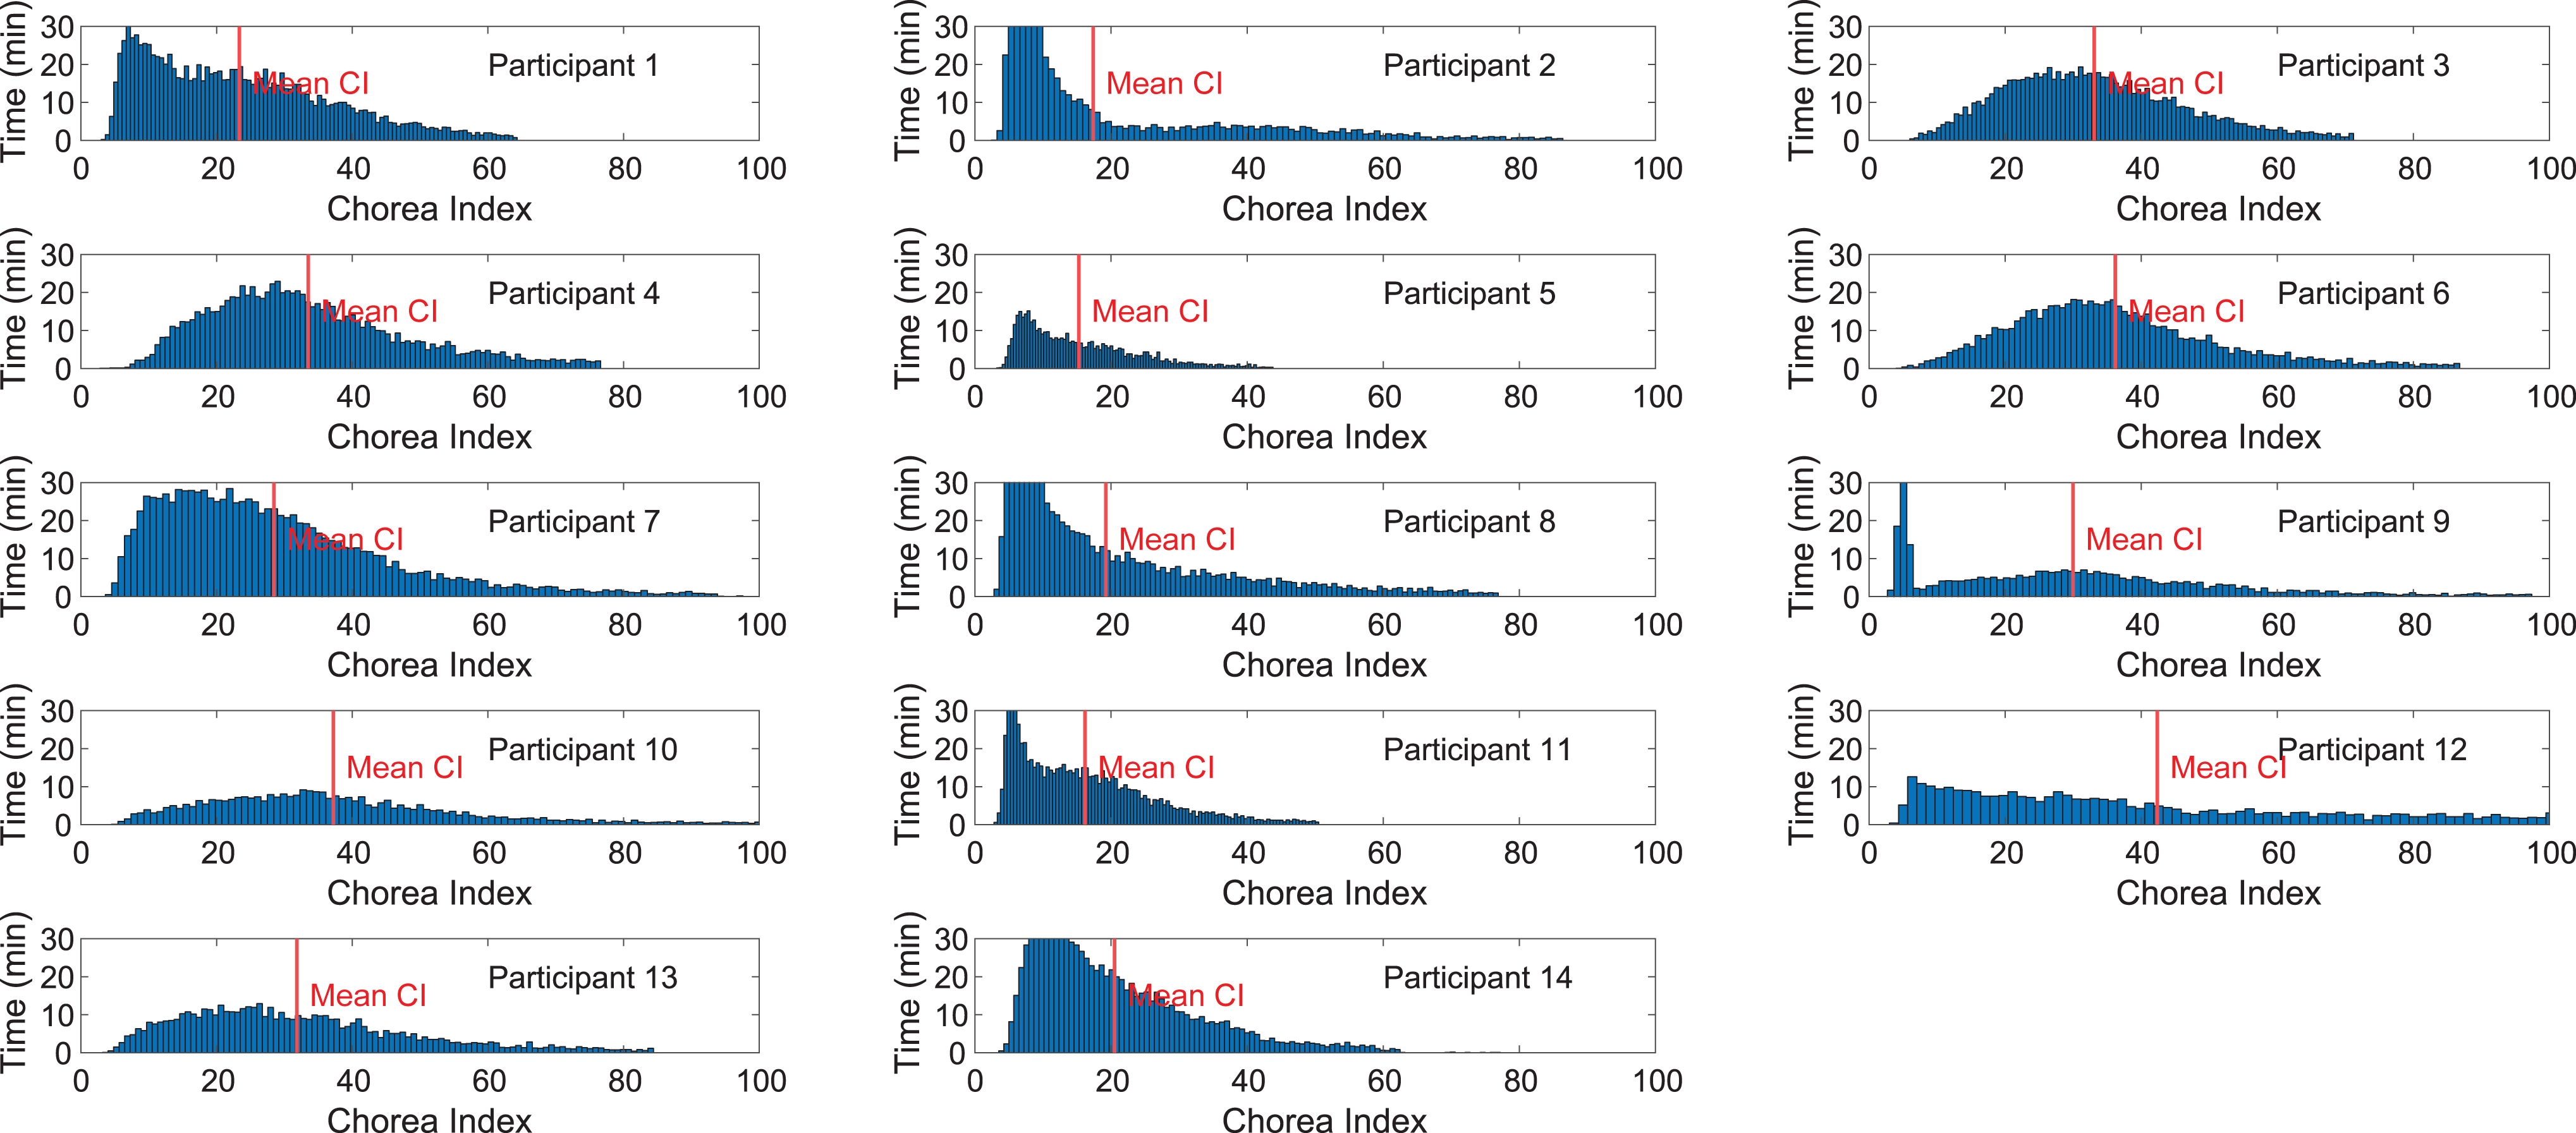
Histograms showing the distribution of the truncal Chorea Index for each participant with HD during the baseline study (Only 14 out of 15 participants analyzed as mentioned in Supplementary Table 1). The height of each histogram bin (along the Y-axis) shows the duration (in minutes) over which the value of the truncal Chorea Index lay in the bin (over the entire sitting durations analyzed). The histograms illustrate the fact that the temporal distribution of the truncal Chorea Index varies widely among the participants.
Log transformed truncal Chorea Index values computed for the participants over the longitudinal study were used as the response variable for a linear mixed effects model that allows for characterization of effects related to both the participant group and the longitudinal effects. Based on the linear mixed effects model, as shown in Fig. 3a, the mean truncal Chorea Index during the baseline visit for HD participant group (26.6, p < 0.001, 95% CI = 20.1 to 35.2) was higher than the control participant group (15.6, 95% CI = 14 to 17.5). While the mean truncal Chorea Index for prodromal HD group (17.4, p = 0.38, 95% CI = 12.2 to 24.8) was higher than for the control group, the effect was not found to be statistically significant in this small study. Over the 12-month duration of the study, truncal Chorea Index did not show a statistically significant change (Fig. 3b). The model predicts average percentage increase in the truncal Chorea Index of 0.04% per month (p = 0.30) for HD participants. The 95% CI for the progression rate spanned the range from –2.2% to 2.3% per month. No progression was found in the prodromal HD group. The truncal Chorea Index for an individual exhibited high variability. For the HD group, the 2.5th and 97.5th percentile truncal Chorea Index values were 17.6 and 40.3, respectively. Details of the linear mixed effects model are included in the Supplementary Material.
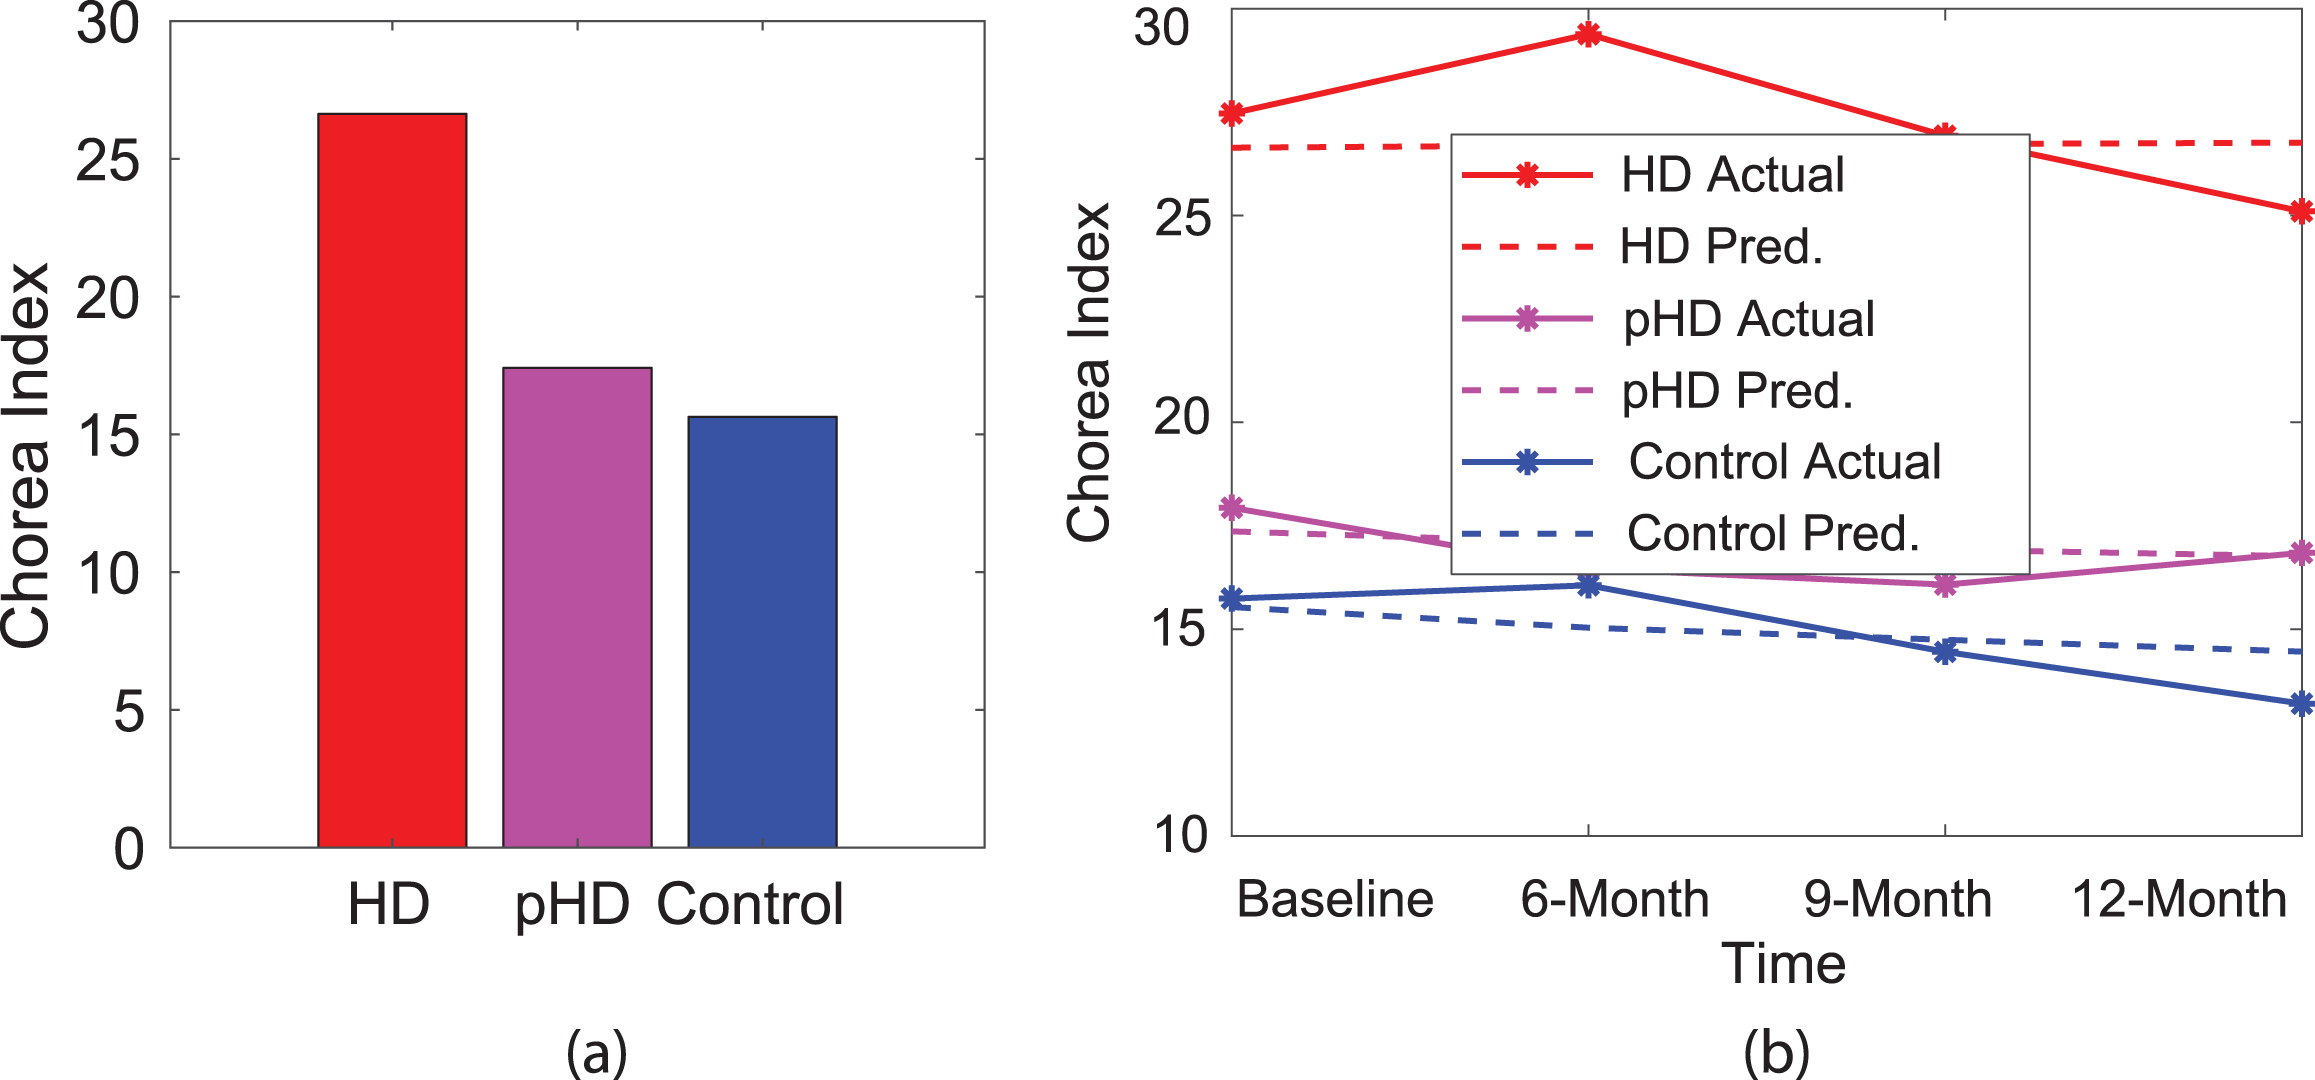
(a) Average truncal Chorea Index for HD, prodromal HD, and controls during baseline visit. (b) Longitudinal progression (both actual and predicted) of truncal Chorea Index over a span of 12-months. Number of participants = 15 HD, 5 prodromal HD, and 19 controls.
For the baseline visit, the Spearman correlation coefficient between the physician rated UHDRS maximal truncal chorea score and the average truncal Chorea Index was r = 0.52 (p = 0.06) over the in-clinic duration and r = 0.47 (p = 0.09) over the in-home duration. With our rather small participant cohort, the p-value for the in-clinic duration falls just above the traditional 5% significance level, whereas the poorer agreement with the in-home duration is not unexpected due to the high variability seen for each participant.
Gait analysis
Between/within group variability and rate of progression of estimated gait parameters (steps per day, step duration, step length, walk speed, and step co-ordination) for HD, prodromal HD, and controls, were also analyzed using a linear mixed effects model that used these parameters as the response variable. Figure 4 shows the difference in estimated gait parameters during the baseline visit and corresponding longitudinal progression for HD, prodromal HD and controls. When compared with controls (5514 steps/day, 95% CI = 3913 steps/day to 7115 steps/day), individuals with HD walked less (3818 steps/day, p = 0.16, 95% CI = –190 steps/day to 7828 steps/day) and individuals with prodromal HD walked more (6957 steps/day, p = 0.41, 95% CI = 1880 steps/day to 12035 steps/day), however, the results were not statistically significant. No statistically significant progression was seen for the HD group (281 steps/day increase over 12-month span, p = 0.74, 95% CI = –4072 steps/day to 4636 steps/day). We observed high individual variability with a standard deviation of approximately 2802 steps. Individuals with HD had a significantly longer step duration (0.97 seconds/step, p = 0.05, 95% CI = 0.77 seconds/step to 1.17 seconds/step) whereas individuals with prodromal HD had shorter step duration (0.78 seconds/step, p = 0.41, 95% CI = 0.52 seconds/step to 1.03 seconds/step) when compared with the controls (0.85 seconds/step, 95% CI = 0.77 seconds/step to 0.93 seconds/step). For individuals with HD, the step duration increased by 0.04 seconds/step over a 12-month duration, though the change was not statistically significant (p = 0.98, 95% CI = –0.09 seconds/step to 0.16 seconds/step). The individual variability in step duration was high (standard deviation 0.17 seconds). The estimated step length was slightly shorter for individuals with HD, resulting in slower walking speed (0.61 meters/second, p = 0.07, 95% CI = 0.43 meters/second to 0.80 meters/second) than controls (0.71 meters/second, 95% CI = 0.64 meters/second to 0.78 meters/second). Individuals with prodromal HD had higher walk speed (0.81 meters/second, p = 0.20, 95% CI = 0.58 meters/second to 1.05 meters/second) than controls. We also observed a reduction in walk speed for individuals with HD over the 12-month study period with a reduction of 0.07 meters/second per year (p = 0.39, 95% CI = –0.22 meters/second to 0.08 meters/second). There was high variability in the estimated walk speed for each individual with a standard deviation of 0.14 meters/second.
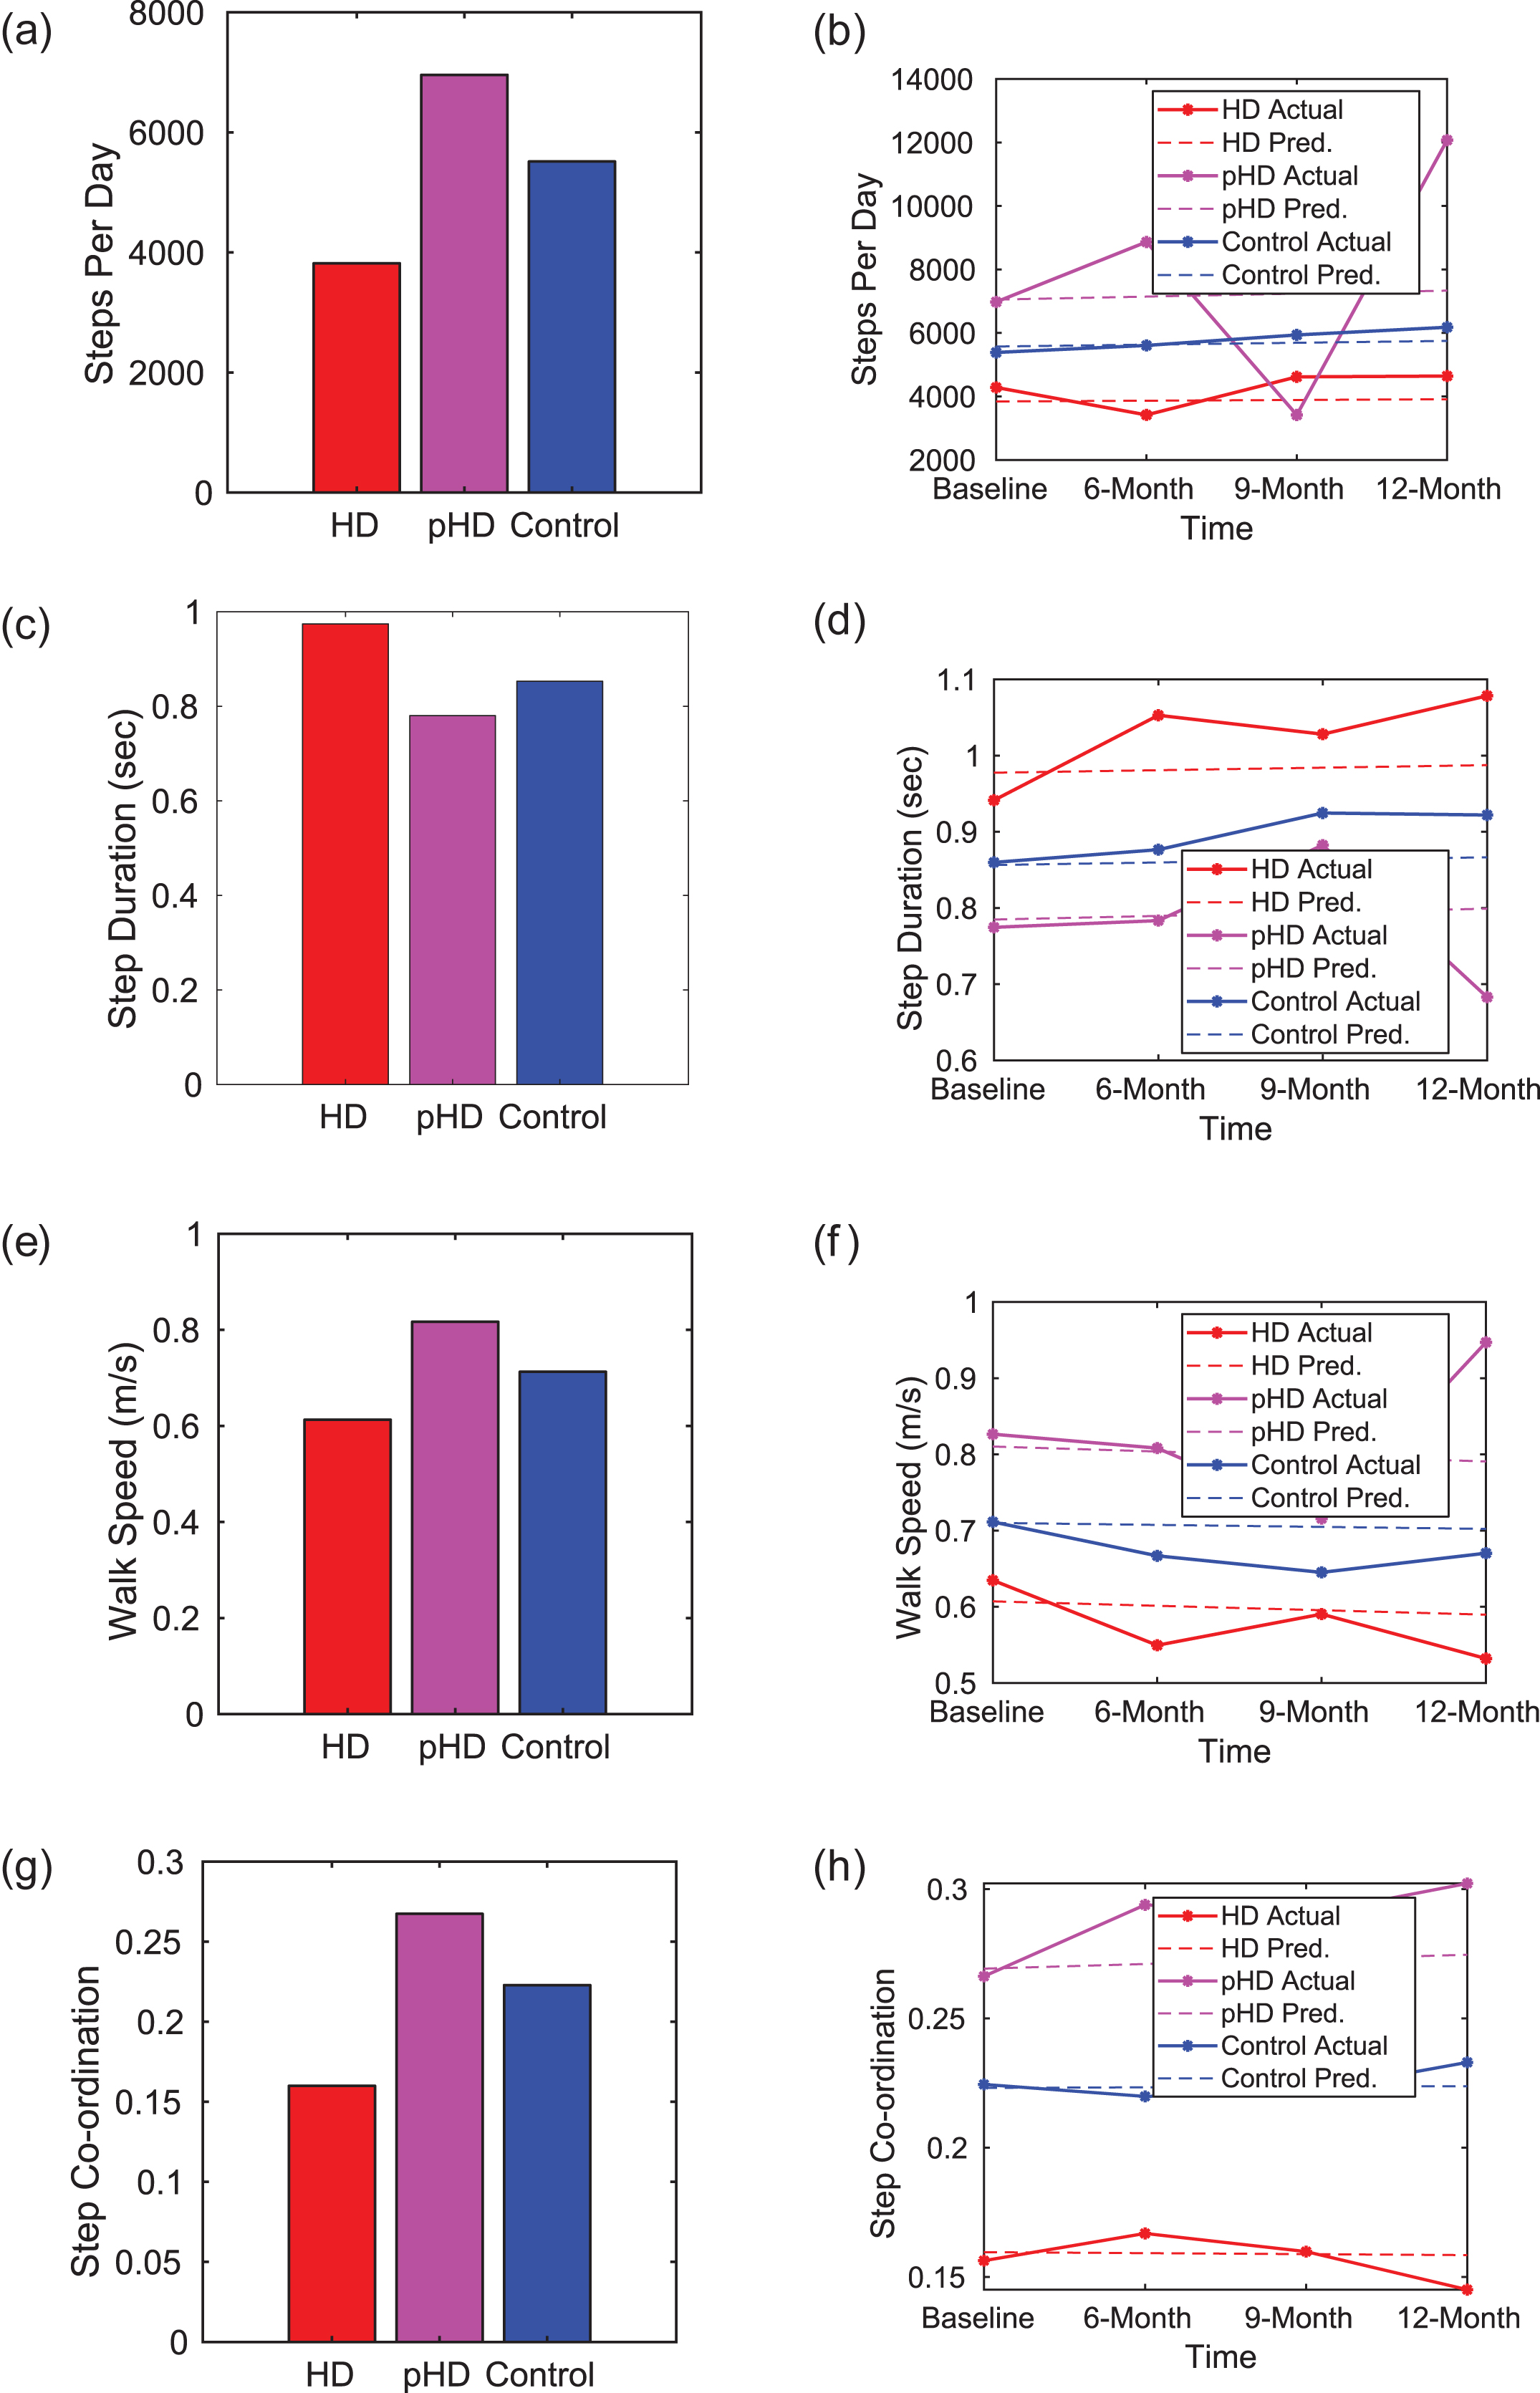
Comparison of estimated gait parameters for HD, prodromal HD (pHD), and control participants during the baseline visit and the corresponding longitudinal progression. The plots for longitudinal progression include both, the model predicted progression and the actual data (averaged over the group). Number of participants = 15 HD, 5 prodromal HD, and 19 controls. (a) Number of steps taken per day. Controls and prodromal HD participants were recorded as having a larger number of steps per day in comparison with HD participants. (b) Progression of steps per day. No significant reduction in steps per day was found for HD participants over a span of 12-months (c) Step duration. Individuals with HD had significantly longer step durations than prodromal HD and controls. (d) Progression of step duration. Although there was a slight increase in the step duration over the course of study for individuals with HD, it was not statistically significant. (e) Walk speed. Individuals with HD had a significantly lower walk speed in comparison with prodromal HD and controls. (f) Progression of walk speed. We could observe a significant reduction in walk speed for the HD group (g) Walk co-ordination. A plot of first peak magnitude for the cross correlation from left-to-right thigh sensor acceleration values. The higher magnitude of the cross-correlation first peak highlight that individuals with HD have significant variability of gait and poorer cross limb coordination than control and prodromal HD participants. (h) Progression of step co-ordination. We observed an insignificant deterioration of cross limb co-ordination for individualswith HD.
Cross correlation analysis showed that numerical measures quantifying inter-leg coordination were lower for individuals with HD than controls. Specifically, the normalized cross-correlation was computed between the recorded accelerations for the sensors placed on the left and right thighs and the inter-leg coordination was assessed by computing the peak magnitude for the first and second peaks that correspond with one step and one stride duration, respectively [30]. The first peak magnitude was significantly lower in HD (0.16, p < 0.001, 95% CI = 0.11 to 0.20) and significantly higher in prodromal HD (0.26, p < 0.001, 95% CI = 0.21 to 0.32), when compared with controls (0.22, 95% CI = 0.20 to 0.24). We could observe a small deterioration in walk coordination for HD over the 12-month study period, however, the progression was insignificant.
In general, we could observe statistically significant gait parameter differences between the HD and control groups, but with little changes over the 12-month duration of the study. The Supplementary Material includes details for the linear mixed effects model.
Activity analysis
A linear mixed effects model with the proportion of time spent in different activities as the response variable was used to analyze the longitudinal activity data. Figure 5 shows the proportion of time spent lying, sitting, standing, and walking and the corresponding progressions for HD, prodromal HD, and controls. HD individuals spent significantly more of their time outside the clinic lying down (51.1%, p < 0.001, 95% CI = 39.6% to 62.6%) than controls (37.1%, 95% CI = 32.5% to 41.7%). The proportion of time lying down for individuals with prodromal HD (38%, p = 0.86, 95% CI = 23.4% to 52.5%) did not vary much when compared with controls. Apart from lying down, there were no significant differences between HD, prodromal HD, and controls for the other activities such as sitting, standing, and walking, however there was high individual variability in time spent in different activities. The time spent lying, sitting, standing, and walking did not change significantly over the 12-month duration of the study. Details of the linear mixed effects model analysis are included in the Supplementary Material.
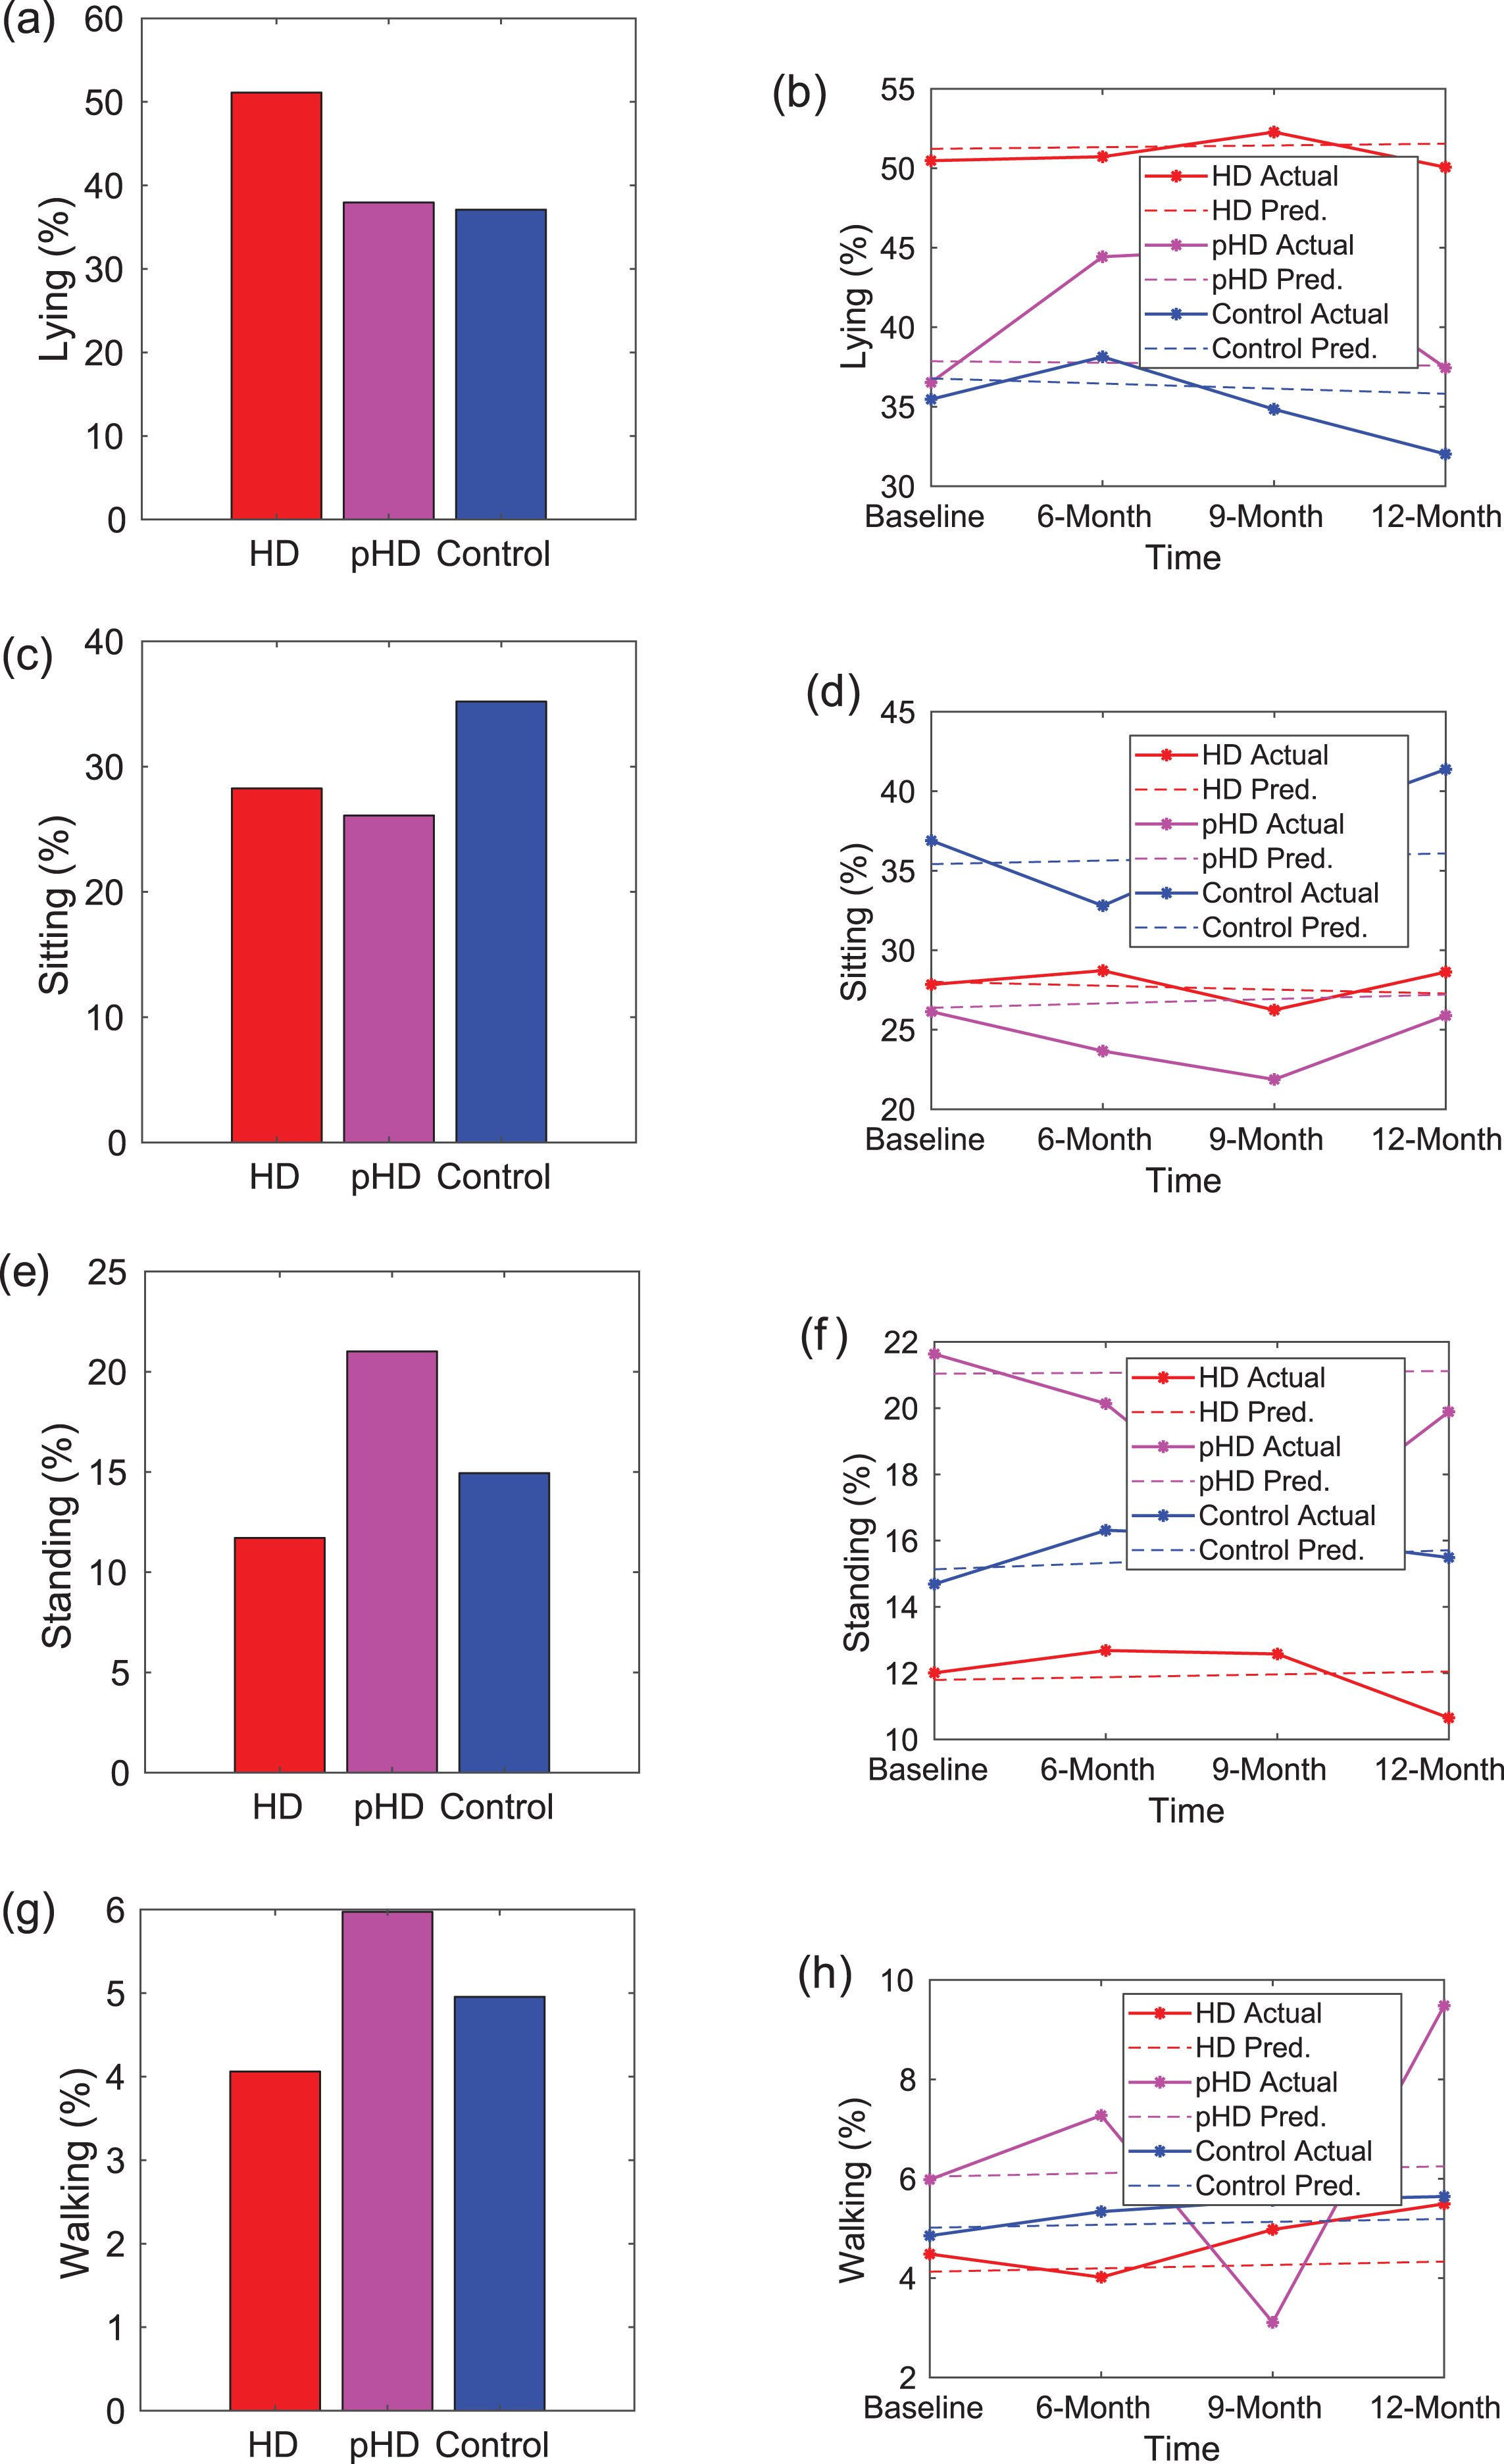
Comparison of proportion of time spent in lying, sitting, standing, and walking activities during the baseline visit and tracking progression for HD, prodromal HD (pHD), and control participants. The plots for longitudinal progression include both, the model predicted progression and the actual data (averaged over the group). Number of participants = 15 HD, 5 prodromal HD, and 19 controls. (a) Proportion of time spent lying down. The time spent lying down for individuals with HD is significantly higher than that for prodromal HD and control participants. (b) Time spent lying down progression. Over the 12-month duration of the study, we do not observe any significant increase in the duration of time that individuals with HD spent lying down. The proportion of time spent in sitting, standing, and walking is shown in (c), (e), and (g) respectively, with the corresponding progressions shown in (d), (f), and (h), respectively.
DISCUSSION
Digital tools can improve the way we measure current features of disease and measure the previously unmeasurable. In this first longitudinal wearable study in HD, we developed an objective measure of chorea that can be evaluated while participants are in the clinic or at home. Using a novel Chorea Index, truncal chorea could be quantified when participants were determined to be sitting. The Chorea Index demonstrated that individuals with HD had more truncal chorea than those with prodromal HD who, despite a young age, had more than controls. In addition, by conducting the assessments over days, substantial variability in truncal chorea could be observed and quantified. While variability in chorea severity in individuals with HD is widely acknowledged, it has never before been measured to our knowledge. The variability in motor function in HD is consistent with what has been found in Parkinson’s disease and suggests that single point measurements of involuntary movements may not be representative [35]. By providing continuous measurements, wearable devices are superior to traditional assessments in this regard.
In addition, this longitudinal study confirmed the preliminary findings from the cross-sectional study that individuals with HD spend over half their days outside of the clinic lying down. The reasons for this finding are not certain and could include the possibility that individuals are sleeping (which was not assessed in this study), fatigued, depressed, lonely, or influenced by other factors [36, 37]. Few studies to our knowledge have assessed time spent lying down in the general population and none in HD [38, 39]. In one Norwegian study, individuals who spent more than 11 hours lying down, as determined by a patient-reported questionnaire, had a higher mortality rate, particularly from cardiovascular disease [39]. Given this novel finding, we should consider what other key features of the disease are being missed due to our overreliance on in-clinic assessments.
This study also assessed important features of activity and gait. As measured by the number of steps taken each day, individuals with HD were 30% less active than age-matched controls in the study. One previous study by Busse and colleagues of 24 individuals with HD found that the average number of steps taken over a one week period using an activity monitor was 4978 steps per day, which was more than the 3818 steps per day that we observed [40]. Activity is also decreased in other neurodegenerative disorders, including Parkinson’s disease [41].
Gait speed is another important measure of function and has been called the “sixth vital sign” [42] and the “functional vital sign” [43]. Higher walking speeds are associated with greater survival in older adults [44, 45], and improvements in gait speed predict better survival [46]. In addition, in Parkinson’s disease, gait speed is “highly correlated to severity of disease and patient perception of motion disability” [47]. In this study, the average walking speed of participants with HD was quite slow (0.61 meters/second), which is much slower than that observed by Busse and colleagues (0.88 meters/second) in their in-clinic study [40]. This could be due to study population, device differences, or observation effects resulting in faster in clinic gait speeds, the latter of which has been shown in other studies [48, 49]. In our study, we computed gait speed from calculations of steps per unit time and distance covered per unit; these are derived estimates as we did not validate our measurements against a manually labeled ground truth. The ability to differentiate individuals with HD from those with prodromal HD is consistent with a study by Beckman and colleagues that found differences between the two groups on measures of gait and posture [14]. Our prodromal HD group performed better than our control group in gait and activity metrics, which was likely due to age differences between the groups. We plan to age match controls for the prodromal HD group in future studies.
The study, while novel, has limitations. The sample size, especially for prodromal HD, was small. We also lost participants during the longitudinal follow up. As mentioned, the presented study was an extension of our pilot and some participants did not wish to participate in the longitudinal study. Others were lost due to relocation, loss of interest, and inability to contact. This, particularly loss of interest, is something to consider when incorporating these devices into clinical trials. In addition, accelerometer data from a small handful of participants was missing, and in a few cases, the wearable sensors did not stay adhered to the skin. We expect that this will improve with future generations of the device. We had no third-person or absolute means of assessing activities outside of the clinic, other than the activity diary. These observations would benefit from either personal observation or video recordings outside the clinic to better establish the “ground truth” of the findings. This is a limitation of many wearable sensor systems although device algorithms are becoming more sophisticated and reliable. Notably, the assessments in this study were almost entirely devoted to motor function. Real-world data on behavioral (which may be informed by the activity of participants) and cognitive function are also needed and we plan to incorporate these measures in future studies. Finally, all individuals have some amount of non-deliberate movements, as evidenced by an average truncal Chorea Index of 15.6 among control participants. Still, we can observe an increase in truncal Chorea Index values for HD and prodromal HD individuals, showing that the HD and prodromal HD cohort have higher amount of non-deliberate movement than controls. Future studies with larger populations involving additional investigators, sites, and devices are needed to verify the findings of this study and to develop new insights and measures of HD.
Current clinical assessments of HD are plagued by subjective, insensitive, episodic, in-clinic measures [4, 50]. Digital measures can provide objective, sensitive, frequent, real-world assessments of disease and health. This study demonstrates the promise of these tools, which can be used to improve care and enhance evaluation of therapies for HD.
CONFLICT OF INTEREST
Karthik Dinesh, Christopher W. Snyder, Mulin Xiong, Saloni Sharma, and Gaurav Sharma have no conflicts of interest to report related to the subject matter or materials discussed in the manuscript.
Christopher G. Tarolli has no conflict of interest to report related to this manuscript. He has received honoraria for authorship for the American Academy of Neurology; and research support from American Academy of Neurology Institute, Biosensics, Michael J. Fox Foundation, National Institutes of Health/National Institute of Neurological Disorders and Stroke, and Safra Foundation.
E. Ray Dorsey has received honoraria for speaking at American Academy of Neurology courses, American Neurological Association, and University of Michigan; received compensation for consulting services from 23andMe, Abbott, Abbvie, American Well, Biogen, Clintrex, DeciBio, Denali Therapeutics, GlaxoSmithKline, Grand Rounds, Karger, Lundbeck, MC10, MedAvante, Medical-legal services, Mednick Associates, National Institute of Neurological Disorders and Stroke, Olson Research Group, Optio, Prilenia, Putnam Associates, Roche, Sanofi, Shire, Sunovion Pharma, Teva, UCB and Voyager Therapeutics; research support from Abbvie, Acadia Pharmaceuticals, AMC Health, Biosensics, Burroughs Wellcome Fund, Davis Phinney Foundation, Duke University, Food and Drug Administration, GlaxoSmithKline, Greater Rochester Health Foundation, Huntington Study Group, Michael J. Fox Foundation, National Institutes of Health/National Institute of Neurological Disorders and Stroke, National Science Foundation, Nuredis Pharmaceuticals, Patient-Centered Outcomes Research Institute, Pfizer, Prana Biotechnology, Raptor Pharmaceuticals, Roche, Safra Foundation, Teva Pharmaceuticals, University of California Irvine; editorial services for Karger Publications; and ownership interests with Grand Rounds (second opinion service).
Jamie L. Adams has no conflict of interest to report related to this manuscript. She received honoraria for speaking at the Huntington Study Group Annual Meeting; received compensation for consulting services from VisualDx; and research support from Azevan Pharmaceuticals, Biogen, Biohaven Pharmaceuticals, Biosensics, Empire Clinical Research Investigator Program, Michael J. Fox Foundation, National Institutes of Health/National Institute of Neurological Disorders and Stroke, NeuroNext Network, Pfizer, and Safra Foundation.