
Abstract
Background:
Molecular studies provide evidence that mutant huntingtin (mHTT) affects early cortical development; however, cortical development has not been evaluated in child and adolescent carriers of mHTT.
Objective:
To evaluate the impact of mHTT on the developmental trajectories of cortical thickness and surface area.
Methods:
Children and adolescents (6–18 years) participated in the KidsHD study. mHTT carrier status was determined for research purposes only to classify participants as gene expanded (GE) and gene non-expanded (GNE). Cortical features were extracted from 3T neuroimaging using FreeSurfer. Nonlinear mixed effects models were conducted to determine if age, group, and CAG repeat were associated with cortical morphometry.
Results:
Age-related changes in cortical morphometry were similar across groups. Expanded CAG repeat was not significantly associated with cortical features.
Conclusion:
While striatal development is markedly different in GE and GNE, developmental change of the cortex appears grossly normal among child and adolescent carrier of mHTT.
Keywords
INTRODUCTION
Huntington’s disease (HD) is a fatal neurodegenerative disease caused by a CAG repeat expansion in the Huntingtin gene (HTT; OMIM 143100). The neuropathology of HD is characterized by atrophy of the striatum and surrounding white matter, beginning roughly 15–20 years prior to motor onset [1–3]. This appears to be followed by a progressive loss of cortical volume, which has also been identified around 10–15 years prior to estimated motor onset [4, 5]. Although the primary disease process is neurodegeneration, the origins of disease pathology may lie in neurodevelopmental changes in the growth and development of the striatum, driven by the gene expansion [6].
Robust findings from histopathological research and human neuroimaging studies link mHTT with abnormal cortical development. Evidence of abnormal neuronal migration has been documented in both mouse and human embryos carrying mHTT [7], as well as in adult HD patients through postmortem analyses [8]. Similarly, Cepeda and colleagues reported evidence of cortical dysplasia and hyperexcitability in R2/6 mice shortly after birth [9]. On a structural level, these disruptions to normal corticogenesis likely contribute to smaller intercranial volume [10], cortical enlargement [11], and abnormal cortical folding [12], all which have been observed in adult patients. Despite these reports, the effects of mHTT on development of cortex morphology have not yet been assessed via neuroimaging.
The Kids-HD study was designed to characterize brain development in children and adolescents at-risk for adult-onset HD. Subjects ages 6–18 who have a family history of HD are genotyped for research purposes and grouped into a Gene-Expanded (GE) group: individuals who will develop HD later in life (CAG≥36); or a Gene Non-Expanded (GNE): individuals who will not develop the disease (CAG < 35). We previously reported that GE subjects had significantly different growth and development of the striatum compared to the GNE group with early striatal hypertrophy and a significant decline in volume seen in GE individuals throughout the 6–18-year age range [13]. Using the Kids-HD sample, the goals of the current study were to evaluate differences in cortical morphology (thickness and surface area) between GE and GNE subjects.
MATERIALS AND METHODS
Participants
Details regarding study methods were published previously [13]. Briefly, participants between the ages of 6–18 with a parent and/or grandparent with HD were recruited. CAG repeat was determined through PCR analysis on saliva or blood samples that were collected for research purposes only. Written informed consent was obtained from either the participant or their parent/guardian (for those under 18). Study procedures were approved by the University of Iowa Institutional Review Board.
Following an accelerated longitudinal design, participants were assessed across a wide age range, with some participants returning for multiple visits and others contributing only a single data point [14]. Since we were interested in evaluating development rather than disease progression, we excluded 11 GE observations from 8 participants estimated to be within 15 years from onset, based a model developed by Langbehn and colleagues [15].
MRI acquisition and processing
Neuroimaging data was acquired on either a 3T Siemens Trio TIM (Siemens AG, Munich, Germany) or a 3T General Electric Discovery MR750w (GE Medical Systems, Chicago, IL). Cortical features were extracted using FreeSurfer and regions of interest were labeled with the Desikan-Killiany atlas [13]. Inter-scanner variation was removed using ComBat Harmonization as implemented inez.combat 1.0.0 package in R [16].
Statistical analysis
The development of regional cortical thickness (in mm) and cortical surface area (mm2) were explored using mixed regression analyses. We first evaluated the group*age interaction for each region of interest (ROI), including whole brain, and frontal, parietal, temporal, and occipital lobes. Since cortical development is known to be non-linear [17], we considered varying degrees of non-linearity with natural cubic spline transformations of age. Linear and non-linear models with up to 3 spline knots were compared by calculating Akaiki information criteria corrected for small sample size (AICc) using the AICcmodavg (2.30-1) package. Lower AICc was considered an indicator of better fit. Type III ANOVA was performed to estimate joint significance of the group*age interaction. All models included sex as a covariate and controlled for random effects of both family relations and participants. The false discovery rate (FDR) was calculated to account for repeated analysis and FDR < 0.05 was considered statistically significant. Results were visualized by standardizing and mean-centering cortical variables (mean = 0, units = standard deviation).
We also evaluated the effect of expanded CAG repeat length on cortical features in the GE group using linear mixed-effects models fit by restricted maximum likelihood. All models included sex and age as covariates and controlled for random effects of both family relations and participants.
RESULTS
The sample included 285 total observations from 71 GE participants and 101 GNE participants. Demographics, including age (Mean = 13.6, SD = 3.7), sex (59.3% female), and total motor score (Mean = 1.12, SD = 2.41), were comparable between groups (all p > 0.05) (Table 1). GE participants were, on average, 35.4 years from predicted onset.
Demographics of sample observations
GNE, Gene-Non-Expanded; GE, Gene-Expanded. Welch two sample t-tests were performed to compare UHDRS and age between groups. Chi-square test of independence was used to compare sex distribution between groups.
There were no significant group-by-age interactions across any ROIs for cortical thickness or surface area (Fig. 1, Table 2). Both GE and GNE groups demonstrated comparable thinning of the cortex with increased age (F(3, 246) = 2.34, FDR =0.185). Both groups also showed similar non-linear change in whole brain cortical surface area with age (F(3,84.5) = 3.16, FDR = 0.095; Fig. 1). Details on model selection (Supplementary Table 1) and main effects of group, sex, and age (Supplementary Table 2) are described in the Supplementary Material.
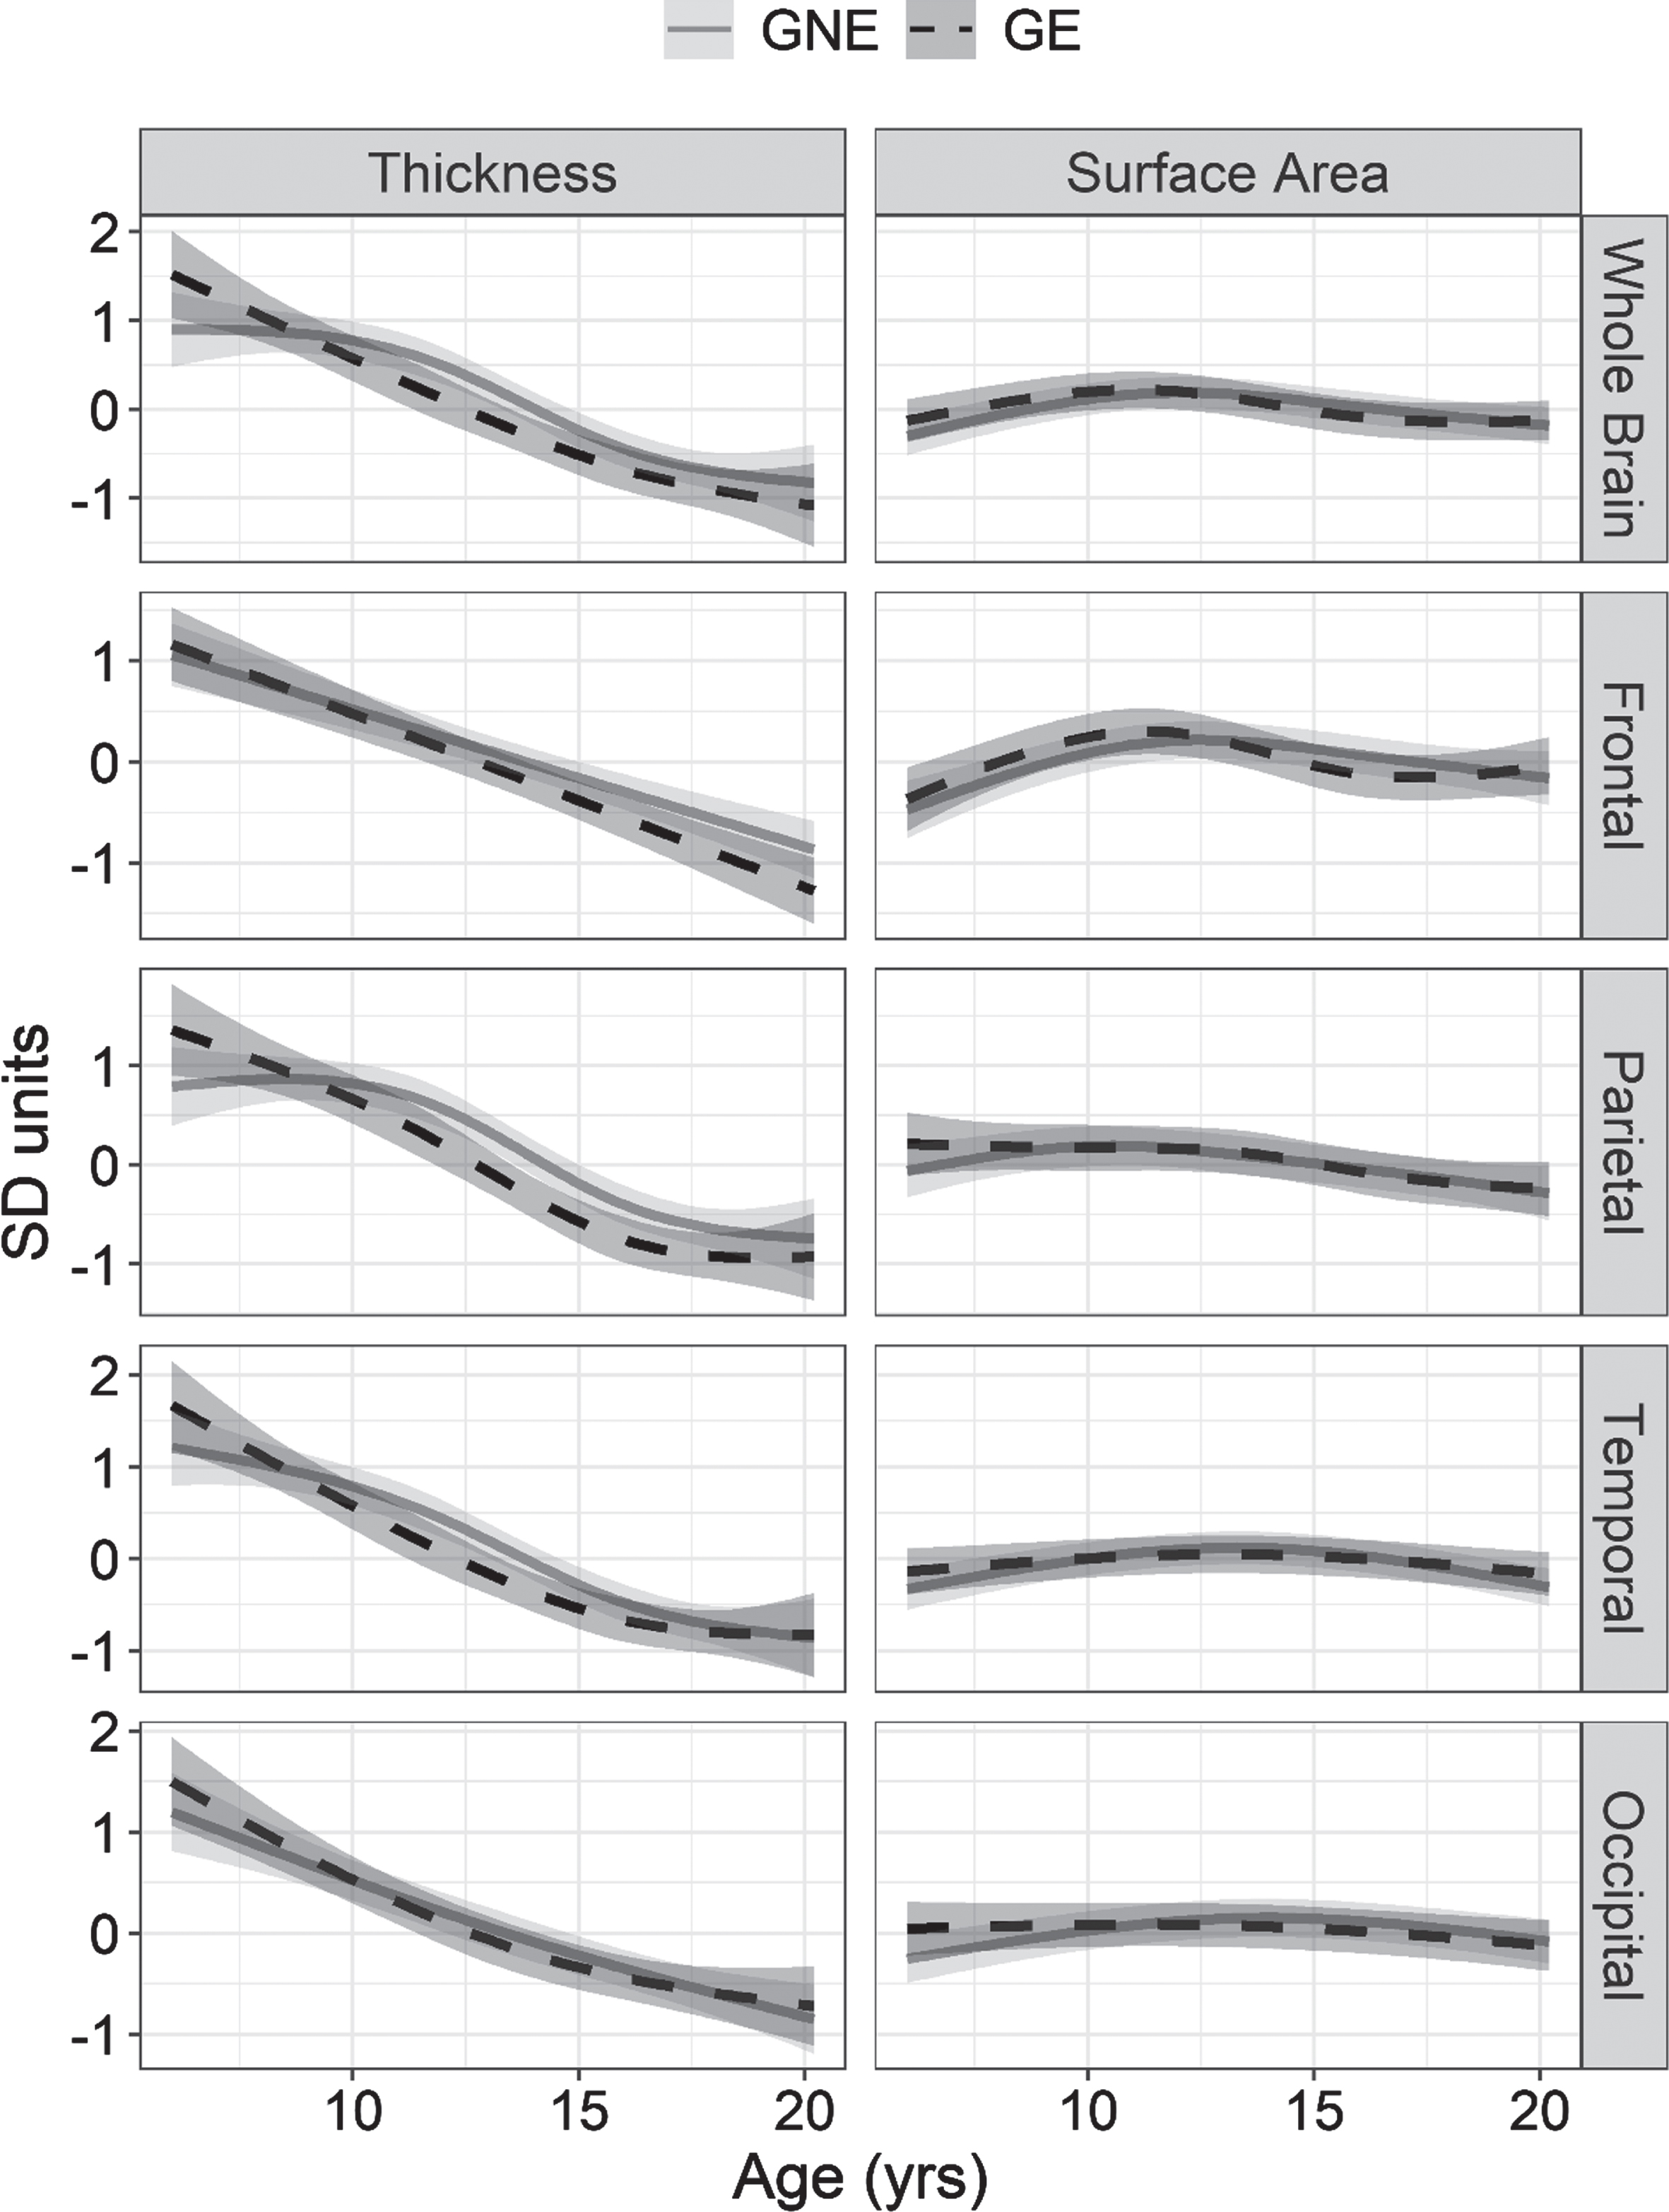
Developmental trajectory of cortical thickness and surface area by group. Mean estimated age-dependent change in cortical features in the gene non-expanded (GNE; grey) and gene-expanded (GE; black) groups. On the y-axis, cortical thickness (left) and surface area (right) are centered around sex-adjusted estimates from mixed effects models with natural cubic spline transformations of age.
Age-dependent effect of group on cortical morphology
GNE, Gene-Non-Expanded; GE, Gene-Expanded; dfn, degrees of freedom numerator; dfd, degrees of freedom denominator.
Similarly, we found no association between CAG repeat length overall and overall cortical thickness (F(1,69.5) = 0.917, FDR = 0.85) or surface area (F(1,79.3) = 4.35, FDR = 0.108) (Table 3).
Effect of expanded CAG repeat length on cortical morphology
dfn, degrees of freedom numerator; dfd, degrees of freedom denominator.
DISCUSSION
Morphological development of major cortical areas were compared in children and adolescents with and without mHTT. GE and GNE groups demonstrated no significant differences in age-dependent change of cortical thickness and surface area across all lobes of the brain. Dynamic changes in cortical thickness and relatively smaller global decrease in cortical surface area likely reflects normal synaptic pruning [17]. We also found no significant association between cortical morphology and CAG repeat length within individuals at-risk for adult-onset HD.
Numerous studies have demonstrated that mHTT affects early differentiation of neural progenitors in rodent models [7, 18], cortical cell cultures [19, 20], and human fetal tissue samples [7, 8]. The current predominating theory of corticogenesis—the radial unit lineage model—suggests that neuronal proliferation within each radial column determines cortical thickness [21]. Based on this model, it follows that the lower levels of proliferation observed in early cortical tissues carrying mHTT would lead to a thinner cortex in GE individuals. Despite this, we observed no effect of gene status on cortical development in the Kids-HD cohort. Our findings were consistent with recent assessment of brain development in juvenile zQ175 mice, where a pathological CAG expansion did not appear to significantly alter neocortical volume [22]. These findings alongside our own are not sufficient to refute the clear impact of mHTT on corticogenesis, as it is possible that current neuroimaging methods do not adequately capture cortical changes associated with mHTT. However, the lack of group difference in our sample suggests that early differences in cytoarchitecture may not translate into detectable differences in cortical morphology.
While mHTT does not seem to significantly impact cortex size, its effects may be detectable through changes in other measures, such as cortical connectivity, plasticity, and excitability. For example, GE subjects in this cohort display altered connectivity in striatal-cerebellar circuitry [23] and we have yet to explore how these changes relate to striatal-cortical connectivity. Based on findings from the Young Adult Study, altered functional connectivity of front-striatal circuits and associated with cognitive impairments are present up to two decades prior to motor onset [24]. Likewise, transmagnetic stimulation (TMS) studies demonstrate reduced cortical inhibition prior to motor onset [25, 26]. These findings demonstrate the sensitivity of resting-state functional MRI (rs-fMRI) and TMS [27] in detecting cortical changes prior to motor onset, however neither have been used to look at pediatric carriers. As such, it is not yet clear whether altered signaling is a consequence of early neurodegeneration, a direct result of mHTT-associated developmental abnormalities, or some combination of the two. Intracortical functional connectivity appears to increase as patients near motor onset, supporting a compensation model [28], yet R6/2 mice demonstrate altered excitatory/inhibitory balance early in development [9]. Considering the importance of the fronto-striatal pathways to executive functioning [29], it is crucial that future studies continue to characterize their structure and functioning in child and adolescent carriers of the mHTT mutation.
The present study is the first to evaluate cortical development in child and adolescent carriers of mHTT decades from disease onset. While previous analyses have shown differences in striatal development between GE and GNE, we did not observe differences in developmental trajectories of the cortex. Given the reported impact of mHTT on cortical neurogenesis, it is imperative that future studies bridge the gap between basic science and clinical findings.
Footnotes
ACKNOWLEDGMENTS
The Kids-HD study was funded by the National Institute of Neurological Disorders and Stroke (R01 NS055903) and the CHDI Foundation (071108). The MRI equipment used in this study was funded by National Institutes of Health (1S10OD025025-01). The funders had no role in study design, data collection, data analysis, interpretation or writing of the report.
D.R. Langbehn receives research funding from the National Institute of Neurological Disorders and Stroke, the CHDI Foundation, University College of London, and from the Wellcome Trust.
CONFLICT OF INTEREST
The authors report no other conflicts of interest relevant to this work.