
Abstract
Background:
Huntington’s disease (HD) is a genetic neurodegenerative disease caused by trinucleotide repeat CAG expansions in the human HTT gene. Early onset juvenile HD (JHD) in children is the most severe form of the disease caused by high CAG repeat numbers of the HTT gene.
Objective:
To gain understanding of human HD mechanisms hypothesized to involve dysregulated proteomes of brain regions that regulate motor and cognitive functions, this study analyzed the proteomes of human JHD cortex and putamen brain regions compared to age-matched controls.
Methods:
JHD and age-matched control brain tissues were assessed for CAG repeat numbers of HTT by PCR. Human brain JHD brain cortex regions of BA4 and BA6 with the putamen region (n = 5) were analyzed by global proteomics, compared to age-matched controls (n = 7). Protein interaction pathways were assessed by gene ontology (GO), STRING-db, and KEGG bioinformatics.
Results:
JHD brain tissues were heterozygous for one mutant HTT allele containing 60 to 120 CAG repeats, and one normal HTT allele with 10 to 19 CAG repeats. Proteomics data for JHD brain regions showed dysregulated mitochondrial energy pathways and changes in synaptic systems including peptide neurotransmitters. JHD compared to control proteomes of cortex and putamen displayed (a) proteins present only in JHD, (b) proteins absent in JHD, and (c) proteins that were downregulated or upregulated.
Conclusions:
Human JHD brain cortex and putamen regions display significant dysregulation of proteomes representing deficits in mitochondrial and synaptic neurotransmission functions. These findings advance understanding of JHD brain molecular mechanisms associated with HD disabilities.
Keywords
INTRODUCTION
Huntington’s disease (HD) results from expansion of CAG triplet repeats of the HTT gene which is inherited in an autosomal dominant manner. HD results in motor dysfunction and chorea, cognitive decline, brain neurodegeneration, and disabilities [1–4]. Juvenile Huntington’s disease (JHD) is the most severe form of HD caused by the high number of CAG expansions within HTT of 60 to 120 repeats and up to 200 CAG repeats which result in early childhood onset of HD [5, 6]. Adult-onset HD is most prevalent with HTT gene CAG expansions of about 40–53 repeats; the disease has reduced penetrance in the range of 36–39 repeats. In contrast, normal individuals have 5–35 CAG repeats in the HTT gene. HD deficits involve the brain cortex areas of BA4 and BA6 that participate in motor functions for planning and execution of complex movements [7, 8], and the putamen region within the striatum that participates in motor coordination and cognitive abilities [9, 10].
Elucidation of the molecular mechanisms of human HD is necessary for understanding dysregulated pathways that may be involved in HD disease deficits. JHD represents the most severe form of human HD [1, 6]. Therefore, the goal of this study was to investigate the hypothesized dysregulation of molecular and cellular pathways in human JHD brain, conducted by global proteomics analysis to advance understanding of molecular pathway disease mechanisms in the most severe form of HD. Of interest were findings showing dysregulated mitochondrial energy pathways in JHD brain and changes in synaptic processing including peptide neurotransmitters. Brain energy metabolism is essential for neurotransmission in cell-cell communication. These human HD brain mechanistic findings complement parallel studies in non-human HD animal models [11–16]. Importantly, insight gained into understanding molecular mechanisms of the severe JHD form of human HD can lead to future new drug targets and therapeutic strategies.
METHODS
Tissue samples from JHD and age-matched human brain cortex and putamen
Human JHD and age-matched control human brain tissues from the cortex (BA4 and BA6) and putamen regions were obtained from brain banks at the Harvard Brain Tissue Resource Center (HBTRC), the HDSA Center of Excellence at the University of Washington, the HDSA Center of Excellence at the University of Miami, and the HDSA Center for Excellence at the University of Pittsburgh. The BA4 and BA6 cortical and putamen tissue regions each consisted of five samples and aged-matched controls from each of these regions consisted of seven samples. Tissue samples were obtained from the brain banks according IRB protocols. A table of donor and tissue information is provided in Table 1.
HTT gene CAG repeat numbers determined for JHD and control samples
CAG repeat numbers of the HTT gene were determined by PCR and DNA sequencing as described in the experimental procedures. Information for tissue samples is shown for age, sex, and PMI with CAG repeat numbers determined for each of the two HTT gene alleles.
CAG repeat determination of the HTT gene by PCR and DNA sequencing
The number of CAG repeats within the HTT gene in JHD and control tissue samples were determined by PCR (polymerase chain reaction) amplification of the CAG region in exon 1, followed by DNA sequencing of amplicons. Genomic DNA extraction was conducted using the ArcturusTM PicoPureTM DNA extraction kit according to manufacturer’s instructions (Applied Biosystems, WalthLam, MA). Briefly, an approximately 3 mm2 brain cortex tissue piece was dissected on dry ice. The tissue was immediately placed in reconstitution buffer containing proteinase K and placed in a heating block at 65°C, and incubated for 24 h, followed by 10 min at 95°C to deactivate proteinase K. PCR amplification of a region of exon 1 flanking the CAG repeat region used forward primer 5’-ACCGCCATGGCGACCCTGGA-3’ and reverse primer 5’-AAACTCACGGTCGGTGCAGC-3’, with Taq PCR Core Kit (Qiagen, Valencia, CA). The final concentrations of reagents used in PCR reactions were 0.25μM of each primer, 200μM dNTPs, 1X Q Solution, 1X PCR Buffer, 0.05 U/μl Taq Polymerase, with 1.5μg genomic DNA. Reaction mixtures were subjected to an initial denaturation step of 95°C for 10 min, followed by 50 cycles of 95°C denaturation for 60 s, 62.5° C annealing for 60 s, and 72°C elongation for 120 s. Finally, one elongation step was carried out at 72°C for 5 min. PCR products were electrophoresed on a 1.8% agarose gel and visualized with GelRed® nucleic acid stain (Biotium, Fremont, CA). The predicted amplicon size for CAG repeats in the normal range of about 10 CAG to 35 CAG was approximately 265 to 325 base pairs. The HD range of repeats of > 40 CAG were predicted as PCR product bands of > 400 bp. HD and control PCR-generated DNA bands were excised from the gel and extracted using PureLinkTM Quick Gel Extraction Kit (Invitrogen, Waltham, MA) according to the manufacturer’s instructions. Sanger sequencing was conducted by GeneWiz (San Diego, CA) using forward primer 5’-GTTCTGCTTTTACCTGCGGC-3’ and reverser primer 5’-GCTCCCTCACTTGGGTCTTC-3’. Results of CAG repeat number determinations are show in Table 1. Replicate DNA sequencing of PCR fragments provided data indicating the same number of CAG repeats for each sample.
Homogenate preparation and trypsin digestion of brain tissues for proteomics
Tissue homogenates were prepared for proteomics by homogenization in lysis buffer consisting of 100 mM Tris-HCl, pH 7.4, 50 mM NaCl, and protease inhibitors consisting of 10μM pepstatin A, 10μM leupeptin, 10μM chymostatin, 10μM E64c, and 100μM AEBSF; this lysis buffer is hypotonic and, thus, lyses cells. Tissue homogenates were then sonicated (2 times for 10 s on ice) to maximize lysis of the tissue homogenate. The protein concentrations of homogenates were then measured by the Bio-Rad protein assay kit (BioRad, Hercules, CA). Homogenate samples (200μg protein for each sample) was subjected to trypsin digestion as we have reported [17, 18]. Sample proteins were precipitated in 90% methanol on ice for 15 min, and centrifuged at 14,000 × g for 15 min at 4°C. The protein pellets were dried in a speed-vac for 3 min at room temperature. Samples were then resuspended in 200μl of sodium deoxycholate (SDC) buffer (1% SDC, 100 mM tris, pH 8, 40 mM 2-chloroacetaminde (CAA), and 10 mM tris(2-carboxyethyl)phosphine (TCEP) and incubated at 95°C for 10 min and then at room temperature for 5 min. Samples were diluted with addition of 200μl of 100 mM Tris, pH 8.0, and sonicated for 2 min. Trypsin/LysC (Promega, Madison, WI) was added to each sample to obtain a 1 : 50 enzyme:protein ratio and incubated at 37°C overnight. Trypsin/LysC digestion was quenched by adding trifluoroacetic acid (TFA) to approximately 0.3% to achieve pH < 3. Next, tryptic peptides were extracted and desalted by solid-phase extraction (SPE) by binding peptides to Empore C18 membranes (3M, Maplewood, MN). Peptides were bound to membranes by centrifugation, equilibrated and washed with 0.1% TFA. Peptides were eluted with 70% and 50% acetonitrile (ACN) containing 0.1% TFA and dried in a speed vac. Peptide concentration was determined using Pierce total peptide assay kit (ThermoFisher). For MS analysis, samples were resuspended in 2% ACN, 0.1% TFA at a concentration of 0.5μg/μl. Two μg were used per injection for nano LC-MS/MS. Three technical replicates were analyzed for each tissue sample.
Nano-LC-MS/MS tandem mass spectrometry
Nano-LC-MS/MS utilized a Dionex UltiMate 3000 nano-LC, and tandem mass spectrometry on an Orbitrap Q-Exactive (both from ThermoFisher), conducted as we have reported [17, 18]. Samples were injected at a randomized order at a rate of 300 nl/minute on a linear gradient of 5% to 25% acetonitrile/0.1% TFA for 80 min, followed by a linear gradient of 85% to 90% ACN/0.1% TFA for 20 min. The column length was 25 cm and packing material composed of C18 ethylene bridged hybrid (BEH) at 1.7μm diameter and heated to 65°C. Full data-dependent MS1 were acquired in positive ion mode, at a resolution of 70,000, AGC target of 3 × 10⁶, maximum inject time of 100 ms and scan range of 310 to 1250 m/z. MS1 microscans were acquired for scan range of 310 to 1200 m/z at resolution of 70,000 at 200 m/z, injection time of 100 ms. Data-dependent MS2 was acquired in centroid mode, at a 1.5 m/z isolation window, scan range of 200 to 2000 m/z, first fixed mass 150 m/z, resolution of 17,500, maximum inject time of 50 ms, automatic gain 1 × 10⁵, intensity threshold of 4 × 10³, and HCD cell normalized collision energy of 27 V.
Protein identification and quantification by nano-LC-MS/MS
MS1 and MS2 spectra were analyzed by the PEAKS (v. 8.5) software for protein identification with database-de Novo bioinformatics, post-translational modifications, and label-free quantitation (LFQ) using the decoy-fusion method, conducted as we have reported [17, 18]. Spectra were queried against the UniprotKB/SwissProt human protein database, which contains 71,783 entries (version update February 2, 2018). The PTMs searched were carbamidomethylation on Cys, oxidation of Met, and N-terminal acetylation, phosphorylation at Ser, Thr, Tyr, for a maximum of 3 PTMs searched per precursor. The PTM local confidence Ascore requirement was ≥ 13, which approximates p < 0.02. Monoisotopic precursor mass error tolerance was 20 ppm with fragment mass error tolerance of 0.01 Da. Maximum trypsin missed cleavages allowed was 2, with no non-specific cleavages. Identification parameters resulted in a false discovery rate (FDR) of 0.9% : peptide identification of –log10(P) ≥ 22 and protein identification of –log10(P) ≥ 20, and ≥ 2 unique peptides per protein. A protein was considered identified when present in at least two out of three technical replicates for each sample. A protein was assigned as being present in the JHD group if it was present in at least three out of five biological samples in that group. A protein was assigned to the control group if it was present in at least four out of seven biological samples.
Proteins were quantified by label-free quantitation (LFQ), determined by PEAKS v 8.5, conducted as we have reported [17, 18]. MS2 peaks were converted to area under the curve (AUC). For each quantifiable protein group, and all MS2 peak AUCs for the corresponding peptides were summed. The quality parameters for LFQ utilized peptide quality > 0.3 and abundance of 1 × 10⁴. The allowed retention time window for matching MS2 isotope peak patterns of replicate samples was 3 min, and modifications were excluded for LFQ. Replicate normalization of LFQ intensity distributions used the LOESS-G method determined by Normalyzer (web application) [17]. Analytical replicate reliability was determined by –log10(P), where quality assessment of technical replicates was assessed as 1/log(σ) (σ is technical variance). Protein groups with LFQ value of 0 intensity were imputed with a random value within the lowest 5% of intensity distributions and within a standard deviation of 1. Protein isoforms were manually inspected to assure that the same LFQ values were assigned to different isoforms of a protein group. To determine whether quantifiable proteins were significantly different between JHD and control, multiple testing was conducted using the Benjamini-Hochberg post-hoc method [18] that assesses the FDR (false-discovery rate) of false-positives at q values of < 0.05 for significance. Protein quantities were considered significantly different between JHD and control groups at q < 0.05. These comparisons were also analyzed by volcano plots of log2(JHD/control) and q value analysis.
Bioinformatics analysis by gene ontology (GO) and STRING network analyses of proteomics data
Proteome components were assessed as those present in only the JHD or control groups, and shared proteins that were upregulated or downregulated. Proteome components were assessed by gene ontology (GO) for molecular and cellular processes, combined with protein interaction network analyses using STRING-db (http://www.string-db.org) [19, 20]. Databases of known protein interactions (DIP, BioGRID, HPR, IntAct, MINT, PDB and others) were accessed by STRING. Protein-protein interactions (PPI) were considered significant if an interaction probability identified in the queried databases was more likely than in a random group of the same number of proteins at a high confidence probability of 0.7 GO enrichment was significant if FDR < 1%, determined by Benjamini-Hochberg hypergeometric probability testing procedures that determine the statistical probability of proteins being present in a GO term compared to the total genes in the GO pathway [21, 22].
For functional assessment of proteins, enrichment of proteins within JHD or control subgroups for GO biological functions was assessed using the STRING resource (http://www.string-db.org). Specific GO functions, each indicated by a GO ID number, are defined by STRING by a selected list of protein names of a defined number of proteins. Enrichment within an experimental group for a GO ID is calculated by STRING as the ratio between i) the number of proteins in our experimental group present within the list of designated proteins for a specific GO ID function, and ii) the number of proteins predicted in a random group of human proteins of the same size for that GO ID. The FDR is calculated for these comparisons.
Proteins shared by JHD and control groups were assessed for upregulation and downregulation by comparing ratios of log2(JHD/control) quantitation values that were assessed for statistically significance by Benjamini-Hochberg analysis at q < 0.05. Heat maps of log2(JHD/control) data were generated by Euclidean hierarchical clustering using R studio.
RESULTS
Scheme for analysis of mutant HTT gene and proteomes of human JHD and age-matched control brain cortex (BA4 and BA6 regions) and putamen regions
The project scheme of this study (Fig. 1) assessed the hypothesis that the proteomes of human JHD brain cortex and putamen regions are dysregulated compared to age-matched controls. The cortex BA4 and BA6 regions are associated with motor dysfunctions of HD [7, 8], and the putamen participates in motor and cognitive abnormalities of HD [9, 10]. Human JHD brain tissues from individuals of ages 12 to 26 years of age, and age-matched control brain tissues from individuals of 10 of 25 years of age, from cortex (BA4 and BA6 areas) and putamen brain regions were studied (Table 1). CAG repeat numbers of the HTT gene were determined by PCR and DNA sequencing of tissue samples from each brain. Brain regions of cortex (BA4 and BA6) and putamen were subjected to proteomics analysis by nano-LC-MS/MS tandem mass spectrometry for protein identification and label-free quantification (LFQ) using PEAKS bioinformatics as described in the methods. Comparison of JHD and control proteomes demonstrated proteins present only the JHD group, present in only the control group, and proteins present in both JHD and control groups that were upregulated and downregulated. Bioinformatics of proteomics data assessed molecular pathways using gene ontology (GO), STRING-db, and KEGG protein interaction pathway analysis.
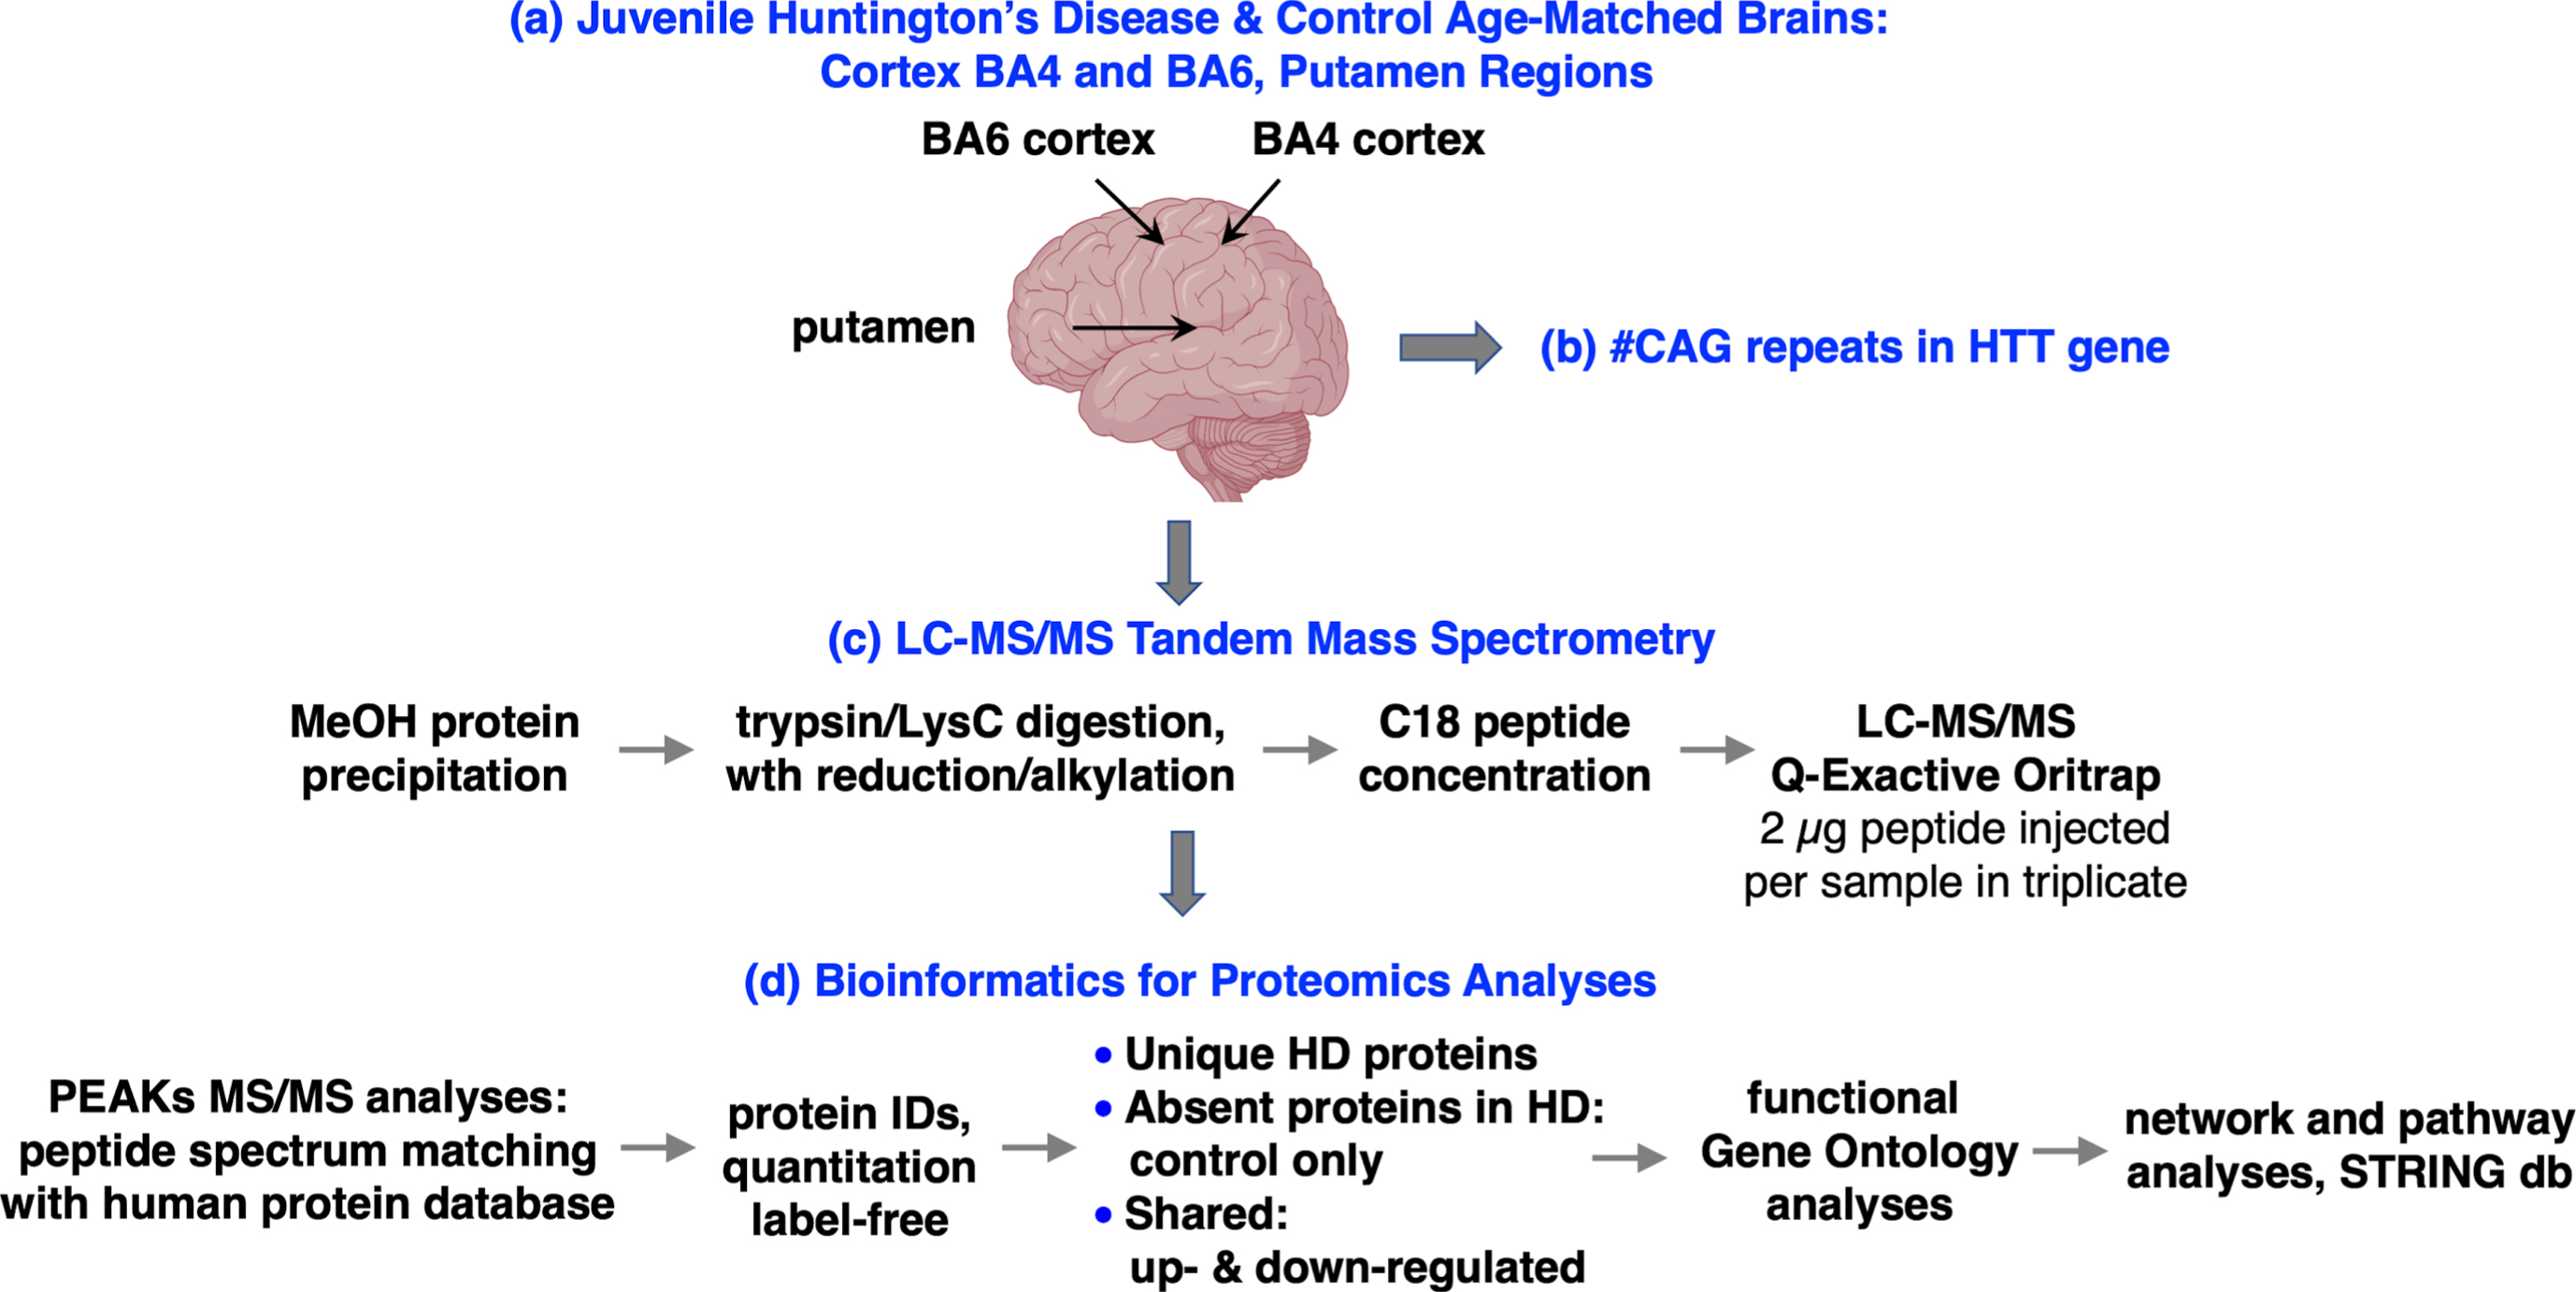
Workflow for human juvenile Huntington’s disease (JHD) brain cortex and putamen analysis of the hypothesis for dysregulated proteome systems. Human brain tissue samples were obtained from cortex areas BA4 and BA6 combined with the putamen region from JHD and age-matched control brains. The number of HTT CAG repeats in each sample was determined by PCR and DNA sequencing. Brain tissue homogenates were subjected to proteomics analysis by nano-LC-MS/MS tandem mass spectrometry of tryptic digests combined with bioinformatics assessments of proteome components by PEAKS for identification and quantification of proteins. Proteins uniquely present in only JHD or control samples, or shared between the groups with downregulation or upregulation, were evaluated for functional processes by gene ontology (GO) combined with protein interaction networks by STRING-db and KEGG pathway analyses.
Determination of CAG repeat numbers of the HTT gene of human JHD and age-matched control brain tissues
JHD and age-matched control brain tissues were subjected to PCR and DNA sequencing analysis of genomic DNA. PCR amplified the CAG repeat region in exon 1 of the HTT gene and DNA sequencing determined the CAG repeat numbers of the two HTT gene alleles. JHD brain tissue samples displayed expanded CAG repeats of 62 to 120 repeats (Table 1). The JHD tissues each had one HTT allele having the pathological expanded range of CAG repeats of 62 to 120 repeats, and a normal allele having CAG repeats of 12 to 19. In control brain tissues, both HTT gene alleles had 11 to 21 CAG repeats (Table 1). These data are consistent with characterization of JHD subjects having more than 60 CAG repeats of the HTT gene inherited in an autosomal dominant manner [1–4].
Proteomics of cortex regions, BA4 and BA6, from JHD brains display distinct and shared proteins compared to age-matched controls
Proteomics data of JHD and age-matched controls from cortex BA4 and BA6 regions were compared for distinct and shared proteins combined with principal component analysis (PCA) (Fig. 2).
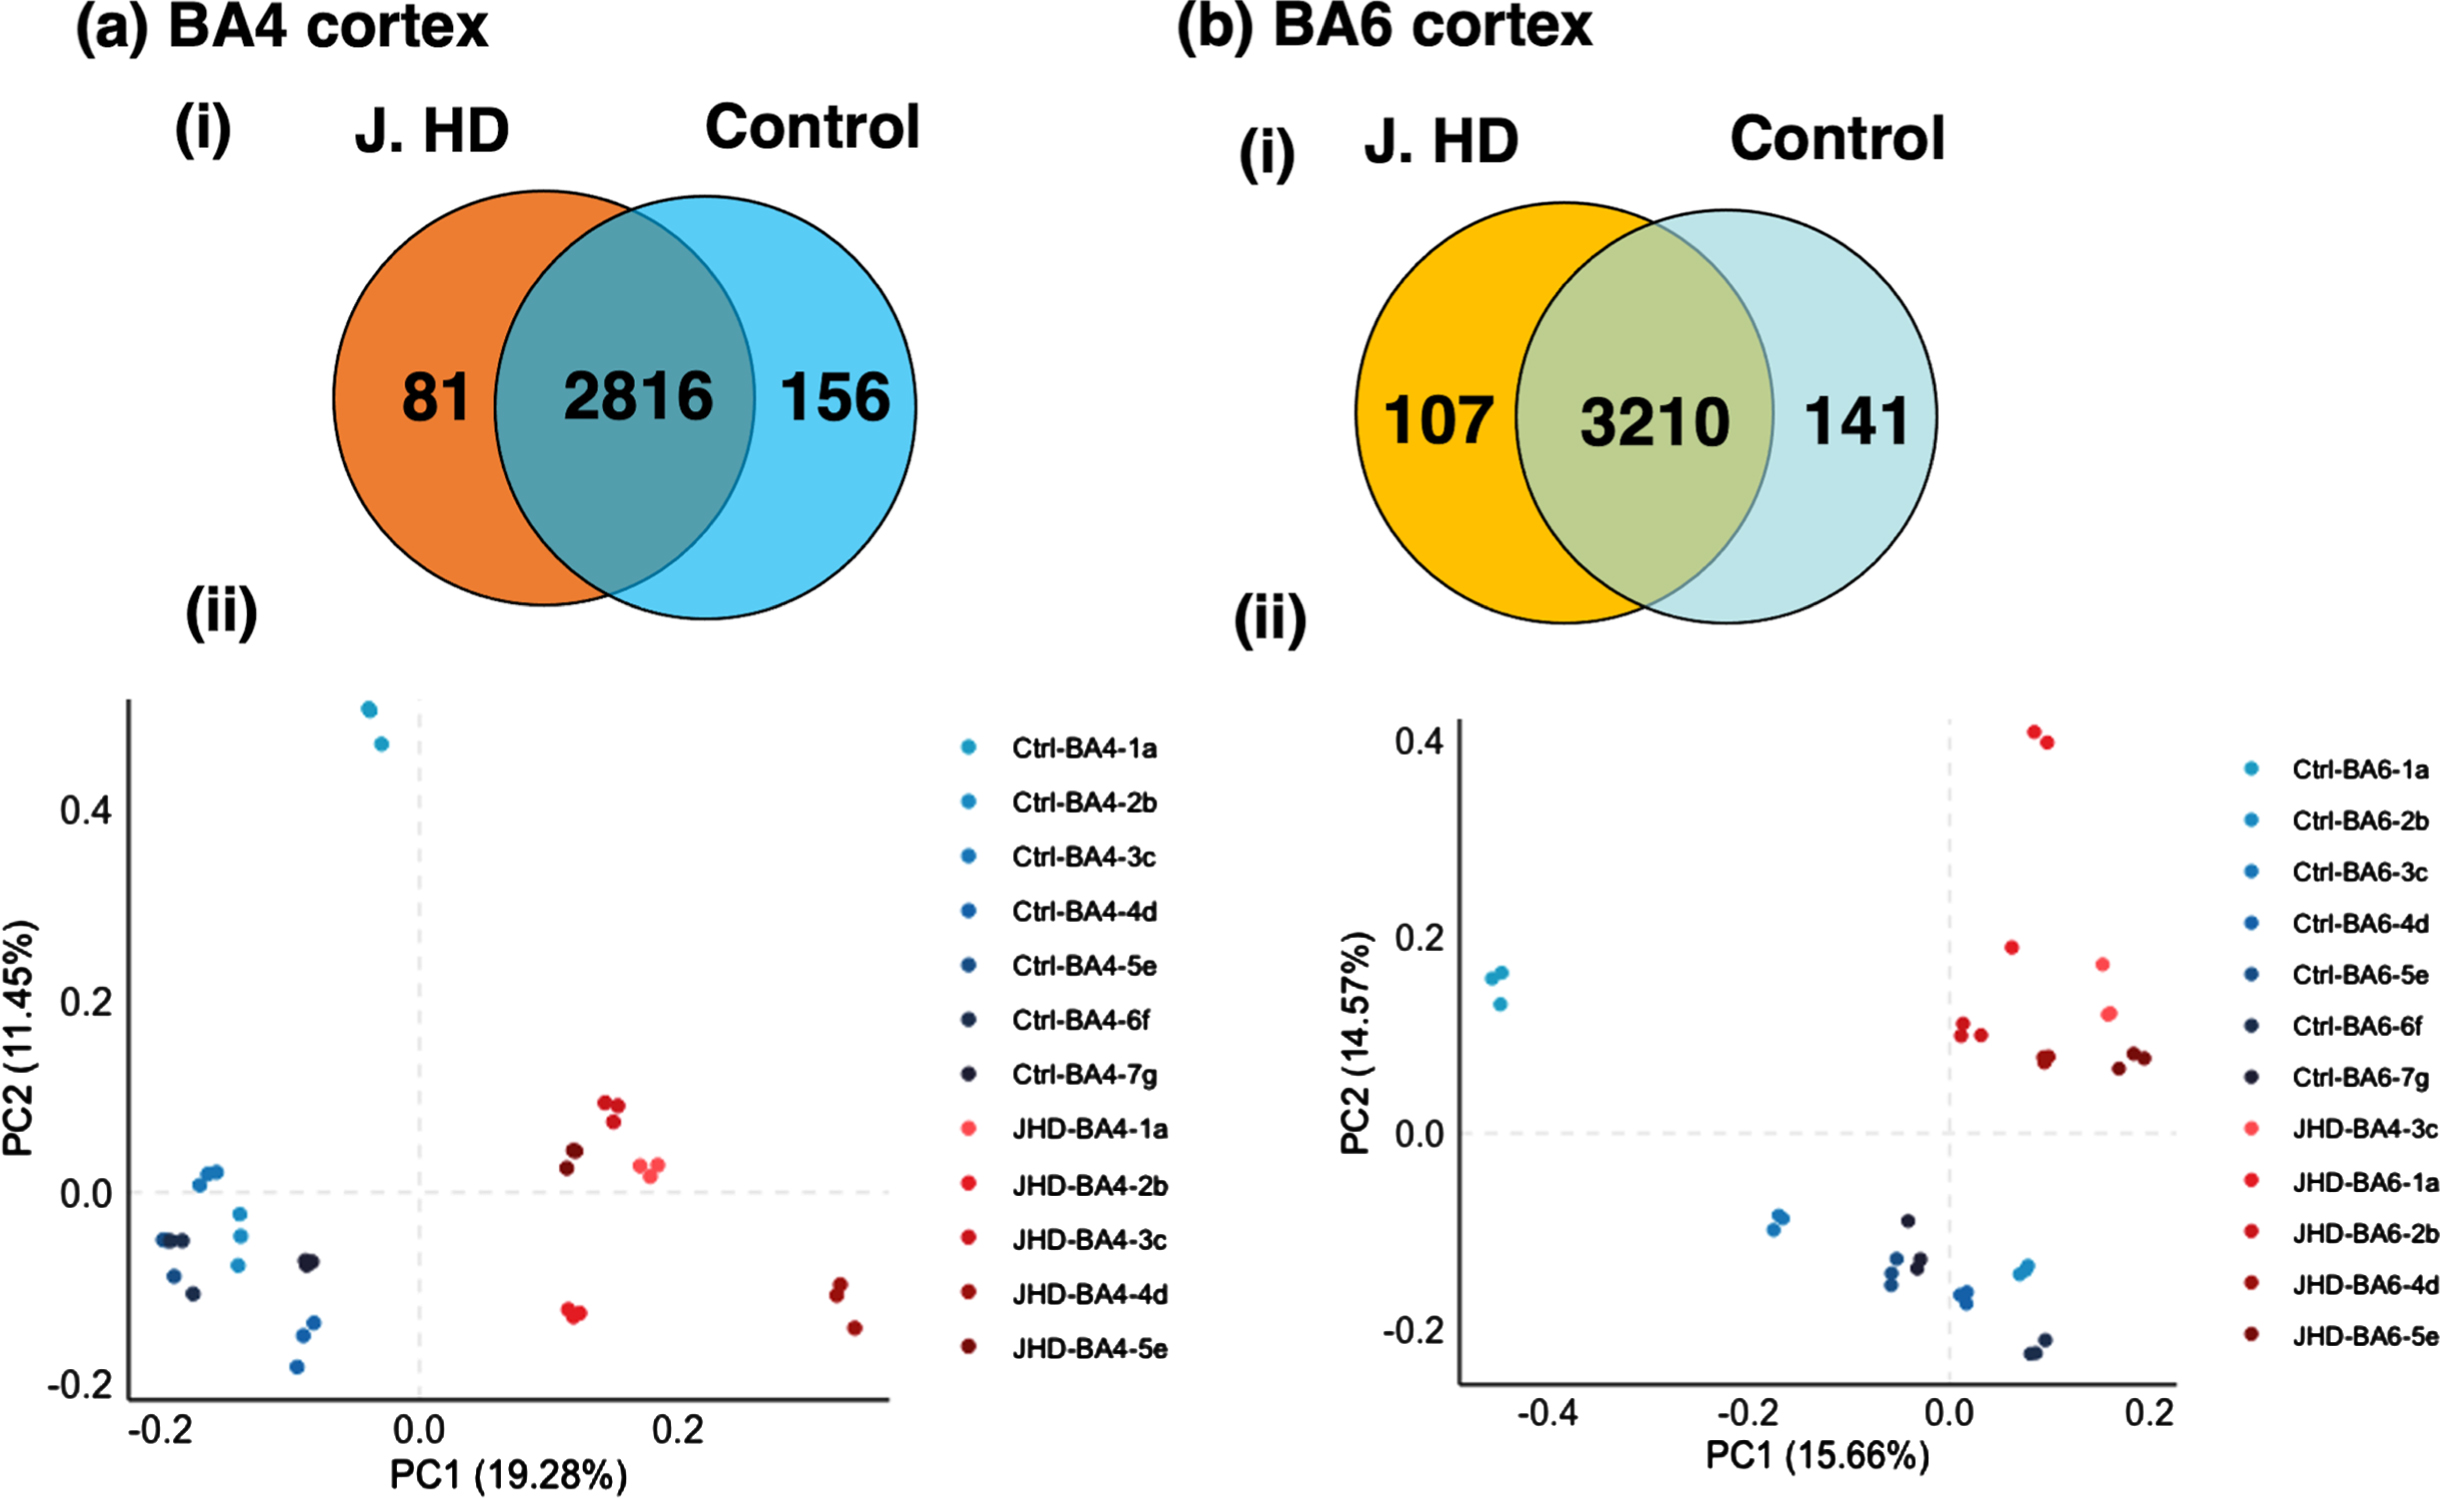
Human brain cortex BA4 and BA6 regions display distinct and shared proteome components in JHD compared to age-matched control groups. (a) BA4 cortex: protein identification counts and principal component analysis. Distinct and shared proteins in the JHD and control groups of the BA4 cortex region were compared (panel i). Principal component analysis assessed the segregation of proteome components in JHD compared to control (panel ii). (b) BA6 cortex: protein identification counts and principal component analysis. Distinct and shared proteins in the JHD and control groups of the BA6 cortex regions were compared (panel i). Principal component analysis assessed the segregation of proteome components in JHD compared to control (panel ii).
In the BA4 region, 2,897 unique proteins were identified in the JHD group and 2,972 proteins were identified in the control group (Fig. 2a.i), for a total of 3,053 proteins identified in all BA4 tissue samples. The JHD group contained 81 proteins present only in JHD (not in control), and the control group contained 156 proteins only in control (not in JHD). BA4 proteins numbering 2,816 were shared by both JHD and control groups. PCA illustrated segregation of JHD and control proteins (Fig. 2a.ii). PCA determined that 19.28% of variability was determined by principal component 1 (PC1) with JHD samples in the positive cluster and control samples in the negative cluster; and 11.45% of variability was attributable to PC2.
In the BA6 region, 3,317 proteins were identified in the JDH group and 3,351 proteins were identified in the control group (Fig. 2b.i), for a total of 3,458 proteins identified in all BA6 samples. The JHD group contained 107 proteins present only in JHD (not in control), and the control group had 141 proteins present in only control (not in JHD). Shared proteins numbered 3,210 that were present in both JHD and control groups. The proteome components were also assessed by label-free quantification (Supplementary Figure 1). PCA illustrated segregation of BA6 JHD and control proteins (Fig. 2b.ii). PCA showed that PC1 contributed to 15.66% of variability while PC2 contributed 14.57% of variability.
Proteins present in only JHD brain BA4 and BA6 cortex regions (not in controls)
Molecular analyses of proteins present in the JHD group (not in the control group) of cortex regions were assessed by STRING-db and GO (gene ontology) molecular networking (Fig. 3). In the BA4 region, STRING-db analysis of protein networks identified interactions among LSM3 (LSM3 homolog, U6 small nuclear RNA and mRNA degradation associated), SRRM1 (serine and arginine repetitive matrix 1), and SF3A1 (splicing factor 3a subunit 1) proteins (Fig. 3a) that are involved in pre-RNA splicing functions (Supplementary Table 1). In the cortex BA6 region, gene ontology (GO) and STRING-db analysis identified ‘cytoplasm’ as a significant biological process (Fig. 3b) of proteins involved in pre-mRNA splicing and immune functions (Supplementary Table 1).
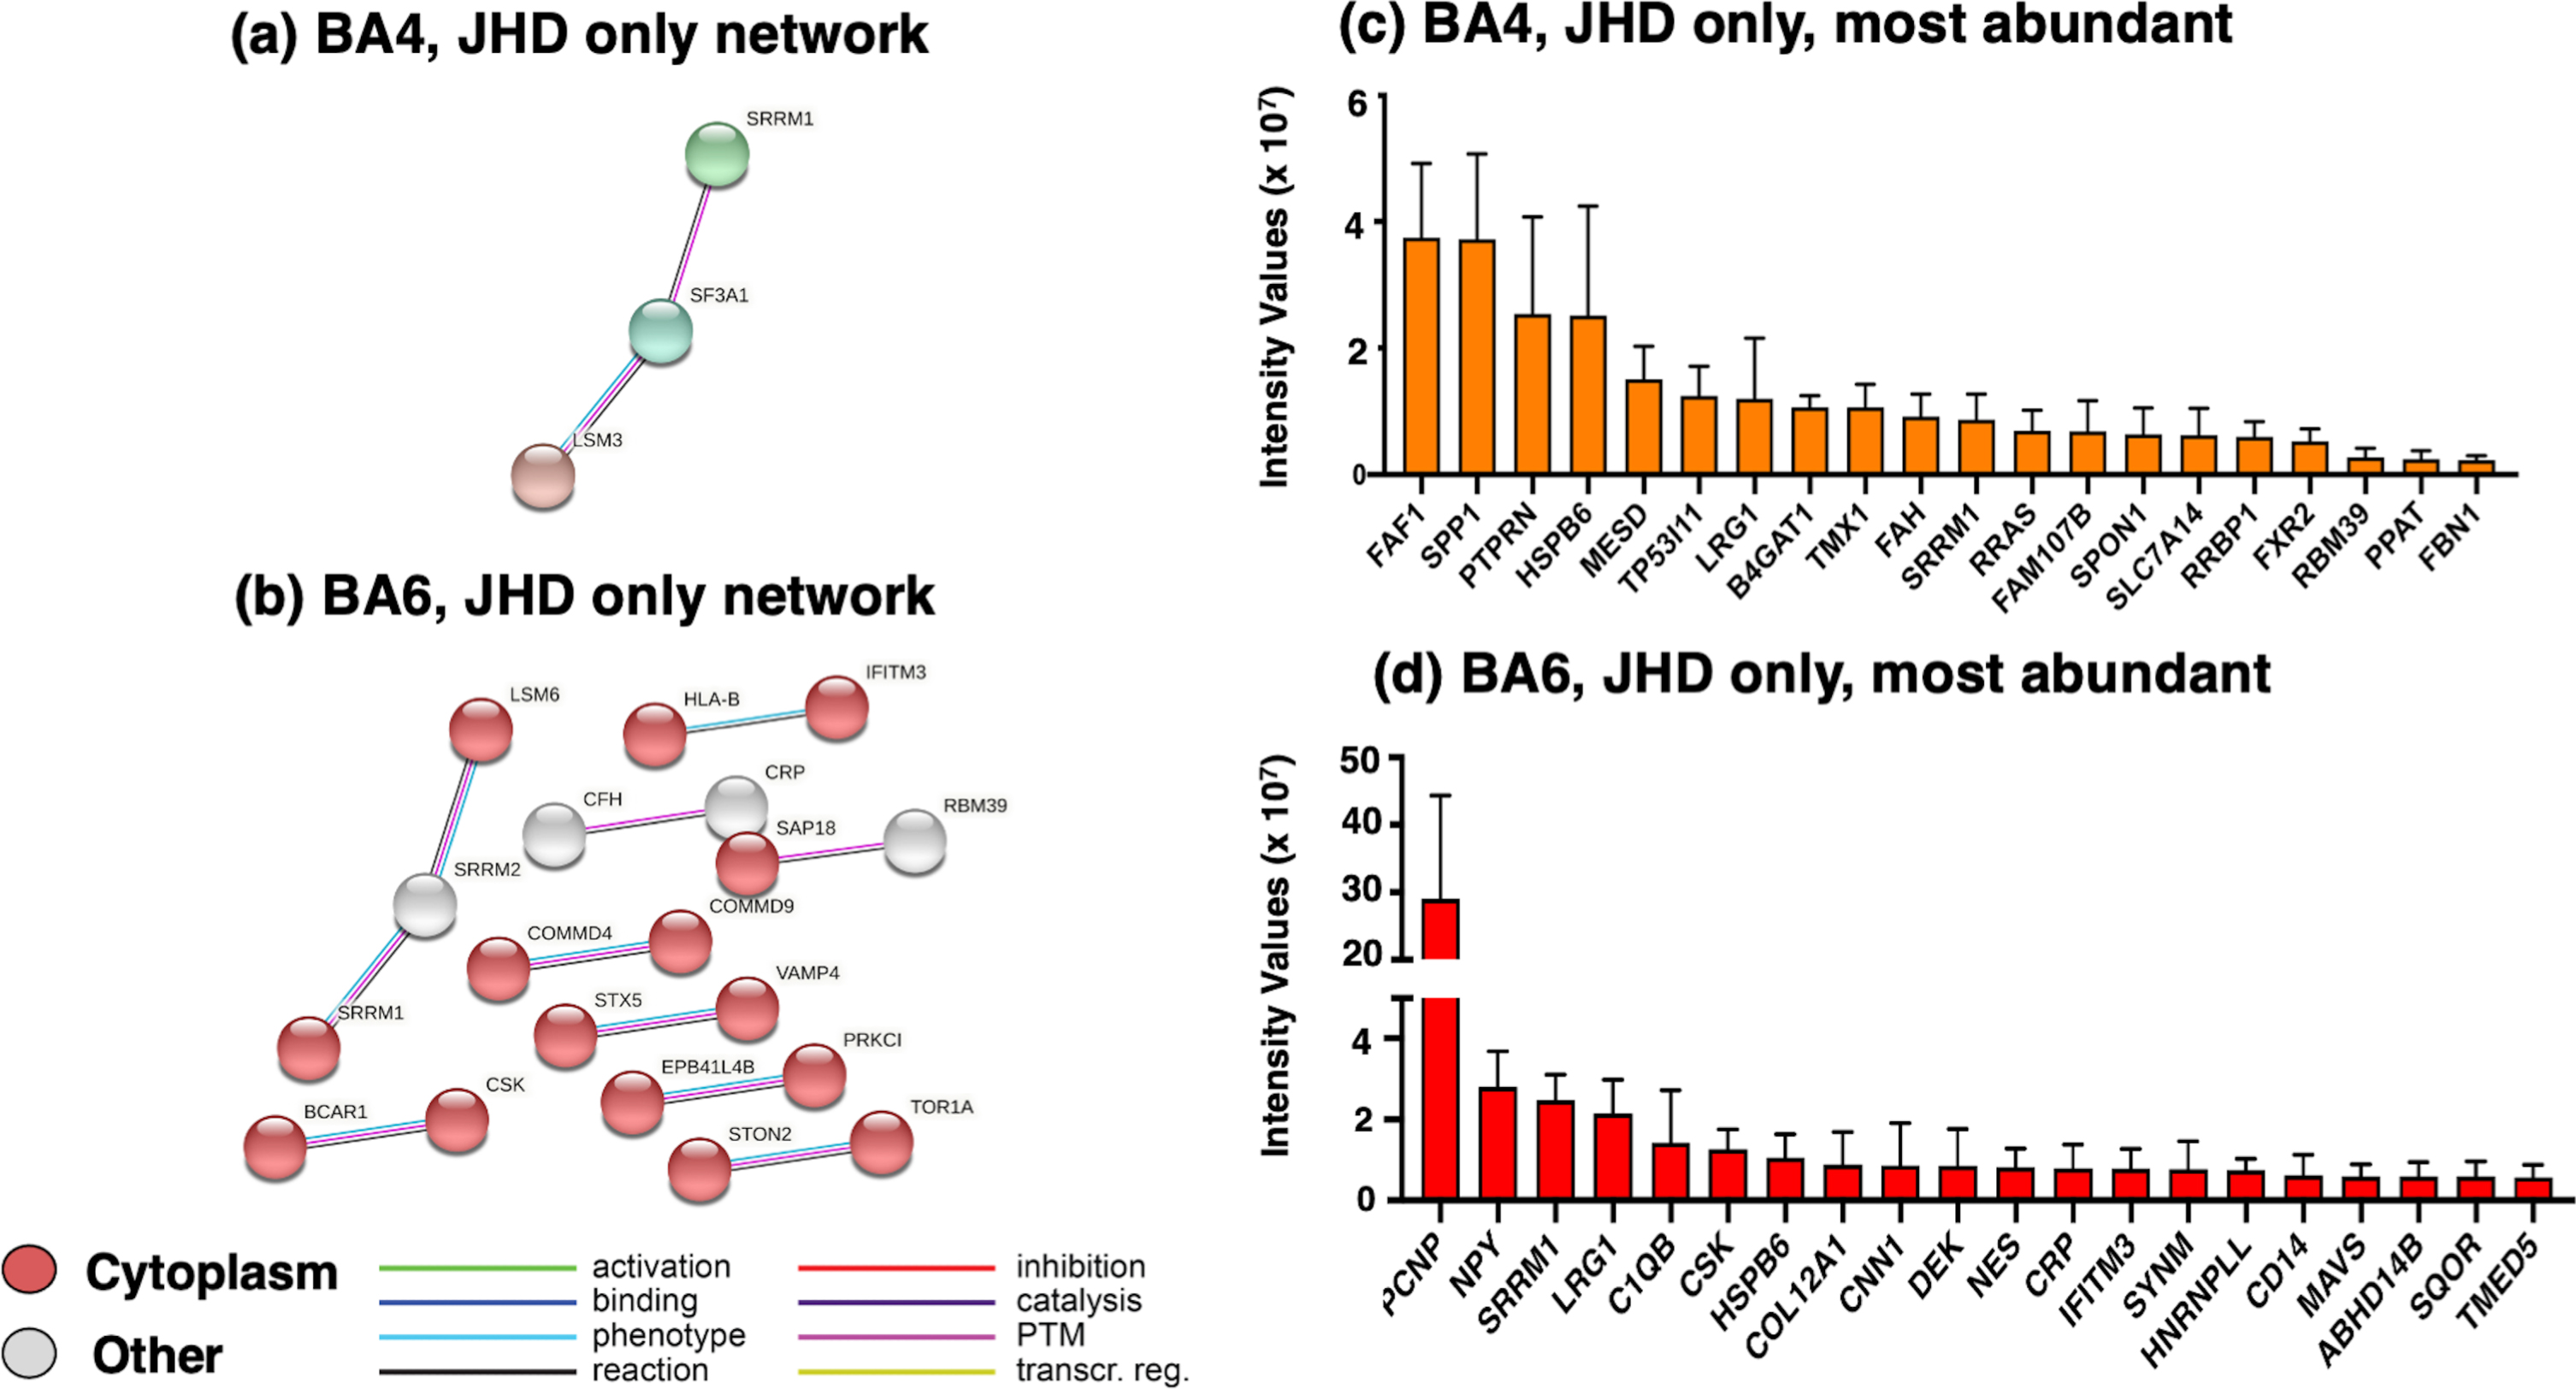
Proteome components present in only JHD (not controls) in cortex BA4 and BA6 regions. (a) Protein network analysis of BA4 cortex proteins present in only JHD. The group of proteins present in only JHD (not control) of the BA4 cortex region were assessed by STRING-db for significant protein interaction networks as illustrated. (b) Protein network analysis of BA6 cortex proteins present in only JHD. Protein components present in only JHD (not control of the BA6 cortex region were evaluated by STRING-db for significant protein interaction networks, illustrated here. (c) Abundance of proteins present in only JHD in BA4 cortex. The relative abundance of proteins present in only JHD of BA4 cortex are illustrated. (d) Abundance of proteins present in only JHD in BA6 cortex. The relative abundances of proteins present in only JHD of BA6 cortex are illustrated.
The most abundant proteins found only in the JHD group of the BA4 cortex region consisted of FAF1 (fas associated factor 1), SPP1 (secreted phosphoprotein 1), PTPRN (protein tyrosine phosphatase receptor type N), and HSPB6 (heat shock protein family B (small) member 6) (Fig. 3c and Supplementary Table 2). FAF1 is involved in ubiquitin binding and DNA replication, SPP1 functions as a matrix associated protein, PTPRN is present in secretory vesicles, and HSPB6 functions as a chaperone (Supplementary Table 2). In the BA6 region, the most abundant proteins identified (Fig. 3d) were PCNP (PEST proteolytic signal containing nuclear protein) involved in cell-cycle regulation, neuropeptide (NPY) transmitter, and SRRM1 (serine and arginine repetitive matrix 1) involved in pre-mRNA processing (Supplementary Table 2). Overall, proteins found in only the JHD group in BA4 and BA6 cortex regions were associated with mRNA splicing, inflammatory response, cell-cycle regulation, and related.
Proteins present in only control cortex BA4 and BA6 regions (not present in JHD)
Proteins identified in only the control BA4 and BA6 cortex proteomes (not present in JHD) were found to represent biological pathways of mitochondrial gene expression, translation, and protein and peptide metabolism (Table 2). Protein interaction analysis (by STRING-db) indicated pathways of mitochondrial gene expression and matrix combined with ribosomal systems in the cortex BA4 region (Fig. 4a), and pathways of mitochondrial translation, cytoplasm, and ribosomal systems in the cortex BA6 region (Fig. 4b).
BA4 and BA6 Cortex, Control Only Proteins, GO Functions
BA4 and BA6 cortical brain proteome components identified in only the control groups were subjected to gene ontology (GO) analysis to assess biological and cellular functions. The protein count indicates the number of proteins in BA4 or BA6 compared to the total number proteins in the designated GO category. Significance is considered with FDR (false discovery rate) of < 0.05.
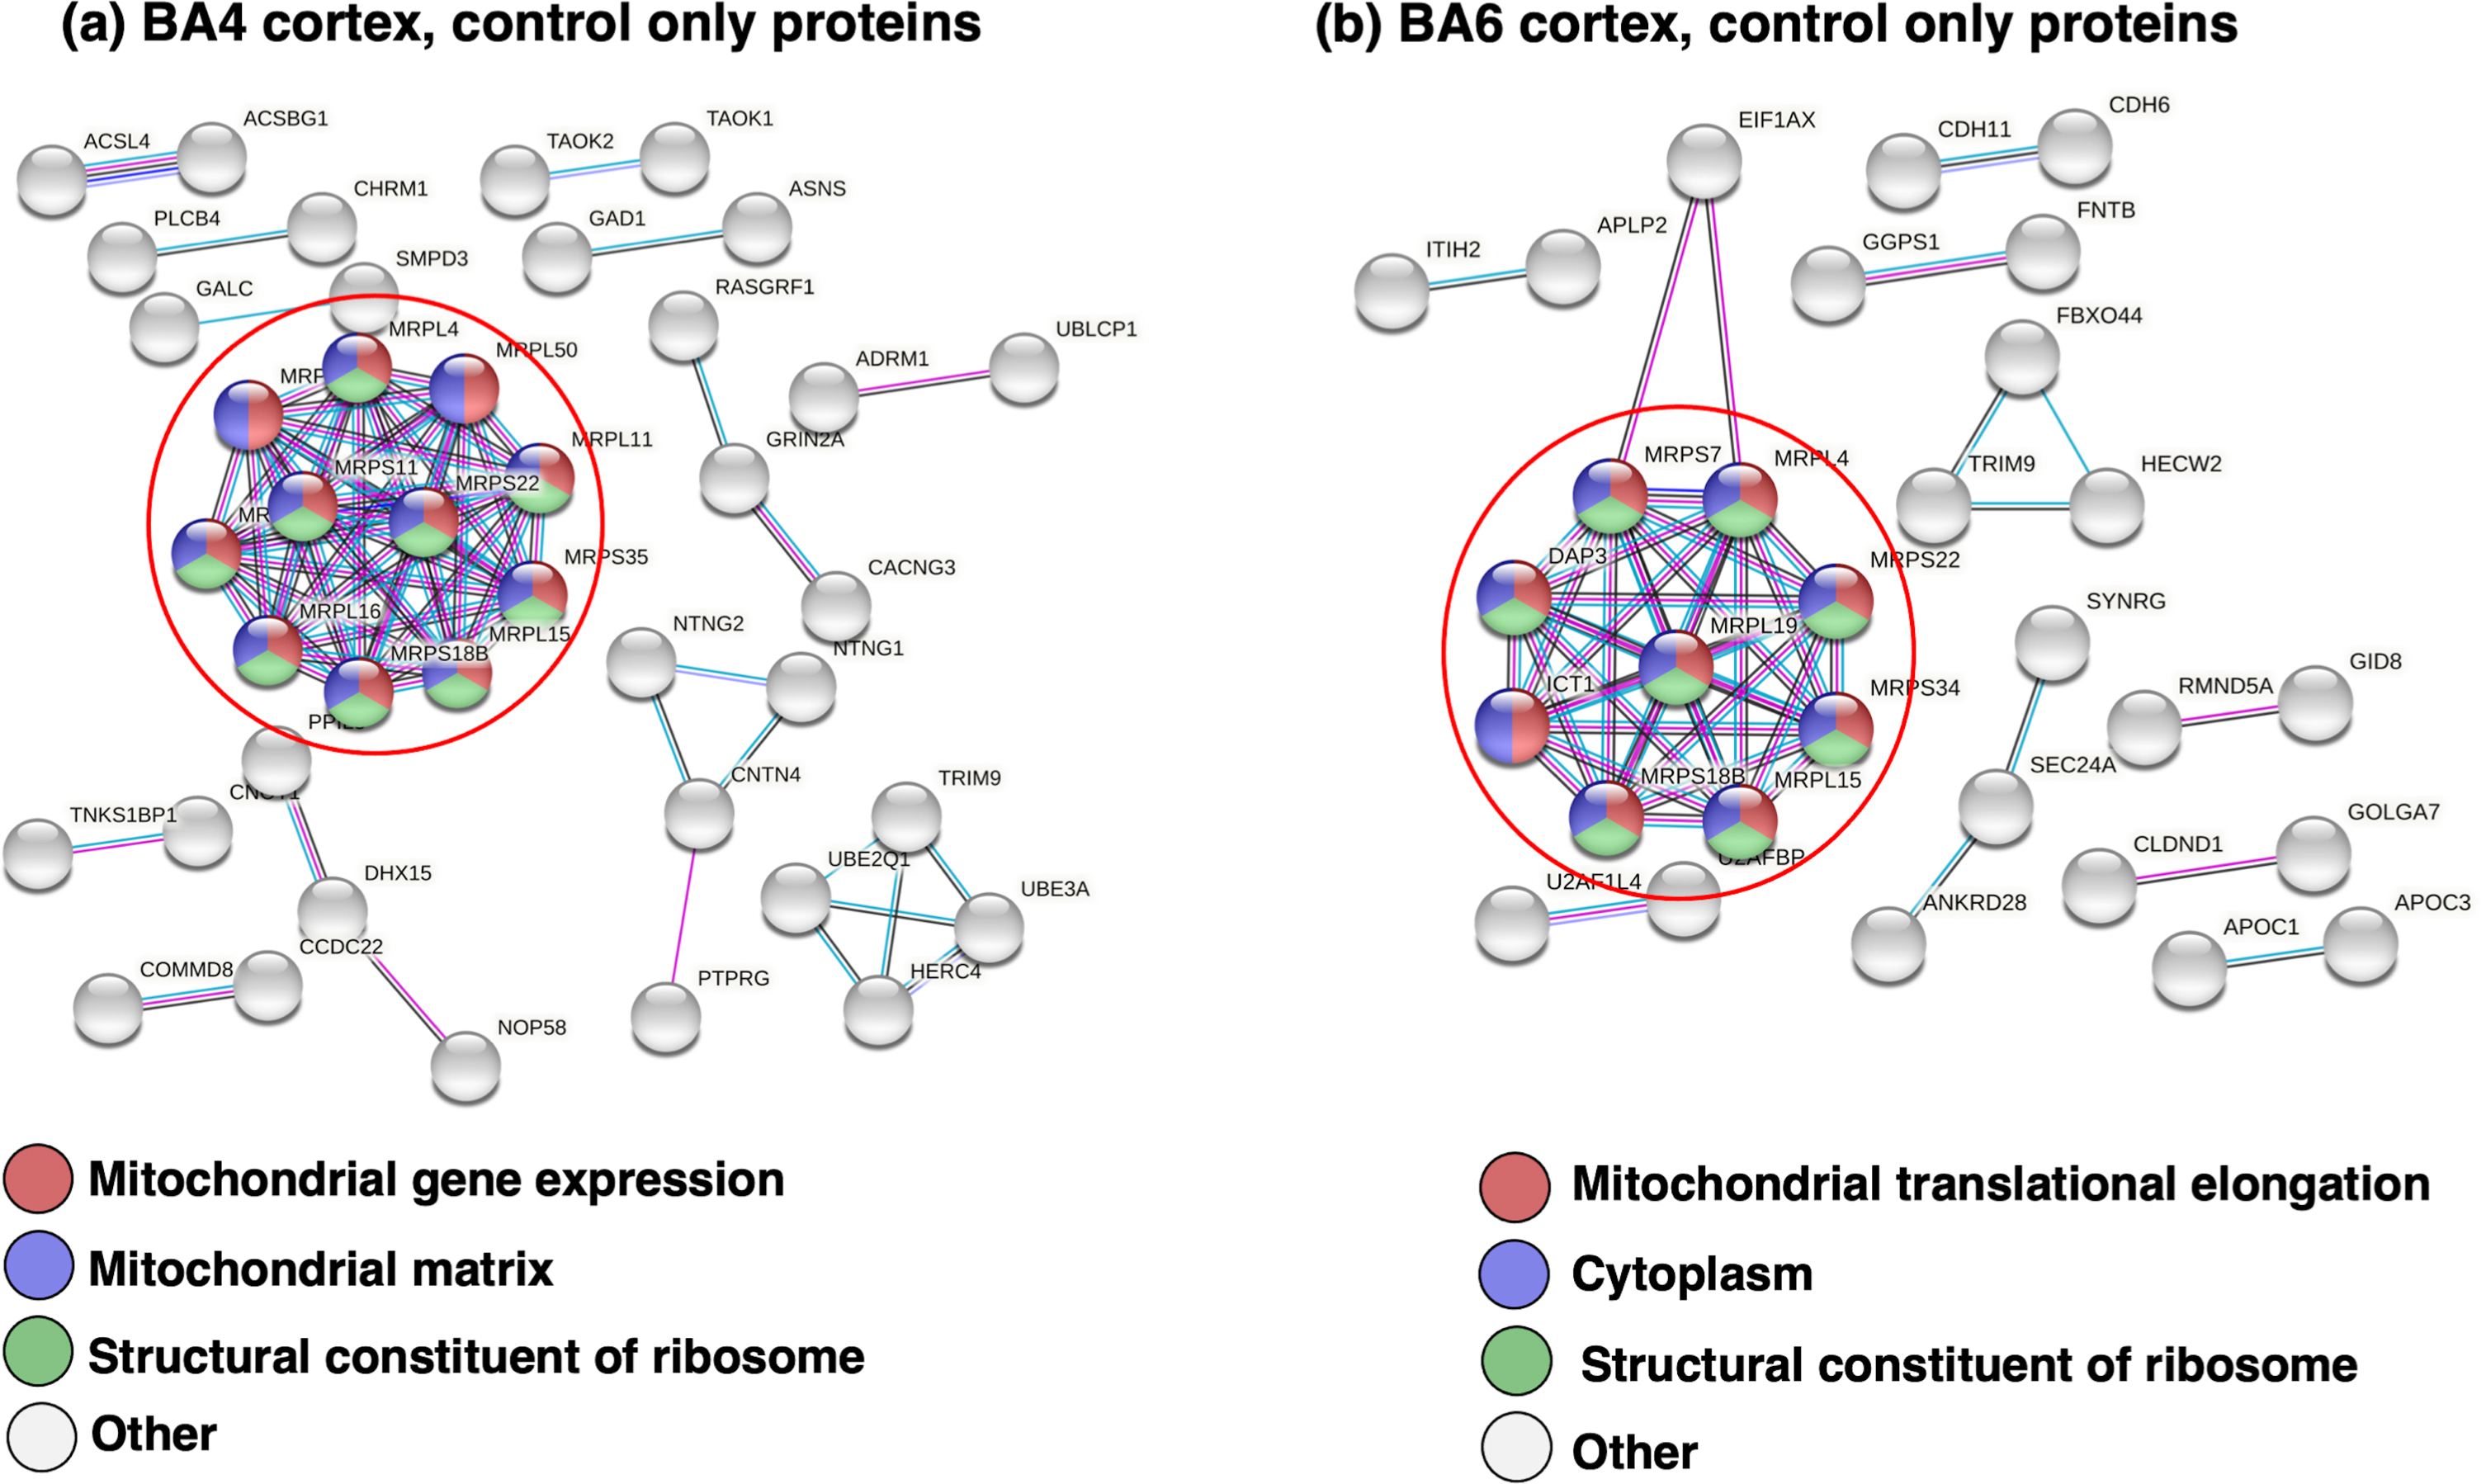
Protein network analysis of proteins present in only control BA4 and BA6 cortex regions. (a) BA4 cortex: proteins only in control. Proteome components present in only the control group of the BA4 cortex (absent in the JHD group) were subjected to protein interaction network analysis by STRING-db, which illustrates significant protein interactions of mitochondrial and structural ribosome systems. (b) BA6 cortex: proteins only in control. Proteins present in only the control group of the BA6 cortex (absent in the JHD group) were subjected to protein interaction network analysis by STRING-db. Significant protein interaction networks are illustrated.
For BA4 proteins present in only the control group, a prominent hub of protein interactions (Fig. 4a) consisted of mitochondria ribosomal proteins consisting of the MRPL (mitochondrial ribosomal protein L) and MRPS (mitochondrial ribosomal protein S) series of isoforms (Supplementary Table 3). The MRPL proteins consisted of MRPL4, MRPL11, MRPL15, MPRL16, MRPL38, and MPRL50. The MRPS proteins were composed of MRPS11, MRPS18B, MRPS22, MRPS34, and MRPS35.
For BA6 proteins present in only the control group, a hub of protein interactions (Fig. 4b) consisted of mitochondrial proteins of the MRPL and MRPS variant isoforms (Supplementary Table 3). The MRPL proteins consisted of MRPL4, MRPL15, and MRPL19. The MRPS proteins were MRPS18B, MRPS22, and MRPS34.
Abundant proteins present in only cortex BA4 or BA6, and not present in JHD, are shown in Supplementary Figure 2. In BA4, the TPBG protein (trophoblast glycoprotein) was most abundant; TPBG functions in adhesion. In BA6, the proteins ABCA2 (ATP binding cassette subfamily A member 2), HSBP1 (heat shock factor binding protein), and CTDP1 (CTD phosphatase subunit 1) were most abundant having functions of ATP transporter, transcription factor, phosphatase modification of RNA polymerase.
Overall, the presence of mitochondrial system proteins in only the control groups of cortex BA4 and BA6 tissues illustrates mitochondrial deficiencies in JDH brain.
Cortex BA4 and BA6 proteins shared in JHD and control: downregulated and upregulated components.
Proteins present in both JHD and control tissues of cortex BA4 and BA6 regions were assessed for downregulation and upregulation by log2(JDH/control) ratios of protein levels (by label-free quantification), with significance determined by Benjamini-Hochberg analysis for q < 0.05, shown in volcano plots (Supplementary Figure 3a, b). Heat maps of the log2 ratios illustrated upregulation and downregulation of proteins in JHD compared to controls in the BA4 and BA6 cortex regions respectively (Fig. 5).
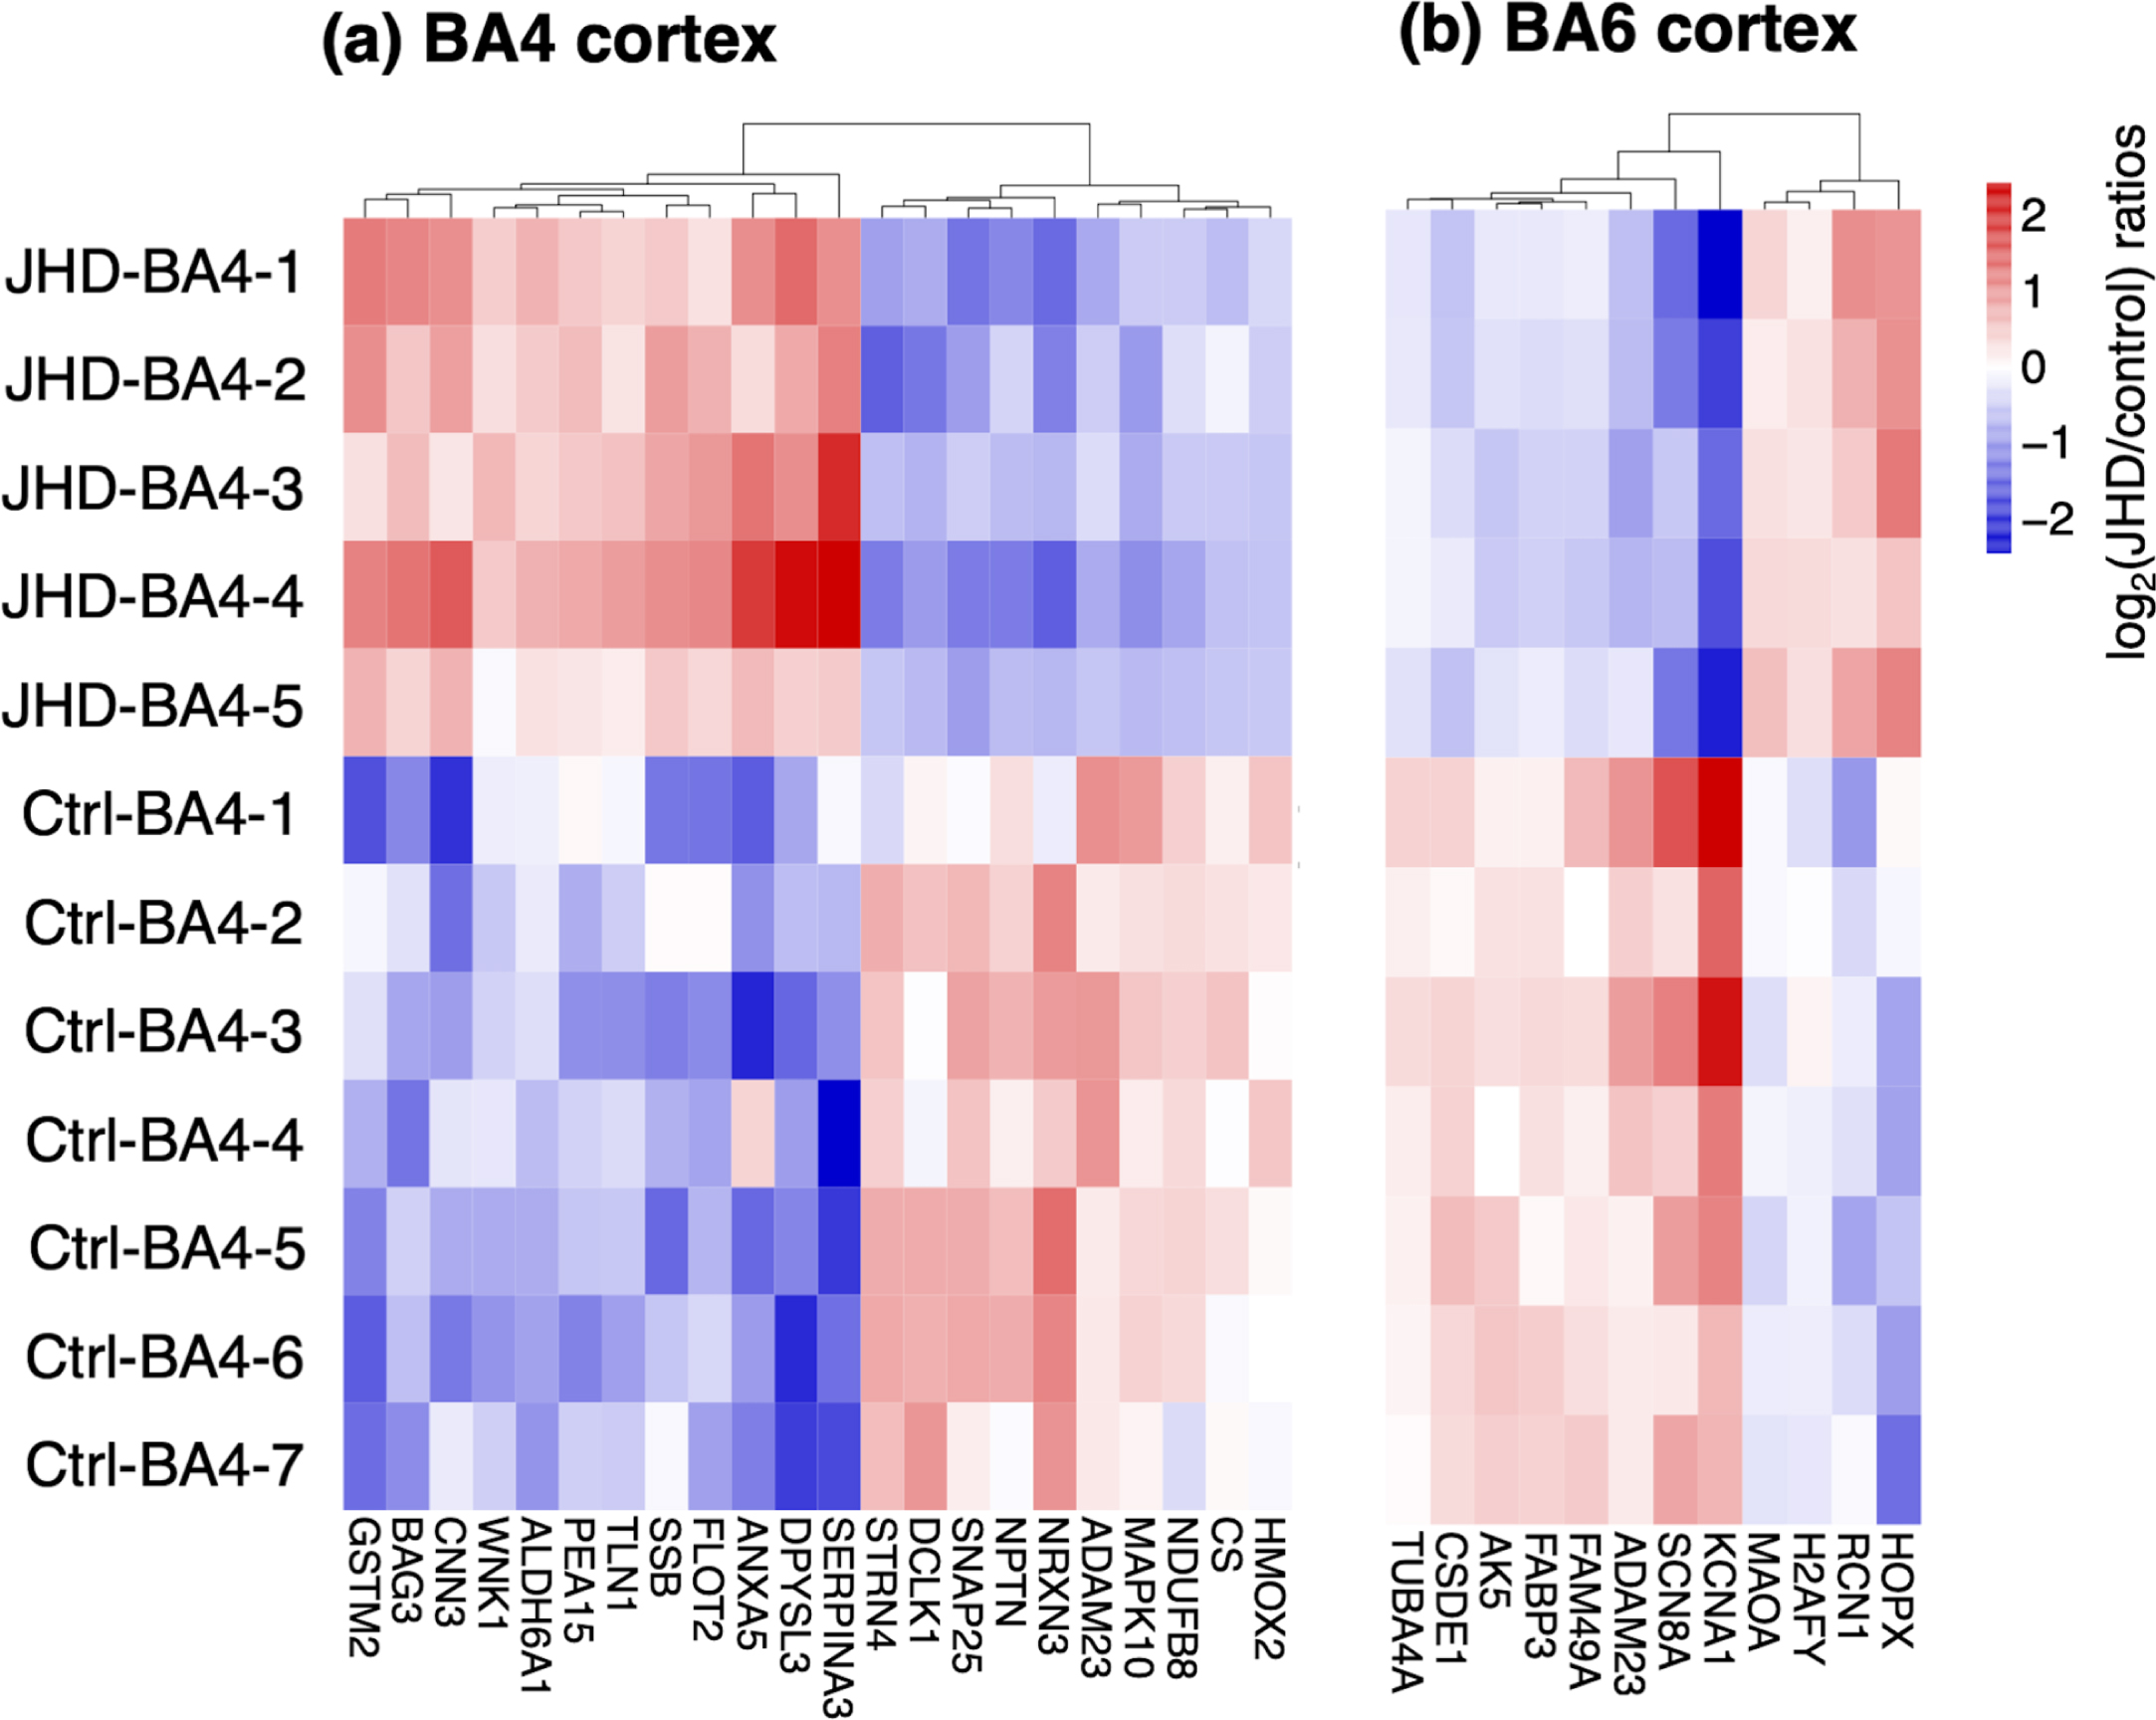
Downregulated and upregulated proteins of JHD compared to control BA4 and BA6 cortex brain regions. (a) BA4 cortex: heatmap of downregulated and upregulated proteins. Proteome components shared by JHD and control groups of the BA4 proteomes were analyzed by ratios of log2(JHD/control) having statistical significance (q < 0.05 by Benjamini-Hochberg analysis) and illustrated as heat maps with hierarchical clustering. (b) BA6 cortex: heatmap of downregulated and upregulated proteins. Proteome comonents shared by JHD and control groups of the BA6 cortex region were analyzed by log2(JHD/control) with statistical significance (q < 0.05 by Benjamini-Hochberg analysis) and shown as heat maps with hierarchical clustering.
In the BA4 region, the most downregulated proteins in BA4 of JHD compared to control were KCNA1 (potassium voltage-gated channel subfamily A member 1), SCNA8 (sodium voltage-gated channel alpha subunit 8), and ADAM 23 (ADAM metallopeptidase domain 23). The most upregulated proteins in the JHD group compared to controls were HOPX (HOP homeobox), RCN1 (reticulocalbin 1), and H2AfY (macroh2A.1 histone).
In the BA6 region, the most downregulated proteins for JHD in the BA6 regions were NRXN3 (neurexin 3), NPTN (neuroplastin), and SNAP25 (synaptosome associated protein 25). The most upregulated proteins in JHD compared to control were SERPINA3 (serpin family A member 3), DPYSL3 (dihydropyrimidinase like 3), and ANXA5 (annexin A5).
Dysregulated mitochondrial proteins in cortex BA4 and BA6 regions of JHD compared to age-matched control
Deficits in mitochondrial function were indicated by downregulated proteins of the mitochondrial oxidative pathway in JHD compared to controls (Fig. 6a). These downregulated proteins consisted of NDUFA1 (NADH:ubiquinone oxidoreductase subunit A1) and NDUFA4 (NDUFA4 mitochondrial complex associated), components of complex I of the mitochondrial oxidative pathway respiratory chain. Results indicated deficits in components of NADH dehydrogenase of the mitochondrial oxidative pathway.
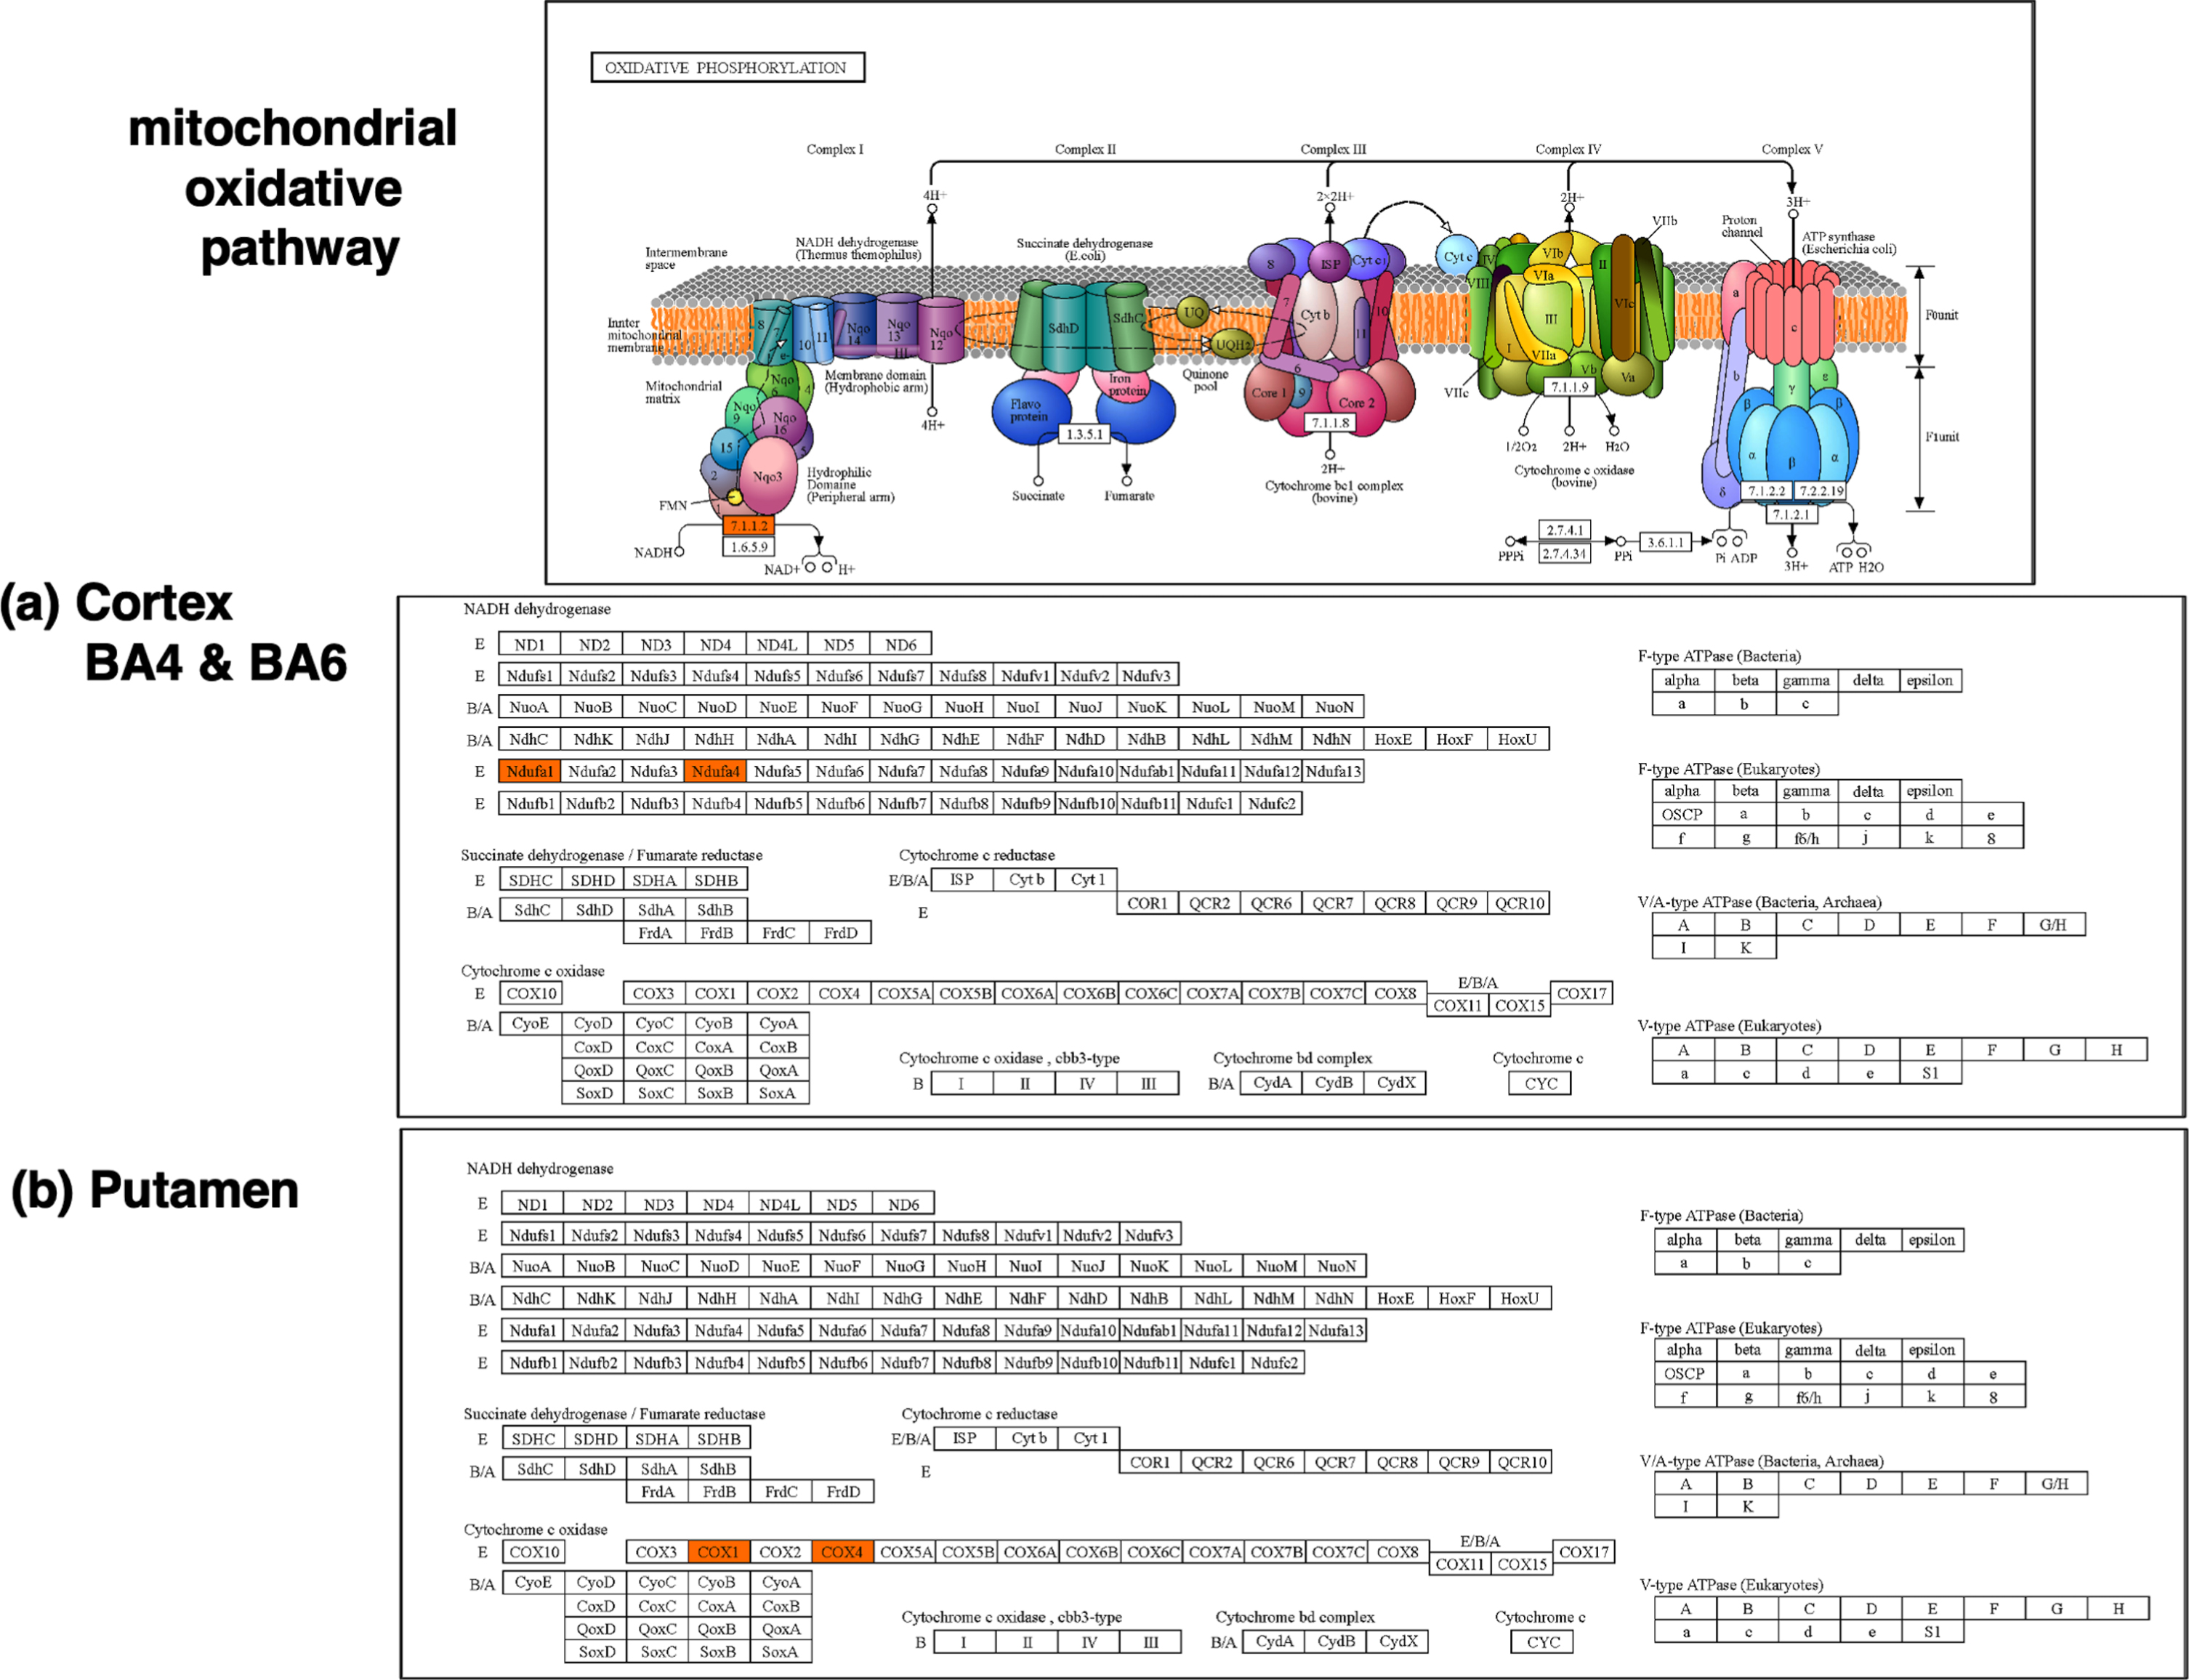
Deficiencies in the mitochondrial oxidative phosphorylation system in cortex and putamen in JHD compared to control. (a) Cortex BA4 and BA6 regions. Dysregulated proteome components of cortex BA4 and BA6 that were downregulated in JHD (shown in orange) are illustrated in KEGG pathway analysis of the mitochondrial oxidative phosphorylation system. (b) Putamen. Putamen proteome components that were downregulated in JHD (shown in orange) compared to control are illustrated for components of the mitochondrial oxidative phosphorylation pathway.
Cortical BA4 and BA6 regions: similarities and differences among protein groups of only in JHD, only in control, downregulated, and upregulated
The two cortical BA4 and BA6 regions displayed common and different proteins found to be dysregulated for the categories of proteins found only in JHD, only in control, significantly downregulated, and significantly upregulated (Supplementary Table 4). Among these categories, there were more differences than similarities in BA4 compared to BA6 (Supplementary Table 4).
Putamen displays distinct and shared proteomics components in JHD compared to age-matched controls
The proteome of the putamen brain region in JHD was found to be dysregulated compared to age-matched control putamen (Fig. 7). Proteomics data of the JHD putamen identified 167 proteins found to be present in only the JHD group (not present in the control group), and 328 proteins present in only the control group (absent in JHD group). Shared proteins numbering 3,201 were present in both the JHD and control groups. A total of 3,696 distinct proteins were identified in the putamen samples (Fig. 7a). PCA of proteomes determined for each of the JHD and control putamen samples indicated segregation of proteome components (Fig. 7b). PCA showed that that PC1 contributed to 30.19% of variability and PC2 accounted for 12.97% of variability.
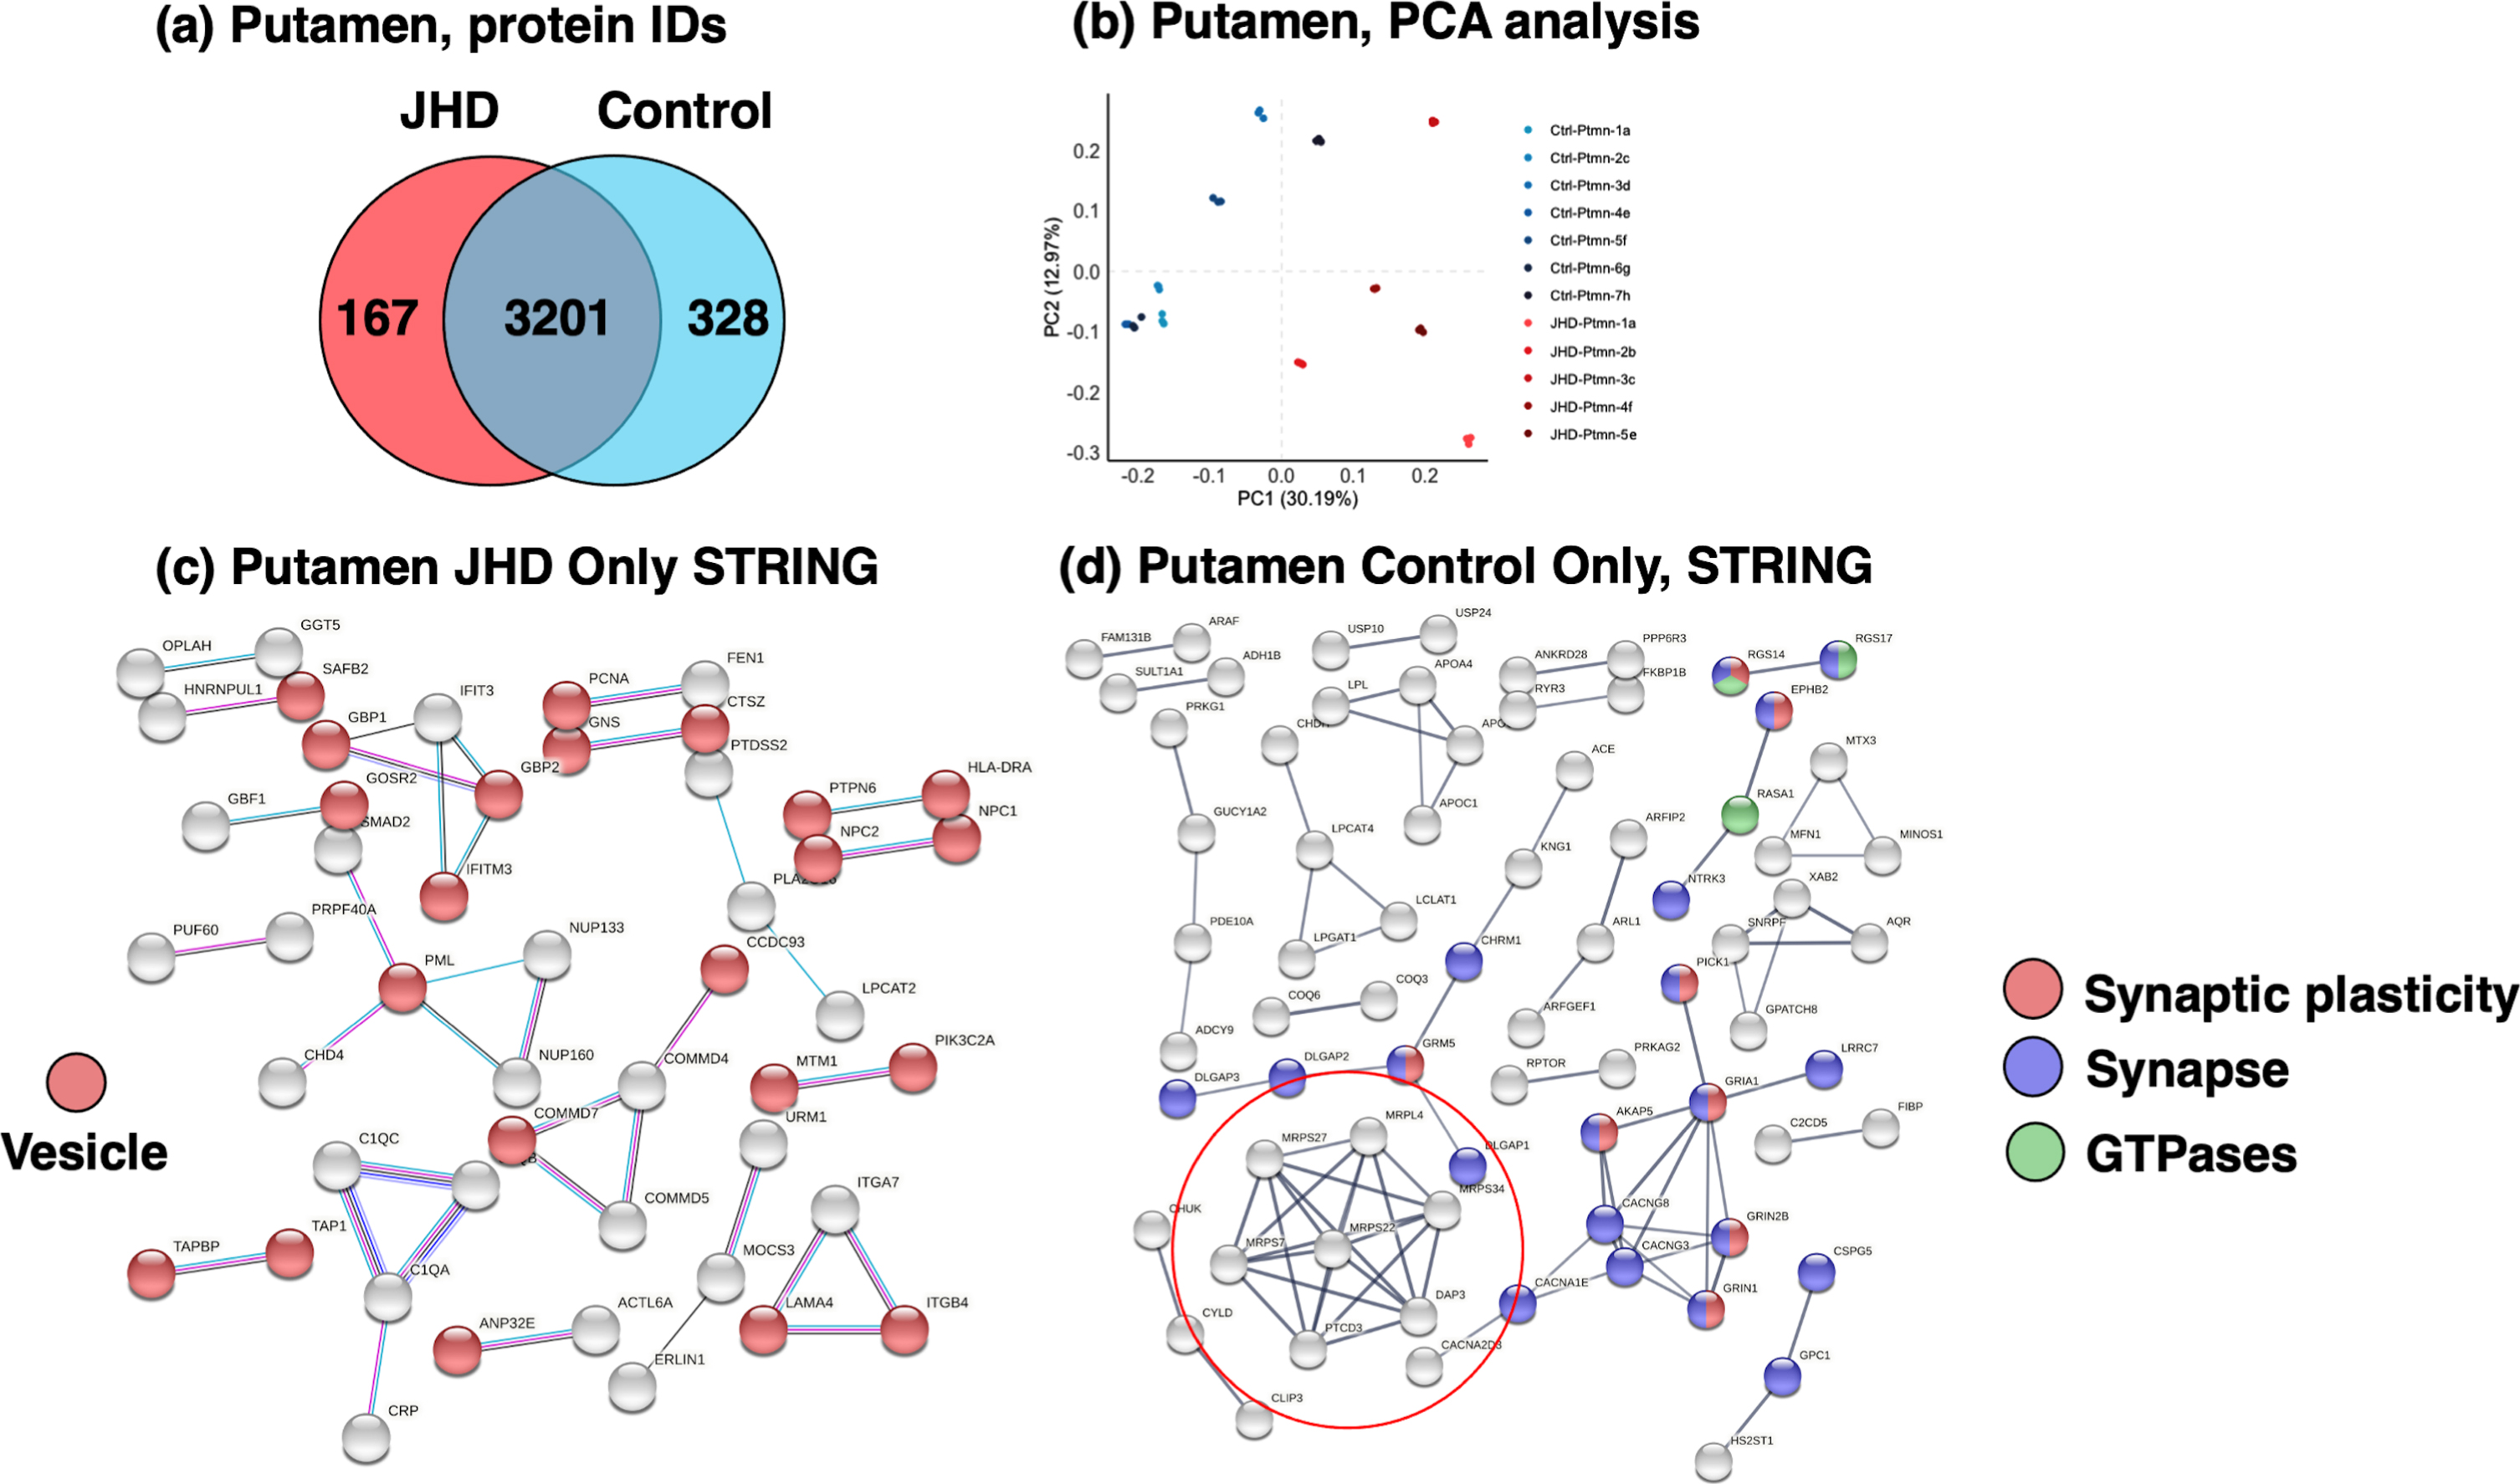
Proteomics of putamen proteins present uniquely or shared in JHD and control brains. (a) Distinct and shared proteins in JHD compared to control putamen. Putamen proteome components from JHD and age-matched control groups were compared for protein only in JDH or control, and those shared by the disease and control groups by a Venn diagram. (b) Principal component analysis of the putamen proteome from JHD compared to controls. Evaluation of the segregation of JHD and control proteome components in putamen was assessed by principal component analysis (PCA). (c) Proteins present in only JHD putamen in protein networks. Components present in only JHD putamen (not in control putamen) were analyzed by STRING-db to indicate predicted protein interaction networks involving vesicular functions. (d) Proteins present in only control putamen in protein networks. Protein components present in only the control putamen (absent in JHD putamen) displayed protein interaction networks involving primarily synaptic components.
The proteins present in only the JHD putamen represented cell pathways of vesicle and extracellular pathways based on GO analysis (Table 3). Network analysis by STRING-db showed protein interacting pathways among vesicle systems (Fig. 7c) consisting of protein components involved in features of cell signaling (Supplementary Table 5). In addition, the most abundant proteins present only in JHD putamen were the cholesterol transporter NPC2 (NPC intracellular cholesterol transporter 2) and the solute carrier SLC20A2 (solute carrier family 20 member 2) (Supplementary Figure 4, part a).
Putamen JHD Only Proteins, GO
Putamen proteome components identified in only JHD (not in control) were assessed for cellular functions by GO analysis. The protein count indicates the number of putamen proteins in the GO category compared to the total number of proteins in the GO category, and significance is considered with FDR of < 0.05.
Proteins present in only control subjects (absent in JHD) displayed significant networking interactions among proteins related to synaptic functions (Fig. 7d, Table 4). A hub of protein interactions consisted of a cluster of proteins involved in mitochondrial protein translation (Fig. 7d, Supplementary Table 6). In addition, the most abundant proteins present only in control putamen were found as the ADP ribosylation factor ARFIP2 (ADP ribosylation factor interacting protein 2), phosphodiesterase PDE10A (phosphodiesterase 10A), and neurotrophic receptor NTRK3 (neurotrophic receptor tyrosine kinase 3) (Supplementary Figure 4, part b).
Putamen Control Only Proteins, GO
Putamen proteins identified in only control were assessed for biological and cellular functions by GO analysis. The protein count indicates the number of putamen protein in the GO category compared to the total number of proteins of the GO category. Significance is considered with FDR of < 0.05.
Overall, analysis of proteins unique to JHD showed enhancement of processes related to extracellular vesicles and inflammatory process, and proteins absent in JHD showed deficits in mitochondrial and synaptic processes.
Putamen downregulated and upregulated proteins in JHD compared to control
Quantifiable proteins shared between JHD and control were assessed for upregulation and downregulation illustrated by a volcano plot (Supplementary Figure 3, part c). Significantly regulated proteins were assessed by ratios of JDH/control as log2 ≥1 for upregulation or log2 ≤ –1 for downregulation, displayed in a heatmap format (Fig. 8).
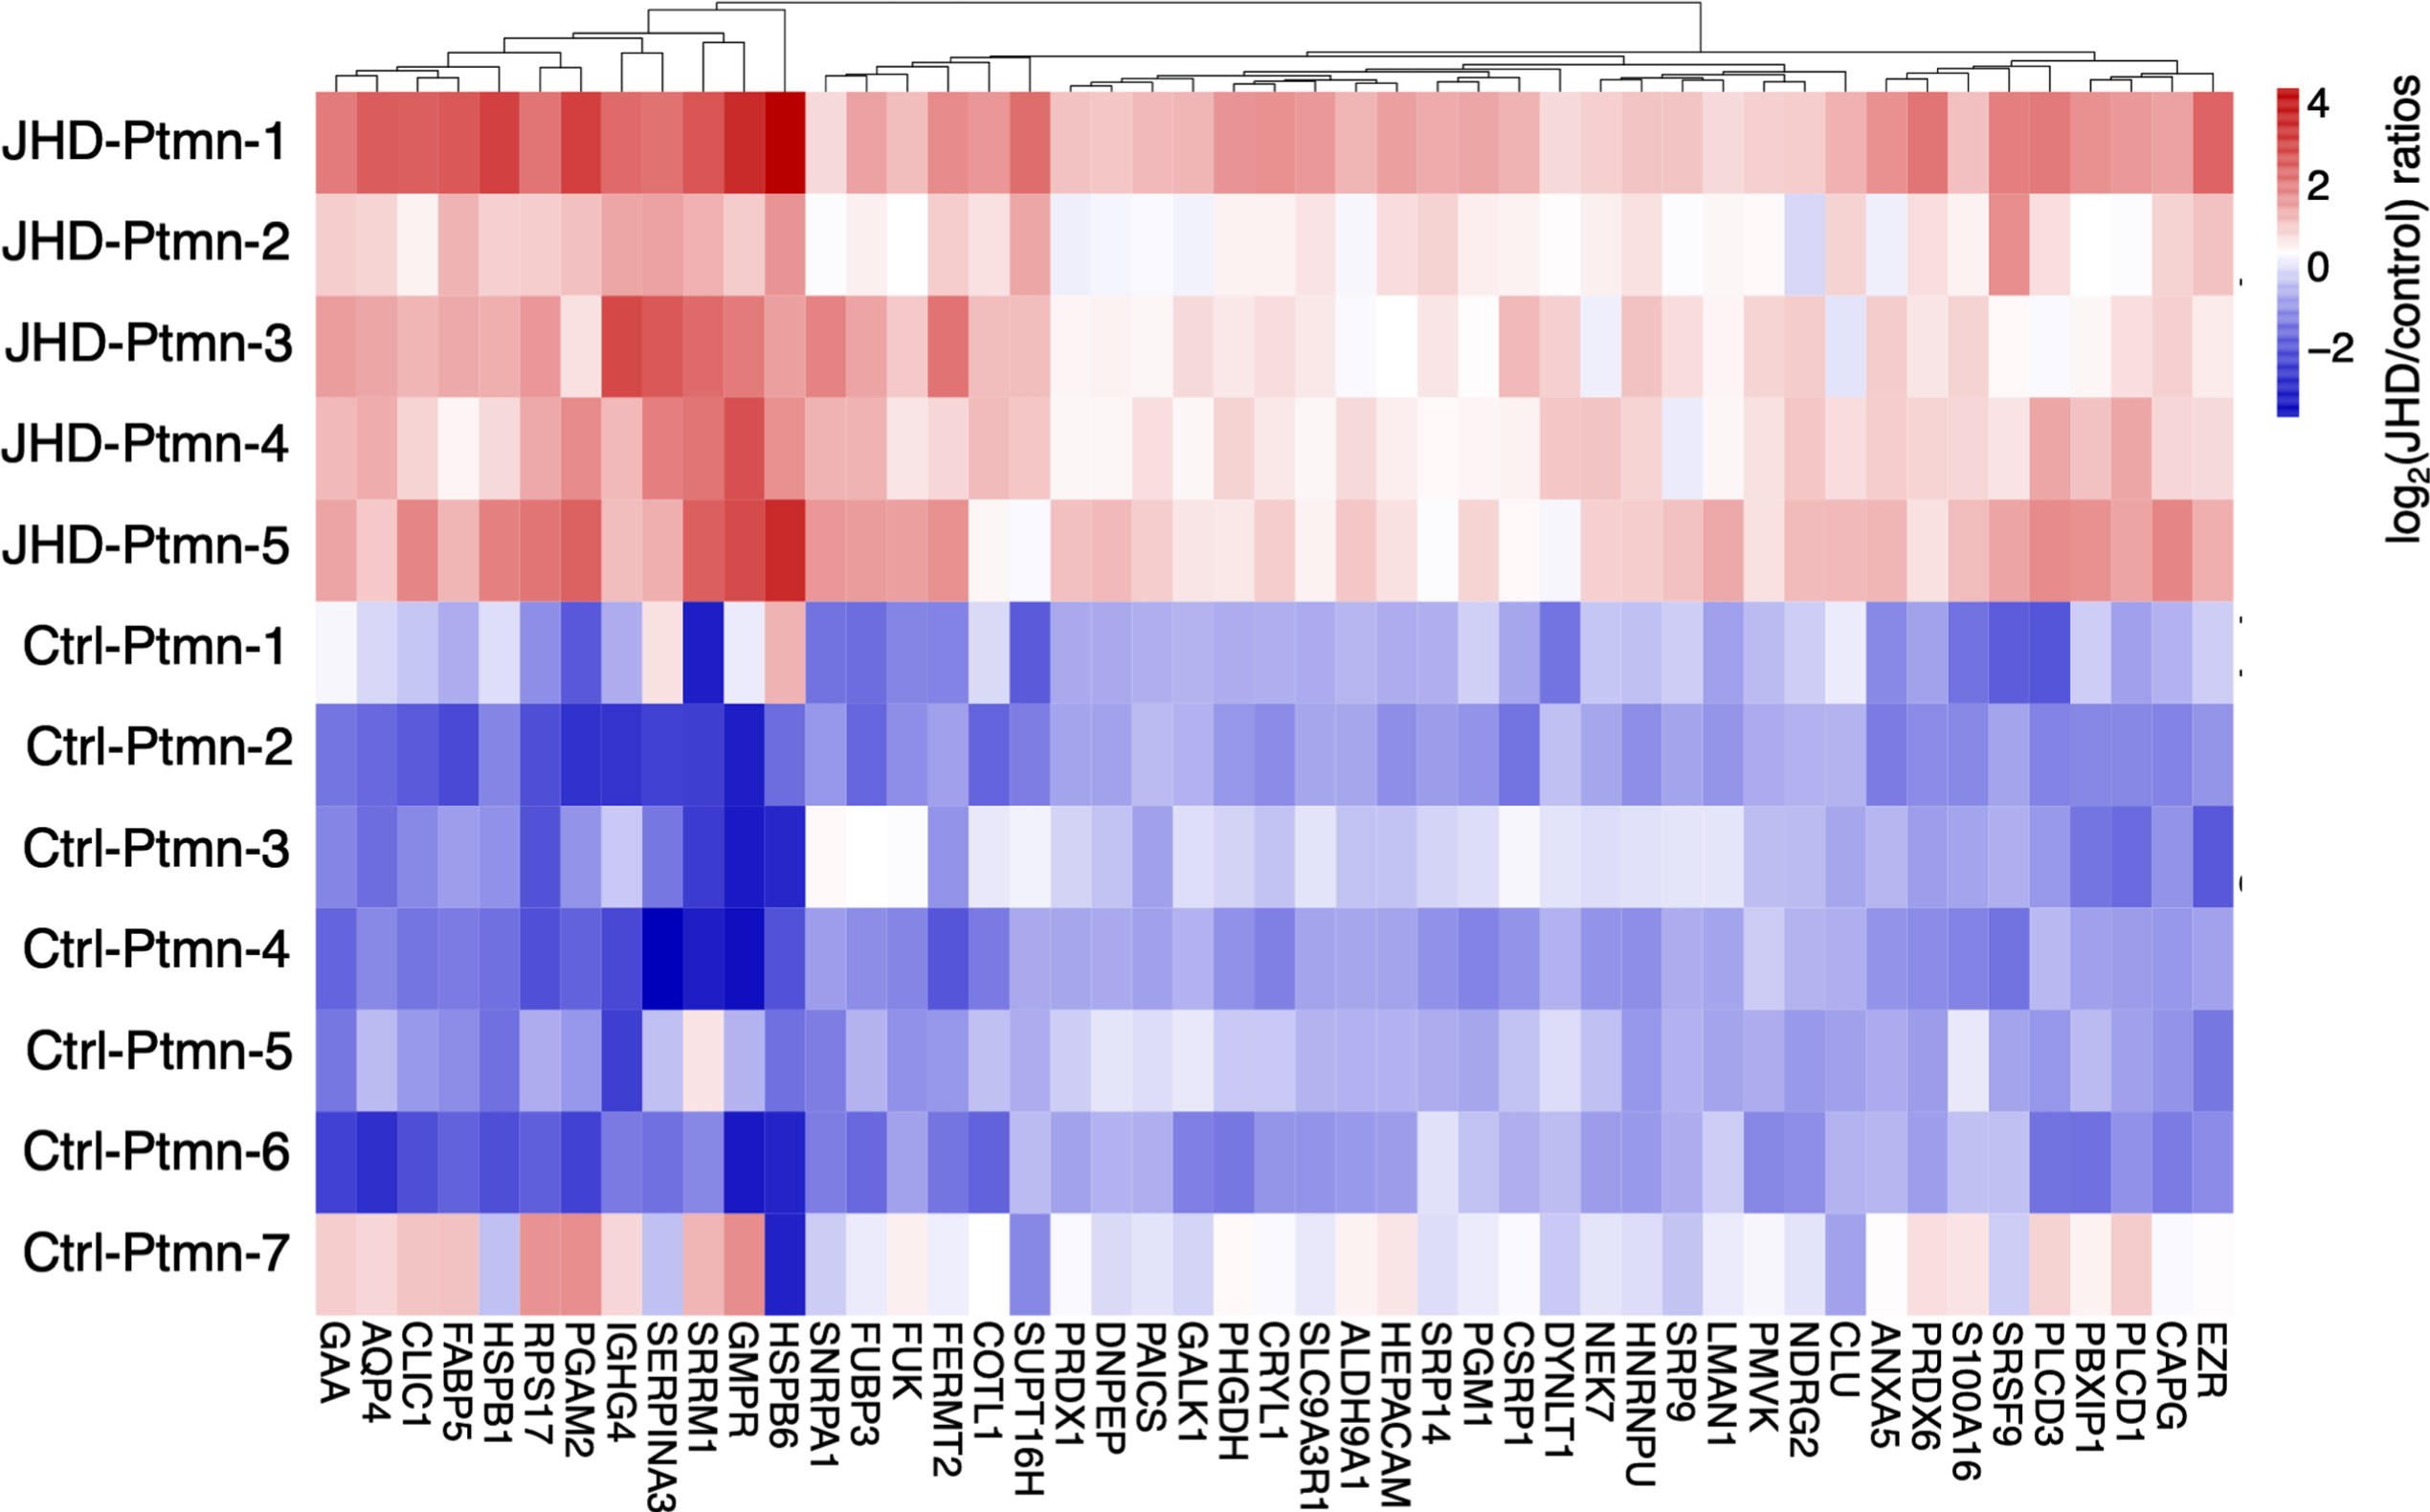
Putamen downregulated and upregulated proteins in JHD compared to control. Putamen proteins in JHD compared to controls (age-matched) were assessed by ratios of log2(JHD/control) at significance levels of q < 0.05 (by Benjamni-Hochberg analysis). These ratios are illustrated by hierarchical clustering consisted of those of log2(JHD/control)< -1 to indicate upregulation by more than 2-fold, or > 1 to indicate downregulation by more than 0.5.
Molecular networking analysis of putamen downregulated proteins in JHD showed deficits in synaptic transmission, synapse, and calmodulin binding (Table 5a, Fig. 9a, and Supplementary Table 7). These downregulated proteins in putamen consisted of (a) synaptic transmission components of PRKCB (protein kinase C beta), PPP3R1 (protein phosphatase 3 regulatory subunit B, alpha), PPP3CA (protein phosphatase 3 catalytic subunit alpha), and CAMK2B (calcium/calmodulin dependent protein kinase II beta), (b) synapse components of PPP3CA and PPP3R1, and (c) calmodulin binding proteins of CAMK2B and CAMK4 (calcium/calmodulin dependent protein kinase IV).
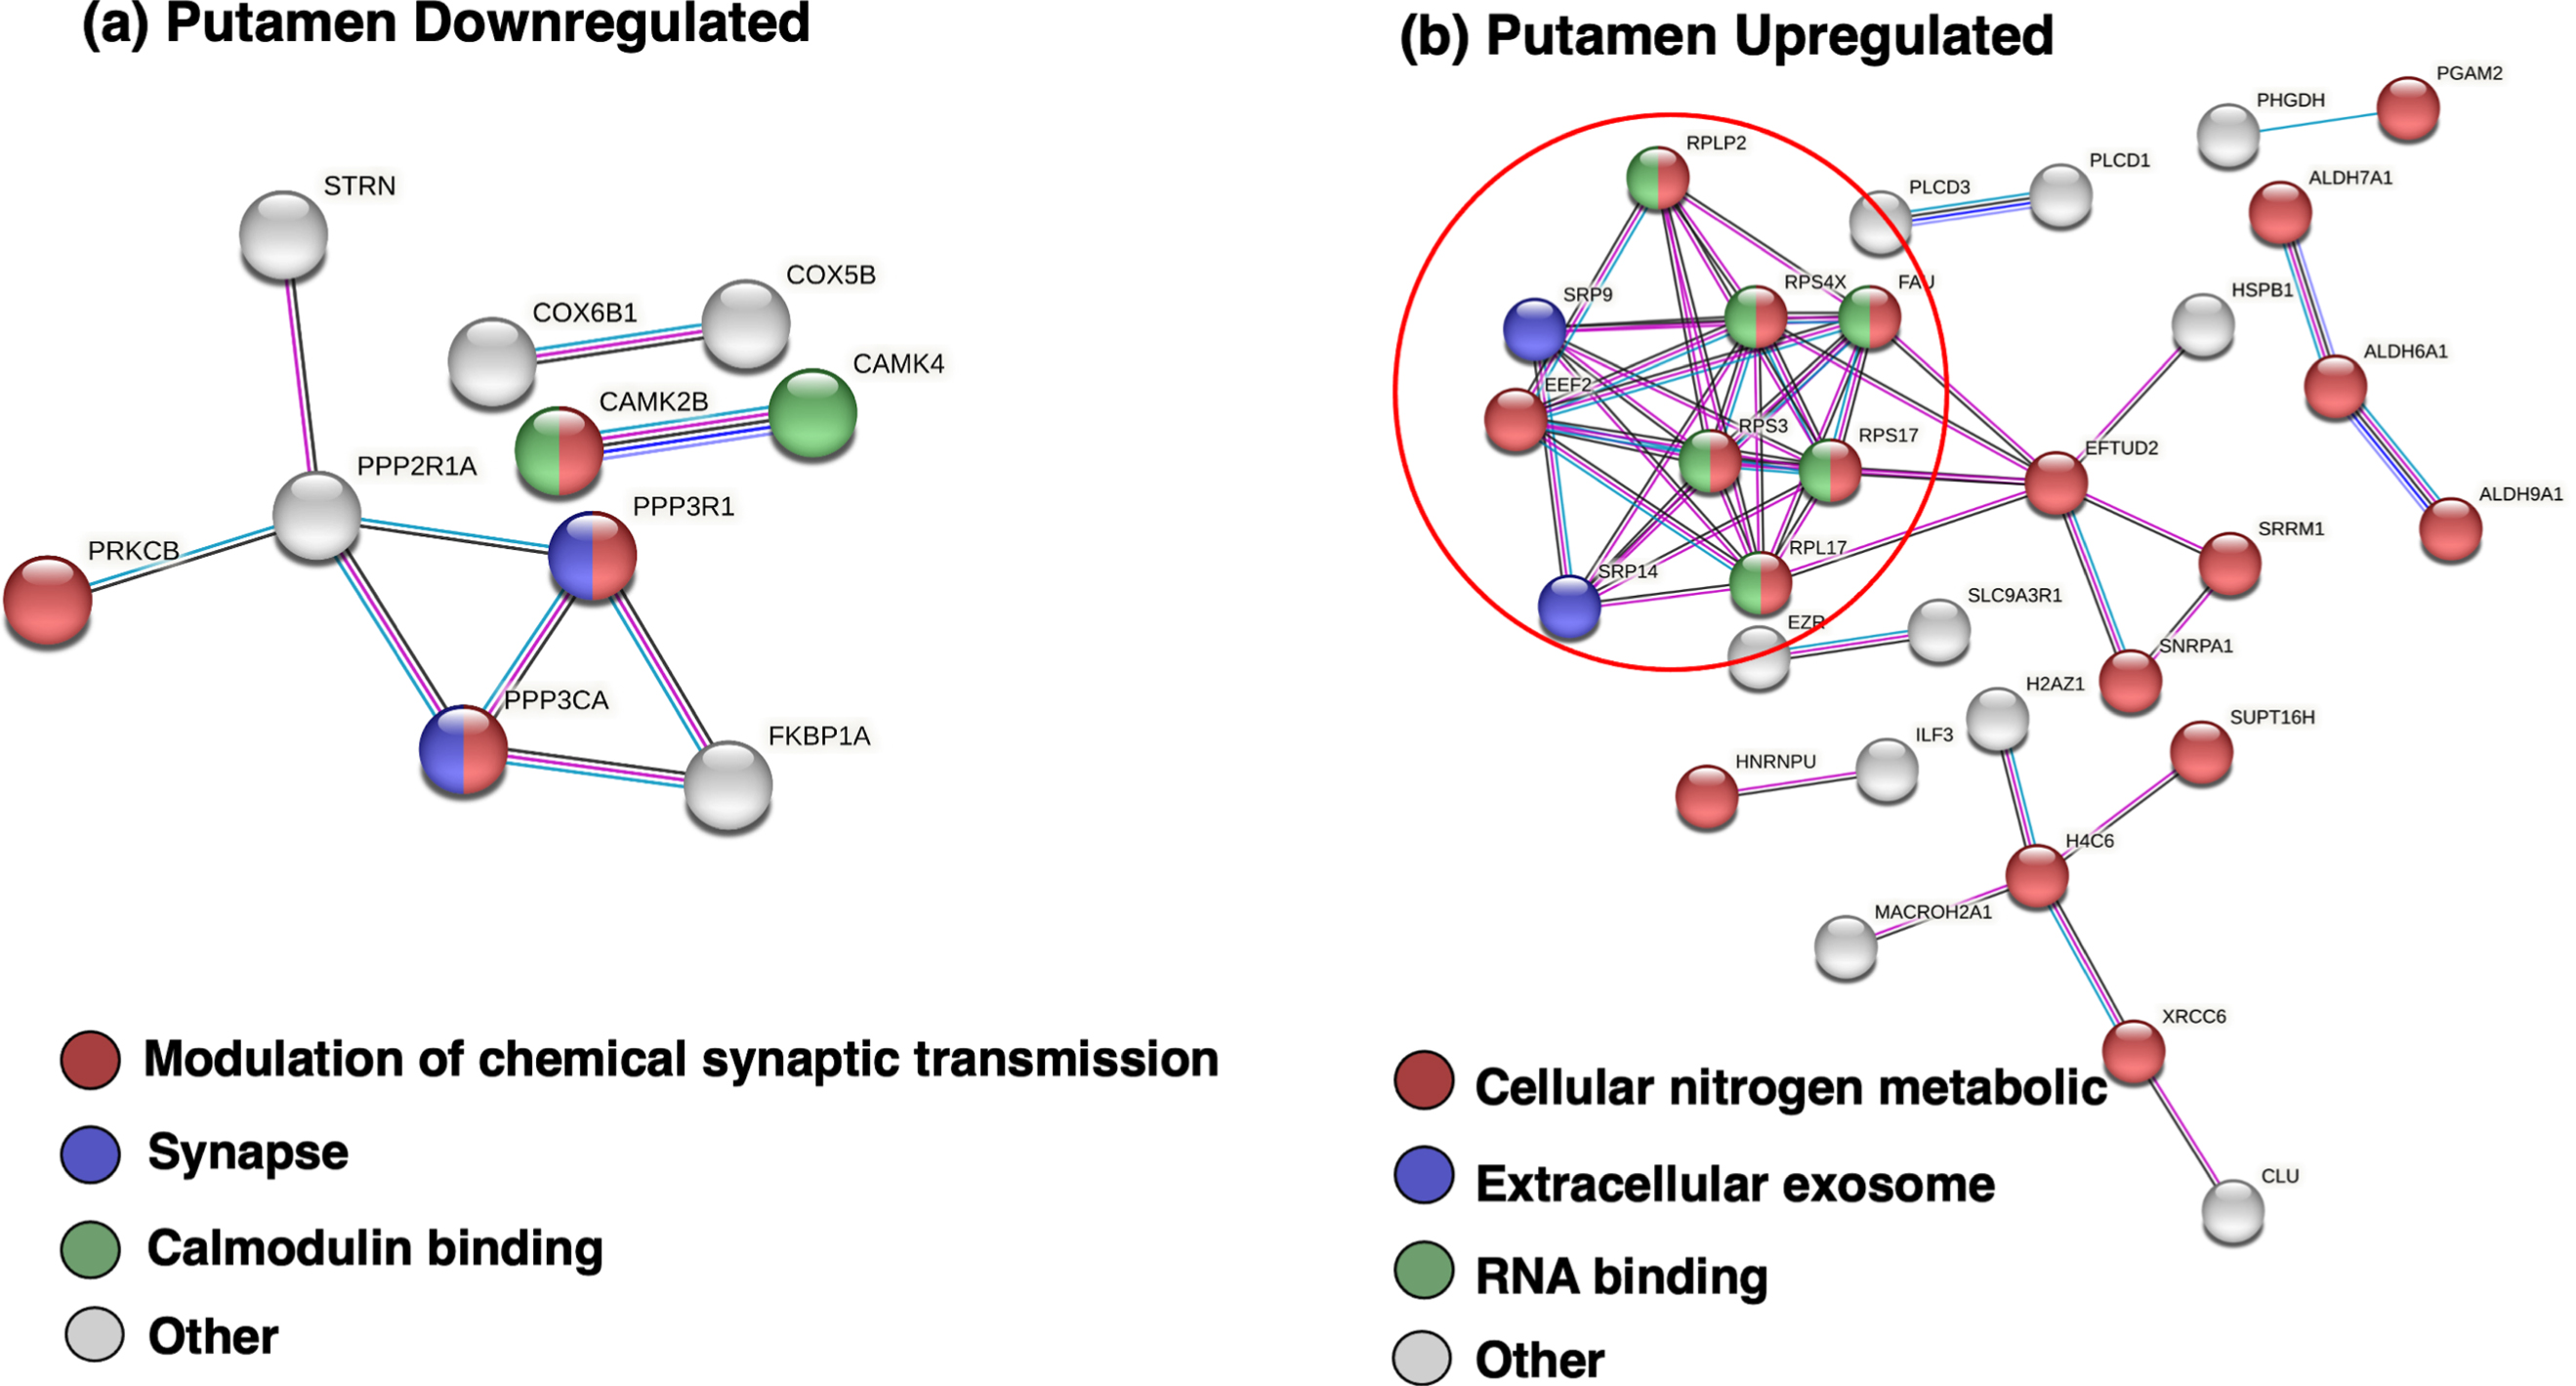
Protein network analysis of putamen downregulated and upregulated proteins in JHD compared to controls. (a) Downregulated putamen proteins of JHD compared to control in protein interaction networks. Network analysis of downregulated putamen proteins in JHD compared to controls, achieved by STRING-db, represented processes of synaptic transmission, synapse, and calmodulin functions. (b) Upregulated putamen proteins of JHD compared to control in protein interaction networks. Network analysis of upregulated putamen proteins in JHD compared to controls was assessed by STRING-db which illustrated processes of extracellular exosomes, metabolism, and cellular RNA functions.
Putamen downregulated and upregulated proteins, GO
Putamen downregulated proteins (a) and upregulated proteins (b) were assessed for biological and cellular functions by GO analysis. The protein count indicates the number of putamen protein in the GO category compared to the total number of proteins of the GO category. Significance is considered with FDR of < 0.05.
Proteins upregulated in JHD displayed networking interactions with GO terms related to nitrogen metabolism, extracellular exosome, and ribonucleoprotein complex (Table 5b). Hubs of protein interaction networks of upregulated proteins were indicated by one distinct cluster (Fig. 9b) with functions related to mRNA translation which included (a) several ribosomal proteins of FAU (FAU ubiquitin like and ribosomal protein S30 fusion), RPLP2 (ribosomal protein lateral stalk subunit P2), RPS4X (ribosomal protein S4 x-linked), RPS3 (ribosomal protein S3), RPS17 (ribosomal protein S17), (b) signal recognition particles SRP9 (signal recognition particle 9) and SRP14 (signal recognition particle 14), and (c) translation factor EEF2 (eukaryotic translation elongation factor 2) (Supplementary Table 7).
Overall, the significantly regulated proteins shared between JHD and control indicate deficits in cell metabolism and cell signaling in JHD, and enhancement of translation.
Putamen proteomics reveal dysregulation of mitochondrial system proteins
The deficit of proteins related to mitochondrial processes in JHD putamen are illustrated in the KEGG pathway map of mitochondrial oxidative phosphorylation (Fig. 6b). The proteins COX1 (mitochondrially encoded cytochrome c oxidase) and COX4 (cytochrome c oxidase subunit 4I1) are downregulated in JHD. These downregulated proteins in JHD putamen participate as components of cytochrome c oxidase, complex IV the mitochondrial respiratory system.
Neuropeptide transmitter dysregulation in JHD compared to age-matched control brain regions of cortex BA4/BA6 and putamen
Bioinformatics assessment of dysregulated proteome components in cortex and putamen by GO indicated vesicular, synaptic neurotransmitter systems (Tables 2–5). Accordingly, proteomes were queried for neuropeptide protein precursors which are converted to active peptide neurotransmitters (Fig. 10). In the BA4 cortex region, proneuropeptide Y (NPY) was unique to JHD, while chromogranin B (CHGB) and several granins (CHGA (chromogranin A), SCG2 (secretogranin II), SCG3 (secretogranin III), VGF (VGF nerve growth factor inducible) were shared between JHD and control groups (Fig. 10a). Similarly, in the BA6 cortex region, NPY was also found to be present only in JHD, with CHGB, cholecystokinin (CCK) and other proneuropeptides shared between JHD and control (Fig. 10b).
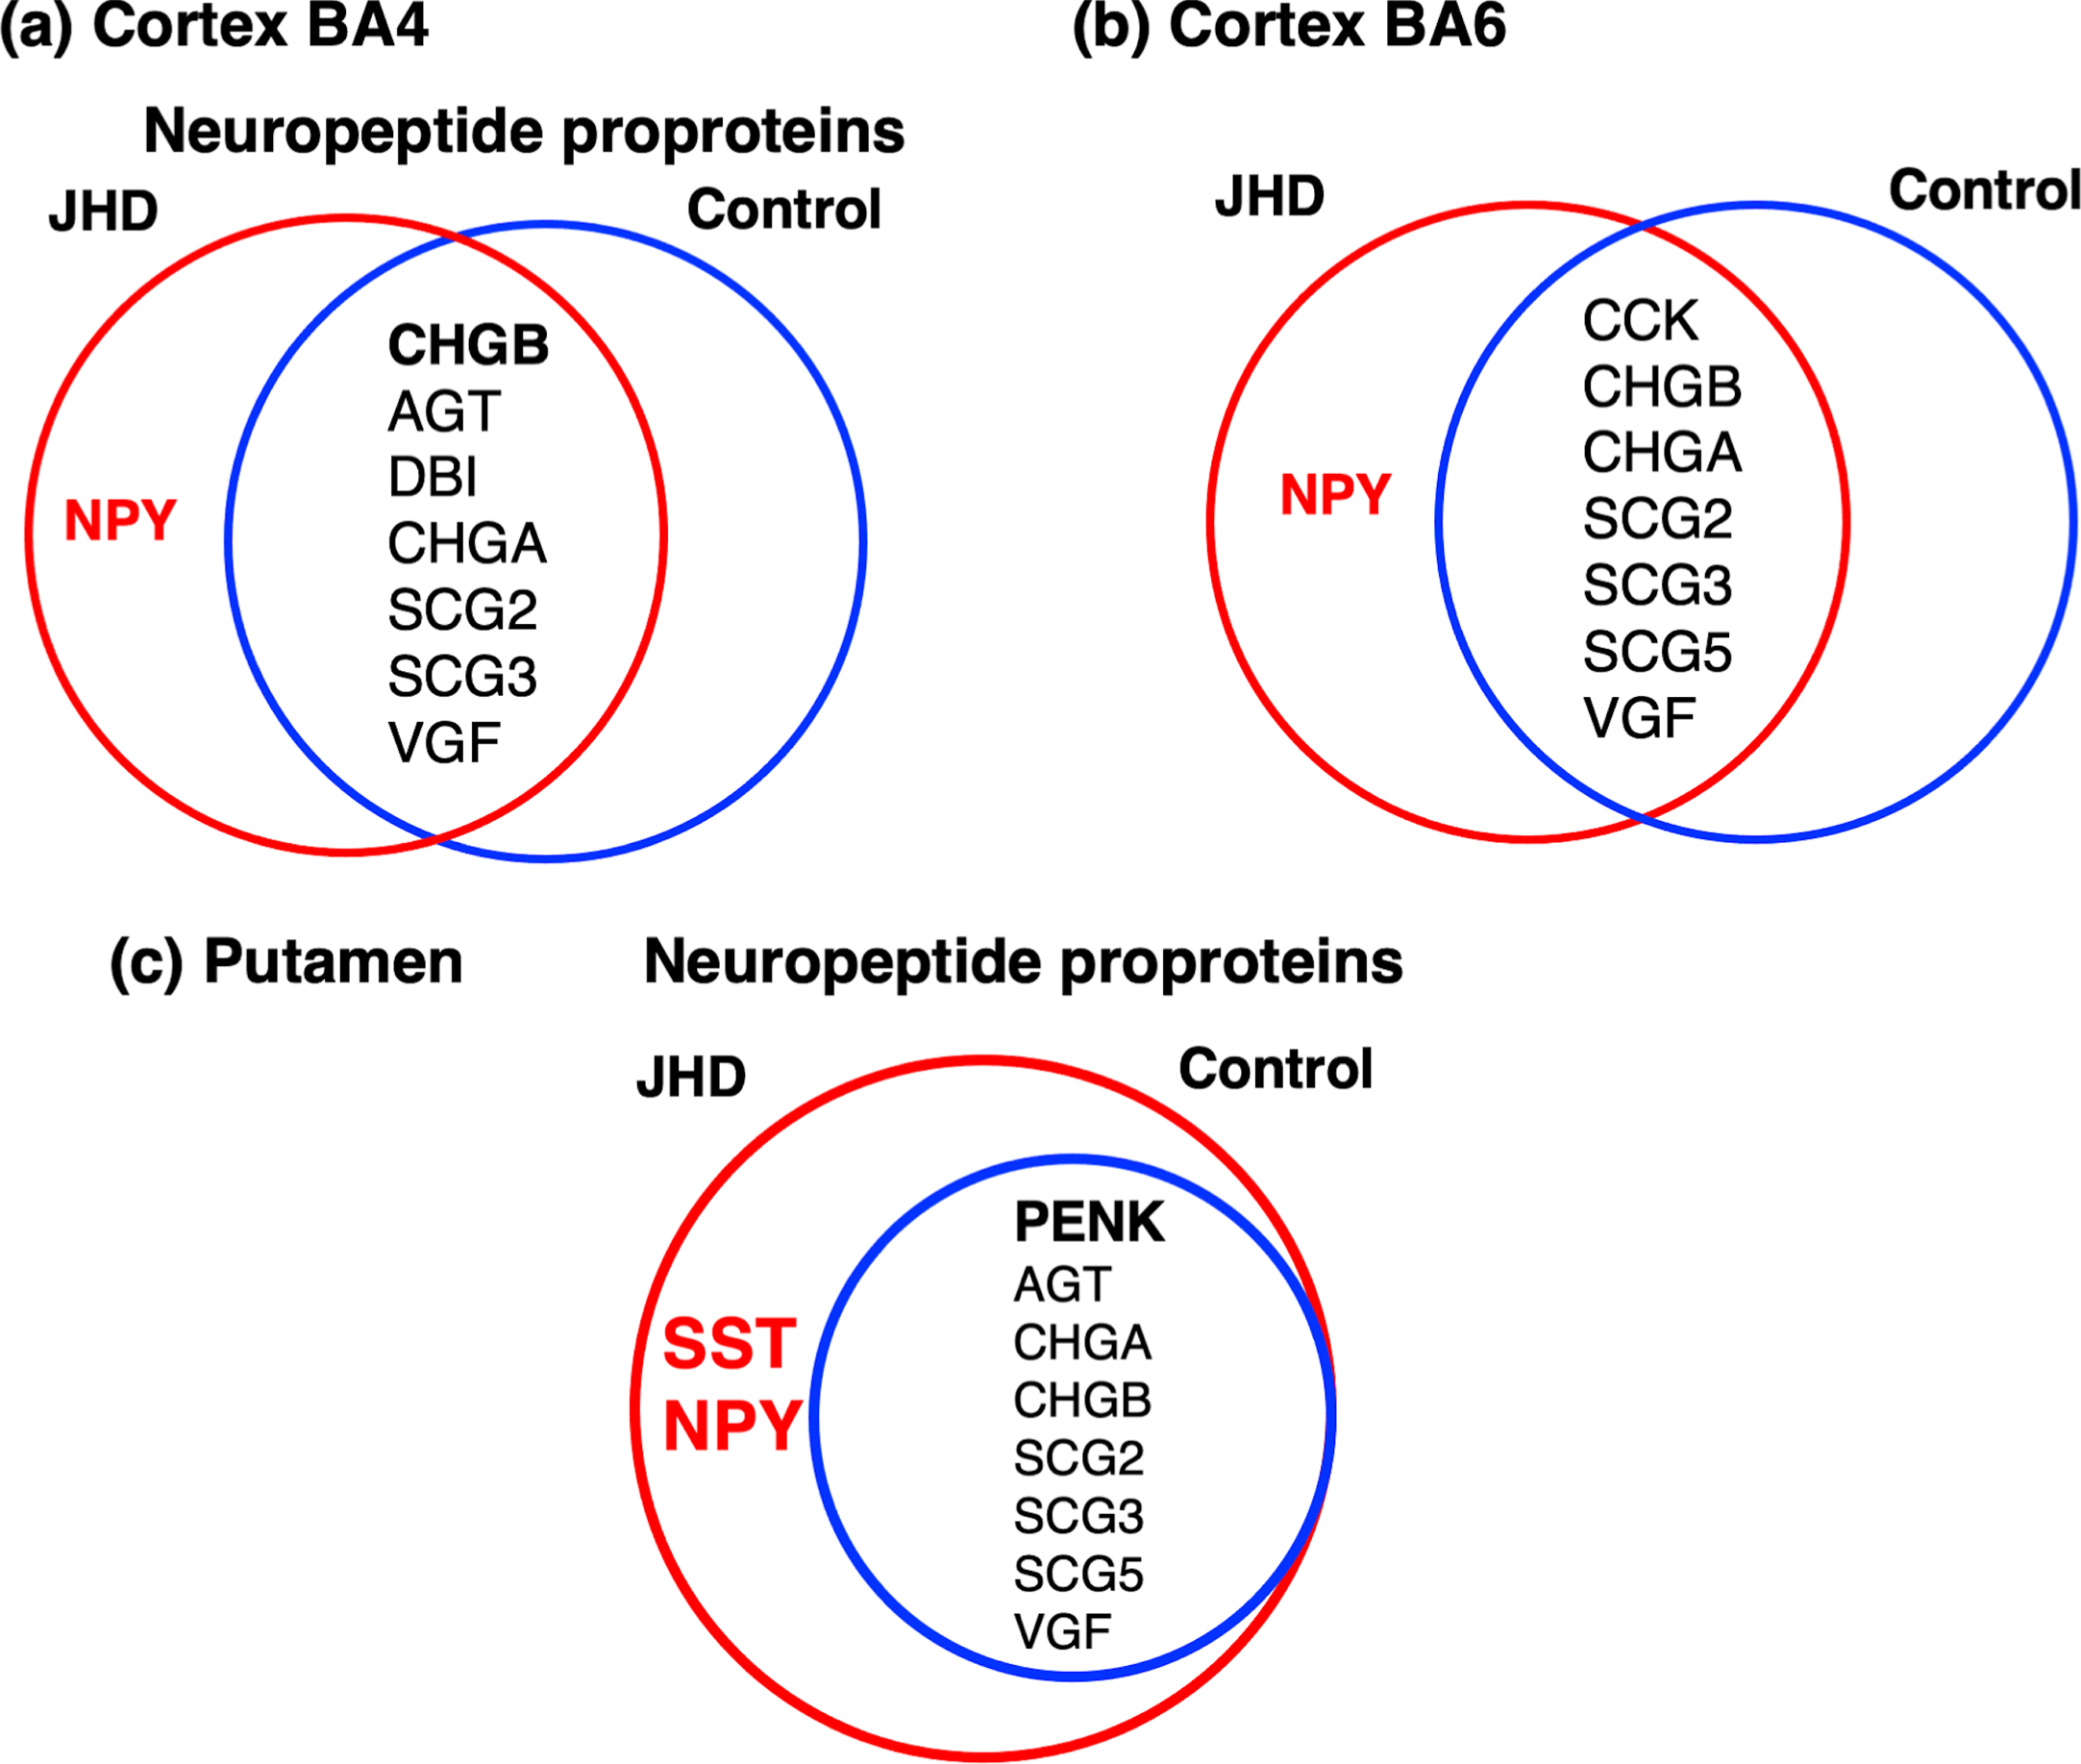
Dysregulated proneuropeptide signatures for neurotransmission in JHD cortex (BA4 and BA6) and putamen brain regions. (a) Cortex BA4 neuropeptide proproteins in JHD compared to control. BA4 neuropeptide proproteins in JHD and control were compared by Venn diagrams, showing numerous neuropeptide proproteins shared in JHD and control, with the exception of NPY (neuropeptide Y) that was found in only JHD (not control). (b) Cortex BA6 neuropeptide proproteins in JHD compared to control. BA6 neuropeptide proproteins in JDH and control were compared by a Venn diagram. Results show numerous neuropeptide precursors present in both JDH and control, with the exception of NPY that was present in only JHD. (c) Putamen neuropeptide proproteins in JHD compared to control. Putamen neuropeptide proproteins were largely present in both JHD and control groups, with the exception of NPY and SST (somatostatin) that were present in only JHD.
In the putamen, somatostatin (SST) and NPY were found only in JHD, with proenkephalin (PENK), chromogranin B and other proneuropeptides shared between JHD and control (Fig. 10c).
Taken together, these data suggest roles for NPY, SST, CHGB and PENK in peptide neurotransmitter dysfunction in JHD.
DISCUSSION
Human JHD brain molecular pathway mechanisms were assessed to evaluate the hypothesis that proteome dysregulation occurs in JHD in brain cortex and putamen (striatum) regions that are involved in regulating motor functions. Global proteomics analyses were conducted for cortex (BA4 and BA6 areas) and putamen brain tissue from JHD and age-matched controls. In each brain region, more than 3,000 proteins were identified and quantified. Groups of proteins were found to be unique to JHD, unique to control but absent in JHD, with the majority of proteins shared between the JHD and control groups. Bioinformatics analyses revealed diverse functions of proteins dysregulated in JHD that consisted of mRNA regulation, translation, cell signaling, inflammatory response, synaptic regulation and others. Significantly, mitochondrial proteins involved in oxidative phosphorylation were downregulated in these three brain regions, showing deficits in NADH dehydrogenase and cytochrome c oxidase. Furthermore, the neuropeptide precursors including NPY and SST were dysregulated in the cortex and putamen, suggesting a role for peptide neurotransmission in synaptic dysfunction in JHD. This study provides comprehensive analysis of dysregulated proteomes of cortex and putamen brain regions in the severe early-onset JHD condition of HD
The JHD brain tissues used in this study displayed one HTT allele of 60 to 120 CAG repeats, and another HTT allele with the normal CAG repeat range of 12 to 19 repeats. These data show that JHD has a broad range of 60 to 120 CAG repeats within the HTT gene. The presence of one mutant expanded allele and one normal HTT allele demonstrates the autosomal dominant nature of the HTT gene mutations in JHD.
JHD deficiencies in proteome components of the mitochondria electron transport system for ATP energy production and metabolism were observed in JHD cortex of the BA4 and BA6 regions, and putamen. KEGG pathway analysis of complexes I to V of the mitochondrial electron transport system for oxidative phosphorylation revealed the absence and downregulation in JHD of the multi-subunit complexes of NADH dehydrogenase complex in the BA4 and BA6 cortical regions, and downregulation of components of the cytochrome c oxidase complex in the putamen region. These complexes are necessary for synthesis of ATP as the critical energy source for functional brain activities and behaviors. The severe deficits in mitochondrial components in JHD are consistent with impaired energy regulation and weight loss suffered in HD [1, 24].
HD-related mitochondria dysfunction has been demonstrated in cortex and striatal brain regions of several mouse models of HD that express high CAG repeat numbers of the HTT gene [25–27]. Thus, these mouse models represent the JHD condition of HD. Mitochondria deficiencies have been observed in cortex and striatum of the R6/2 mouse model, expressing 144 CAG repeats of HTT, whereby the findings indicated brain defects in mitochondrial volume, ROS production, and mitochondrial respiration [25]. In addition to the R6/2 HD model, the YAC128 mouse model of HD, expressing 128 CAG repeats within HTT, also showed differential expression of brain cortex proteins involved in oxidative stress, oxidative phosphorylation, the citric acid cycle involved in energy metabolism, and related [26]. Differential expression of mitochondrial proteins has also been observed in brains of the HdhQ150 and HdhQ92 HD knock-in mouse models of HD, expressing 150 and 92 CAG repeats of HTT [27].
It is of interest that JHD cortex of BA4 and BA6 areas displayed dysregulation of proteins associated with synaptic functions including vesicles and secretion. The JHD proteome included proteins that function in vesicle and extracellular processes. These synaptic functions utilize neurotransmitters for neuronal signaling for communication among brain neurons. Our investigation of neuropeptide precursors in the human JHD cortex and striatum found altered NPY and SST. In HD mouse models expressing high CAG repeat numbers in the JHD range, differential expression of proteins involved in neurotransmission were observed in brain cortex and striatum of the R6/2 HD mouse model [28, 29].
Neurotransmission utilizes peptide neurotransmitters as the major group of chemical neurotransmitters which are essential for brain neurotransmission and activities. In this study, results showed that the peptide transmitter NPY was uniquely present the human JHD cortex and putamen, but not in age-matched controls. NPY has been found to be elevated in CSF from HD patients compared to healthy controls [30]. Of interest is the finding that intracerebroventricular (icv) injection of NPY in R6/2 HD mice has a beneficial effect on motor behavior and brain tissue atrophy [31]. These findings suggest that the unique presence of NPY in human JHD cortex and striatum reflects a neuroprotective mechanism [32] to combat the JHD disease condition.
It will be worthwhile in future experiments to focus on synaptic neuropeptidomes and metabolome profiling of neurotransmitters to gain understanding of the synaptic chemical signatures for neurotransmission in human HD as well as in animal models of HD. Determination of neuropeptide signatures in human brain can be achieved by neuropeptidomics, as shown recently for human Alzheimer’s disease brain synaptosomes which display dysregulation of neuropeptides and proteome components [17].
It will be of interest to compare the human JHD brain proteomics changes with human adult onset HD. But such a comparison is not possible at this time since prior proteomics studies of human adult HD assessed brain regions other than the BA4 and BA6 cortex regions and putamen that were evaluated in this JHD investigation. Nonetheless, a summary of such prior studies indicates that dysregulation of mitochondria, signaling, cell stress and apoptotic systems were dysregulated in human adult HD brains [33–36]. Proteomics assessment of HD superior frontal gyrus, a brain region associated with working memory, identified dysregulation of proteins related to mitochondrial dysfunction, Rho-mediated signaling, integrin signaling, endocytosis, axonal guidance, DNA/RNA processing, and protein transport [33]. A study of HD substantia nigra showed decreased proteins associated with oxidative phosphorylation, and increased proteins associated with cell stress response and apoptosis [34]. Cortical brain regions involved in language comprehension and the visual cortex had increased cell stress and apoptosis proteomes, while mitochondrial components were decreased [35]. Antioxidant enzymes as well as markers of oxidative stress were found to be increased in HD striatum [36]; such antioxidant proteins were not found to be dysregulated in JHD cortex (BA4 and BA6) or putamen based on data of this study. Clearly, to gain a more complete comparison of JHD and HD brain systems, it will be useful for future investigations to analyze proteomics data acquired from human JHD and HD brains for the same brain regions at early to late stages of the disease.
This proteomics study characterized protein components of broad ranges of abundances from high to low levels. It is possible that very low abundance proteins may be observed by enrichment through fractionation and concentration prior to nano-LC-MS/MS of samples subjected to tryptic digests. Future enrichment strategies may find very low abundant proteins that were not observed in this study in the JHD group or not observed in the control group. Thus, future enrichment approaches can enhance understanding of proteomic regulation in JHD.
In summary, this study demonstrates significant dysregulation of human JHD cortex (BA4 and BA6) and putamen proteomes which display deficits in mitochondrial electron transport and neurotransmission processes compared to age-matched controls. Achievement by this study of advancing understanding of molecular mechanisms of the severe JHD form of human HD can lead to future new drug targets and therapeutic strategies.
Footnotes
ACKNOWLEDGMENTS
Human JHD and age-matched control human brain tissues from the cortex and putamen regions were provided from brain banks of the Harvard Brain Tissue Resource Center (HBTRC), the HDSA Center of Excellence at the University of Washington, the HDSA Center of Excellence at the University of Miami, and the HDSA Center for Excellence at the University of Pittsburgh. Review by our Institutional Review Board for human subjects has indicated that the use of unidentified human tissue samples is exempt for this project.
FUNDING
This research was supported by a grant from the Huntington’s Disease Society of America (HDSA) to S. Podvin, C. Mosier, and V. Hook. Leigh-Ana Rossitto was supported in part by the UCSD Graduate Training Program in Cellular and Molecular Pharmacology through an institutional training grant from the National Institute of General Medical Sciences, T32 GM007752.
CONFLICT OF INTEREST
The authors have no conflict of interest to report.
DATA AVAILABILITY
For proteomics data, LC-MS/MS files can be accessed through http://www.massive.ucsd.edu with identifier number MSV000091664.