
Abstract
People express opinions or convey some emotion in a form of communities in a specific social network such as Twitter, Facebook, and Google Plus and so on. Researches have applied link analysis to capture clusters or detect communities, as well as mine and analyze sentiments published on the Web. Most previous approaches are lack of evaluating the reliability of the information and exploring the specialty in specific areas. Besides, the user possessing low authority value does not mean he/she still has lower authority in his/her own community. Motivated by that, a synthetic method is proposed to extract domain experts through analyzing the information on the Web and in-degree and out-degree of the set of nodes in the large social networks. In addition, we consider the temporal factor in the process of optimizing the final objective function. Experimental results indicate that our proposed method DEM-RLA, focused on the reliability of information and authority of users in a small community of a complex social network, is very useful for the prediction of domain experts. According to this research, we offer a more comprehensive insight for the task of mining domain experts in a complex network.
Introduction
In recent years, dynamic and heterogeneous social network such as Twitter, Facebook, and Google Plus, maintains the popular position due to the ability of exhibiting individual or organization relationship on the Internet. As we known, more and more users participate in the social network they prefer. And a considerable amount of multimedia information is published on the social network. For examples, there are a total of 140 million active users who publish about 340 million tweets by the end of March 2012 1 . And according to the statistics, there are also about a dozen billion of active users registered on Facebook until Sep. 2012 2 . The data information generating on Facebook every year reaches up to 180 PB. Therefore, it is of great value and significance to discover, understand and analyze them. Since user behavior usually displays in the form of groups instead of individuals, communities or clusters detection, which is typically thought of detecting a group of nodes with more and/or better interactions amongst its member and the remainder of the network [1–3], plays an extremely pivotal role in dynamic and heterogeneous social network.
In applications, community detection can be applied to organize data (e.g. targeted marketing [4], e-commerce [5], and personalized recommendation [6]). In DBLP dataset, all the article information is reliable. However, a plenty of rumor, gossip and spam exist on the Internet making the whole Web environment become unconvinced. Analyzing the reliability of the contents on the Web is indispensable. In addition, some algorithms are come up with to calculate the center of a community. In a sense, it often leads to ignoring the domain dependency of a node. For example, there might exist multiple experts in a social network. We could capture a user with high authority and hub value, which means many important users are his/her followers and he/she is likely to follow many influential users. Like in the domain of computer science, a professor in computer science would probably not be an expert in economics. The contents they publish in other areas on the social network are of either few or relatively low reliability. In Fig. 1, the users in the left community exhibit positive attitude towards Web page p1 and p2, but show negative or uncertain attitude towards Web page p3 and p4. On the contrary, the users in the right community support p3 and p4, but are against of p1 and p2. Which side should we believe? Obviously, it depends on which side is the corresponding expert of in the specific domain.
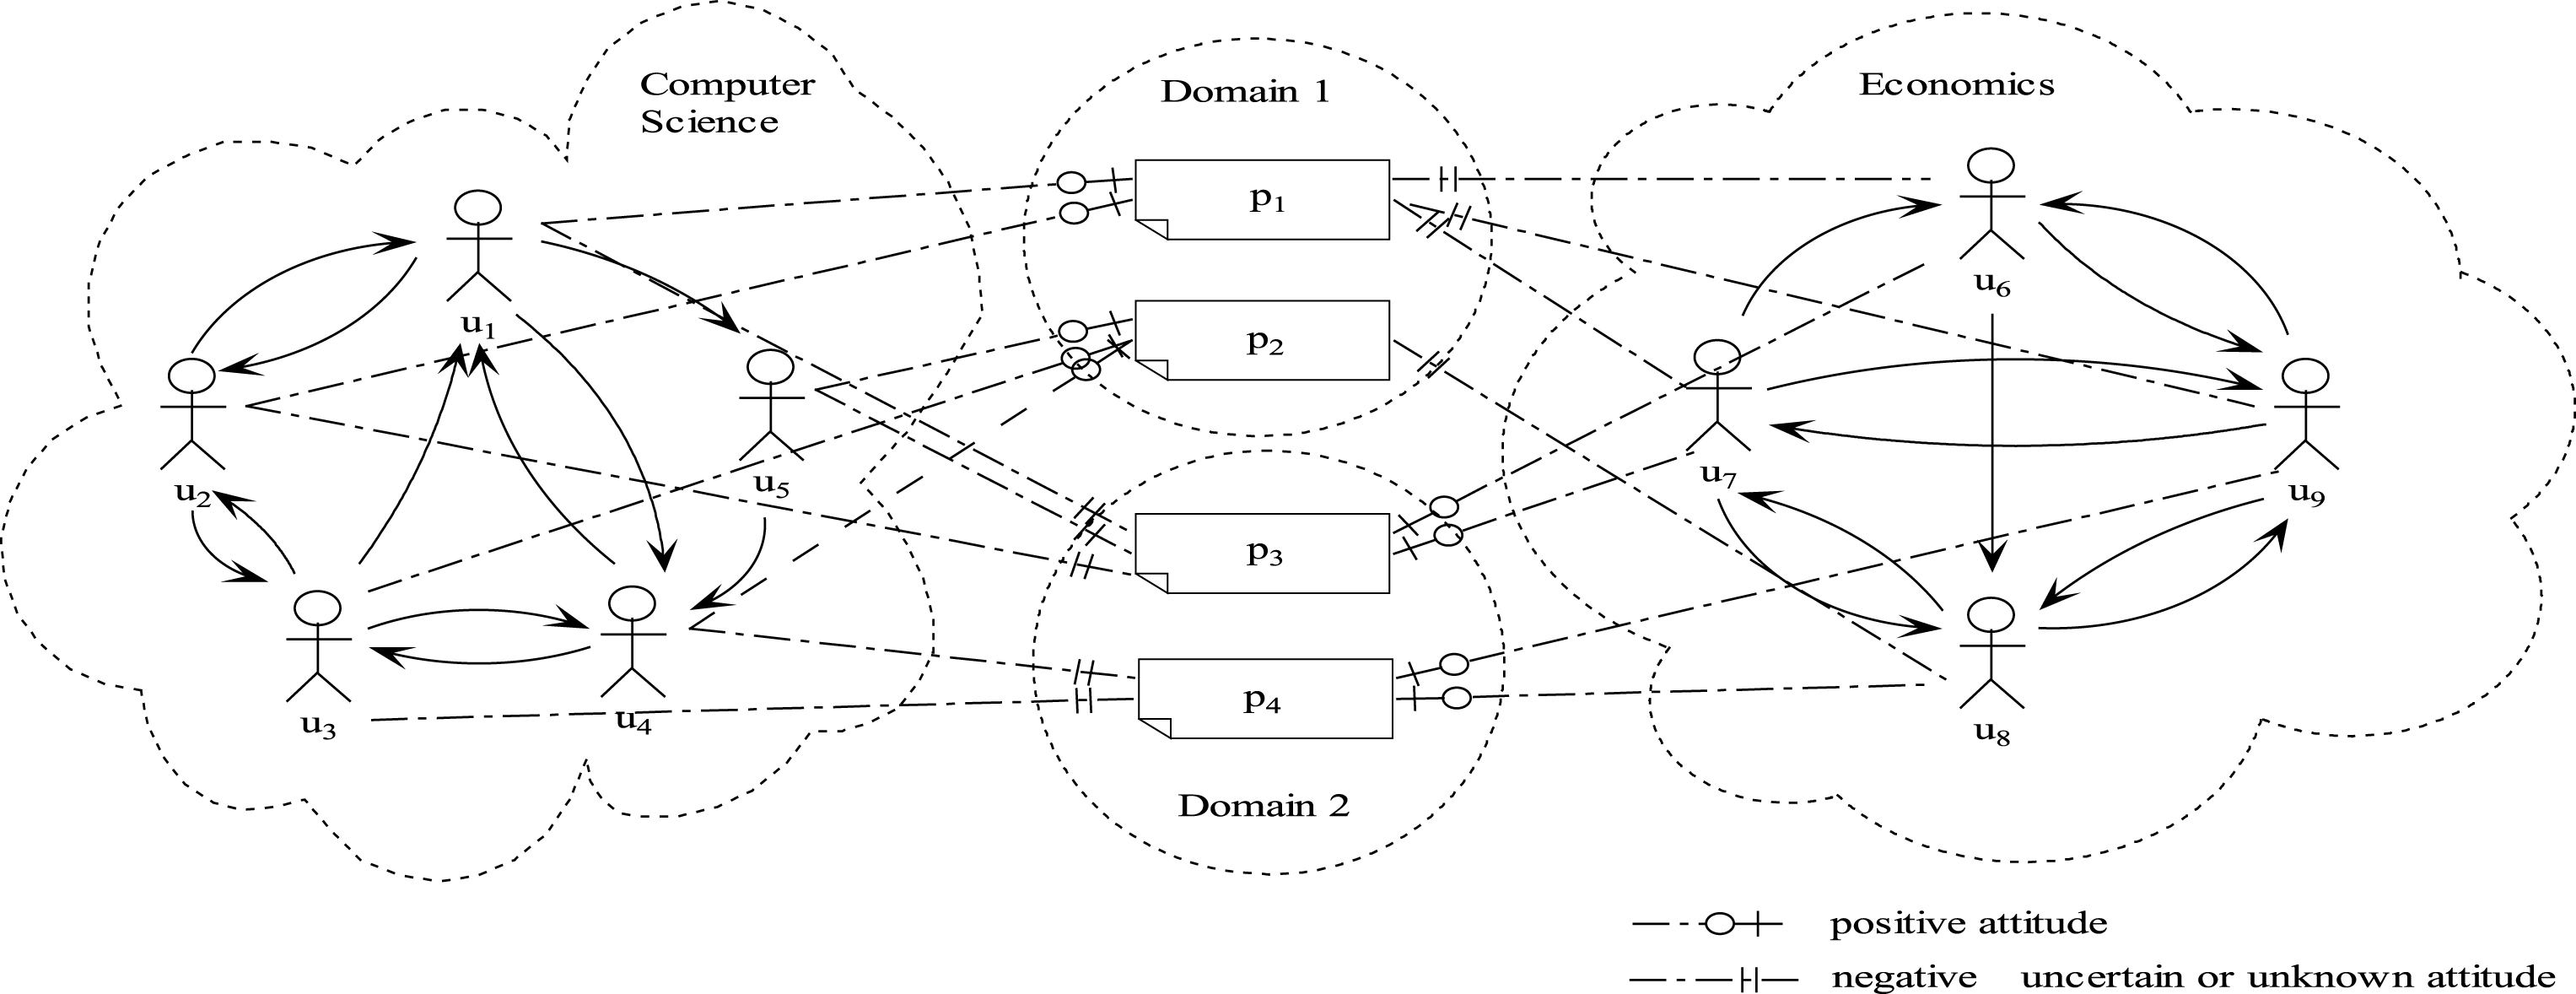
Illustration of the importance of dividing domains in community detection.
The main challenge of content-based community detection lies in how to integrate nodes, edges and contents in the social network, where multiple types of nodes and edges make the social network become heterogeneous. To reach the goal of extracting domain experts through analyzing the information on the Web and in-degree and out-degree of the set of nodes, we explore a novel community detection method for domain expert mining based on reliability and link analysis (DEM-RLA), where node content, node relationship, and temporal factor are embedded in a seamless way. In the process of DEM, an approach for calculating the coverage rate is put forward. It first identifies the reliability of each record published by each user. Then, an objective function called TrustRank is proposed to evaluate the reliability of each user in the specific topic. For each topic, the temporal factor is considered by introducing a time function to differentiate the new users and old users. At the stage of calculating the coverage rate, a dataset for comparison needs to be built in advance. Whether the experimental results could have directive significance is greatly influenced by the quality of the comparative dataset. Previous community detection methods usually adopt different clustering approaches to divide communities. In this paper, we use an objective function to replace the clustering process, which would improve the time complexity to some extent. The top-k domain experts are determined by the final TrustRank value. Different top-k users are captured by different topics. Hence, a user could be attached to several communities. Our method is also appropriate for overlapping community detection. The contributions of this paper are summarized as follows: We propose a novel community detection method for domain expert mining based on reliability and link analysis, where node content, node relationship are embedded in a seamless way. We define a measurement called coverageRate to evaluate the reliability of the content published by a specific user in a social network. A temporal factor, which is used in the process of optimizing the final objective function, is introduced to describe the dynamics of the whole social network. The experiments demonstrate that the effectiveness and efficiency of DEM-RLA, in comparison with other state-of-the-art approaches.
The rest of the paper is organized as follows. Section 2 introduces the related work. Section 3 details how to combine reliability and node-link analysis to extract domain expert. In addition, overlapping communities are discovered by optimizing the objective function in the model of DEM-RLA. Several experiments are conducted in Section 4, in which different evaluation metrics are adopted to show the feasibility, effectiveness and efficiency of DEM-RLA. Section 5 draws the conclusions.
Community detection has always been one of the most essential problems in the field of social biological network mining [1, 8]. Most previous researches merely concentrate on the analysis of graph-based community detection [9–11]. Yang et al. [11] presented an algorithm called CESNA, which took account of both hard node community membership and the dependency between the communities. Yang et al. [12] introduced an approach PMC which conducted community detection by a heuristic random walk method. The methods above are all probability-based. And, one disadvantage is without analyzing the reliability of the contents on the social network. In other words, these approaches above fail to cluster the nodes into communities with the consideration of topic or contents. As we can imagine, users with common interests tend to be easier to group together. Therefore, collecting and analyzing the contents published by the users is indispensable.
Semantic social network, as a form of social network, has arisen much more attention of the researchers. Many representative algorithms were proposed, such as ARTs [13], SemPostLP [14], and SNA [15] so on. Since semantic social network includes many human opinions, it is of great significance when conducting community detection both in theory and in practice. Xin et al. [16] presented a clustering algorithm for semantic social network based on semantic link weight depending on the analysis of link-field-topic. It also solved the problem of overlapping community detection. Bravo-Marquez et al. [17] proposed a sentiment classification method based on meta-level features, and studied how the different sentiment scopes complement each other such as subjectivity, polarity, intensity and emotion. Wang et al. [2] presented a content-based network called Node-Edge Interaction network. They thought that there was plenty of information encoded in node content and edge content, which was important to capture meaningful community network with rich semantics. Sun and Lin [18] came up with a probabilistic generative model to detect the latent topical communities which put emphasis on friend recommendation and tag recommendation.
Apart from that, the behavior of individuals would influence each other in the whole Internet environment. Take a simple example, the authority score interacts with hub score in HITS [19]. Researchers could also predict user behavior by utilizing the interaction between users. Levchuk et al. [20] applied graph matching algorithms to explore social interactions, which was used to classify the behaviors of multiple individuals. Frey and Jojic [21] compared a series of graph-based algorithms for inference and learning. Compared to overlapping community detection, non-overlapping community detection methods could not satisfy the requirement of accuracy to a large extent. This paper applied a heuristic interactive objective function to conduct overlapping community detection. In addition, judging whether a node belongs to a specific group could be used to lots of applications [22, 23]. Wan et al. [24] proposed a typed communities by utilizing labels of relationships between users to help mobile operators to do precision marketing. It also could be applied to citation networks, trend prediction, personalized recommendation, and so on.
There is considerable contribution both on the approaches and evaluation metrics for community detection. We could not enumerate all of them. We just discuss several representative ones in this paper. Newman [25] first provided the concept “modularity” which was known as one of the approaches that could maximize the benefit function. Also, NMI [26] is a widely used evaluation metric for calculation the accuracy of the detected communities. Havens et al. [27] proposed a fuzzy modularity function of soft community in the situation that there were fuzzy or probabilistic clusters exhibiting in a social network. There are a lot of other effective evaluation metrics such as purity, accuracy, ARI, rank index and so on.
Overlapping community detection using DEM-RLA
The entire social network is represented as a directed graph G = (V, E) where V denotes the set of nodes and E indicates the set of edges. In this paper, each node u i represents a user in the social network. e (i, j) is the link from user u i to user u j . It means u i is the follower of u j . Suppose that the total number of users in a social network is n, that is n = |V|.
A large amount of tweets, blog or comments will be published on a specific social network. Similar to the references and the articles to be cited, a user may be the follower of some person that he/she is interested in and he/she can be followed by many other users who are interested to them. However, users are professional or specialized in different domains at a different level. For example, an economist could write many articles about financial problem on the Web according to his/her professional knowledge. Also, due to his/her specialty, he/she may give some comments which, of course, would be more credible than the ones given by other amateurs. However, he/she might not be an expert at other domains, which leads to less professional comments. The importance of an amateur user in the whole social network is not equal to the importance of a specialty in a specific field. Therefore, a function TrustRank is introduced in this paper to describe the trustworthy degree of a user in a specific field. For a specific topic, the TrustRank score of each u
i
(denoted by R
topic
(i)) is calculated by Equation (1) as follows.
Traditional analysis of social network structure does not consider the reliability of the information published on a social network. We use matrix A to represent the adjacent matrix of the entire social network. And Fig. 2 illustrates the importance of classifying information into several domains.
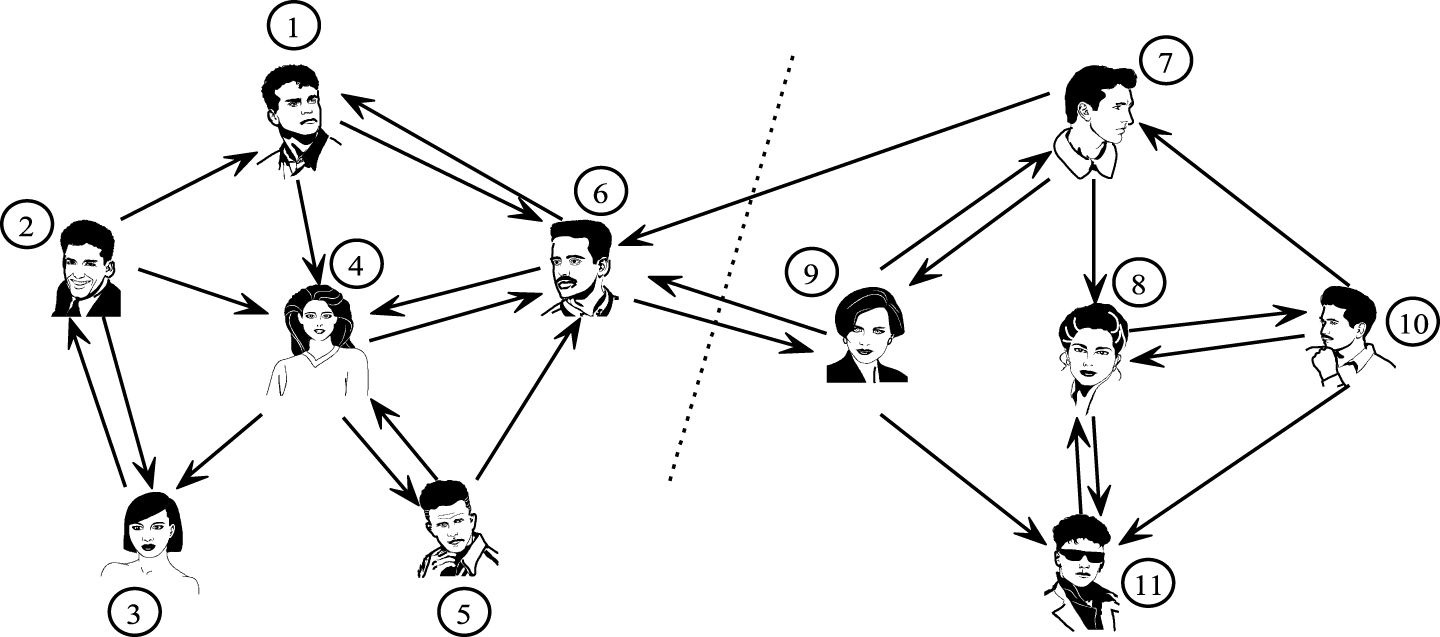
Illustration of the importance of partitioning areas for mining domain experts.
A
ij
denotes user u
i
is the follower or observer of user u
j
defined as follows.
We define a vector R = (R (1) , R (2) , …, R (n))
T
to describe the TrustRank score of each u
i
. If we do not capture the semantics in the social network, the Equation (1) would be The adjacent matrix of Fig. 2.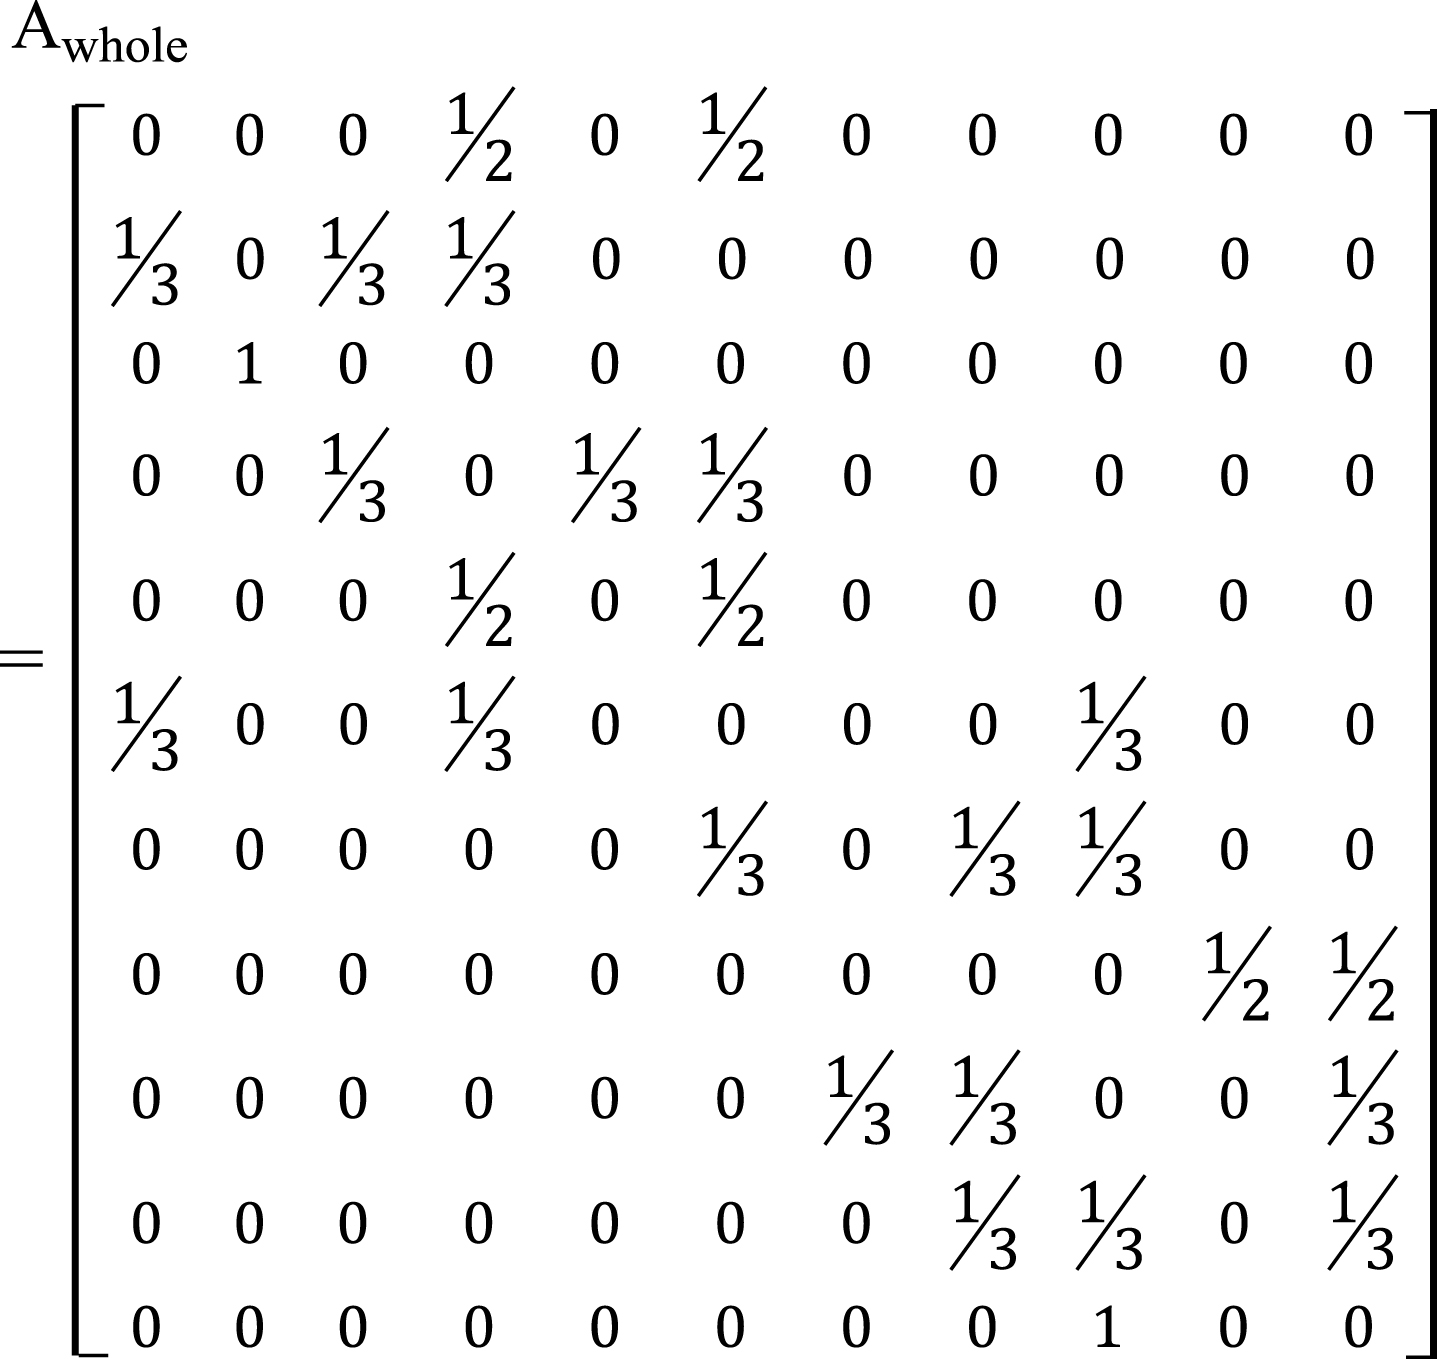
Equation (5) describes the TrustRank score of each user in the whole community in Fig. 2. Equation (6) describes the TrustRank score of each user in the left community in Fig. 2 and Equation (7) describes the TrustRank score of each user in the right community in Fig. 2. In the left community, after seven iterations, the highest vector component is 1.3325 belonging to No. 4 user instead of No.6 user. Similarly, No. 8 user is regarded as the center of right community after six iteration.
Therefore, classifying users into several domains according to the information published by them is necessary. How to calculate Cov
topic
(i), which is the coverage rate of the related Web page contents published by u
i
in a specific topic, is discussed later. Dynamics, as a pretty important property, describes the social network changing constantly. The authority of a user will not always exist or last. It is easy to imagine that old users probably accumulate more followers to some extent since they exist on a social network for a relatively long time. While the new users, who publish a few high-quality blog, tweets or comments, might get lower TrustRank value only because they have fewer even no followers. So, a time parameter α is introduced to optimize the objective function.
α is set by a function of time f (t) (0 ≤ f (t) < 1), where t is the difference between the time when the user is created and the time when the social network is established. Then, we get the final TrustRank formula as follows.
According to the analytic results from Pear Analytics [28], there are about 40.1% of the gossip without a purpose and 10% of spam and self-promotion in twitter. Only about half of the information in this social network can be used to extract, integrate or analyze. Hence, it is important to come up with an effective method to extract relative domain knowledge and determine the domains or areas that users are expert in.
First, we should extract texts that are both useful and relevant. Useless, irrelevant, or redundant information would impact the final coverage rate. Among the training texts crawled from the Web, the documents that users are interested in are called positive documents (denoted by P = (dp1, dp2, …, dp S P )). Accordingly, the remaining documents are regarded as unlabeled documents (denoted by U). It is needed to use our designed classifier to obtain the relevant information and remove the useless information such as gossip, spam, and self-promotion [29]. Second, reliable information should be mined to calculate the reliable degree of a user. Term weighting can effectively inflect the importance of a term or feature in a document. TFIPNDF [30] is adopted in this paper to calculate the term weighting value of each word in the training dataset. It is composed of two parts:
The records, which are identified as positive in the test dataset, are denoted by P test . For each term w in P, the final corresponding term weighting x w = max { x dw } (1 ≤ d ≤ S P ). The terms or features are sorted in the order of descending TFIPNDF, that is term weighting. Then we extract top 50 features and put them in the collection Ψ as representative features to guide how to obtain the valuable information in the social network. Here Source i (S) is used to represent the set of source documents or pages published in P test from u i in a specific social network. Target i = (ti1, ti2, …, t im ) (denoted by T) is the set of relevant and reliable documents, comments or Web pages extracted from Source i . The documents, comments or Web pages in S are put into T iff (1) the document in S contains any one of the features in Ψ, and (2) the document in S is associated with a tag that belongs to our interested topic.
For each item in Target i , we adopt the equation below to calculate the corresponding coverageRate h (1 ≤ h ≤ m) and the overall coverage rate Cov topic (i) of all the comments published by u i . When the maximum of cosine similarity between a record published by a user and any one of documents in the positive data set is greater a threshold δ, we consider this record is a reliable one and the coverageRate is set to one so that it would not affect the final accuracy of Cov topic (i). Otherwise, we let this record maintain its original coverageRate. The calculation process is described as follows.
subject to 1 ≤ h ≤ m, 1 ≤ k ≤ S P
where,
Then we get the final Cov
topic
(i) as follows.
The parameter λ adjusts how much the coverage rate of each record impact the final reliability of a user. In this paper, λ is set to 0.5. Algorithm 1 summarizes the procedure for calculating Cov
topic
(i) of each user. All the users in the social network are used to construct the adjacent matrix
It is easy to understand that for a specific topic, the higher the TrustRank value is, the more authoritative the user is in his own community. The categories that users belong to are known by us in advance. We partition users in different categories according to the linkage structure and the contents they published. A category could have plenty of users and a user could belong to multiple categories. After detecting the communities, the TrustRank value is calculated again to extract the domain experts. In our experiments, top-k users are extracted to represent the experts about a particular domain. Obviously, a user could be an expert in multiple domains, which leads to the generation of overlapping community.
Another important question is how to collect the comparison dataset. The final reliability of a user largely depends on the completeness and authority of the dataset. In this paper, we crawl 2GB texts including 10 categories from news Websites, Wikipedia and some authoritative Websites, which are provided with time sensitive and authority.
In this section, we will validate DEM-RLA algorithm in effectiveness and efficiency by conducting a series of experiments in dynamic social network.
Evaluation metrics
To evaluate the effectiveness and efficiency of DEM-RLA, four performance metrics are utilized respectively, which are NMI [31], accuracy, modularity and running time. In addition, other metrics are described as follows.
Normalized mutual information is an information-theoretic based measurement built by Cover and Thomas. It is a widely used evaluation metric for measuring the similarity between two communities. Given two community partitions in a social network (denoted by
where p (h) and p (ℓ) are the marginal probability distribution functions of Clusters
Accuracy, as another popular evaluation metric, has been used to test whether all the possible pairs of nodes appearing at the same community [32]. Suppose a directed edge should be within the community. However, it is allocated to connect two different communities, we consider that it is a wrong case. A contingency table is used to describe all the situations as follows (as shown in Table 1). TP (True Positive), TN (True Negative), FP (False Positive), and FN (False Negative) represent the corresponding number in each case. h i denotes the community that user u i belongs to, and ℓ j denotes the community that user u j belongs to. Then, the accuracy of our community partition is defined as:
Contingency table of ground truth and experimental results
Modularity, proposed by Newman, considers the distribution of the nodes in the whole community. In addition, ignoring the direction of the edges would reduce the information accuracy. The Newman’s modularity [3] for directed graph G = (V, E) is defined as follows:
m is the total number of edges in G.
This paper proposes a knowledge reliability based and topic-based method for extract domain experts. The dataset, which is lack of semantic contents, would be not available for our experiments such as Zachary’s karate club [33], and American Football College [4]. We generate 100 M texts as our test dataset and utilize our Web crawler to download 2GB texts as our training dataset including 10 categories according to the Table 2. This dataset simulates the situation that there are 2*103 users in a social network, and each user publishes 50 records of blogs or tweets or Web pages. The dimensionality of each record ranges from 10 to 140. In addition, each record is corresponding to a series of features represented by the Feature_ID. Figure 4 plots the adjacent matrix of the user relationship on our dataset. The abscissa and ordinate represents the user ID. It can be seen from Fig. 4 that the community distribution of the users in Table 2 is obvious.
Illustration of a snippet of data format that stores User_ID, Record_id and Feature_ID
Illustration of a snippet of data format that stores User_ID, Record_id and Feature_ID
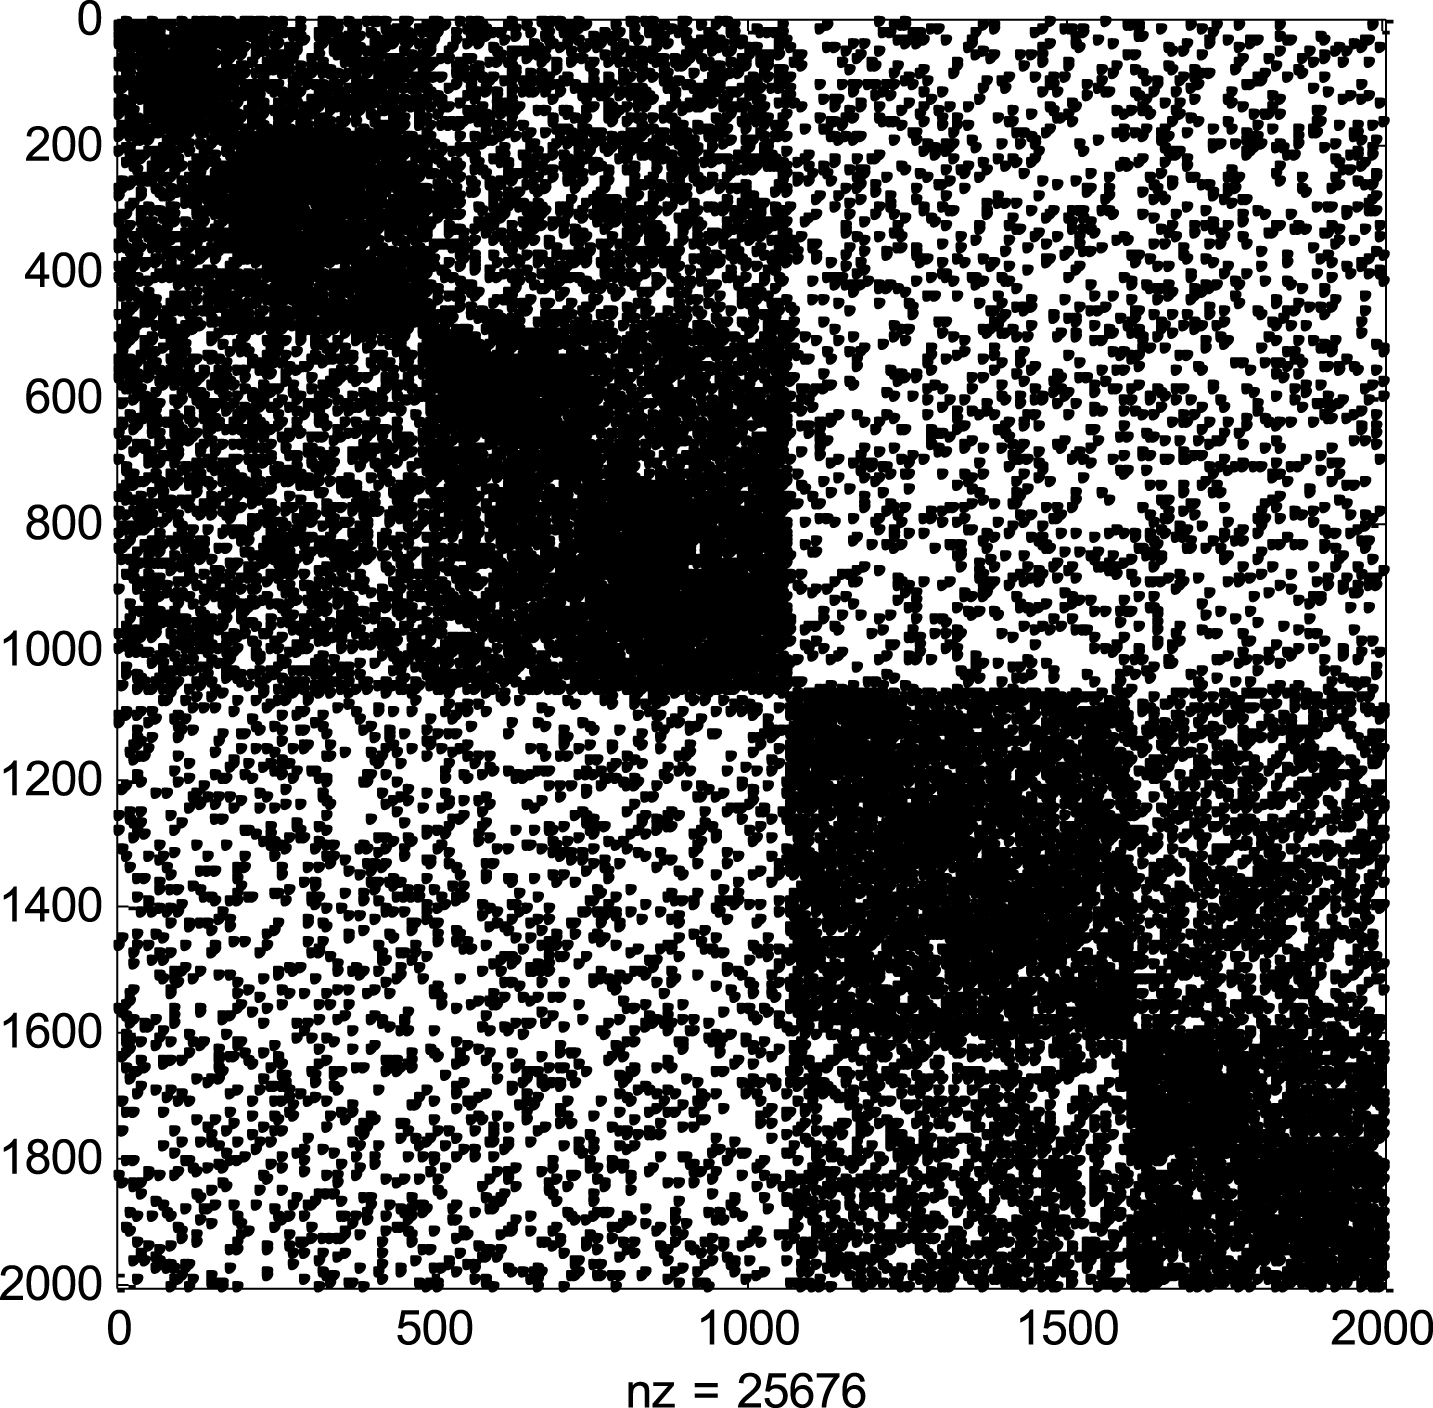
The adjacent matrix of user relationship on our dataset.
Scalability could illustrate the relationship between the problem scale and the number of processors quite well. In this paper, we illustrate the scalability of our proposed method from three perspectives: (1) data dimensionality, (2) processor number, and (3) community number. Figure 5(a-c) describe that DEM-RLA has good scalability.
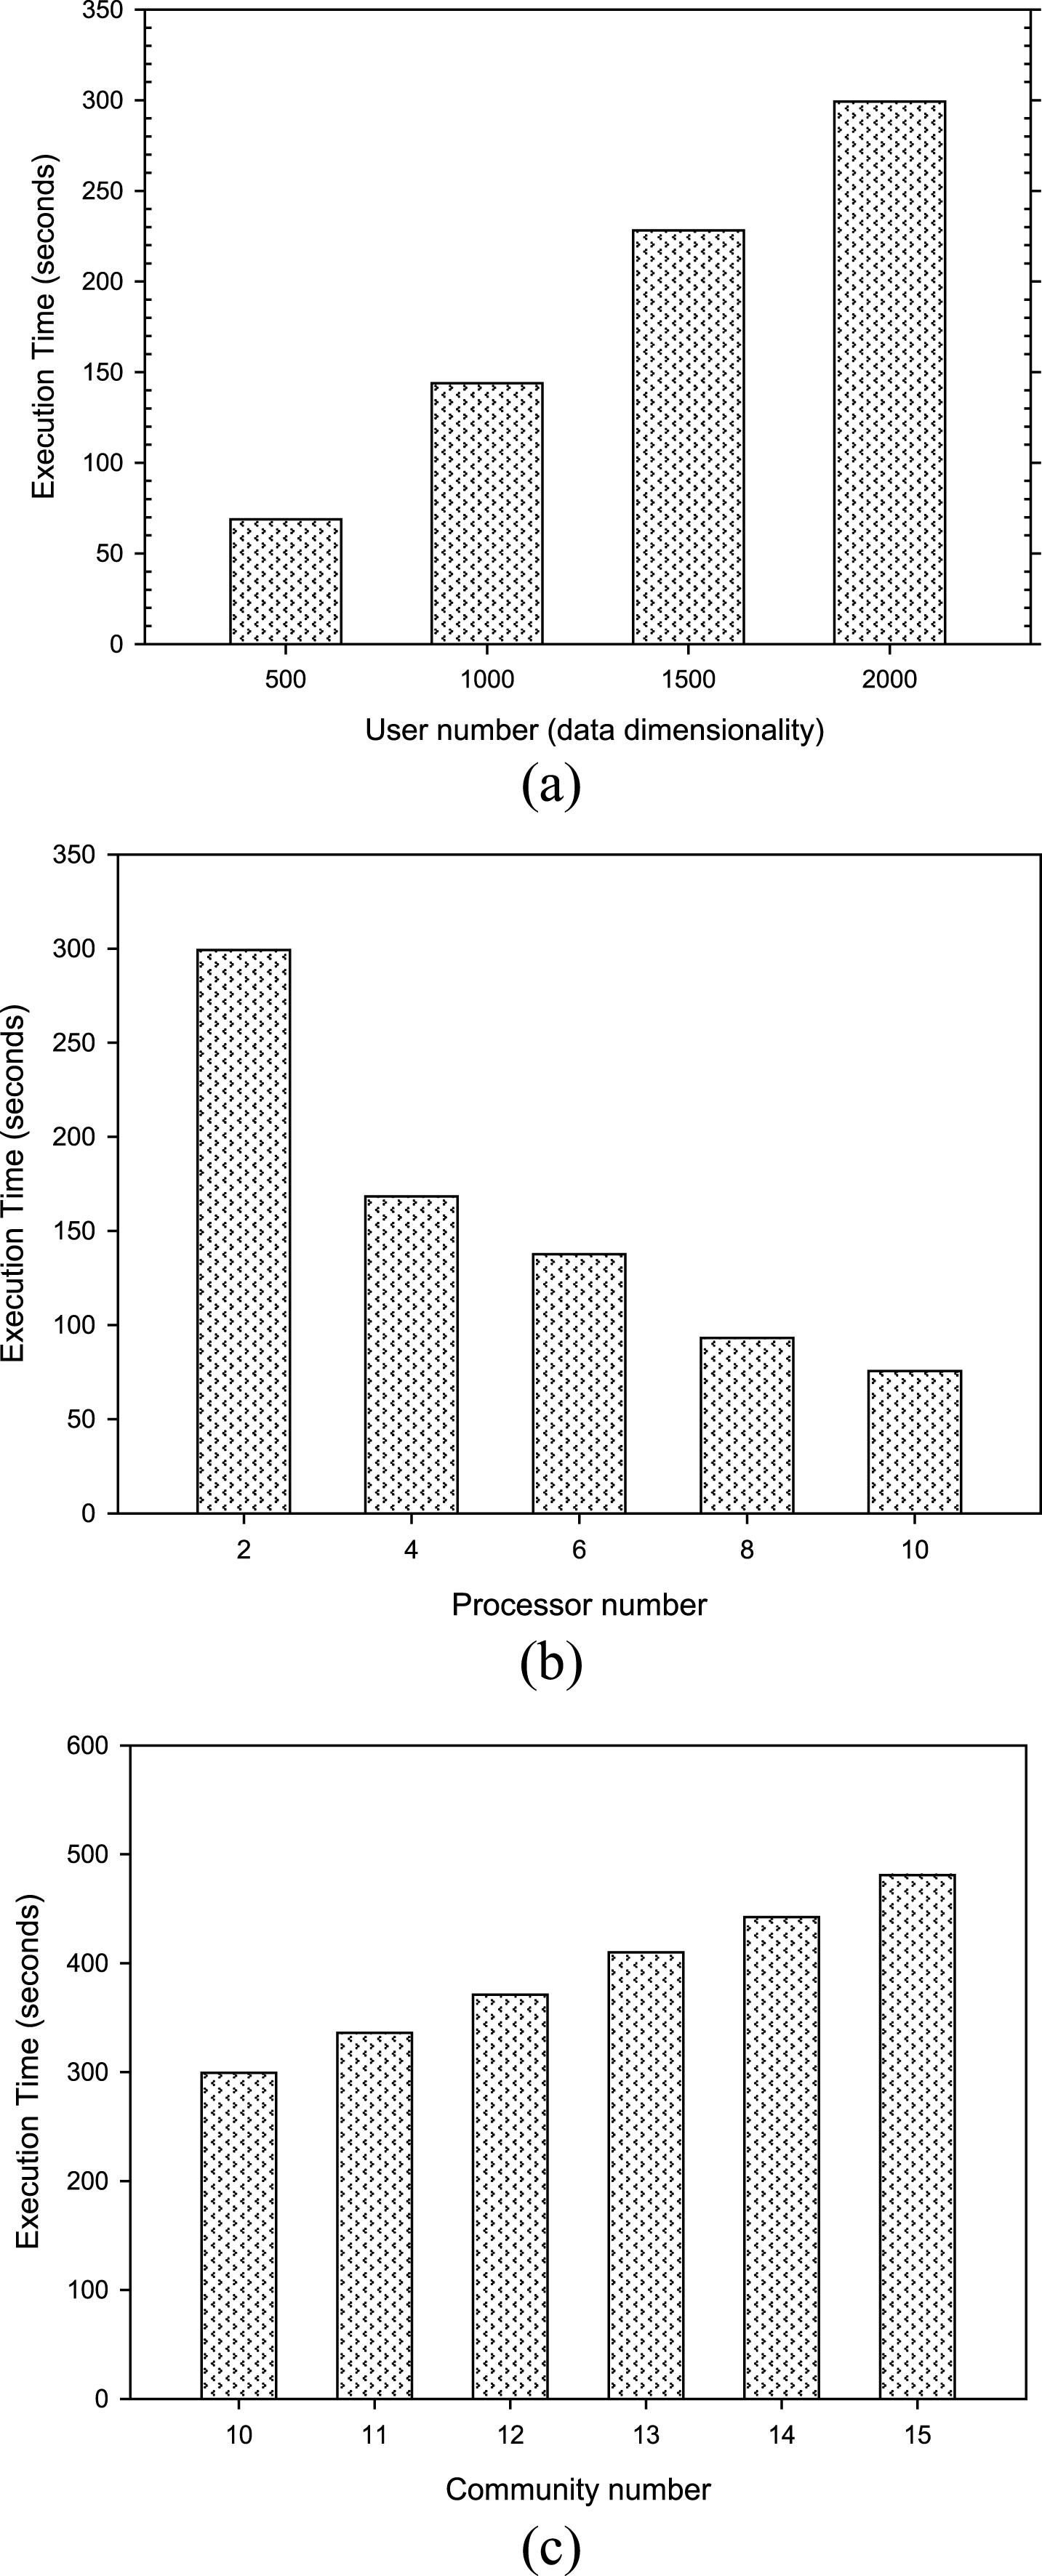
Evaluation of scalability on DEM-RLA model. (a) execution time vs. user number. (b) execution time vs. processor number. (c) execution time vs. community number.
Figure 5(a) shows that the number of processors remains unchanged and the number of data dimensionality (the number of users in the whole social network) increases from 500 to 2000. With the linear growth of data dimensionality, the execution time is almost linear growth instead of exponential growth. When increasing the data dimensionality, the number of detected community also remains unchanged (denoted by C = 10). Similarly, in Fig. 5(b), the execution time shows an obvious downward trend with the increasing of processor number in the condition that the data dimensionality and community number keep the same. It illustrates that more processors could be efficiently utilized when the problem scale becomes larger. In Fig. 5(c), the number of detected communities increases from 10 to 15. And other conditions remain unchanged. We observe that the time cost shows an increasing trend, but there is no substantial increase in the histogram. The figures above indicate that our proposed method has very good scalability.
In this subsection, we analyze the choice of δ, which controls whether the similarity between test data and training data should be adjusted. Besides, the performance of different parameters ranging from 0.5 to 0.9 with an interval of 0.1 generated by our algorithm is also analyzed. Table 3 lists the number of records whose coverage rate is adjusted using different δ and the corresponding accuracy.
The number of affected records and the corresponding accuracy
The number of affected records and the corresponding accuracy
As we can see from Table 3, the requirement for the reliability of the record becomes higher with the increase of δ. However, the number of records whose coverage rates are adjusted is decreased. No matter δ is too high or too low, it would affect the final accuracy. Suppose that δ is 0.1, most of the records will adjust their reliability to 1 which leads that many non-experts in the specific domain are mistaken for domain experts. On the contrary, when δ is 0.99, the reliability of most users is cut in the final calculation, which would lead that many domain experts could not be identified.
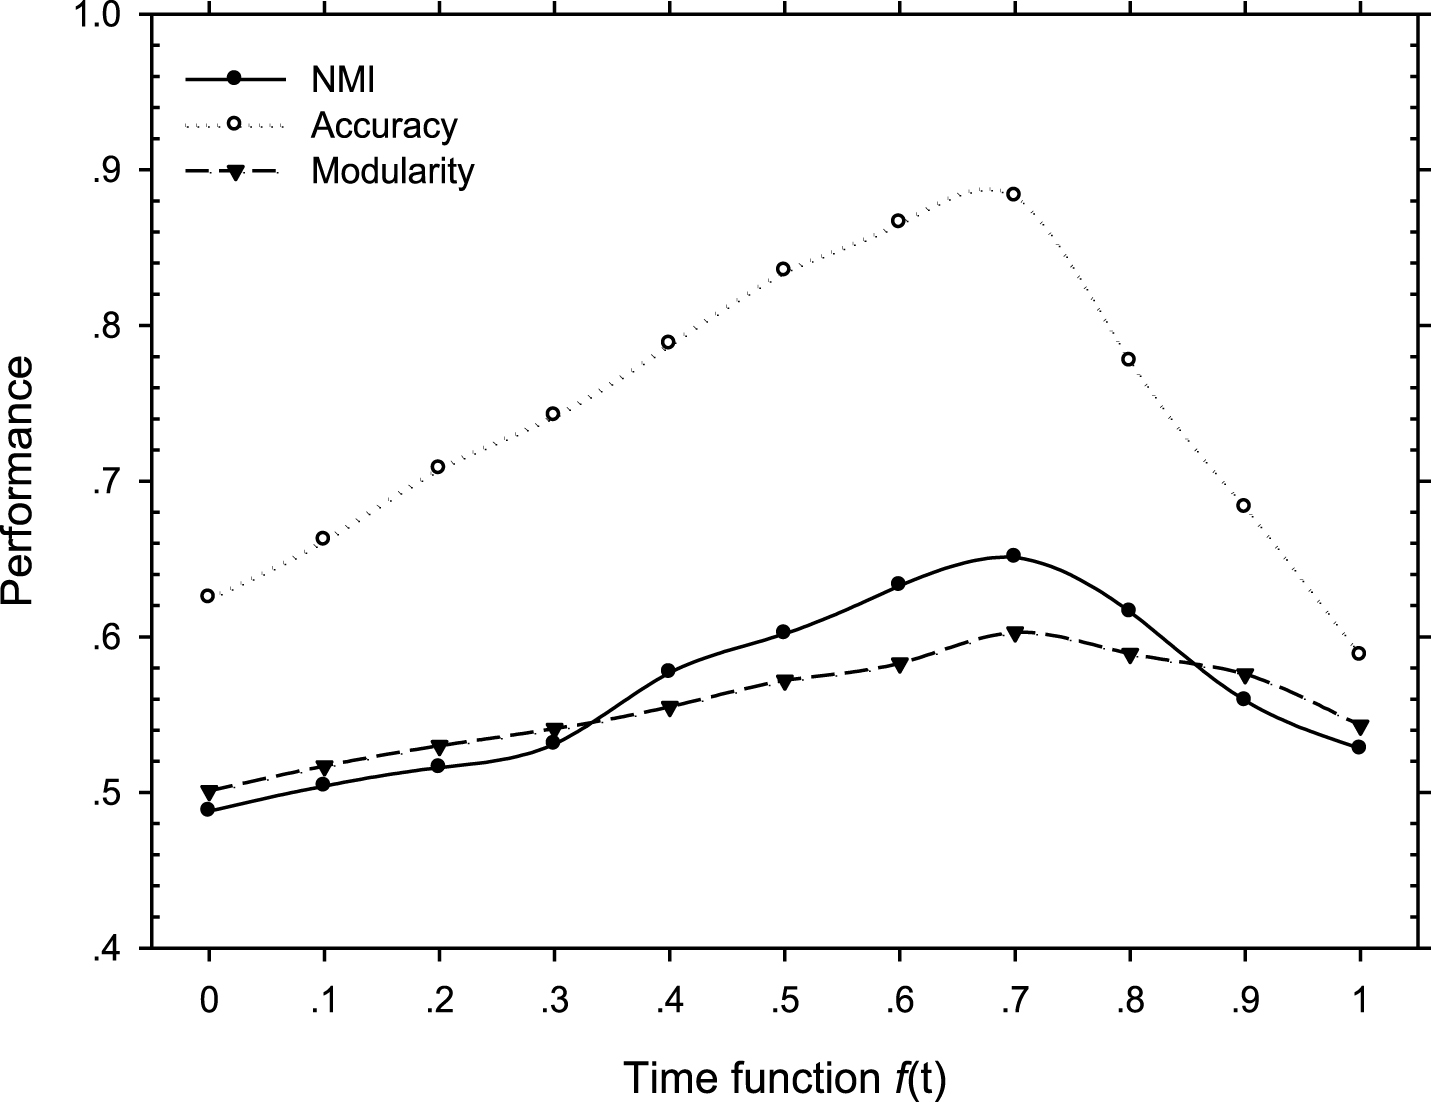
Dynamic plot of NMI, accuracy and modularity versus time function f (t) using DEM-RLA.
In order to investigate how the temporal factor affects the community detection performance, we selectively applying time function f (t) in the experiment. Moreover, we alter the importance proportion of time function from 0 to 1 at the interval of 0.1 in the final optimizing function. Figure 6 plots the NMI, accuracy and modularity values obtained by DEM-RLA versus different time function f (t).
From the curve above, we can conclude that when the time function f (t) is set to 0.7, all the evaluation metrics reach their maximum. When the f (t) is set to 0, it means the community detection method only considers the categories of contents without considering the relationship between users. This is equivalent to classifying users based simply on the features of the records, which would not be accurate enough. However, if the f (t) is set to 1, it means this approach only concerns about the links among users but ignoring the semantics of the whole social network. These two bounding cases both would decrease the accuracy of the community detection. And then, the performance of mining the domain experts could also be affected. According to the experimental results, we set f (t) to 0.7 in this paper, which means our proposed method takes into account both the relationship between users and the semantics among the records. Also, it would perform better than only considering single factor.
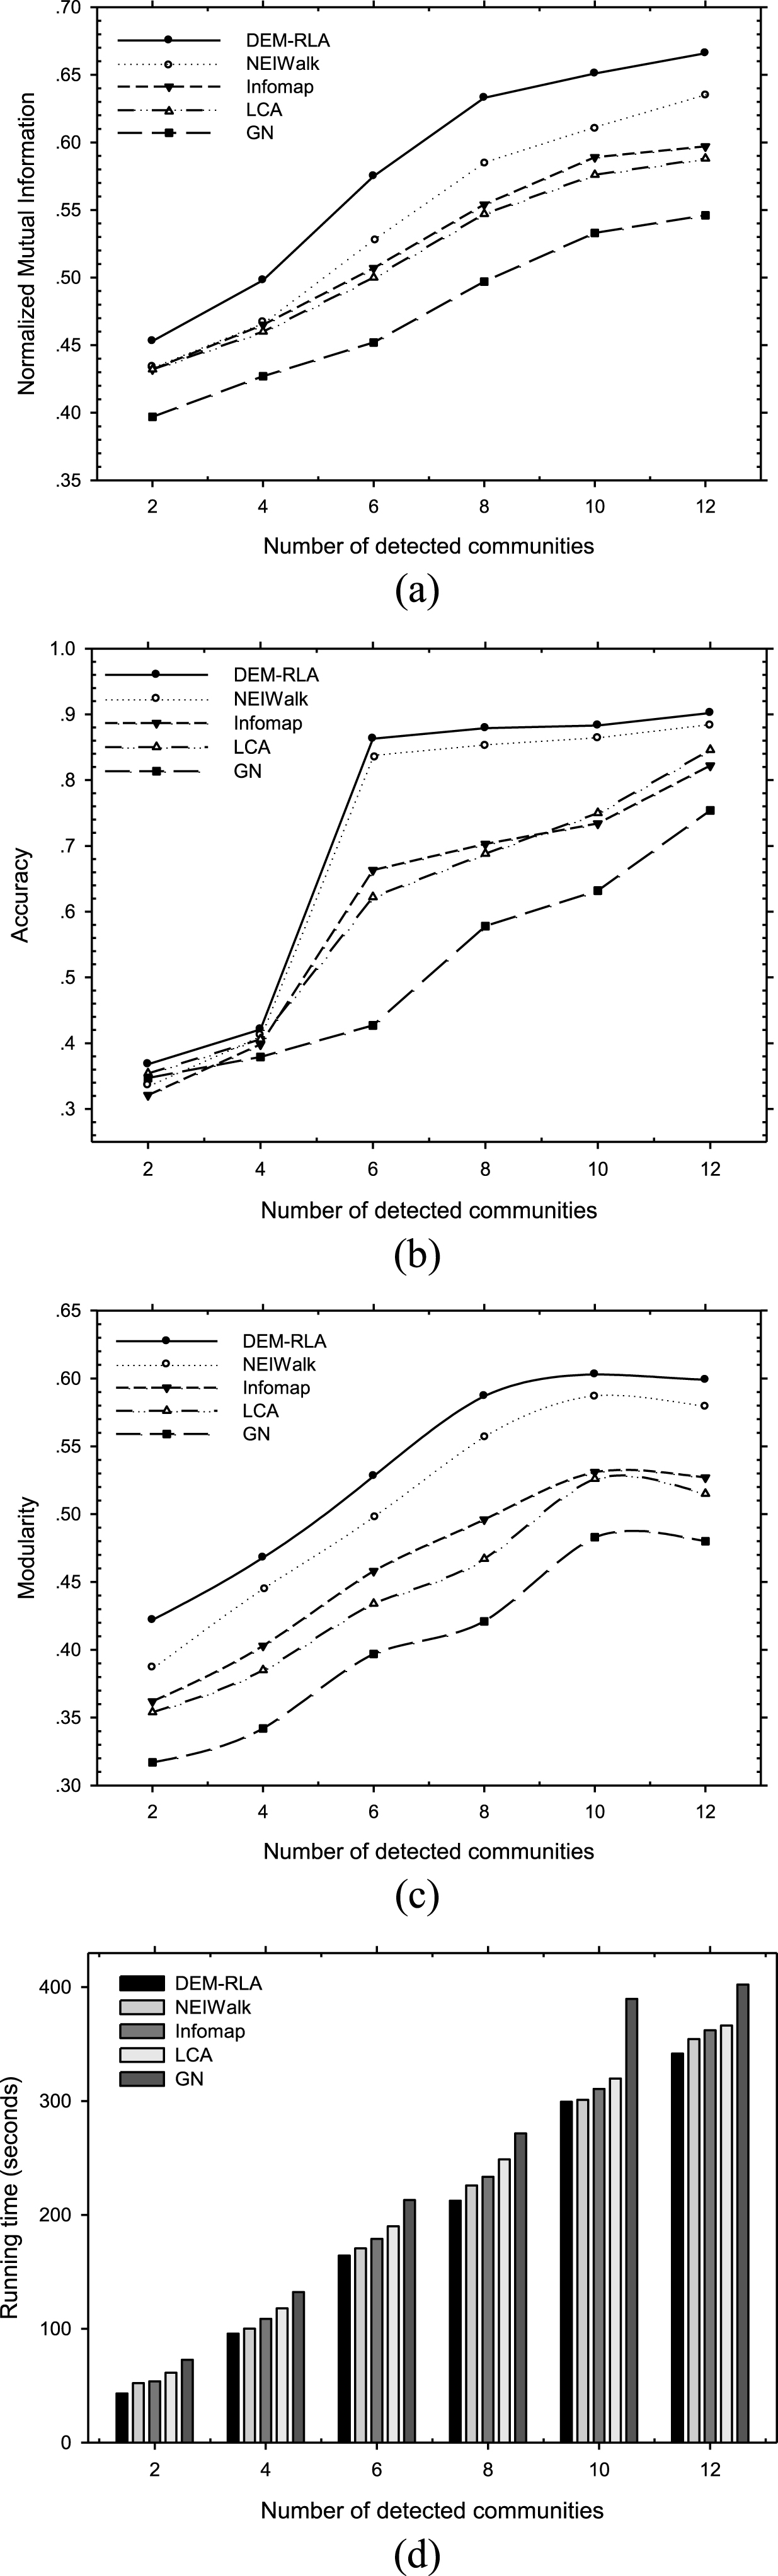
Dynamic plots of NMI, accuracy, modularity and running time versus number of detected communities.
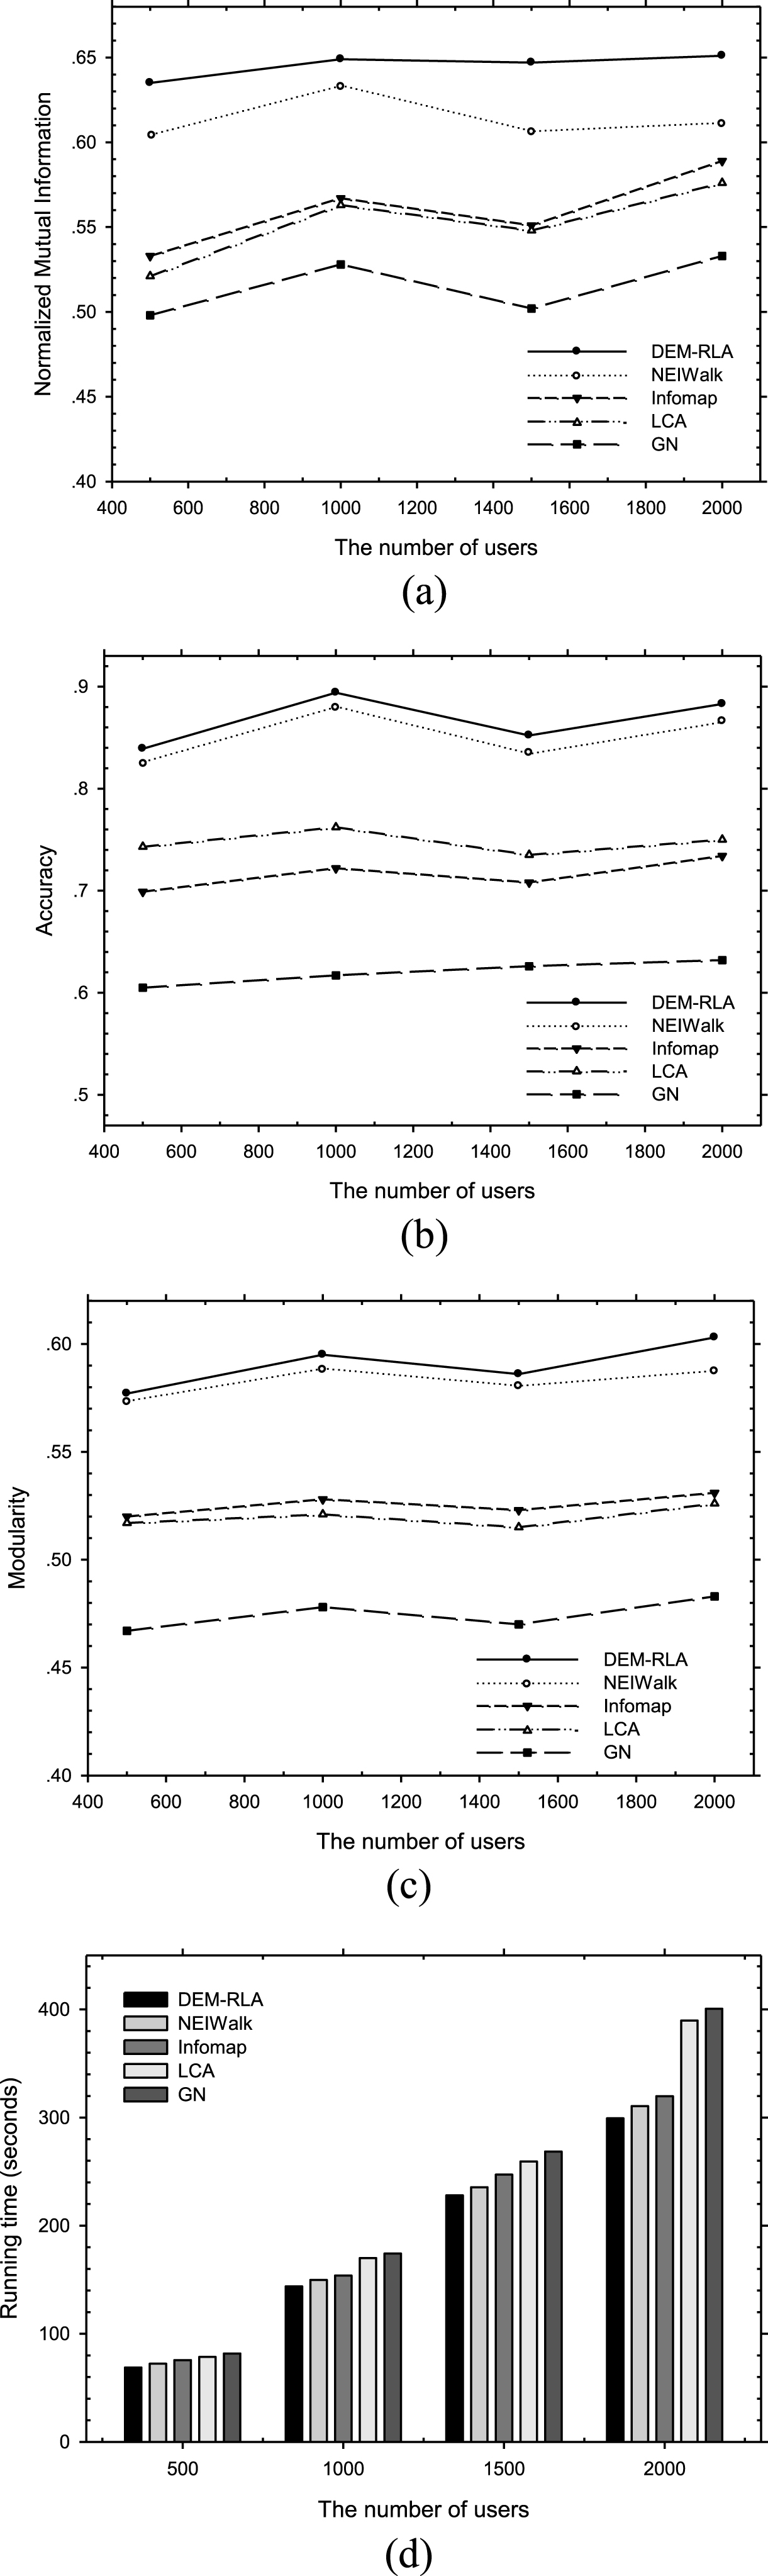
Dynamic plots of NMI, accuracy, modularity and running time versus number of users.
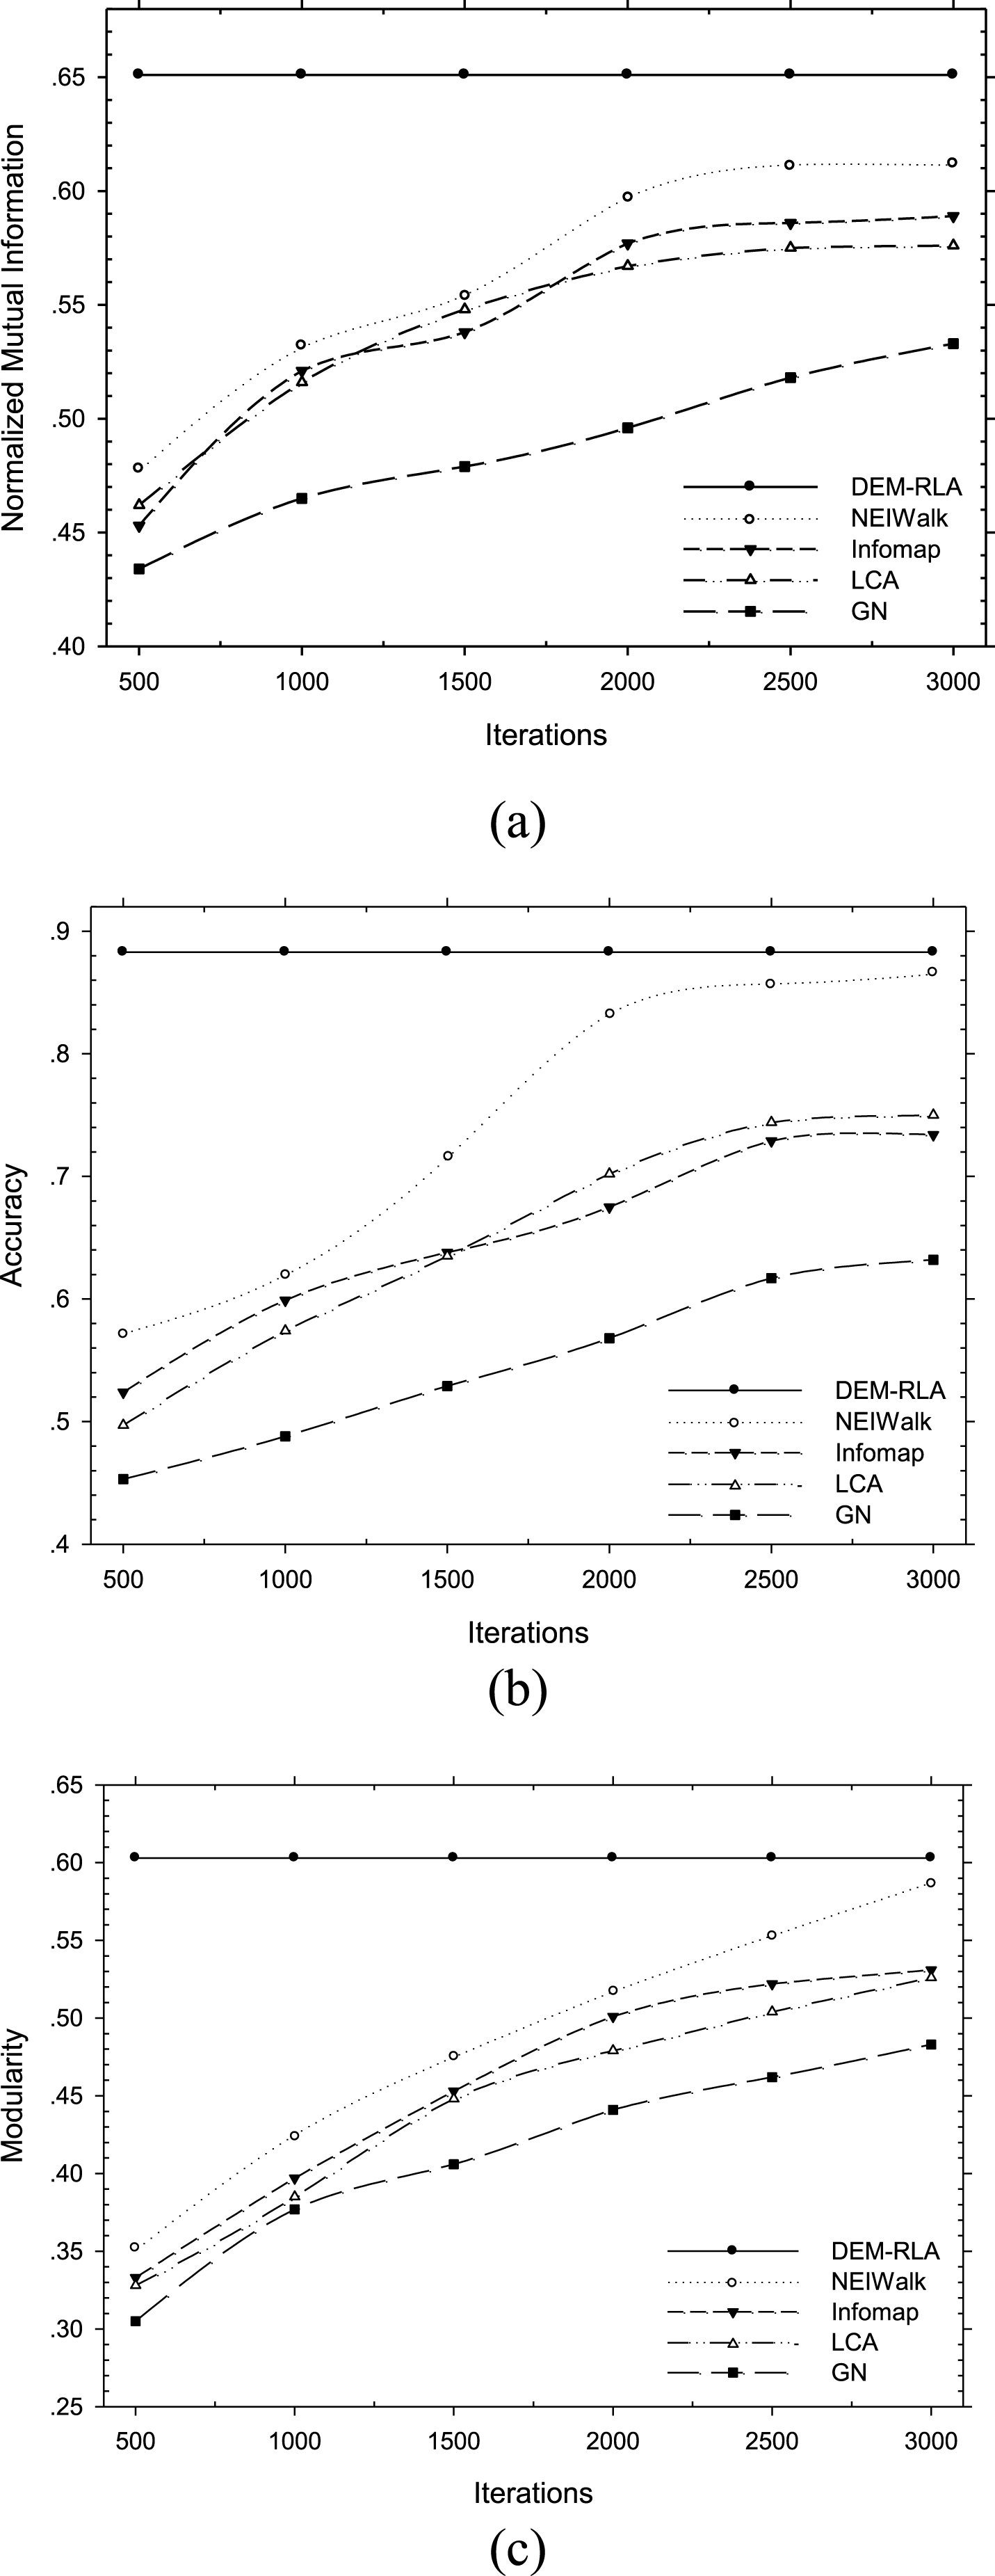
Dynamic plots of NMI, accuracy and modularity versus number of iterations.
Our proposed method in this paper aims to discover domain experts in communities by exploiting both graph structure and topic content. Our comparison algorithms include two parts: semantic algorithms and non-semantic algorithms. We choose NEIWalk [2], Infomap [34], LCA (Link Community Algorithm) [35], and GN (Girvan-Newman Algorithm) [1] as our comparison algorithms, where NEIWalk and Infomap are semantic algorithms. In what following, we will compare four baseline algorithms with DEM-RLA according to these aspects.
The first experiment is to exhibit how the five algorithms influence to the four evaluation metrics. Figure 7 dynamically plots the normalized mutual information, accuracy, modularity and running time versus number of detected communities. Each algorithm corresponds to a curve in each figure. NEIWalk is almost the same with DEM-RLA in accuracy. DEM-RLA performs better than NEIWalk, Infomap, LCA, and GN in those four evaluation metrics. In addition, the number of detected communities has greater influence in accuracy. When the number of detected communities is too small, say 2 or 4, the final accuracy would be much lower. The detected communities should have roughly equal number with the categories in the dataset. Then, the corresponding modularity reaches its peak. In Fig. 7(c), modularity reaches its maximum when the number of detected communities is 10, which is equal to the number of categories in our dataset. NMI describes the similarity between our detected community and the real community. Figure 7(a) illustrates that our proposed DEM-RLA performs better than other algorithms in NMI. And, clustering procedure is not added in the process of community detection in our proposed method. So, the time complexity could be reduced to some degree and the running time is much less than others, which is illustrated in Fig. 7(d).
The second experiment is testing how the number of users affects the final results. To demonstrate the changes brought by each algorithms, we choose different numbers of users applying to the five algorithms. We implement each algorithm to obtain the four evaluation metrics to compare. Figure 8 plots the values of NMI, accuracy, modularity, and running time at each user number point. First, it can be observed that when the number of users ranges from 500 to 2000, the running time increases linearly instead of exponential growth. It means that each algorithm has good scalability. Second, the number of users has little influence on NMI and accuracy, so does modularity. The values of them all fluctuate smoothly, which are shown in Fig. 8. It also can be seen that DEM-RLA generates slightly better results in community detection than NEIWalk. They are both superior to other algorithms in effectiveness and efficiency.
The third experiment is to test how many the iterations each algorithm needs in the process of community detection. Since DEM-RLA does not apply clustering process, NMI, accuracy and modularity would not be affected by the iteration times. Other algorithms all achieve lower NMI, accuracy and modularity when the iteration times are less. With the increasing times of iteration, the detected communities would be much closer to the real communities. Accordingly, NMI, accuracy and modularity are all enhanced to different extents. As indicated in Fig. 9, the accuracy of NEIWalk is very close to DEM-RLA when the iteration times are greater than 2500. Infomap and LCA have similar results which both perform better than traditional GN.
Conclusions
This paper focuses on the problem of performing community detection in the process of mining domain experts. First, DEM-RLA attempts to utilize non-clustering method to conduct community detection, in which content category (semantics) and user relationship (linkage structure) are highly combined. To capture the reliability of each user, we construct a huge comparison dataset to calculate the coverage rate of each record. Another contribution of our work is taking temporal factor into account to balance the weighting of semantics and linkage structure. In addition, we compare our method with other four baseline algorithms in different aspects. Our proposed DEM-RLA performs better than other baseline algorithm in accuracy. It considers both semantics and linkage structure. Also, it is superior to other baseline algorithms in time complexity.
The future work includes two parts: 1) designing a recommendation system based on the community detection. We can recommend the specific information to the users in the same community; 2) conducting link prediction based on the existing community distribution. We can predict whether a link will exist between two users.