
Abstract
Initial public offerings often show abnormal fist-day returns. These, usually referred to as underpricing, are difficult to predict. Among the main obstacles, we could mention challenges like the fact that not all relevant variables have been identified yet; the mix of weak and strong indicators or the prevalence of outliers. In this context, we suggest that adaptive neuro-fuzzy inference systems and fuzzy rule-based system with genetic optimization have a lot to bring to the table. We test the predictive performance of these on a sample of 866 US IPOs and we benchmark them against six fuzzy algorithms and a set of eight classic machine learning alternatives. We conclude that both fuzzy systems, especially the former should be seriously considered in this domain.
Introduction
Initial public offerings (IPOs) are at the core of one of the most researched anomalies in finance. For decades, researchers have been trying to explain the reason behind the abnormal returns that tend to characterize first trading days. This often consists of large returns. Even though the difference between the offering price and the first closing price is not guaranteed to be positive, it is frequent enough to make initial returns often referred to as IPO underpricing.
The average magnitude of the initial returns has changed over time, but during the internet bubble of the nineties it got to a point where a large portion of the offerings ended up more than doubling the offering price in their first trading day. Ritter and Welch [49] reported an average initial return of 18.8% based on their sample of 6,249 companies taken public in the US between 1980 and 2001. Recent changes in regulation and higher prevalence of mergers and acquisitions as exit strategy for initial investors has reduced IPO activity. The number of IPOs has gone down from an annual average of 310 during the 1980–2000 period to about a third during 2001–2012 [60]. This reduction came together with a significant drop in US IPO average underpricing, which was about half during 2001– 2010 [48].
Researchers on IPO underpricing have put for-ward a large number of theories to explain this phenomenon. These are generally supported with empirical analysis that is often based on linear models, usually multiple linear regressions. There are, however, a few papers regarding IPO analysis based on fuzzy approaches.
Among the efforts on the IPO space in general using fuzzy methods, we could mention the work of Bell et al. [8], who explore US investor perceptions of foreign IPO value using a fuzzy set methodology. The authors of [21] analyze IPO implementation decisions integrating different decision trees by fuzzy logic using reconciliation, and Cheng and Liu [15] predict the industrial growth rate of a set companies at the time of their IPO based on rough sets.
If we focus our attention specifically on IPO underpricing prediction, Huang et al. [30] predict how a set of IPOs rank in term first-day returns to pick the best performers using a genetic-fuzzy methodology. Chen et al. [14] discretize the initial returns of a sample of IPOs and frame the problem asa classification task where they predict whether IPOs will have either positive, negative or zero initial returns relying on entropy based rough sets. Two years later, the same authors published an extended version along the same lines [13]. Finally, we will mention [22]. The authors of this work compare radial basis neural networks vs. fuzzy regression as predictors of probability of withdrawal and IPO underpricing on sample of companies taken public on Tehran Stock Exchange to conclude that the former outperforms the latter.
In this paper we argue that two fuzzy systems also have a lot to bring to the table for IPO underpricing prediction as continuous variable. More specifically, we focus on two techniques: adaptive neuro-fuzzy inference systems (ANFIS) and a fuzzy rule-based system with genetic optimization, which uses a 2-tuple linguistic representation model (FRBSl-GA). To prove it, we benchmark them against six fuzzy algorithms and a set of eight classic machine learning alternatives that represent different algorithm categories.
ANFIS has previously been successfully used in many different financial contexts like the analysis of market volatility [59], financial prediction [6], trading [7, 57], financial institution failure prediction [18] or real estate property price prediction [26].
There are also precedents for uses of 2-tuple linguistic representation models in finance. Given the characteristics of the technique, the nature of some of the applications is closely related to the examples mentioned for ANFIS. They include association rule mining in stock price series [25], financial performance evaluation [2], corporate credit rating [42] or stock evaluation [55], among others. The rest of the paper will have the following structure: in Section 2, we make an introduction to the prediction algorithms that are part of the study. That will be followed by Section 3, which is devoted to the description of the explanatory variables and the sample to be used in the analysis. Section 4 will be used to report the details related to the experimental analysis and, finally, Section 5 will cover the summary and conclusions.
Predictive models
This section provides short introductions to the two core fuzzy approaches mentioned in the previous section, followed by brief descriptions of the algorithms used to benchmark the results.
FRBSl–GA
The introduction to the Fuzzy Rule-based System (FRBS) will cover the two main aspects, the so-called linguistic 2-tuplerepresentations, and the evolutionary algorithm used within the technique.
In regards to the first one, in [19] we can see de new directions to techniques to design a FRBS applying genetic evolutionary algorithms. This process includes: selection of fuzzy rules, feature selection, learning of Knowledge Base (KB) via genetic derivation of the Data Base (DB), interpretability maintenance via multi-objective genetic processes, learning approaches considering different model structures, etc. These kinds of techniques try to find a better trade off between the efficiency of the learning/post-processing and the dimensionality of the search space.
This is the case of the learning of KBs via genetic derivation of DBs, a recent approach involving a simpler search space than the classical learning of KBs. It consists of obtaining the DB and the Rule Base (RB) separately, based on the embedded learning of the DB [11, 56] (see Fig. 1). This approach allows us to learn the most adequate context for each fuzzy partition, which is necessary in different application contexts and different fuzzy rule extraction models.
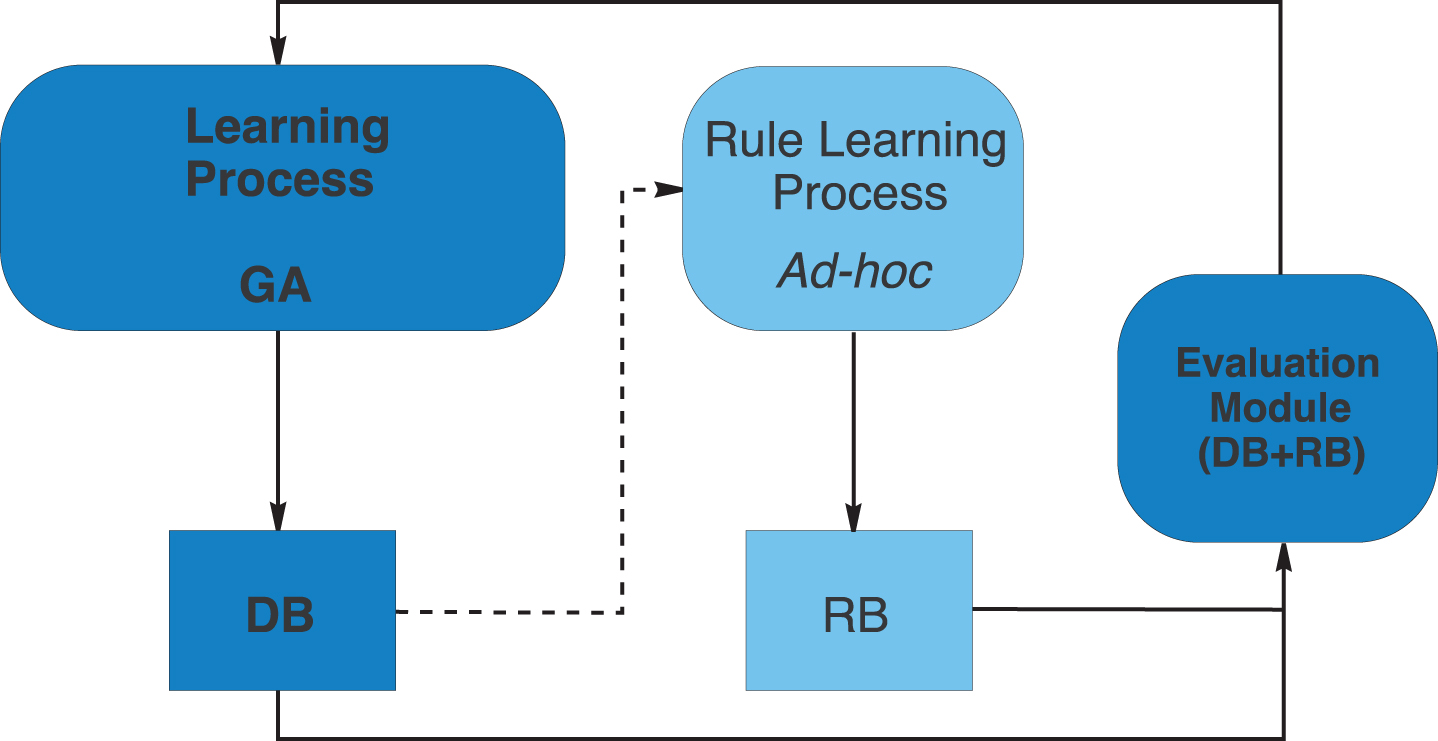
Learning scheme of the knowledge base.
The learning scheme considered in this work belongs to this last group and is composed of two main components:
A process to learn the DB, which allows to define:
The number of labels for each linguistic variable. The lateral displacements of such labels. A quick Ad-hoc data-driven method to derive the RB [58] considering the DB previously obtained. This method is run from each DB definition generated by a Genetic Algorithm (GA), thus allowing the proposed hybrid learning process to finally obtain the whole definition of the KB (DB and RB) by means of the cooperative action of both methods.
In [4], a new model of tuning of FRBSs, FRBSl-GA, was proposed considering the linguistic 2-tuples representation scheme introduced in [28], which allows the lateral displacement of the support of a label and maintains the interpretability associated to the obtained linguistic FRBSs. This proposal also introduces a new model for rule representation based on the symbolic translation concept that is a number within the interval [−0.5, 0.5) expressing the domain of a label when it is moving between its two lateral labels. Formally, we have the pair,
Figure 2 shows the lateral displacement of the label M. The new label “y2” is located between B and M, being smaller enough than M, but closer to M.
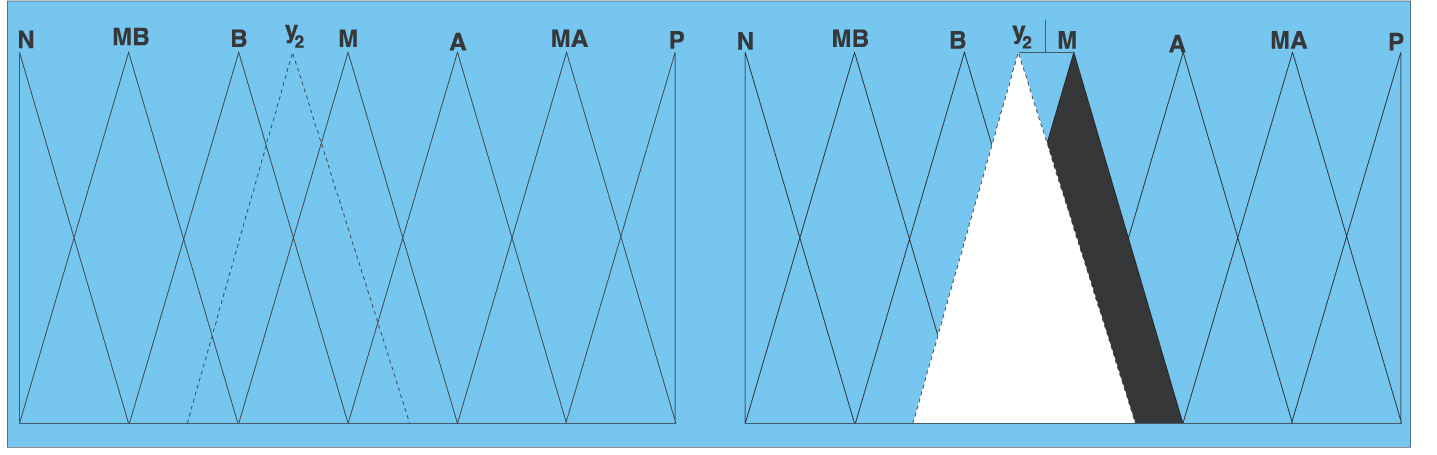
Lateral Displacement of the Linguistic Label M.
As me mentioned, the second key aspect to be specified is the evolutionary algorithm. In this work, we will consider the use of CHC [23] to design the proposed learning algorithm. CHC is a GA that presents a good trade-off between exploration and exploitation, being a good choice in problems with complex search spaces. This genetic model makes use of a mechanism of “Selection of Populations”. N parents and their corresponding off springs are combined to select the best N individuals to take part of the next population.
For the fuzzy inference, we have selected the minimum t-norm playing the role of the implication and conjunctive operators, and the center of gravity weighted by the matching strategy acting as defuzzification operator.
The main advantage of fuzzy inference systems is that it is possible to interpret the linguistic rules generated by the model. The combination with neural networks, which incorporate mechanisms for learning from a set of data, forms a hybrid model denoted as Adaptive Neuro Fuzzy Inference System (ANFIS), proposed by [32].
The objective behind this approach, which involves a Sugeno-type fuzzy inference system and neural networks, is to design an architecture that utilizes a fuzzy model to represent knowledge in an interpretable way, with the learning capability derived from a neural network that can adjust the membership functions parameters and linguistic rules directly from data in order to improve the model performance.
Initially, the number and type of the input membership functions should be defined. For that, a subtractive clustering is applied to define the initial structure for the ANFIS model [16]. This method is considered as an extension of the mountain clustering method [61].
After this initialization, a training phase is carried out by means of a hybrid strategy based on gradient descent and least squares estimator. Without giving further details about the equations of the gradient descent (see [32] for additional information), the aim of this process is to minimize the error between the real output and the model output, modifying the premise parameters. Additionally, it should be highlighted that there are several parameters related to the learning rate. The main one is the step size k, which can vary the convergence speed of the algorithm. This parameter is adapted dynamically along the training process using two kind of factors, the step size decrease rate k d (fewer than 1) and the step size increase rate k i (higher than 1).
Benchmark algorithms
The study will enrich the analysis done using ANFIS and the fuzzy rule-based system with genetic optimization and a 2-tuple linguistic representation model benchmarking the results against a number of alternatives. More specifically, we will consider six additional fuzzy algorithms and a set of eight classic machine learning alternatives that represent different algorithm categories. We introduce them very briefly below.
Fuzzy alternatives
The fuzzy alternatives used in the experiments are:
SBC [17]: method based on using a subtractive clustering method to obtain the cluster centers (generating the rules), and then optimizes the membership function by using an efficient gradient descent method. WM method [58]: model introduced by Wang and Mendel. The WM method is able to generate fuzzy rules from sample data by dividing the input space into fuzzy regions, and then uses a lookup table to extract rules for each fuzzy subspace. HYFIS [34]: Hybrid Neural Fuzzy Inference System (HYFIS) uses heuristic fuzzy logic rules and input-output fuzzy membership function, which can be further optimized by a hybrid learning scheme composed of two phases, namely, rule generation from data, and rule tuning using error back propagation for a neural fuzzy system. DENFIS [33]: the Dynamic Evolving Neural-Fuzzy Inference System (DENFIS) is an online model that creates a TSK fuzzy inference system where fuzzy rules are generated using clusters of the input vectors. The system dynamically evolves its rule base to capture changes in the system throughout a continuous updating of the model. FIR.DM [44]: Fuzzy Inference Rules by Descent Method (FIR.DM) proposed by Nomura et al. automatically obtains fuzzy rules expressing the input-output relation of the data by using a triangular membership functions, which are tuned by a descend method. FS.HGD [31]: simplified TSK fuzzy rule generation method using heuristics and gradient descent method (FS.HGD). It uses fuzzy IF-THEN rules with nonfuzzy singletons in the consequents of the rules. Space partition techniques generates the rule antecedents, while consequents are computed by a weighted mean value of the input data, which heuristically guided by the user. Finally, a gradient descent method seeks for the optimal value of the consequents.
Classic data mining approaches
The algorithms we will use as benchmarks are: IBK, least median of squared regression, LWL, M5P, M5Rules, multilayer perceptron, radial basis neural networks and SMO-Regression. This selection of algorithms includes different categories such as alternatives based on functions, nearest neighbors, rules and decision trees.
IBK [1]: K-nearest neighbor algorithm implementation. LMSReg [51]: robust linear regression that disregards outliers to improve the model accuracy. LWL [5]: learning algorithm that creates classifiers based on weighted instances. M5P [47]: implementation of the M5 tree-based classification algorithm that adds linear regression components to handle continuous variables. M5Rules [29]: algorithm based on the divide-and-conquer principle. Every iteration, the algorithm relies in M5 to build regression trees, and then makes the best leaf into a rule. MLP [52]: multilayer perceptrons are a type artificial neural network that simulates the biological learning processes by means of a number of weight adjustment strategies. In this case, we rely on the most popular one, back-propagation algorithm. RBFN [43]: Radial Basis Neural Networks are another type of artificial neural network. It uses radial basis functions to approximate different regions of the input space depending on their characteristics. SMO-Reg [54]: implementation of support vector machines trained using sequential minimal optimization.
Variables and data
In this section we introduce the variables considered in the experimental work. To this end, we provide a formal definition of IPO underpricing together with the set of independent variables used to predict it. In addition to that, we describe the sample used to fit the models and test their performance.
Variables
We define IPO underpricing as the percentage change from offering price to first trading day close, minus the market performance of the stock market the day the company was taken public, that is:
Regarding the independent variables, as we have already mentioned in the introduction, the number of research papers devoted to discuss potential explanations for IPO initial returns is very large. Even though there is nothing like a consensus variable set accepted and used across publications, there are a few elements related to the offering structure that turn up very often. These variables, which we introduce succinctly below, are: offer price, price range width, price adjustment, retained stock offer size and relation to tech sector.
Offering price (PRICE): the final offering price has been identified as a relevant variable both as a component of other indicators andin its own right. Studies like [3, 12] suggest that offering price might be perceived by potential buyers as a signal of the quality of the stock. Price range width (RANGE): in the first stages of the IPO offering process, issuers gather non-binding purchase offers by investors based on a tentative offering price ranges. Authors like [27, 35] claim that the standardized width of these ranges, defined as the difference between the upper and the lower bound of the range divided by the lower one, might be interpreted as a sign of uncertainty and therefore, would be likely to influence underpricing. Price adjustment (P ADJ): researchers like the ones involved in [9, 36] report that the two previous indicators might be combined to generate a third one that would capture the difference between the initial valuation and the final. According to them, the result of the expression that follows could be perceived by investors as a sign of uncertainty:
where P
f
is the final offer price and P
e
is the expected price defined as the center point of the price range.
Offering size (LSIZE): the amount of capital involved in the offering is often found to have an statistically significant inverse relationship with underpricing [3, 41]. The variable is defined as the offering size (in USD millions), excluding the over-allotment. Retained stock (RETAINED): early investors are often perceived to have insider information. This has led researchers to think that the proportion of capital retained at the time of the IPO might be inter pretedasaquality signal by new investors [10, 36]. Given that we do not have detailed information regarding the exact number of primary and secondary shares, we will proxy this indicator through the number of shares sold at the IPO divided by the difference between the post-IPO number shares and the number of shares sold at the offering. Technology (TECH): technology-based companies tend show higher average initial returns than the rest. For this reason, IPO research [37, 53] often controls for this factor by means of a dummy variable that equals one in case that the core industrial activities of the company are related to technology and zero otherwise. The criterion that we will use considers an IPO as tech-related will be based on IPO Monitor’s classification. This company publishes reports where they label IPO as Tech or not according their US Standard Industry Codes and the activities they describe in their filings.
The experimental analysis will be based on a sample of 866 US IPOs. The companies represented were taken public between January 1999 and May 2010 in NASDAQ, AMEX and NYSE. Following the standards of IPO research, the sample does not include closed-end funds; American Depositary Receipts; real state investment trusts or unit offerings. The main source of information was the commercial data provider IPO Monitor. In those instances where the information was incomplete, we used Hoovers, another data vendor, as the secondary source. Regarding index information, we obtained the NASDAQ and AMEX composites from the National Association of Securities Dealers, and the S&P 500 index from Data stream.
Table 1 summarizes the main descriptive statistics, including the mean, median, maximum, minimum and standard deviation for the mentioned sample of 866 companies.
Main descriptive statistics
Main descriptive statistics
The basic structure of the distribution of initial returns is consistent with the one reported in most of the referenced studies. As we can see in Fig. 3, among its main features, we could mention a positive mean return; the right-skewness caused by hot IPOs and the high kurtosis.
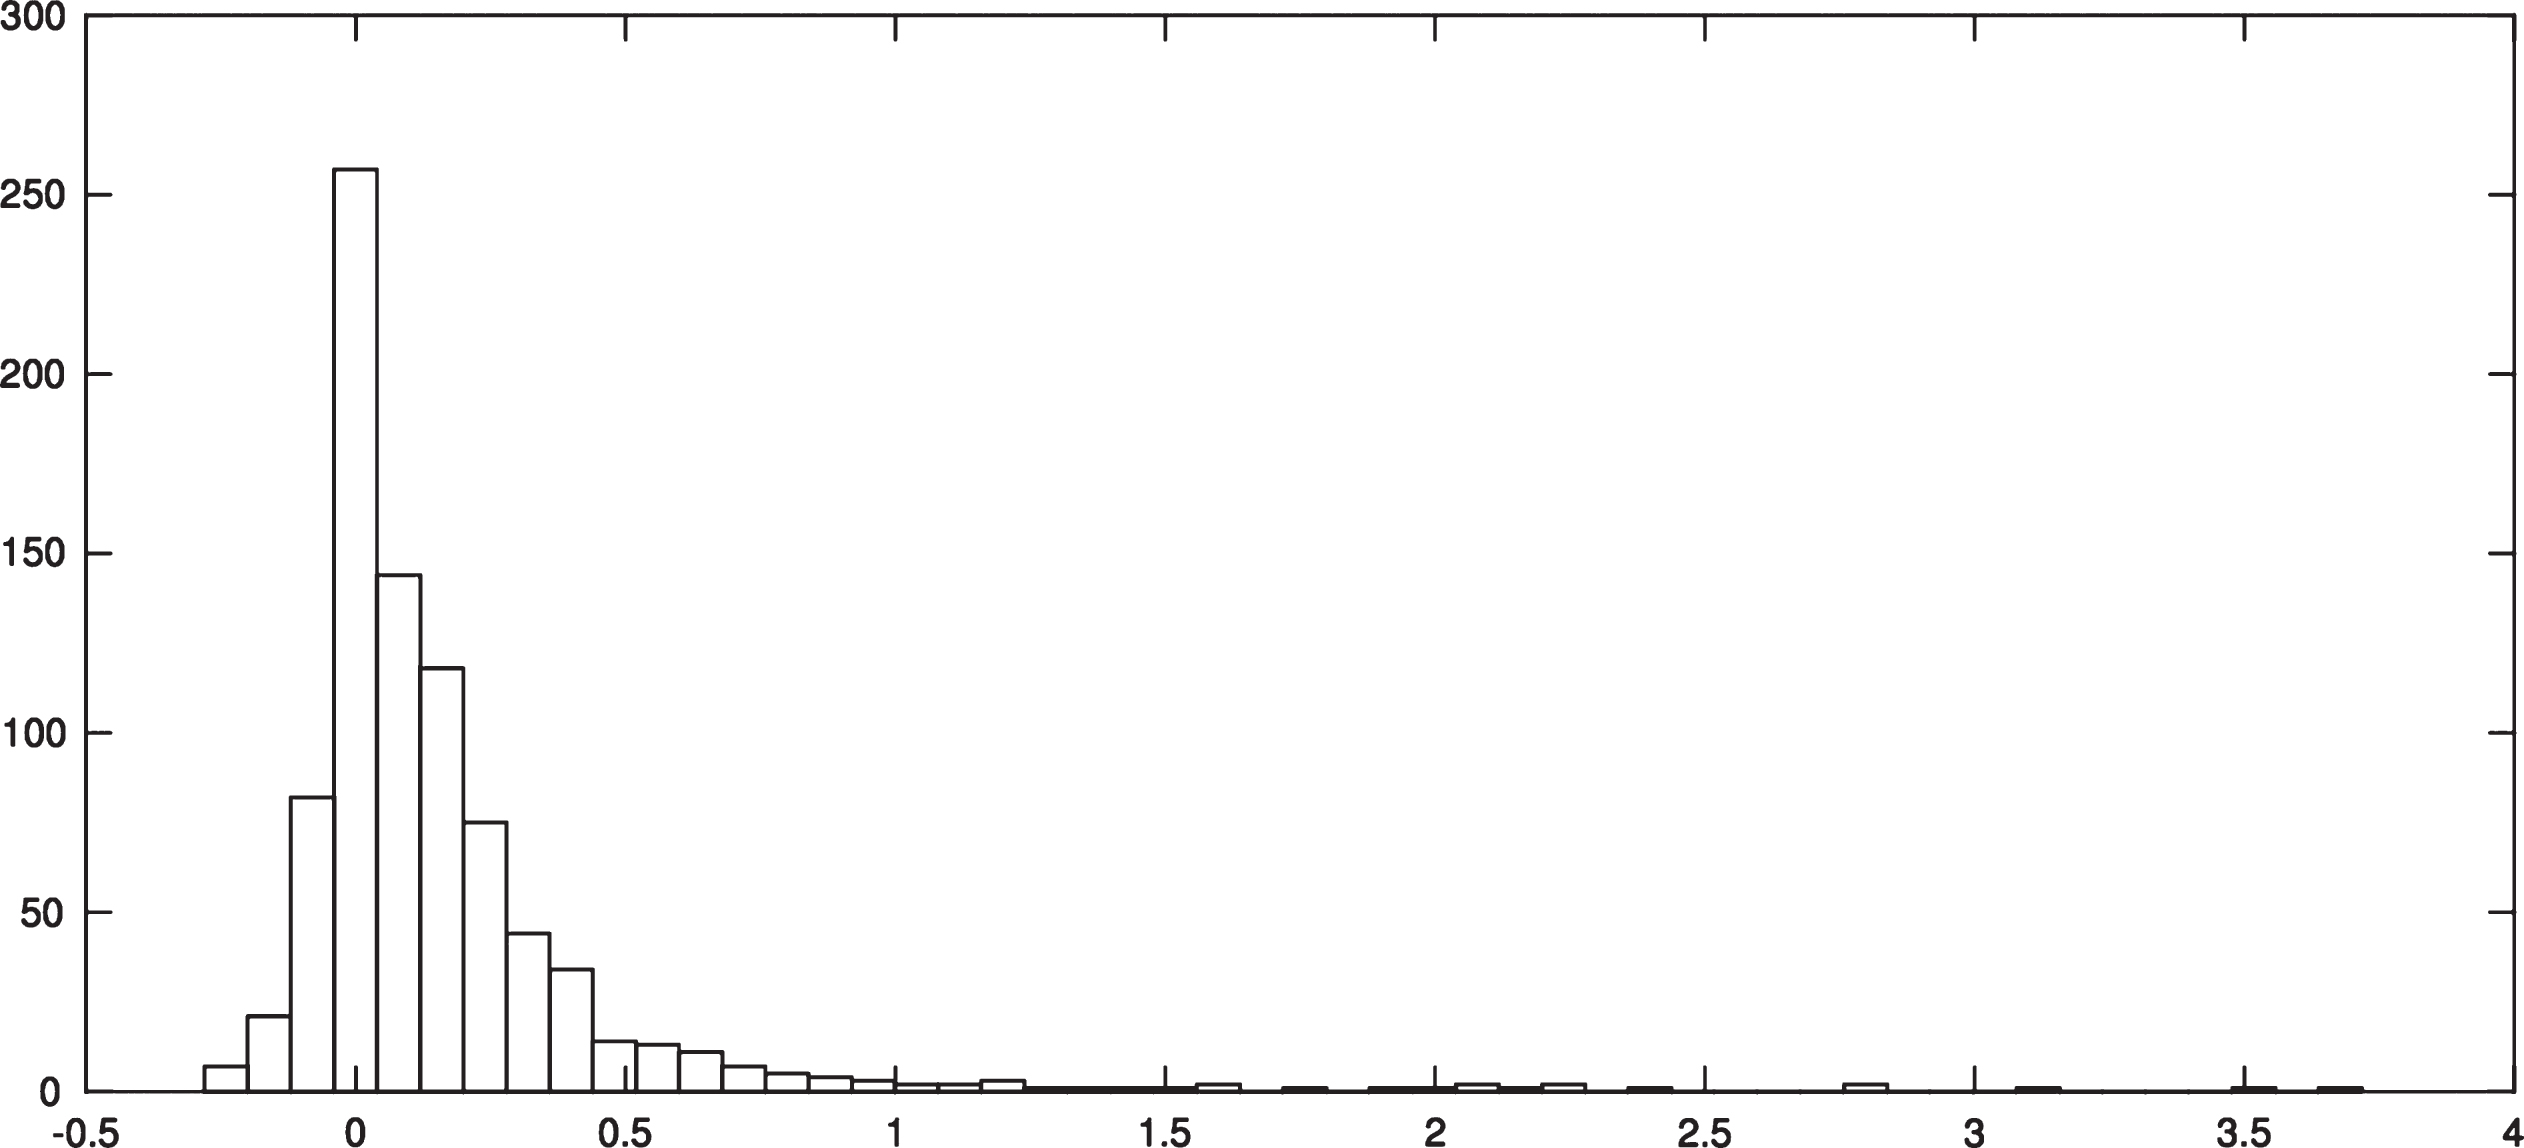
Return histogram.
In this section we report the results of the experimental analysis performed to test the suitability of the fuzzy approaches in the IPO underpricing prediction domain. We will first introduce the methodology used in the conducted experimentation. The sensitivity of the fuzzy methods with respect to their parameterization is included next. The section ends with a comparison of the output of these methods to the predictions made by eight alternatives that are widely used in data mining.
Methodology
The models will be assessed by their predictive accuracy in terms of root mean square error (RMSE) on the same data set. In order to make the results as general as possible, we will perform a 10-fold cross validation (the same folds for all the algorithms). Given the stochastic nature of most of the benchmark algorithms, we will run the experiments 15 times using different random seeds and compare the average results. We will, however, report the main descriptive statics to ensure that the image is complete.
As we discussed, we will repeat the cross- validation analysis using a set of fuzzy and machine learning alternatives. For such task, we will rely on the FRBS R package and WEKA (Waikato Environment for Knowledge Analysis) [24].
Sensitivity analysis
For each parameter of the two core fuzzy methods a valid set of values is considered. Then multiple configurations of the methods are generated by combining the values of the parameters in every possible way. The parameter values for each technique are shown in Table 2. In this section we discuss the sensitivity of ANFIS and FRBSl-GA to these values.
Parameter settings explored. ANFIS and FRBSl-GA. The combination of all the values of the parameters generate the set of configurations tested for each method
Parameter settings explored. ANFIS and FRBSl-GA. The combination of all the values of the parameters generate the set of configurations tested for each method
FRBSl-GA uses four different parameters (see Table 2). The first parameter is the stopping condition of the algorithm, set up as the number of evaluations it is allowed to perform. We have used three different configurations, 50,000, 100,000, and 150,000 evaluations. The second parameter is the population size, i.e., the number of tentative solutions managed by the inner GA, which ranges between 50 and 200. The parameter alpha allows FRBSl-GA to determine the trade-off between accuracy, i.e., how good the method predicts the output, and complexity in terms of the number of rules (more rules does also mean less interpretability). The fourth parameter is the maximum number of membership functions (MFs) for each variable; we have used 3, 5, 7 and 9; using a maximum number of 9 MFs per variable, as suggested by the authors of the method [19].
A factorial design of experiments with the values included in Table 2 has been performed. In order to avoid overwhelming the reader with a huge amount of data (192 configurations), only a subset of the results are included in this section, aimed at showing the most relevant findings raised. The first fact that we want to show is the small sensitivity of FBRSl-GA to the number of evaluations (Fig. 4). Even though the best RMSE in testing is reached with 150,000 function evaluations as stopping condition, the differences are very narrow. The same holds with the population size, little-to-no significant differences can be found (not shown).
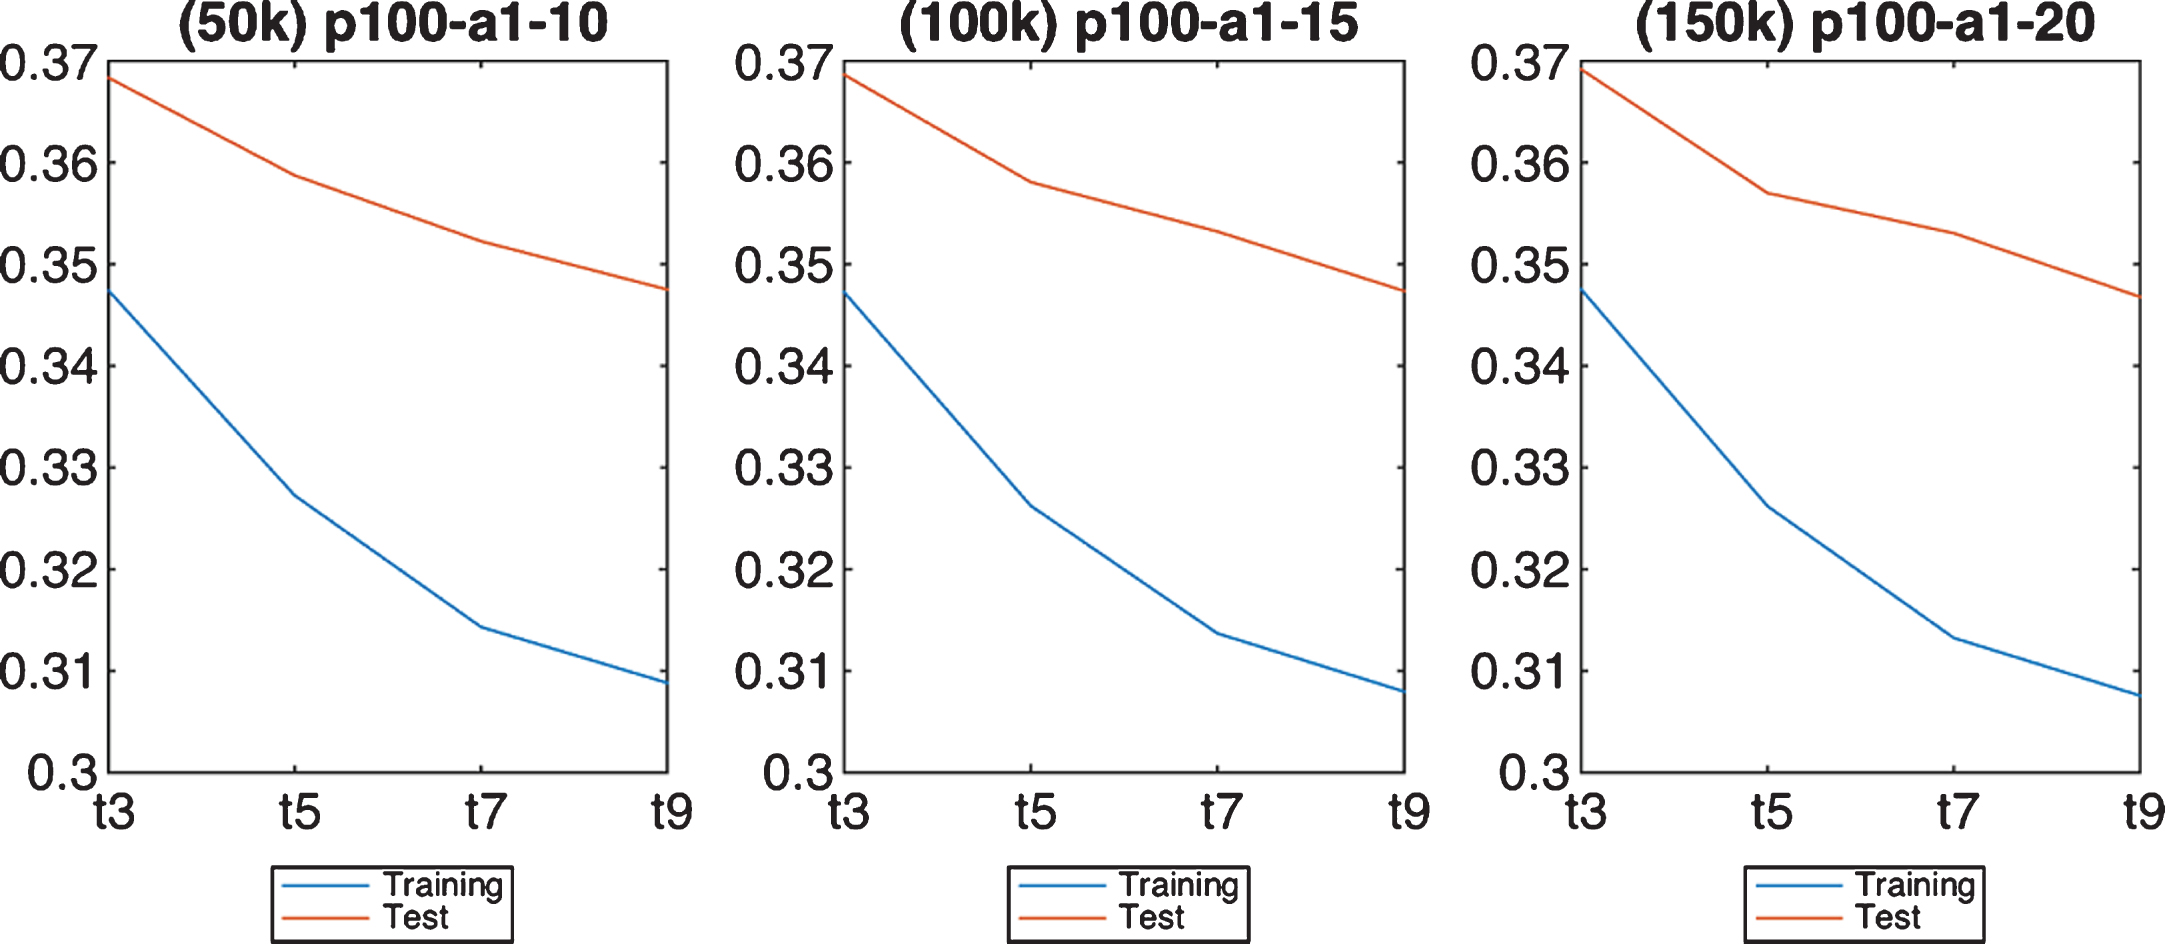
Impact of the stopping condition in FRBSl-GA.
Once the stopping condition and the population size are fixed, Fig. 5 plots the RMSE in testing for the four different values of alpha and the maximum number of MF. The names in the axis prefix with p, a, and t, respectively, the population size, the alpha value, and the maximum number of MF. It is clear that the effect of alpha in FRBSl-GA is little for this dataset, providing very similar RMSE values both in training and test. The most determining parameter is the maximum number of MF. Regardless of the stopping condition used, the population size, or the alpha value, using a maximum number of 9 MF has always provided the lowest RMSE (in training and test). This is consistent throughout the entire experimentation and indicates that a higher number of rules are required to increase the accuracy of the method. The point is that this value is limited to 9 as the fuzzy system loses interpretability when a high number of MF is used.
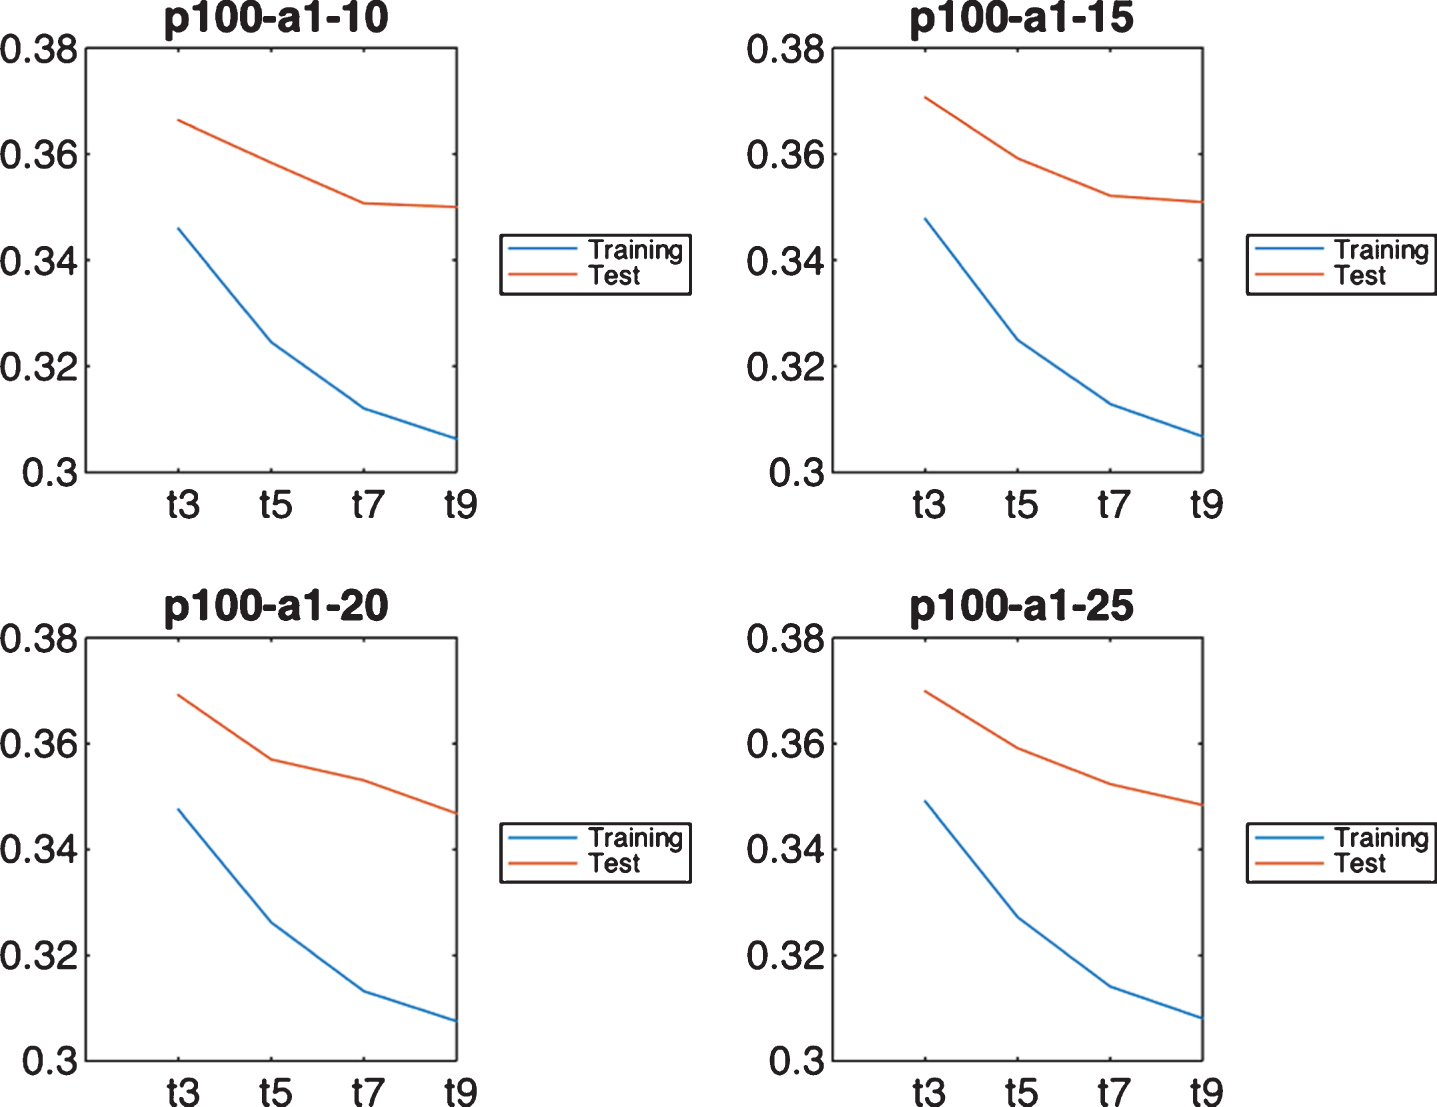
Impact of alpha and the maximum number of MF in FRBSl-GA (150k evaluations).
A total number of 3,888 different configurations are evaluated in order to analyze the behavior of the algorithm. These configurations are obtained by combining all the test parameters presented in the first row of Table 2. The three first parameters of this row are related to the ANFIS model itself, while the last four correspond to the subtractive clustering method, which is used to initialize the ANFIS structure.
Besides the RMSE, the Pearson correlation [50] is calculated as a measure to evaluate the accuracy of the neuro-fuzzy model. This value not only provides information about the error between the real output values and the estimated ones from the IPO input data, but it provides us with an idea of the tendency of the estimated output function, and its similarity to the real output function (its shape). The Pearson correlation has also been applied in several papers related to the ANFIS model in the literature [39, 46].
Figure 6 shows the mentioned statistic for each ANFIS configuration (represented as a colored point), with respect the RMSE in the testing phase, whereas the color of the points indicates the RMSE reached in the training phase. The first clear conclusion that can be drawn from this figure is that, the more correlated the real and estimated output vectors (i.e., the more similar their shapes), the lower the RMSE in test. These high correlation values indicates that the underlying neural network has been trained properly, and thus its prediction capability is enhanced. The zoomed part includes the final configuration used in a section below to compare with other approaches from the literature.
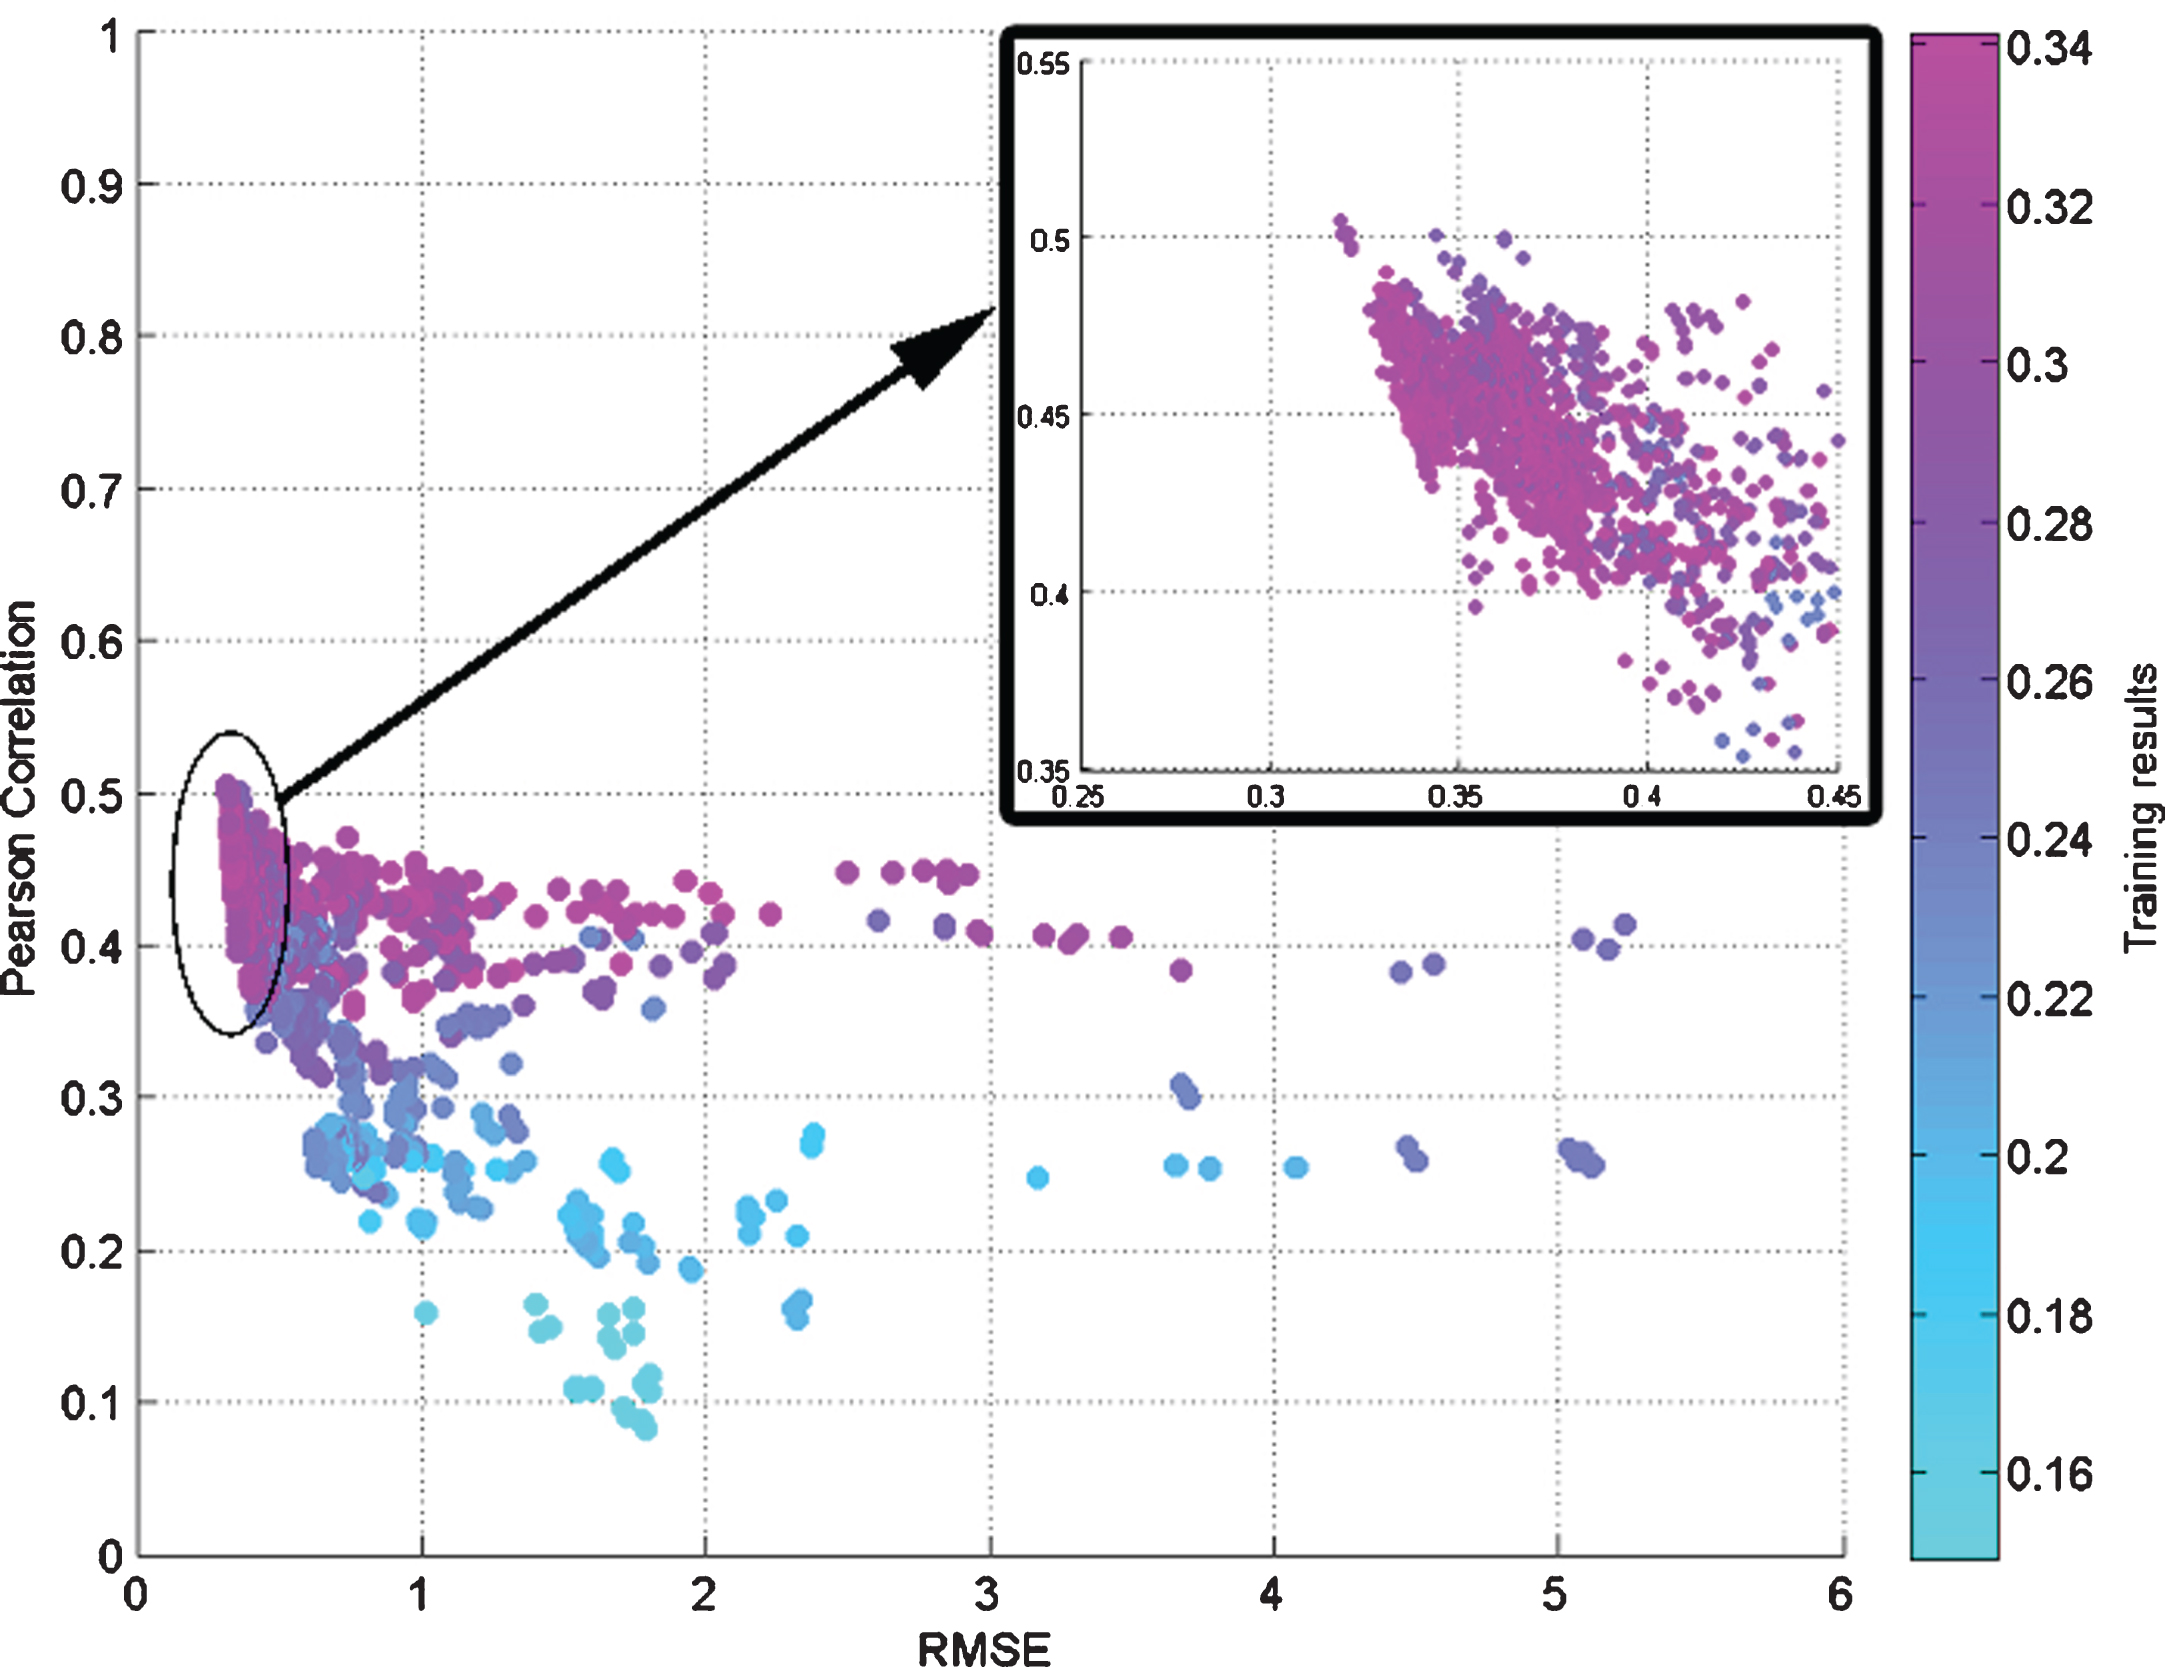
Representation of Pearson correlation and RMSE metrics for all ANFIS configurations over test. Each point is a different configuration. The closer the points are to the coordinates (0.0,1.0), the better the RMSE and the correlation, and thus the better is the regression. RMSE in training is represented by color.
The second remarkable fact has to do with the color of the points. It can be seen that the lowest RMSE values in the training phase (lighter blue ones at the bottom of the figure) can be reached, but with a large penalty in testing due to over fitting. The Pearson correlation is also consistent with these values as it points out that the shapes of the input and output vectors are fairly different, i.e., the ANFIS training resulted in a poorly performing predictor.
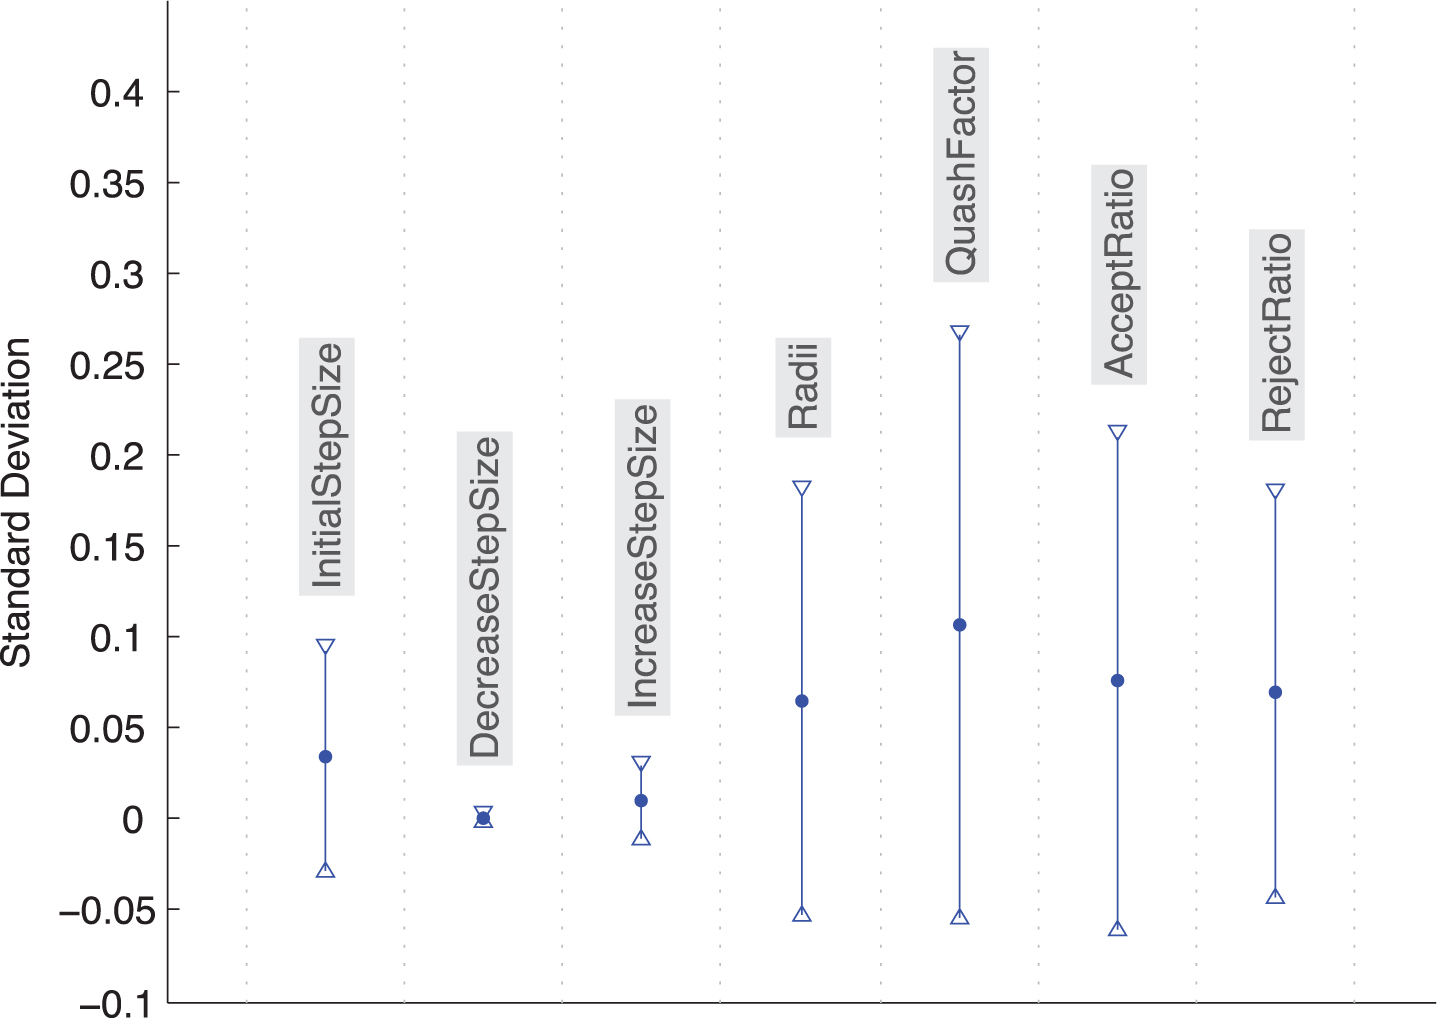
The second figure of this section (Fig. 7) shows the sensitivity of seven representative parameters of ANFIS, measured as the average standard deviations of the configurations after setting each parameter of the graph. That is, for the Initial Step Size graph, we have averaged the RMSE of the configurations with the same values for all the parameters except for the Initial Step Size. For each cluster of configurations, there are as many inputs as different values of the studied parameter. Thus, the only variation in these configurations is the value of the studied parameter. The standard deviation is obtained as the mean of the standard deviations of all the clusters. As stated above, the first three ones have to do with the operation of the ANFIS method itself and, the second, with the initial clustering that initializes the structure. The error bars in the figure clearly show that ANFIS strongly depends on the initialization method, as the four last parameters show the larger variability. Overall, this analysis points out that ANFIS is highly sensitive to its parameterization (also shown in Fig. 6, where the cloud points are fairly disperse).
Sensitivity of ANFIS to parameters.
The best configuration found for the ANFIS method, which is used for comparison to other techniques, is detailed below in Table 4.
In this subsection we discuss the nature of the solutions provided by FRBSl-GA and ANFIS. For each approach we discuss the structure of the resulting systems and, finally, we extract conclusions regarding the relative importance of the independent variables.
FRBSl–GA
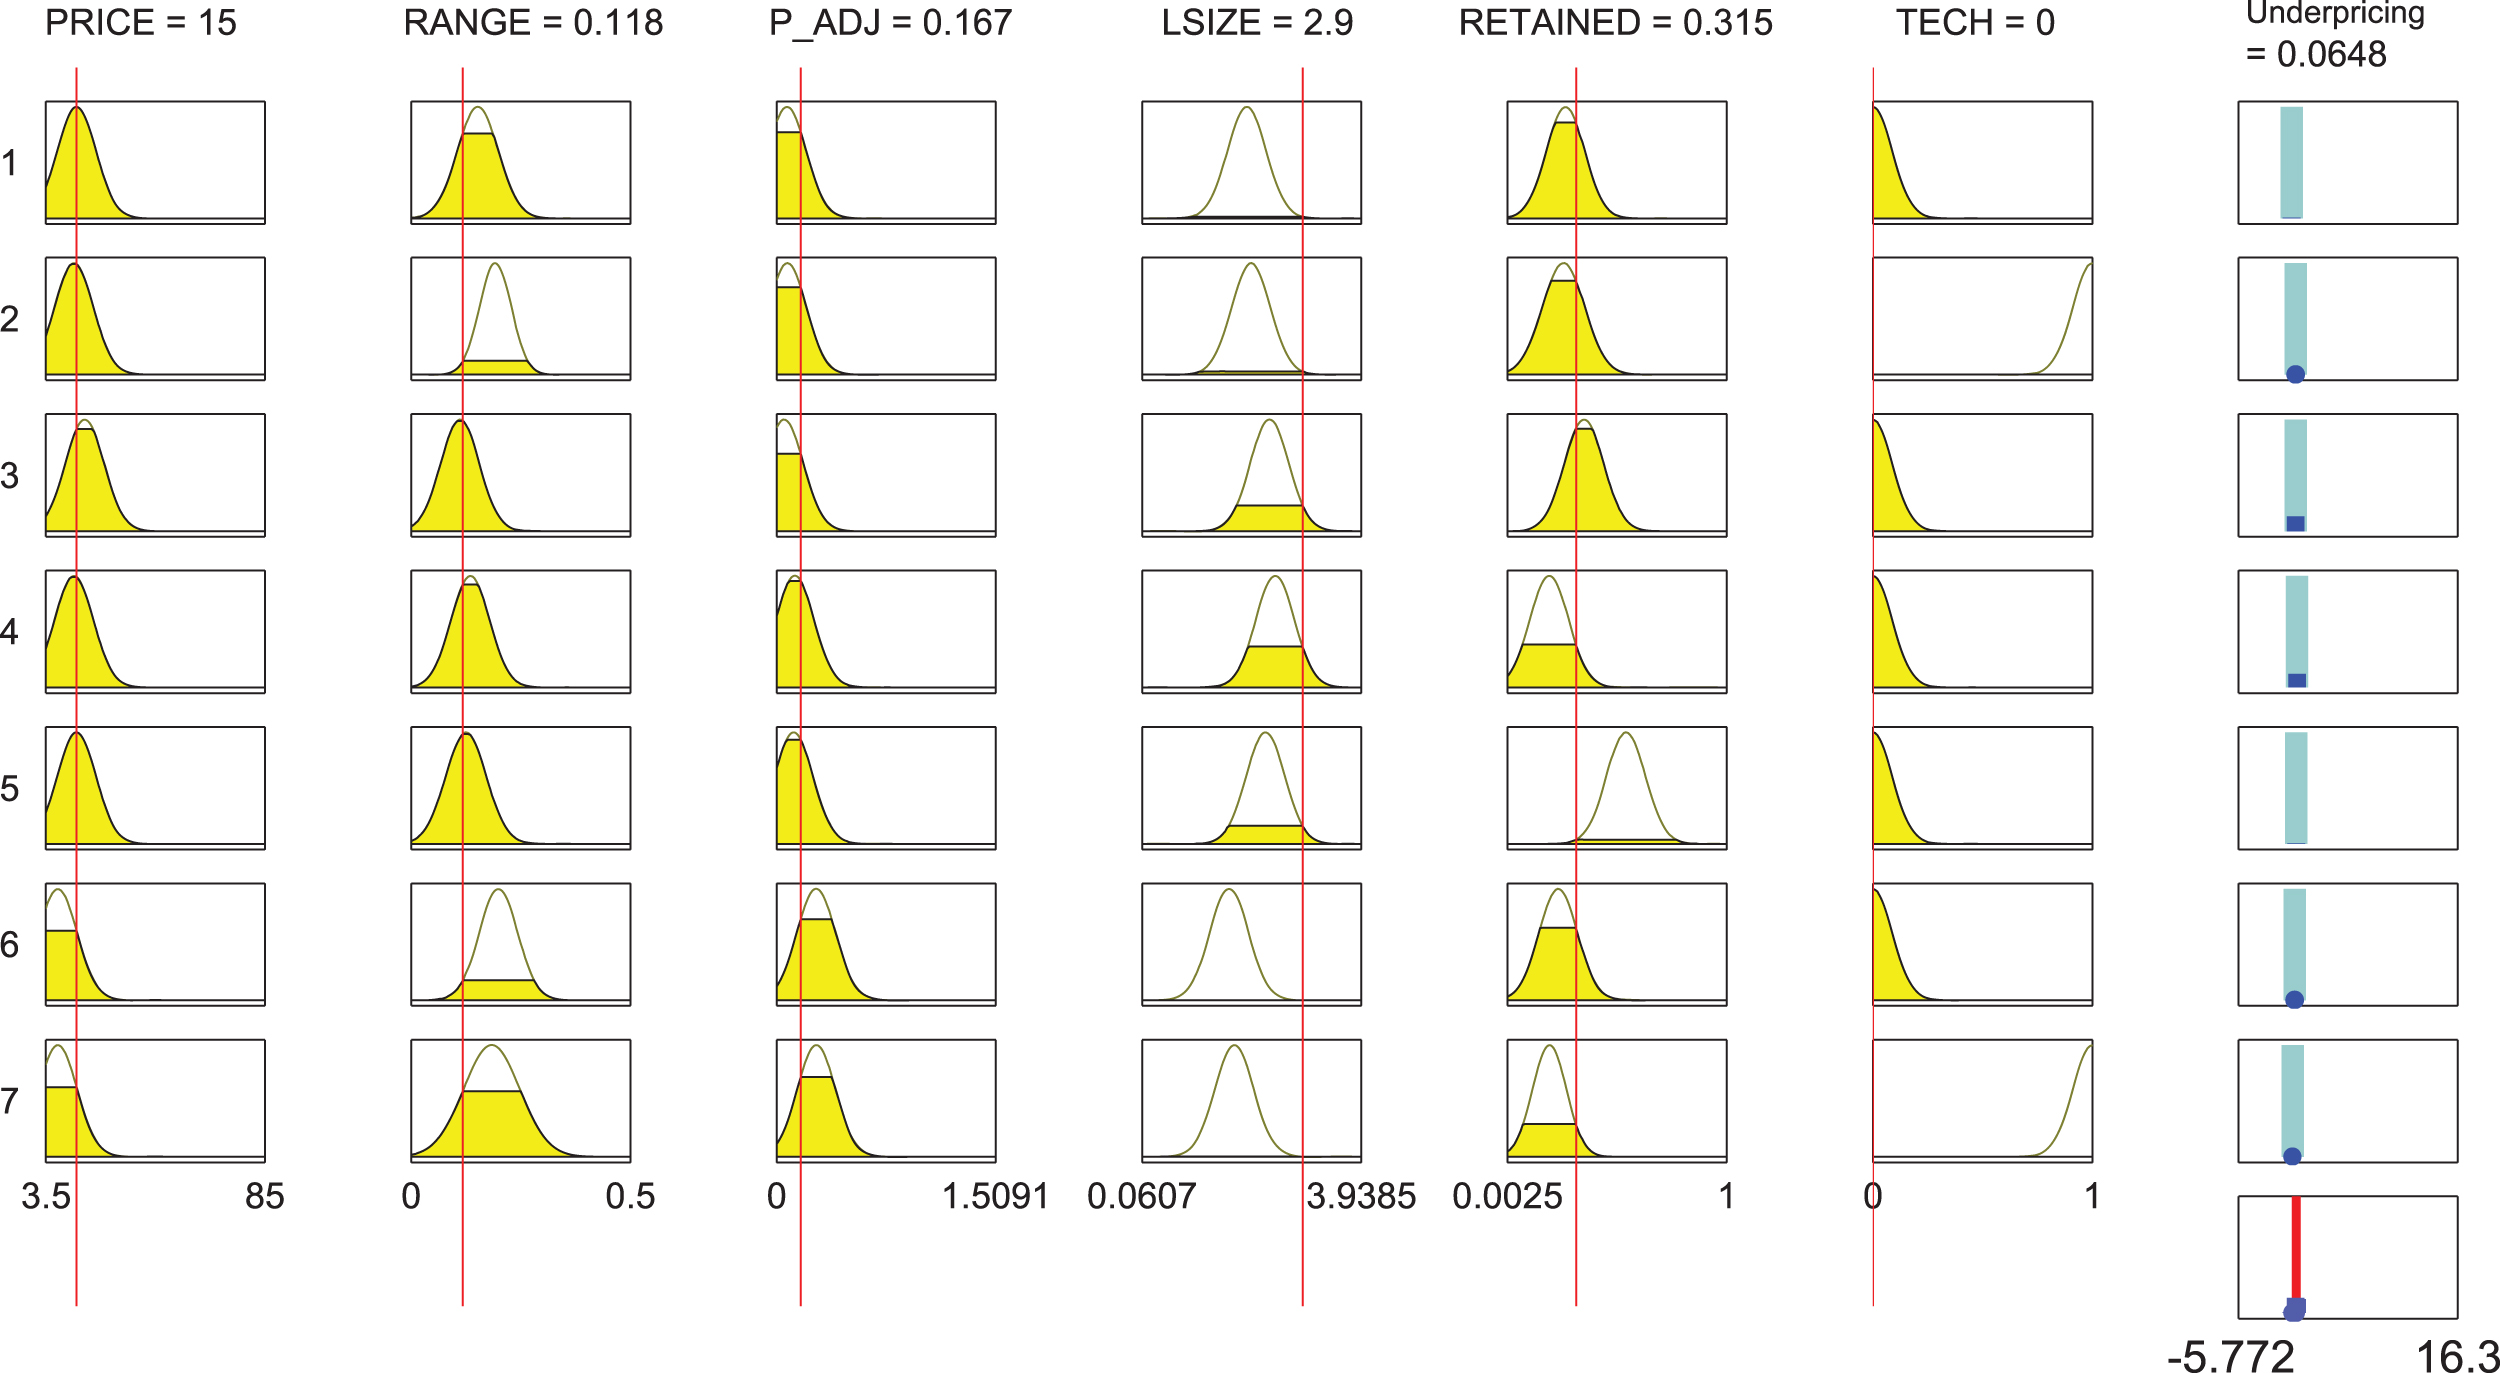
Figure 8 shows a representative fuzzy system with 25 rules, which allows us to interpret how the FRBSl-GA system works. It can be observed that all the variables do have 3 MFs, but V6 (TECH variable), which does only have 2 MFs, due to it is a boolean type variable (values 0 and 1). Just as an example, MF1 is the predominant one for V1 (PRICE), as it is present in 18 out of the 25 rules. This means that most of the data used to build the model does have rather low values for this variable. The same holds for V3 (P ADJ). Analogously, for the LSIZE variable, the data is mostly located MF2, which are the MF that represents the medium values.
Rule structure of FRBSl-GA.
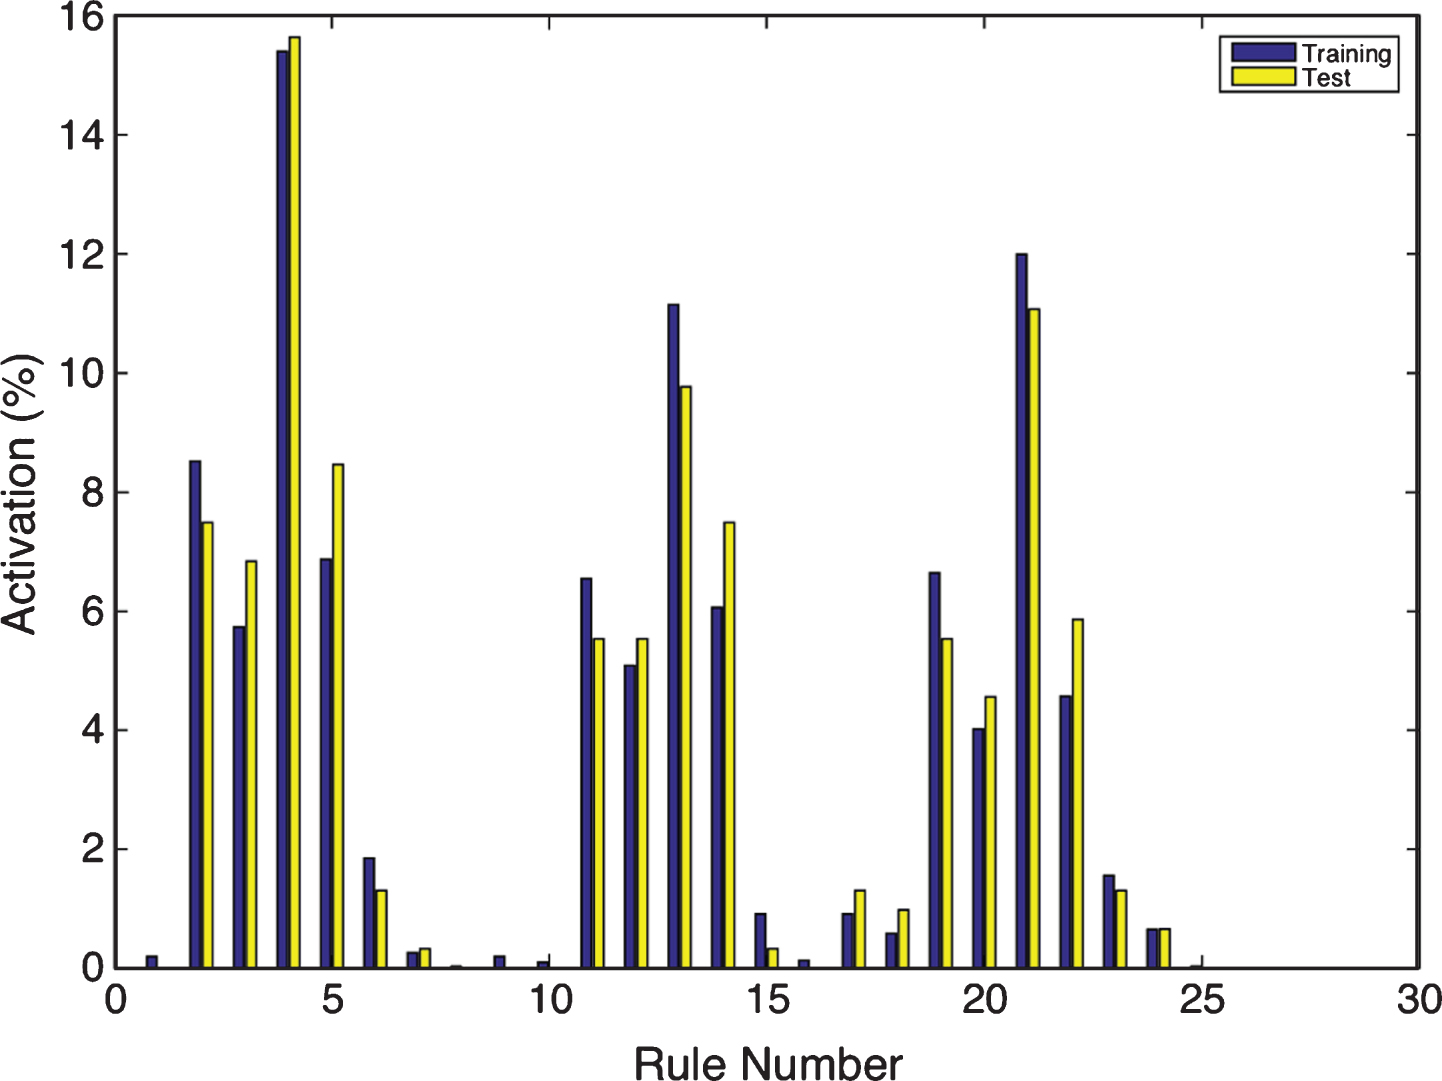
If we analyze the percentage of rules that are activated for each input data, displayed in Fig. 9, several interesting facts can be highlighted. First, there are very important rules in the system, e.g., Rule 4, which covers many input samples, both in training and test. But it is also remarkable that there are several rules that are activated a couple of times (e.g., Rules 7, 8 or 9). These rules are generated by FRBSl-GA in order to cover outliers. But note that if the outlier is in the training set, but not in the test set, then it is useless. Indeed, these rules might be critical for the final RMSE performance because, if one these rules is activated in test, but the outlier does not exist, the error gets dramatically increased.
Percentage of activation for the 25 rules in the example for FRBSl-GA.
The architecture generated by the ANFIS model uses seven rules with different Gaussian MFs for each pair, input variable and rule. Figure 10 shows an example of the activation of the rules, given a input sample. As we did with FRBSl-GA, Fig. 11 displays the percentage of input samples that activate each of the seven rules, both in training and test. It can be seen that the two first rules are the ones that get activated more times, which means that they represents larger clusters of input data. Contrary to FRBSl-GA, all the rules are eventually activated (no one is useless).
Rule structure of ANFIS.
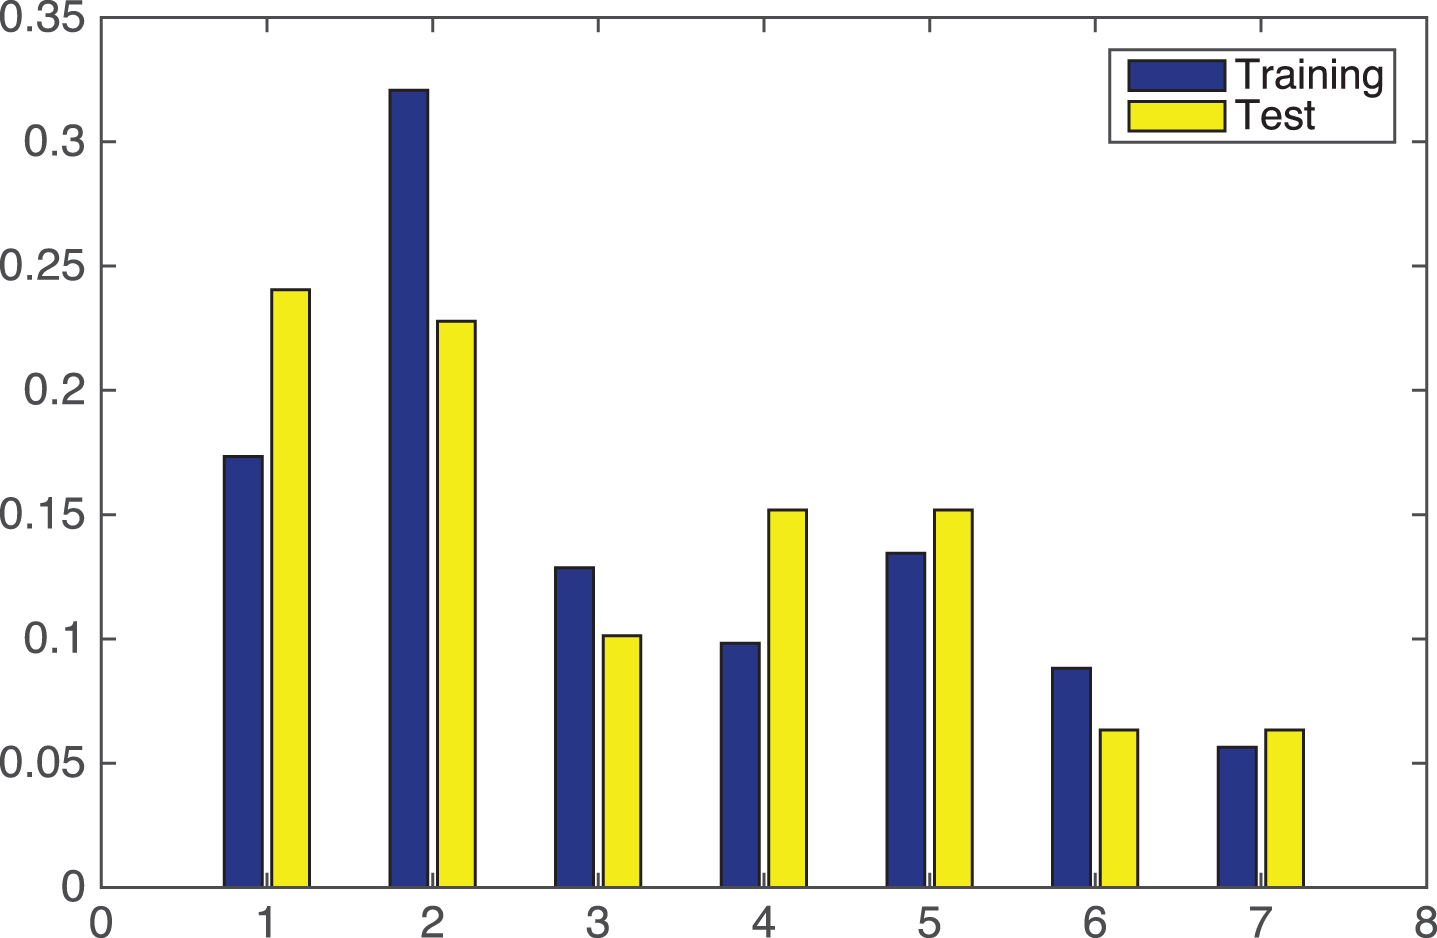
Percentage of activation for the 7 rules in the example for ANFIS.
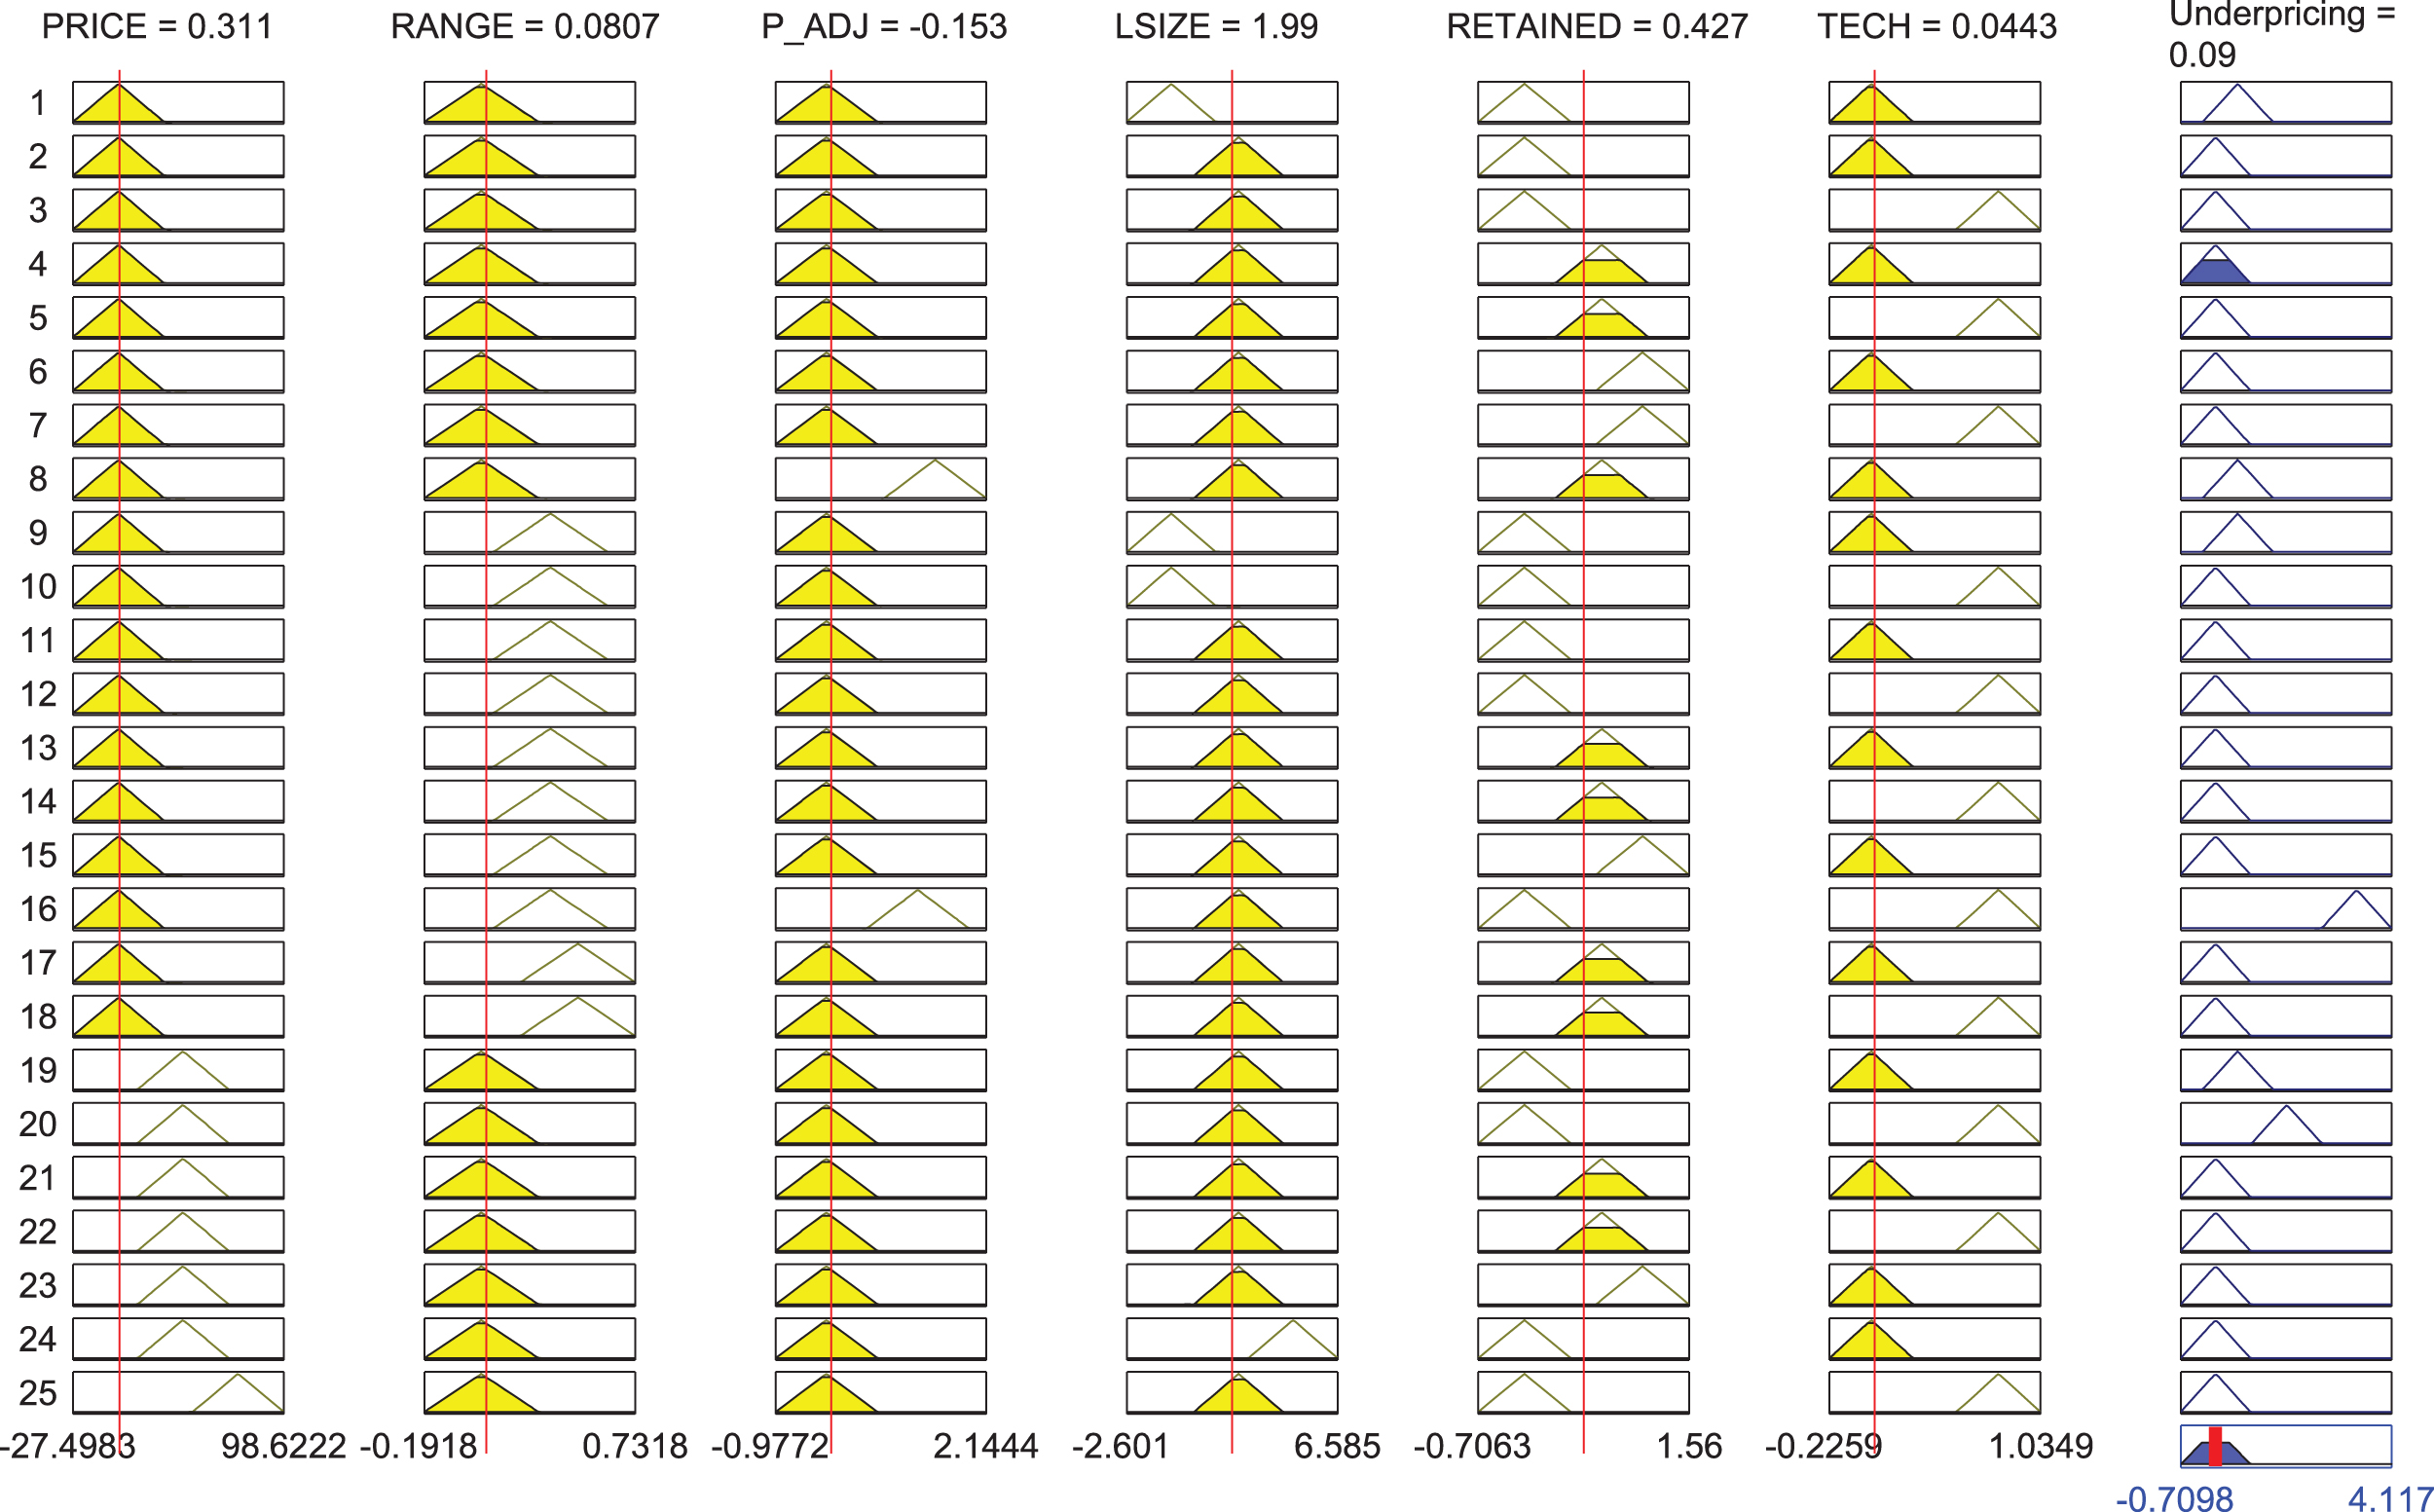
Finally, Fig. 12 shows the importance of the input variables for the system in terms of the weighting coefficients of the output MF. It can be easily seen that PRICE, P_ADJ, and LSIZE are the variables with the largest influence on IPO prediction.
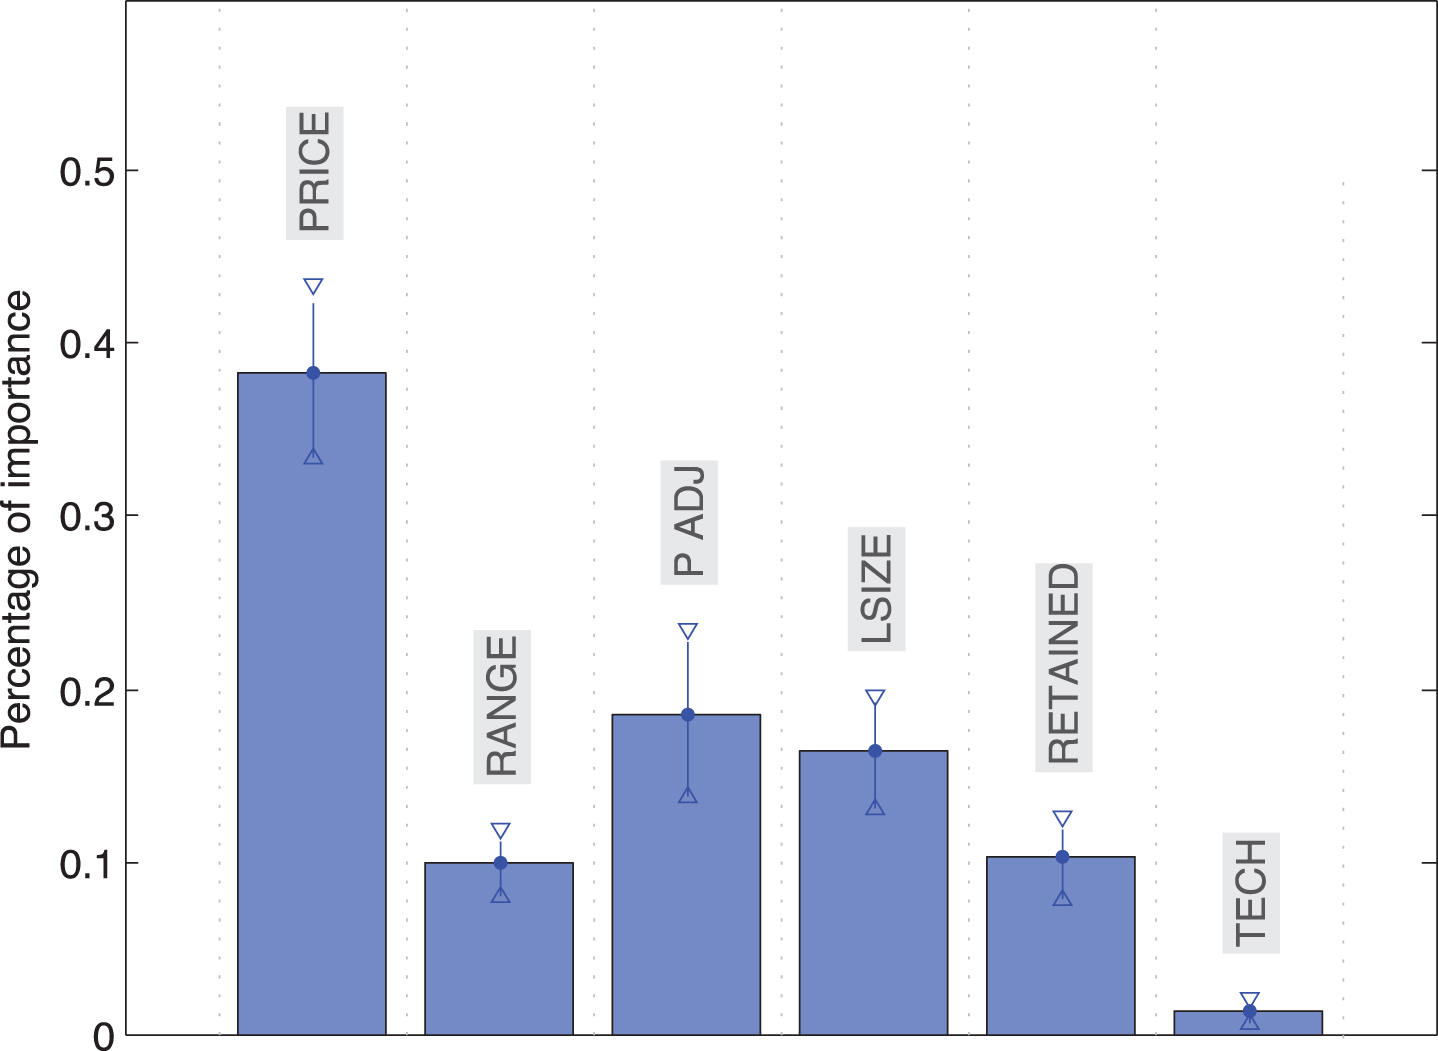
Importance of the variables on the underpricing prediction according to the ANFIS model.
As we already mentioned, we extend the basic study with a comparison of the predictive performance of FRBSl-GA and ANFIS vs. the six fuzzy systems to and the eight classic machines learning algorithms introduced in Section 2.3.
Tables 3 and 4 summarize the parameters used to run all the algorithms used for this analysis.
The best configuration found for the FRBSl-GA method, which is used for comparison to other techniques, is detailed below in Table 4.
Parameterization of fuzzy algorithms
Parameterization of fuzzy algorithms
Parameterization of benchmark algorithms
The experimental results are reported in Tables 5 and 6. There, we provide the main descriptive statistics for the RMSE obtained in the 15 repetitions of the 10-fold cross validation. For each algorithm we reported the average, median, variance, maximum and minimum RMSE.
Descriptive statistics of prediction errors of fuzzy methods
Descriptive statistics of prediction errors of machine learning algorithms
As we can observe, ANFIS provides the best average results followed by HYFIS, the fuzzy rule-based system, WM, IBK and M5P. In addition to the relatively low mean and median RMSE, we should highlight the fact that the approach seems to be the most reliable one among those with a stochastic component. The range of variation for the prediction error is narrow and its variance is very low. FRBSl-GA doesn’t seem as trustworthy in that regard as it offered a wider range of variation across executions. That is, the impact of the random component of every specific execution seems to be potentially higher. Having said that, it is still in line with the rest of the stochastic methods. The variance is relatively high, though in the same order of magnitude as LMS Regression and SMO.
On the opposite side of the spectrum, DENFIS, FS.HGD, LWL and SMO offer the worst average results. Even though support vector machines have been successfully used in many regression tasks, its sensitivity to the presence of outliers in the training set drags its performance in this domain. Conversely, ANFIS seems to handle this difficulty with much more efficacy.
We think that multilayer perceptron deserves to be highlighted despite of its discrete average performance. In one of the executions, it achieved the most competitive result versus ANFIS among the benchmark algorithms with an RMSE of 0.355. Interestingly, this also came together with the second worst prediction error and the highest variance.
The statistical significance of the differences reported in Table 7 was also formally tested. Given the non-normal distribution of the prediction errors, we relied on the Mann-Whitney test [40]. There, we represent the fact that the algorithm in the row has median prediction error that is significantly larger than the one in the column at 1% by++. A similar difference in the opposite direction is symbolized by –. In case the disparity is such that the first one is significantly smaller at 5%, we use –. Finally, if we cannot discard at 5% the possibility of equal predictive accuracy, we report =. The difference in median performance of ANFIS vs the rest is always significant at the 1%. This is also the case for FRBS and IBK, the third best algorithm.
Statistical significance of differences of medians
++: significant 1% +: significant at 5%. F1: ANFIS; F2: DENFIS; F3: FIR.DM; F4: FS.HGD; F5: FRBSl-GA; F6: HYFIS; F7 SBC; F8 WM. M1: IBK; M2: LMSReg; M3: LWL; M4: M5P; M5: M5Rules; M6: MLP; M7: RBFN; M8: SMO.
As we can see, these results support the idea that fuzzy approaches, ANFIS in particular, might be suitable in this domain.
IPO underpricing prediction is a domain with some specific characteristics that make it specially challenging. Among then we could highlight the fact that the set of descriptive variables identified by academic research is limited in their predictive power and mixes both weak and strong predictors. In addition to this, the presence of outliers that usually take the form of IPOs with extremely high initial returns add noise and difficulty to the process of training models.
Research on IPO underpricing prediction using fuzzy systems is extremely limited and it frames the problem either as a three-category classification task, or an effort to rank IPOs according to their expected performance. In this paper, however, we suggest that fuzzy systems can also be very powerful tools to handle it as a continuous variable regression task. In order to do that, we test the predictive performance of two different fuzzy approaches: neuro-fuzzy inference systems (ANFIS) and a fuzzy rule-based system with genetic optimization, FRBSl-GA, on a sample of 866 US IPOs. To this end, we use six variables identified by financial literature review that are available in public databases.
In order to have a meaningful base of comparison, we benchmarked the results against six fuzzy alternatives and eight popular machine learning algorithms that represent different algorithm categories. In the former group we considered subtractive clustering; Wang and Mendel; Hybrid neural fuzzy inference system; Dynamic Evolving Neural-Fuzzy Inference System; Fuzzy Inference Rules by Descent Method and the simplified TSK fuzzy rule generation method using heuristics and gradient descent method. The latter included several families of predictive algorithms as those based on functions, nearest neighbors, rules and decision trees. These included IBK; least median of squares regression; LWL; multilayer perceptron; M5P; M5Rules; radial basis neural networks and SMO-Regression.
The outcome of this comparison shows that ANFIS outperformed all the alternatives in terms of mean and median predictive accuracy over the 15 repetitions of the 10-fold cross validation analysis.
The technique also provided the smallest variance and error range among the stochastic algorithms. The fuzzy rule-based system FRBSl-GA offered very good average results, beating all the machine learning algorithms and most of the fuzzy benchmarks (the only exception was HYFIS). Compared to ANFIS, it also turned out to be less reliable as it resulted in a higher variance in prediction errors. Regarding the fuzzy alternatives, even though none beat ANFIS, they tended to offer better average performance than the classic machine learning ones. HYFIS offered very remarkable results. Even though the difference in prediction error vs. FRBSl-GA was not statistically significant, it obtained slightly better mean and median results. Despite of the superiority of fuzzy methods at large, DENFIS provided the worst performance among all the algorithms used in the experimental work.
Among the traditional algorithms used as bench-mark, tree-based M5P offered very good performance. We expected that because the algorithm tends to offer good outlier management properties, a key feature in this domain. However, we did not find a clear pattern showing that any broad category performs significantly better than the rest. Among lazy strategies, IBK offered very good results, but LWL did not. Function-based alternatives were much more consistent as a category, but their average performance was in line with the one of lazy approaches.
The fuzzy systems allow a straightforward analysis of the relative importance of the variables considered to forecast IPO underpricing. The ANFIS model suggests that price is, by far, the most important factor among the ones considered. Price adjustment and size are the main distant followers. This finding adds support to the signaling theories put forward in the financial literature. Being a Tech company does not seem to be as relevant as we anticipated. A potential explanation might be that most of the IPOs in the sample are post-internet bubble. It is likely that the crash that followed might have resulted in a structural change, but this would have to be tested.
The above mentioned results suggest that IPO research would benefit greatly from a wider use of fuzzy methods, especially ANFIS. Among the main advantages of this technique would be the strong predictive performance and the possibility to interpret the results, something that cannot be takenfor granted with other black-box machine learning techniques. The possibility of looking into the relative importance of the independent variables allows for better insights from the purely financial perspective.
Possible future lines of work would include replicating the analysis for samples from other countries, or periods of time to detect structural changes; exploring the potential of the mentioned fuzzy approaches to identify a priori hot IPOs, and exploiting this knowledge to devise trading algorithms.
Footnotes
Acknowledgments
D. Quintana acknowledges financial support by the Spanish Ministry of Science under grant ENE2014-56126-C2-2-R. F. Chávez acknowledges financial support granted by Seventh Framework Programme of the European Union through the Marie Curie International Research Staff Scheme, FP7-PEOPLE-2013-IRSES, Grant612689 ACoBSEC, Spanish Ministry of Science and Innovation under project TIN2014-56494-C4-2-P (EPHEMECH), regional government Gobierno de Extremadura and FEDER, project GRU10029. Rafael M. Luque and Francisco Luna acknowledge support by Ministry of Economy, Industry and Competitiveness under contract TIN2016-75097-P, and Universidad de Málaga under contract PPIT.UMA.B12017/15.