
Abstract
In this paper, a hybrid fuzzy clustering techniques using Salp Swarm Algorithm (SSA) is proposed. The proposed fuzzy clustering method is used to optimize the cluster centroids obtained as an under sampling method. The performance of the proposed fuzzy clustering method is compared with some well-known clustering algorithms to shows the superiority of the proposed clustering algorithm. In addition, a novel hybrid Automobile Insurance Fraud Detection System is proposed in which undersampling of the majority class is performed by using the proposed fuzzy clustering algorithm which eliminates the outliers from the majority class samples. The balanced dataset for automobile fraud detection obtained after undersampling undergoes classification. Different classifiers used for this purpose are Random Forest Classifier, Logistic Regression Classifier and XGBoost Classifier. The performance of each of the three classifiers is evaluated by considering different performance metrics such as sensitivity, accuracy and specificity. The proposed fuzzy clustering method along with XGBoost outperforms the other methods presented.
Keywords
Introduction
With the continuous progress in the field of media and communication networks, many new techniques to commit financial fraud have been developed. Financial fraud can be defined as an act of gaining illegal financial benefit in contrary to law, policy or rule [1]. Financial fraud includes credit card fraud, corporate fraud, insurance fraud and money laundering. Automobile insurance fraud refers to misleading an insurance company by claiming monetary support for vehicular theft or damage with the help of false documents [2]. Automobile insurance fraud has become one of the important concerns for insurance companies and also for the consumers as behavior of the person receiving the compensation in the event of an accident, is not always honest.
The automobile insurance fraud can be done by filling a fake application or by plotting accidents or thefts. The fraud detection becomes difficult in case of false representation of data [3]. Also only a small number of claims have been observed to be illegal making the detection process more difficult. Exact classification of fraudulent instances is important for Automobile Insurance Fraud Detection System (AIFDS). A robust automobile insurance fraud detection system must efficiently differentiate the malicious samples from the normal insurance claims. Moreover, it should minimize the misclassification rate.
In this paper a novel hybrid AIFDS is proposed in which undersampling of the majority class is performed by using salp swarm optimized fuzzy c-means clustering which eliminates the outliers from the majority class samples. Salp Swarm Algorithm (SSA) is used to optimize the cluster centroids obtained from Fuzzy C-means clustering (FCM) as an under sampling method. The undersampling results in a balance and reduceddataset which is used for the training phase of classifiers. In this work Random Forest Classifier, Logistic Regression Classifier and XGBoost Classifier have been used.
The rest of the paper is organized as follows: Section 2 gives a brief description of some related works. Section 3 describes the materials and methods required which discusses about Fuzzy C-Means, Salp Swarm Algorithm and the different classifiers used. Also it gives the details of the dataset and the outlier detection method using the proposed hybrid SSA-FCM approach. Section 4 presents the proposed automobile insurance fraud detection framework. Section 5 analyzes and compares the performance of the classifiers based on different performance parameters which demonstrates the efficiency the proposed method. Finally, Section 6 concludes the work by providing a brief summary.
Related works
A hybrid approach for stacking and bagging of meta-classifiers has been proposed by Phua et al. [4]. The class imbalance problem was overcome by performing under-sampling over the majority class. The balanced data is fed to basic classifiers like Naïve Bayes, C4.5 and Backpropagation Neural Networks. A Bayesian Dichotomous Logit model was applied to a Spanish automobile dataset by Bermudezet al. [5]. Thismethod calculates probability of imbalanced dataset using asymmetric links. Subelj et al. [3] proposed a graph based social network model which applies an iterative assessment algorithm to assign a suspicion score to each data point in the graph. The malicious claims are analyzed by the edges with the neighbouring nodes. Xu et al. [6] have used an ensemble learning technique based on rough set based neural networks. Here the whole data has been divided into non-overlapping rough subspaces and then neural network has been applied at each space. Tao et al. [7] used Fuzzy SVM which assigns a dual membership value for each fraud instance with respect to the sample mean vector. Based on the membership values the classification was done. In paper [8] oversampling of minority class is done by Synthetic Minority Oversampling Technique (SMOTE). Sundarkumar and Ravi [9] proposed another undersampling and outlier detection based on k-reverse nearest neighborhood (kRNN) and one-class SVM (OCSVM). As a result, the outliers and the noisy data were easily detected. Then basic models were applied to the pruned dataset. Subudhi and Panigrahi [10] proposed yet another efficient approach for outlier detection in the majority class. They applied Genetically Optimize Fuzzy C-Means clustering over the majority class. FCM helps in finding meaningful clusters by assigning Fuzzy membership values. The Euclidian distance of each data point was calculated from the cluster centres. If the distance was more than a threshold value, then the data point was treated as an outlier and hence removed. The cluster centres obtained from FCM were optimized using Genetic Algorithm. The irrelevant data points in a dataset are responsible for decreasing the efficiency of a classifier [11].
Fuzzy C-means is a faster clustering algorithm but it gets trapped in the local minimums easily [12]. Taherdangkoo and Bagheri [13] proposed a hybrid FCM and Stem cells algorithm (SCA) so that SCA can solve the local optima problem caused by FCM. For every iteration SC-FCM implements FCM to the cells to improve the fitness value. In the recent years different variants of Particle Swarm Optimization (PSO) have been proposed to improve the performance of the optimization method. Esmin et al. [14] have given a review of implementation of PSO and the variants of PSO in clustering high dimensional data. For linearly non-separable and complex datasets PSO has been considered as more suitable to find the centroids of clusters. For better management and characterization of uncertainty in data, a clustering algorithm termed as interval valued possibilistic fuzzy c-means (IPFCM) has been proposed by Yong Xia et al. using two fuzzifiers [15]. Here an interval valued fuzzy set is introduced into possibilistic fuzzy c-means method to overcome the drawbacks of IFCM and IPCM.
Hassanzadeh and Meybodi have proposed a firefly optimization based clustering algorithm and compared the obtained results with PSO, K-means, and K-PSO considering standard datasets [16]. Han et al. [17] proposed a clustering algorithm based on the Bird Flock Gravitational Search Algorithm (BFGSA). The algorithm is compared with the GSA, the Artificial Bee Colony (ABC), the Firefly Algorithm (FA), K-means and different variants of Particle Swam Optimization such as NM-PSO, K-PSO, K-NM-PSO, and CPSO. The experimental results shows better performance of BFGSA over other compared algorithms. Firouzi et al. introduced a hybrid Simulated annealing and ant colony optimization based data clustering algorithm [18]. Kao et al. has implemented the hybrid of PSO and K-means [19] and compared with Genetic Algorithm based clustering [20] and hybrid of GA and K-means [21] to improve the clustering result. This algorithm has a better convergence characteristic with a few numbers of evaluations. However, the main drawback is having the overlapped data points. A new data clustering approach is proposed in paper [22] based on PSO integrated with the kernel density estimation (KDE). KDE is used to improve the balance between exploitation and exploration. The hybridization of improved PSO and genetic algorithm (GA) along with K-means algorithm improves the convergence speed as well as helps to find the global optimal solution. In the first stage, IPSO has been used to get a global solution in order to get optimal cluster centres. Then, the crossover steps of GA are used to improve the quality of particles and mutation is used for diversification of solution space in order to avoid premature convergence.
Elimination of the noisy instances from the original imbalanced dataset is important for an AIFDS. In this proposed work the SSA based FCM (SSA-FCM) clustering is used for undersampling of data which eliminates the outliers. FCM is used to manage the overlapping of cluster boundaries. The Salp Swarm Algorithm is applied to optimize the cluster centres obtained from FCM. For the designing of AIFDS, the proposed SSA-FCM is used and the claims which are found to be suspicious are verified by three different classifiers.
Materials and methods
This section gives a detailed overview of fuzzy C-Means clustering, proposed fuzzy clustering based on Salp Swarm Algorithm and how it is used for the outlier detection. Also, the classifiers used for classification are described.
Fuzzy C-means clustering
Fuzzy C-Means clustering (FCM) method developed by Dunn [23] and improved by Bezdek [24] permits a single piece of data to belong to more than one cluster by assigning a degree of membership to each data point. The FCM method minimizes the objective function J
m
given in Equation (1).
Where, m is any real number (m > 1), x i is the ith data point, u ij is degree of membership of x i in cluster j, c j is the jth cluster centroid. The FCM algorithm consists of the following steps.
Initialize the data matrix U = [u
ij
] Calculate the centroids vector for kth iteration C(k) = [c
j
] using Equation (2).
U(k) and U(k+1) are updated by calculating u
i
j using Equation (3).
If ∥U (k+1) - U(k) ∥ < ɛ, then stop Else go to step 2.
Overview of Salp swarm algorithm
Salp swarm algorithm (SSA) is inspired from the swarming behaviour of salps based on their foraging and navigation in oceans [25]. Salps belong to the family salpidae of order salpida. They are one of the most successful colonizing marine animals. Salp is a planktonic tunicate which has a barrel shaped, transparent, gelatinous body. It contracts itself and pumps water through its body to move forward. During the life cycle of an adult salp, it has two phases. In the first phase a salp swims alone and lives in solitary. In the second phase the salps join together to form colonies. The colonies of salps form long chains for better foraging and improved locomotion. The chains may be in the shape of a wheel or a line or any other architectural design.
The swarming behaviour of salps and the swarm chain is mathematically designed to solve optimization problems. For better modeling the population in the salp chain is categorized into leader and followers. The salp at the front of the chain is considered as leader and the rest of the salps in the chain are categorized as followers. The leader guides the chain and the followers follow the leader and also each other.
For mathematical modeling the position of all salps are taken in a two dimensional matrix x and there is another variable F, which is considered as the food source in the search space. The food source is the swarm’s target. The position of the leader is updated using Equation (4).
Here l is the current iteration and L is the maximum number of iteration. c2, c3 are random number in the interval [0,1].
The position of followers is updated using Equation (6).
Where, i ⩾ 2 and
Wehave integrated SSA with FCM to obtain better clusters with reduced total cost. This is a meta- heuristic approach which tries to find the optimal solution. FCM is applied to the data points to obtain the initial clusters and SSA is used on the obtained clusters to optimize the cluster centres’ positions. Each cluster for which the optimization is being carried out is initialized as the salp population. The cost function of the population is calculated and the best fitness value is considered as the food position F. The leader and the follower positions are updated using the Equations (4 and 6) respectively. The same procedure is continued until the end criterion is satisfied. The final food cost and food position gives us the optimum cost and optimum cluster positions respectively. Again, FCM is performed using the obtained optimized centres which results in optimal clustering. The leader first exploits the solution and then explores around it. During the location update, some salps may deviate out of the search space. They are amended and brought back inside the search space. The pseudocode for the fuzzy clustering algorithm using Salp Swarm Algorithm (SSA-FCM) is given below: Perform FCM on the original dataset Segregate the data in terms of their respective clusters c1, c2, … c
k
For each cluster 1 to k Randomly initialize the salp population with the data points of cluster k Calculate the cost function for each salp Food Position = Positionof the salp with best fitness t = 1 While t < max _ iter
Calculate c1
Update position of leader using Equation (4)
Update positions of followers using Equation (6)
Amend the salps based on upper and lower bounds of the respective dimensions Calculate Fitness of each salp Update the Food position if there is a better solution t = t + 1 Return the Food position as the best solution Perform FCM again with the obtained cluster centres
The proposed fuzzy clustering algorithm using Salp Swarm Algorithm (SSA-FCM) has been applied on seven benchmark datasets. The datasets are Iris, Wine, Seed, Breast cancer, Glass, E-coli, and CMC [26]. The performance of the SSA-FCM algorithm is compared against the performance of PSO-FCM, FCM and K-Means based on intracluster distance and F-measure as performance parameters. Intracluster distance and F-measure are the factors responsible for the quality of clustering [27]. Better quality of clusters is obtained if the intracluster distance is minimum and the F-measure is maximum. Theresults obtained from SSA-FCM and its comparison with PSO-FCM, FCM and K-Means for the seven datasets are given in Table 1.
Performance comparison of SSA-FCM, PSO-FCM, FCM and K-Means
Performance comparison of SSA-FCM, PSO-FCM, FCM and K-Means
From Table 1 it is clear that the proposed fuzzy clustering based on Salp Swarm Algorithm (SSA-FCM) performs better than PSO-FCM, FCM and K-Means in terms of intracluster distance and F-measure. Furthermore from the Friedman’s test [28, 29] performed for the four algorithms and 7 datasets gives the value of Friedman’s statistic (X F 2 ) as 21 and the Iman and Davenport statistics (F F ) as infinite. The rank test for the Friedman’s test based on intracluster distance is given in Table 2. The critical value for the degree of freedom F(3,18) as calculated from the number of algorithms and number of datasets is 3.16 for level of confidence α= 0.
Rank test of the clustering algorithms obtained from Friedman’s test
The Friedman’s test proofs the existence of difference in the performance of the algorithms as the critical value attained is less than the F F value. However, the superiority of the proposed SSA-FCM algorithm is proved from the Holm test [30]. Table 3 provides the results of the Holm test for the algorithms with SSA-FCM as the control group. In is clear from Table 3 that the SSA-FCM performs better than all compared methods as the hypothesis is rejected for all cases.
Results obtained from Holm test
In this work three different classifiers are used for the training of the balanced and reduced dataset. Those are Random Forests Classifier (RF), Logistic Regression (LR) Classifier and XGBoost Classifier.
Random forests classifier
Random forest (RF) is a very powerful machine learning model used for the purpose of classification and regression [32]. A random forest is a collection of a given number of decision trees. This number is specified by the user as a parameter. After a number of decision trees are created from the training data, each testing data sample is allowed to pass through each tree. Therefore, each constituent tree predicts a class label for that test sample. A majority voting is performed in order to obtain the final class label. It is important for the decision trees involved to bedecorrelated. The algorithm works in the following way.
Entropy is a split criterion for decision trees. This is the opposite of Information Gain and is the measure of impurity. For a binary classification problem Entropy is given by Equation (7).
Where, p1 is the Probability of samples of class 1 and p2 is the probability of samples of class 2. So, for a given feature the entropy values are calculated before and after the cut. If the value decreases the split is done otherwise another feature is chosen. This difference is termed as the Information gain. The attribute having the highest information gain for that given sample is used as the root node. Other nodes are chosen in terms of decreasing order of information gains.
The next parameter is the number of trees. As a general rule the number of trees is taken as the double of the number of features for better accuracy. In this work, we have generated 25 features. The number of features has increased because of dummy encoding. As a result, the number of decision trees is taken as 50. It is found that the model gives best performance when M is 50.
Logistic Regression (LR) is an excellent binary classification technique which finds its application in fraud detection systems. It is used in datasets where two or more independent variables are used to decide an outcome which is a dichotomous variable. It can be considered as an extended version of linear regression. Instead of dealing with real values, it deals with binary outcomes. A probability score is assigned to each outcome. Based on that score the class of the sample is decided. In case of linear regression, we are concerned with the best fit line. However, in this case the main concern is the best fit sigmoid curve. The sigmoid curve provides an excellent way for studying probability distribution owing to its shape.
The mathematical equation for logistic regression is given by Equation (8).
Here a0, a1, … a n are the coefficients and X1, X2, … X n are the independent variables. p is the probability of occurrence of a characteristic.
And,
The term
Regularization is used in Logistic Regression to simplify the hypothesis and to prevent over fitting. It is basically a penalty term which is added to the cost function. The two most commonly used regularization methods are L1 and L2. For the project L2 regularization is used. The details are given below.
Let C old represent the cost function of the logistic regression. After adding the penalty term, the new cost function is given by Equation (10).
Here λ is the regularization parameter, m is the number of independent variables and a i refers to the ith coefficient.
In case of L1 regularization, instead of squaring each coefficient, we take the absolute values. Regularization aims to decrease the magnitude of the coefficients, which helps in preventing overfitting.
XGBoost is developed by Tong He and Tianqi Chen [33] and it stands for eXtreme Gradient BOOSTing. It involves boosting techniques which aims to obtain a stronger classifier by combining the predictive power of the weaker constituent classifiers. It uses Decision trees as its constituent classifiers. It is a highly scalable and a computationally faster model and is used for classification, ranking and regression. It is an ensemble method just like random forests. However, it uses an iterative learning algorithm. In this method new tries are grown using the information from the previously grown trees. At each iteration the misclassification points of the current tree are taken into consideration, and these points are assigned weights. The next iteration aims to produce a tree which helps to classify the above-mentioned points properly. Therefore, a new tree is obtained at the end of every iteration. The final model combines all the trees, thereby decreasing the misclassification error. Thus, the whole process is iterative and additive in nature. XGBOOST has dedicated libraries in python and R. Therefore, it can be implemented easily. Here also, just like logistic regression L1 or L2 regularization is used.XGBOOST is a very powerful model and as expected produces better results than the previously used models. In this work default parameters were used for creating the model.
Details and preprocessing of the dataset
The dataset “carclaims.txt” [4] has been used in this work which is the only publicly available dataset for automobile fraud detection. However, the data has been cleaned resulting in no missing or out of bounds value in the whole data. For verification the above the dataset has been examined properly using Weka Data Mining software to get a basic idea about the range of values for each feature. Here, the problem is the binary classification, i.e. there are two classes namely Fraud and No Fraud. The dataset is completely numeric and the categorical variables present in the dataset are encoded to numbers. The dataset has 21 features including the class label (Fraud or No Fraud) and has 15420 rows. The data distribution is however heavily imbalanced. The number of fraud samples is 923 and the number of No fraud cases account to 14496. The minority class accounts to just 5.985% of the total dataset. Some important features of the dataset are described in the Table 4.
Important features of the dataset
Important features of the dataset
The concept of dummy variables is used for dealing with categorical data. For example, for the class marital status there are 4 categories. They are encoded from 0–3. They are converted to Dummy variables by creating 4 new rows (The number of rows to be created is always equal to the number of categories present). Thus 0 leads to row vector – [1, 0, 0,0], 1 leads to – [0, 1, 0, 0] and so on. Figure 1 shows the encoded dummy variables of a feature having three categories. In order to prevent the dummy variable, the first newly generated row is deleted. Here there is no loss of information.
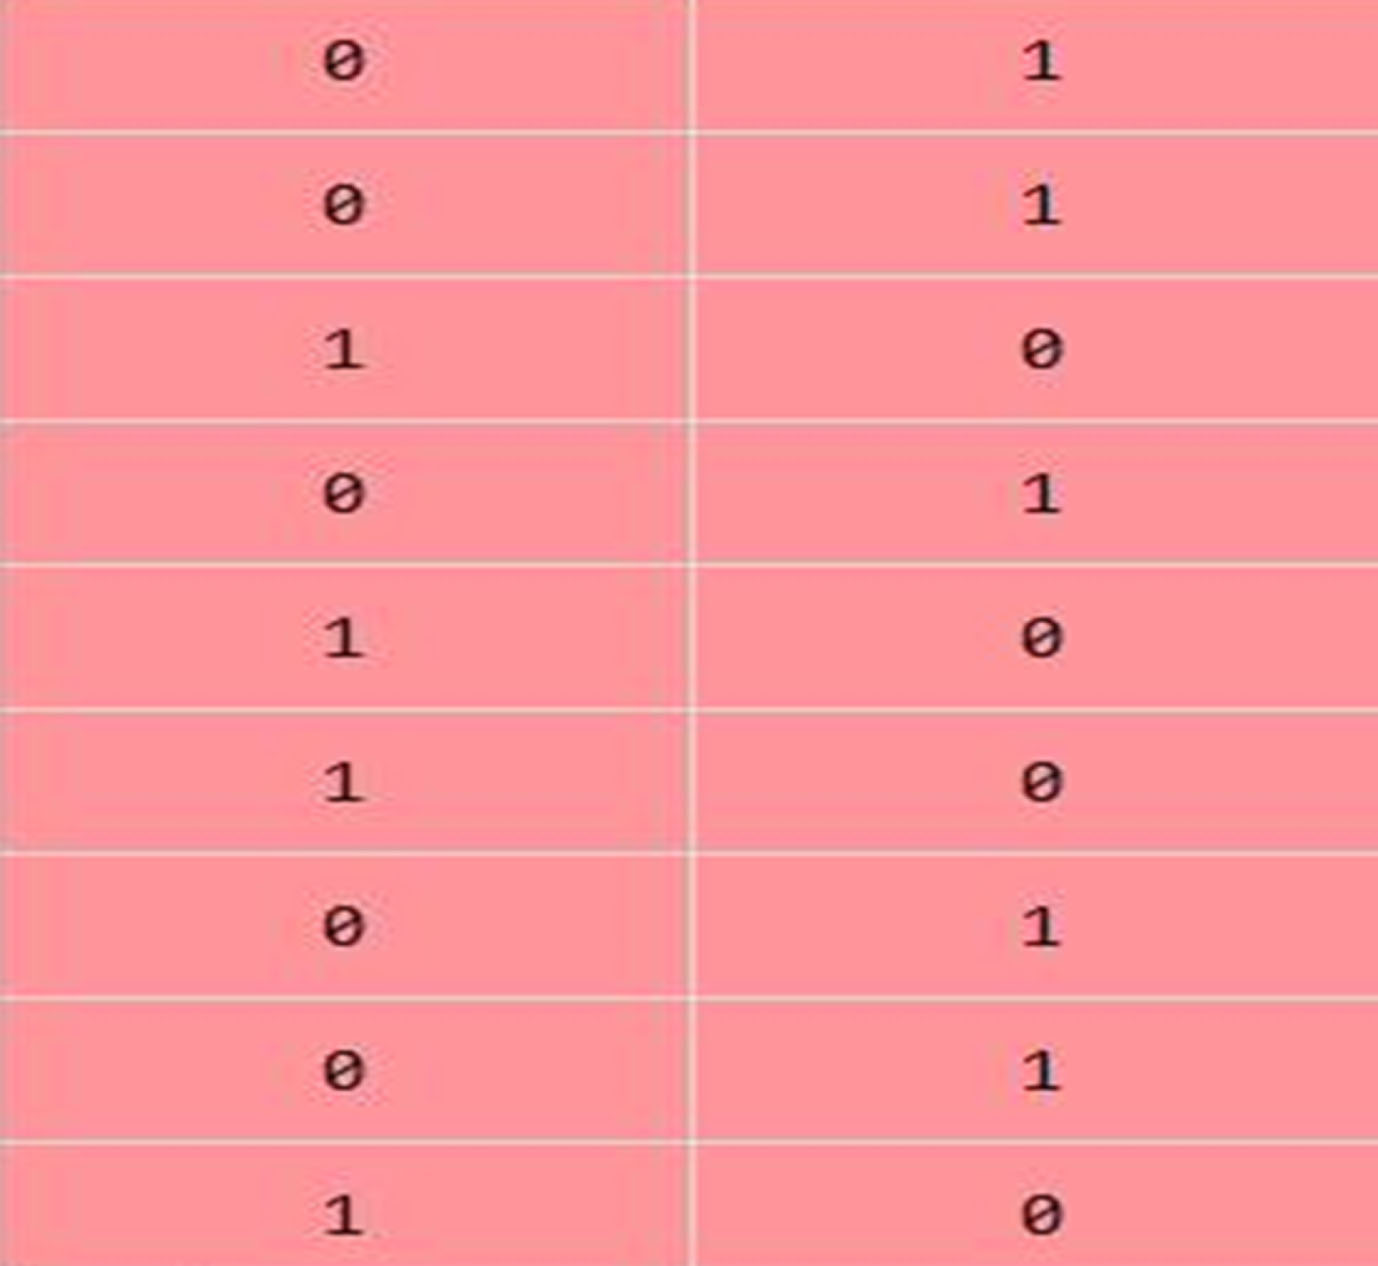
Encoded dummy variables from a feature which has 3 categories.
For tackling the class imbalance problem, we have used 3 methods and compare among them. Those are: (1) Performing Random Undersampling over the majority class, (2) Performing FCM over the majority class and remove the outliers and (3) Performing SSA optimized FCM over the majority class and remove the outliers.
In this work, we have proposed an AIFDS to reduce misclassification error in turn to increase the accuracy for the considered insurance data set. The proposed fuzzy clustering technique based on SSA-FCM is applied over the majority class to detect the outliers present in the samples. The outliers are removed and outlier free data set is fed to the classifiers. Figure 2 shows the process of outlier detection and classification using the classifiers. Outlier detection is performed by the following methodology:
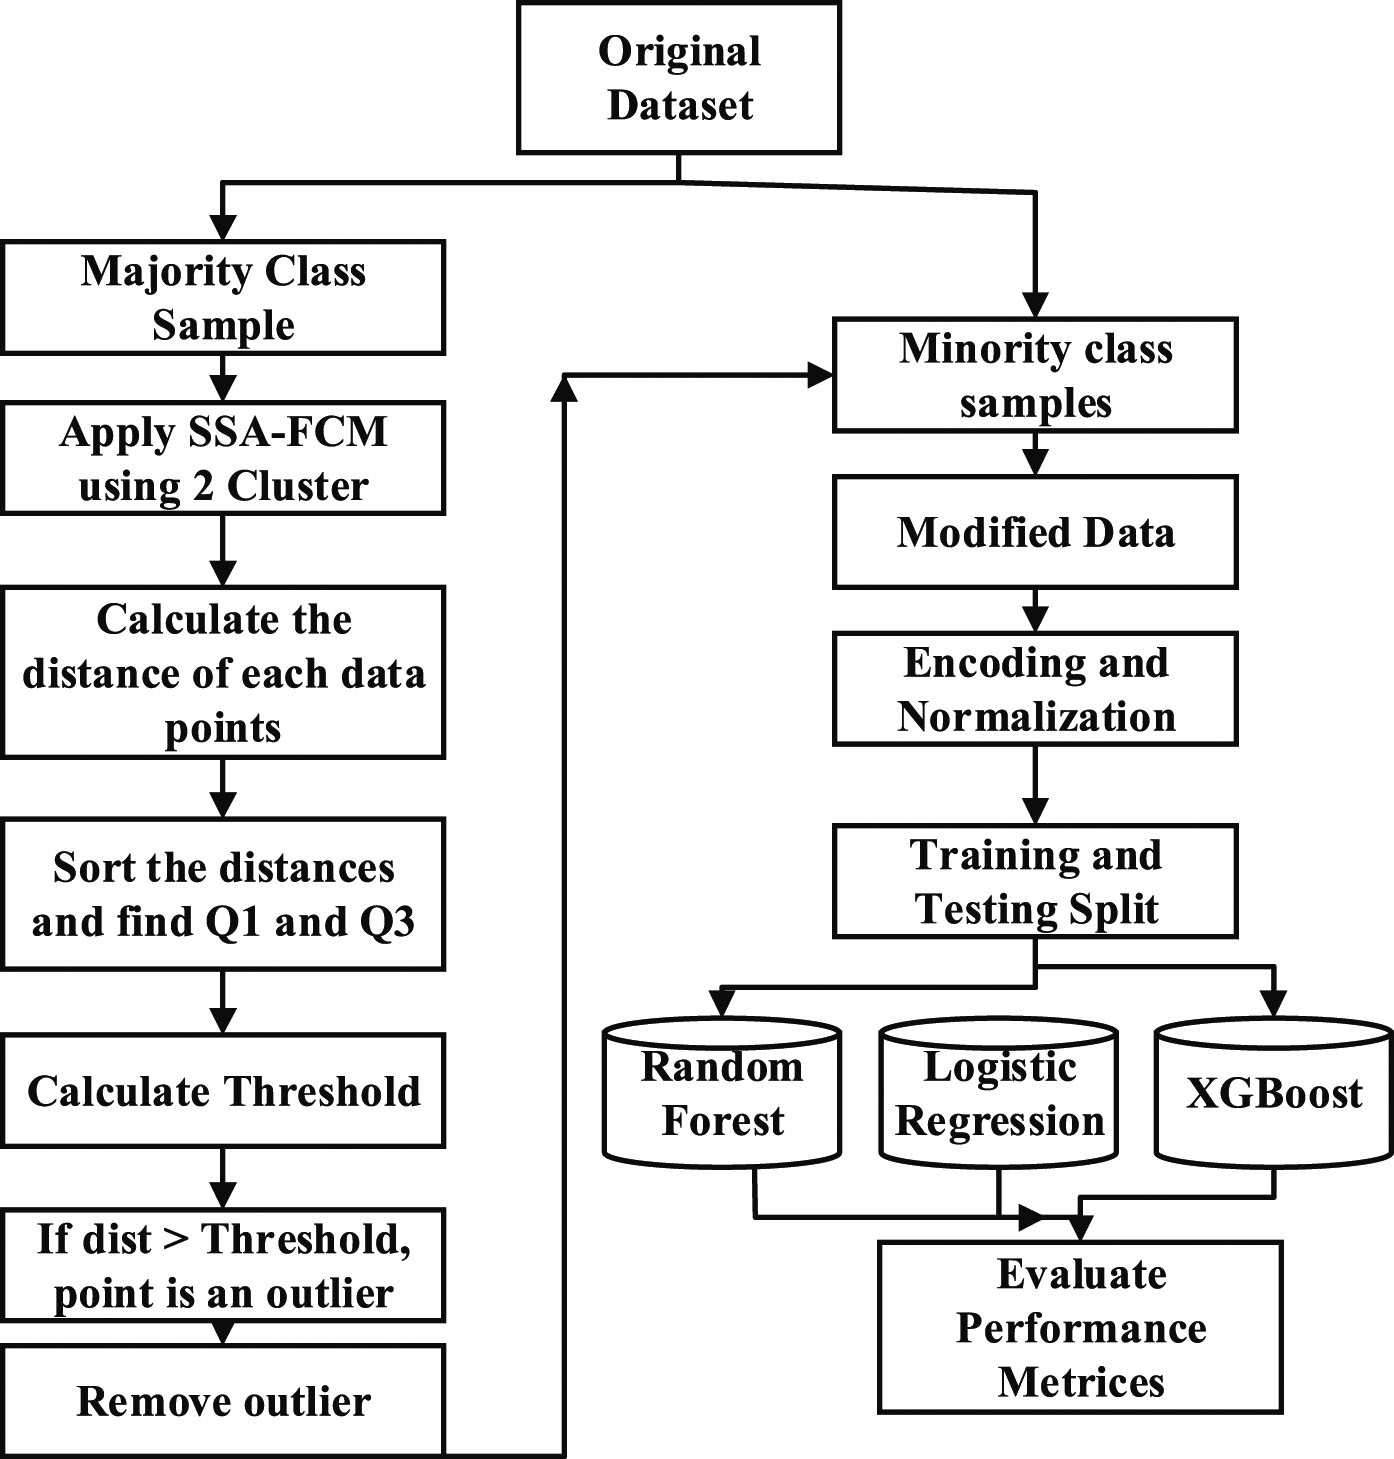
Outlier detection using proposed fuzzy clustering.
Where, dist i is the distance between the cluster centre and ith data point, N is the number of dimensions, c i is the cluster centre of the ith data point and d i is the ith data point.
If dist i > α the data point is an outlier. The outliers are marked accordingly.
After removing the outliers from the data set, a balanced data set is prepared by considering the outlier free major class points and minor class instances. Once the balanced data set is ready, the proposed AIFDS evaluates the claim as genuine, fraudulent or suspicious based on comparison of cluster centers distance value with the lower limit (L
l
) and upper limit (U
l
) as given in Equations (12 and 13). These upper and lower boundary values are calculated using Tukey method [31].
If the cluster center distances are less than the lower boundary then the claims are considered as genuine. If the distance is greater than the upper boundary then claims are taken as fraudulent and distance is in between lower and upper limits, then it is considered as suspicious. The clearance should be made for genuine cases where as precautions will be taken for the fraudulent case and suspicious cases are further analyzed by supervised classifiers. Classifiers such as random forest, logistic regression and XGBoost are considered in our work. The classifiers will take the input suspicious data sets and based on the classifiers output a decision will be made regarding genuine or fraudulent. Next, the performance of the classifiers is evaluated and analyzed.
The proposed Automobile Insurance Fraud Detection System based on SSA optimized fuzzy clustering method is implemented in MATLAB 2016 on a 2.4 Ghz core i5 CPU system. The majority class of the dataset has 14496 samples, which accounts for almost 94% of the total data set. Hence by performing clustering over the majority class the outliers present in the samples are detected and removed before the dataset being fed to the classifier. The clustering parameters are specified in Section 5.1 and the performance metrics such as sensitivity, accuracy and specificity are given in Section 5.2. These measures are used to evaluate the performance of the proposed system.
Clustering parameters determination
In FCM the number of clusters required to group the data is determined by two parameters namely Partition Co-efficient (PC) and Partition Entropy (PE). PC is the average of membership value shared in between each fuzzy subset pair inside themembership matrix U. The Partition Co-efficient (PC) is given by Equation (14).
Where, n is the number of data points and c is the number of clusters.
PE gives the amount of fuzziness present in U and it is given by Equation (15).
These values are calculated for different values of c, where c is the no. of cluster centres.
The performance of the proposed method is measured based on different performance metrics such as Sensitivity, Specificity and Accuracy.
Sensitivity is the ratio of the number of truly classified samples to the total number of true samples. Sensitivity is considered as the main metric since it gives the fraud detection rate of the model.Sensitivity is calculated using Equation (16).
Where TP is True Positive and FN is False Negative.
Specificity refers to the proportion of the truly negative samples that were classified as negative by the classifier. Equation (17) calculates the Specificity.
Where TN is True Negative and FP is False Positive.
Accuracy is an overall metric which estimates the correctness of the classifier. Equation (18) is used to calculate Accuracy.
Where TP is True Positive, TN is True Negative, FP is False Positive and FN is False Negative.
By considering, the number of clusters c = 2, Partition Co-efficient (PC) is found to be maximum and Partition Entropy (PE) isfound to be minimum using Equations (14 and 15). Therefore, the number of clusters for the given dataset is considered as 2. The distance of each data point with their respective cluster centres are calculated using the distance formula given in Equation (11) and the obtained distance values are sorted. From the sorted values the first quartile (Q1) and the third quartile(Q3) are calculated. For the given dataset, the value of first quartile is found to be Q1 = 4.0065 and value of third quartile is found to be Q3 = 5.0045. The threshold value α is calculated using the values of Q1 and Q3 and for the given dataset the value of α is calculated as 8.0029. If the distance of the data point is greater than the threshold value then the point is detected as an outlier and is removed. The pruned samples are combined with the minority class samples to form the modifieddata set.
FCM as well as proposed fuzzy clustering using salp swarm algorithmare applied over the majority class samples. Considering the above given value of the threshold, 7267 data points has been detected as outliers and removed. The modified class now has 7229 genuine samples and 923 fraud samples. This trimmed data is fed to the classification models described in Section 3.3. For proposed fuzzy clustering, the number of iterations performed was 100, and from the convergence curve it is clear that the value remains constant after the 95th iteration. The convergence curve is given inFig. 3.
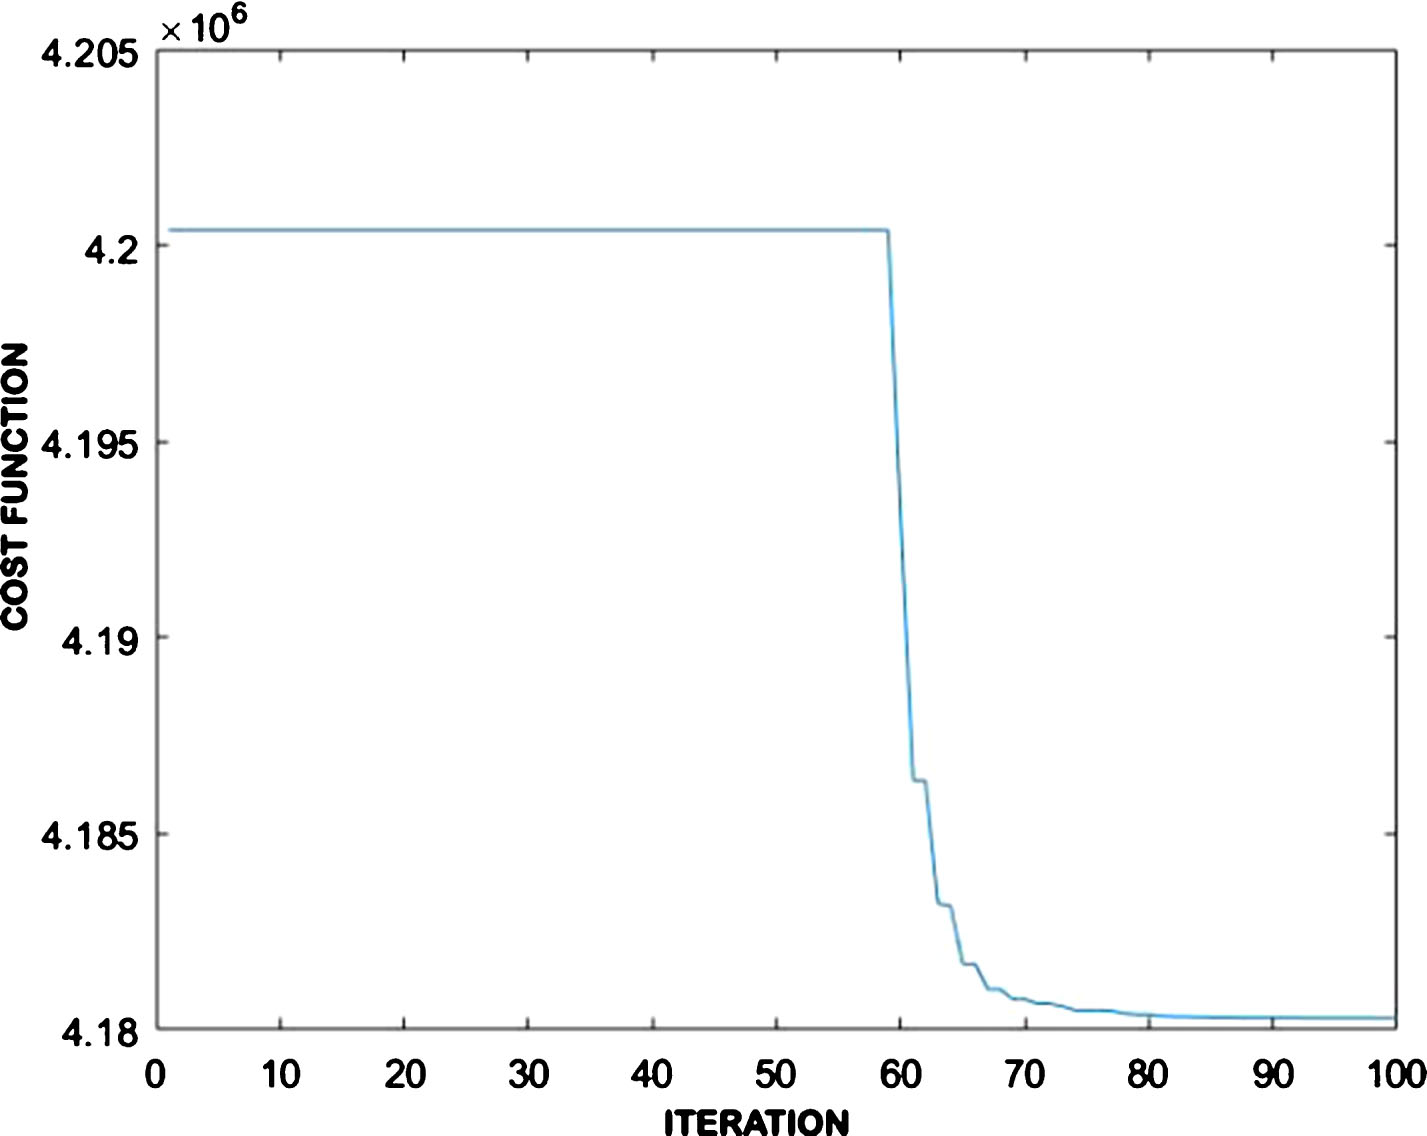
Convergence curve for SSA-FCM.
The performances of the classifiers are based on sensitivity, specificity and accuracy. The efficiency of a classifier model is calculated using the sensitivity factor which recognizes the maximum number of falsified samples. Therefore the model having the highest sensitivity factor is considered as the optimal classifier. The performance of the classifiers on the balanced dataset is given in Table 5.
Performance of the classifiers on the balanced dataset
From Table 5, it can be observed that XGBoost classifier gives high sensitivity factor of 85.66% and 97.47% for random under sampling and SSA-FCM outlier detection method respectively. For FCM based outlier detection method Logistic regression classifier gives higher sensitivity of 93.86%.
However the highest percentage of accuracy for all the outlier detection methods is obtained by XGBoost classifier. Moreover, the method proposed in this work performs preferably better than the results reported by Sunderkumar et al. [9] (sensitivity = 95.52%) and Subudhi et al. [10] (sensitivity = 83.21%). Figure 4 shows the comparison among the considered classifiers’ performance based on the sensitivity measure and Fig. 5 compares the classifiers’ performance based on accuracy.
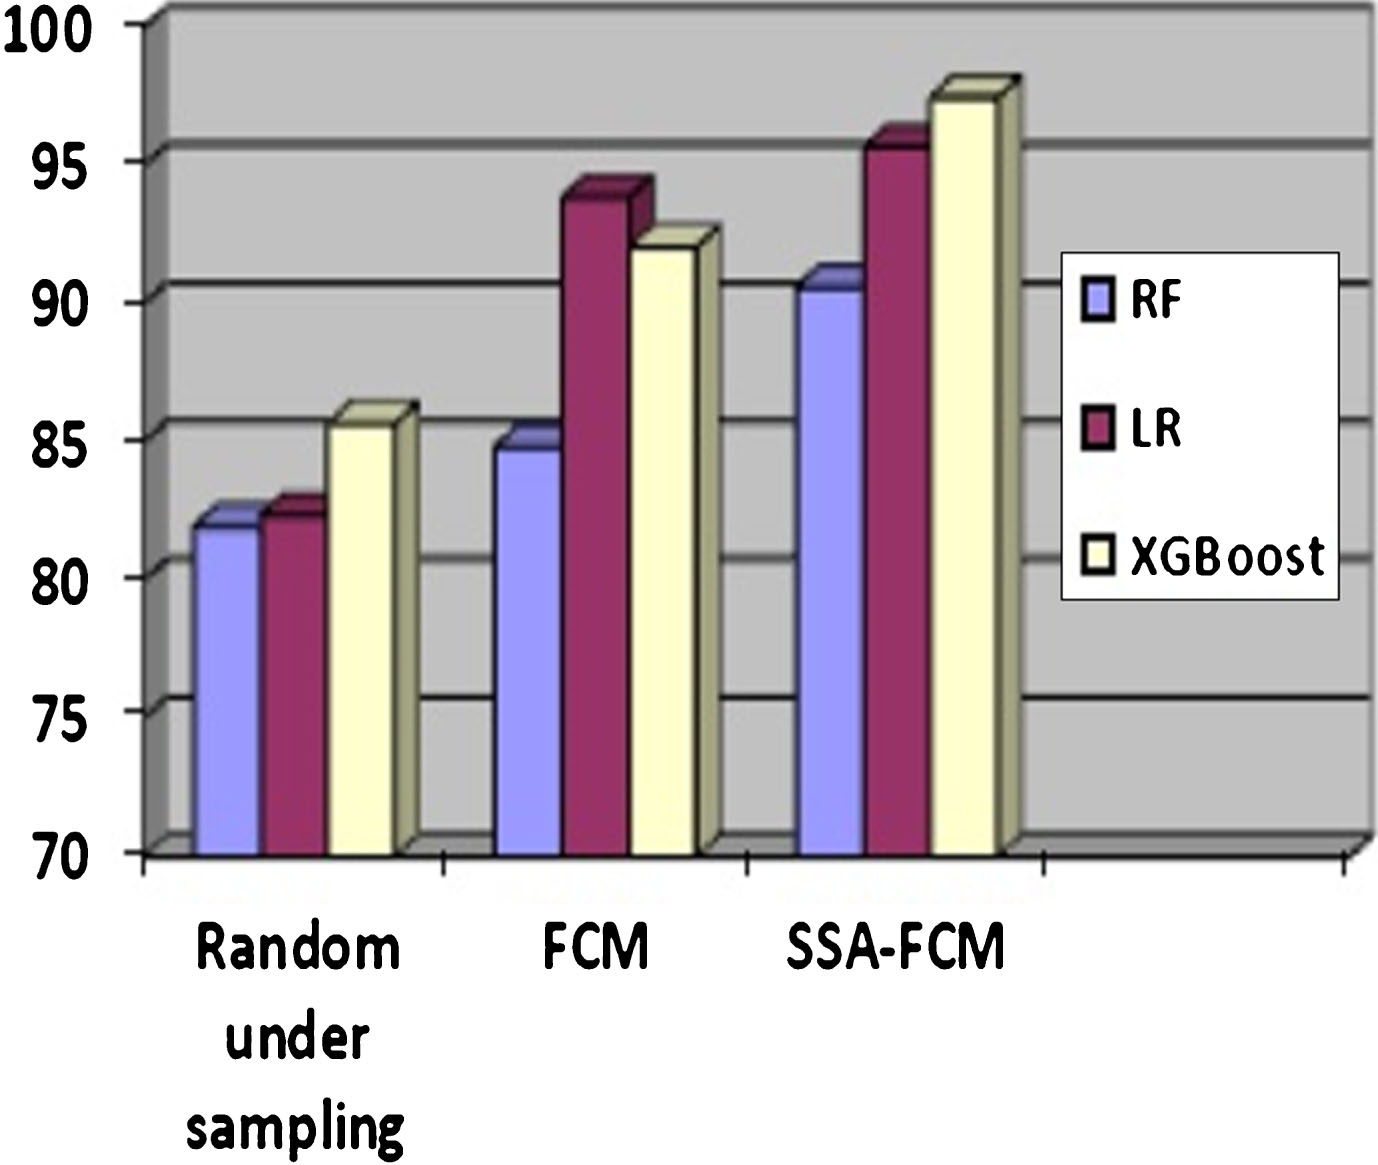
Performance Comparison of the Classifiers based on Sensitivity.
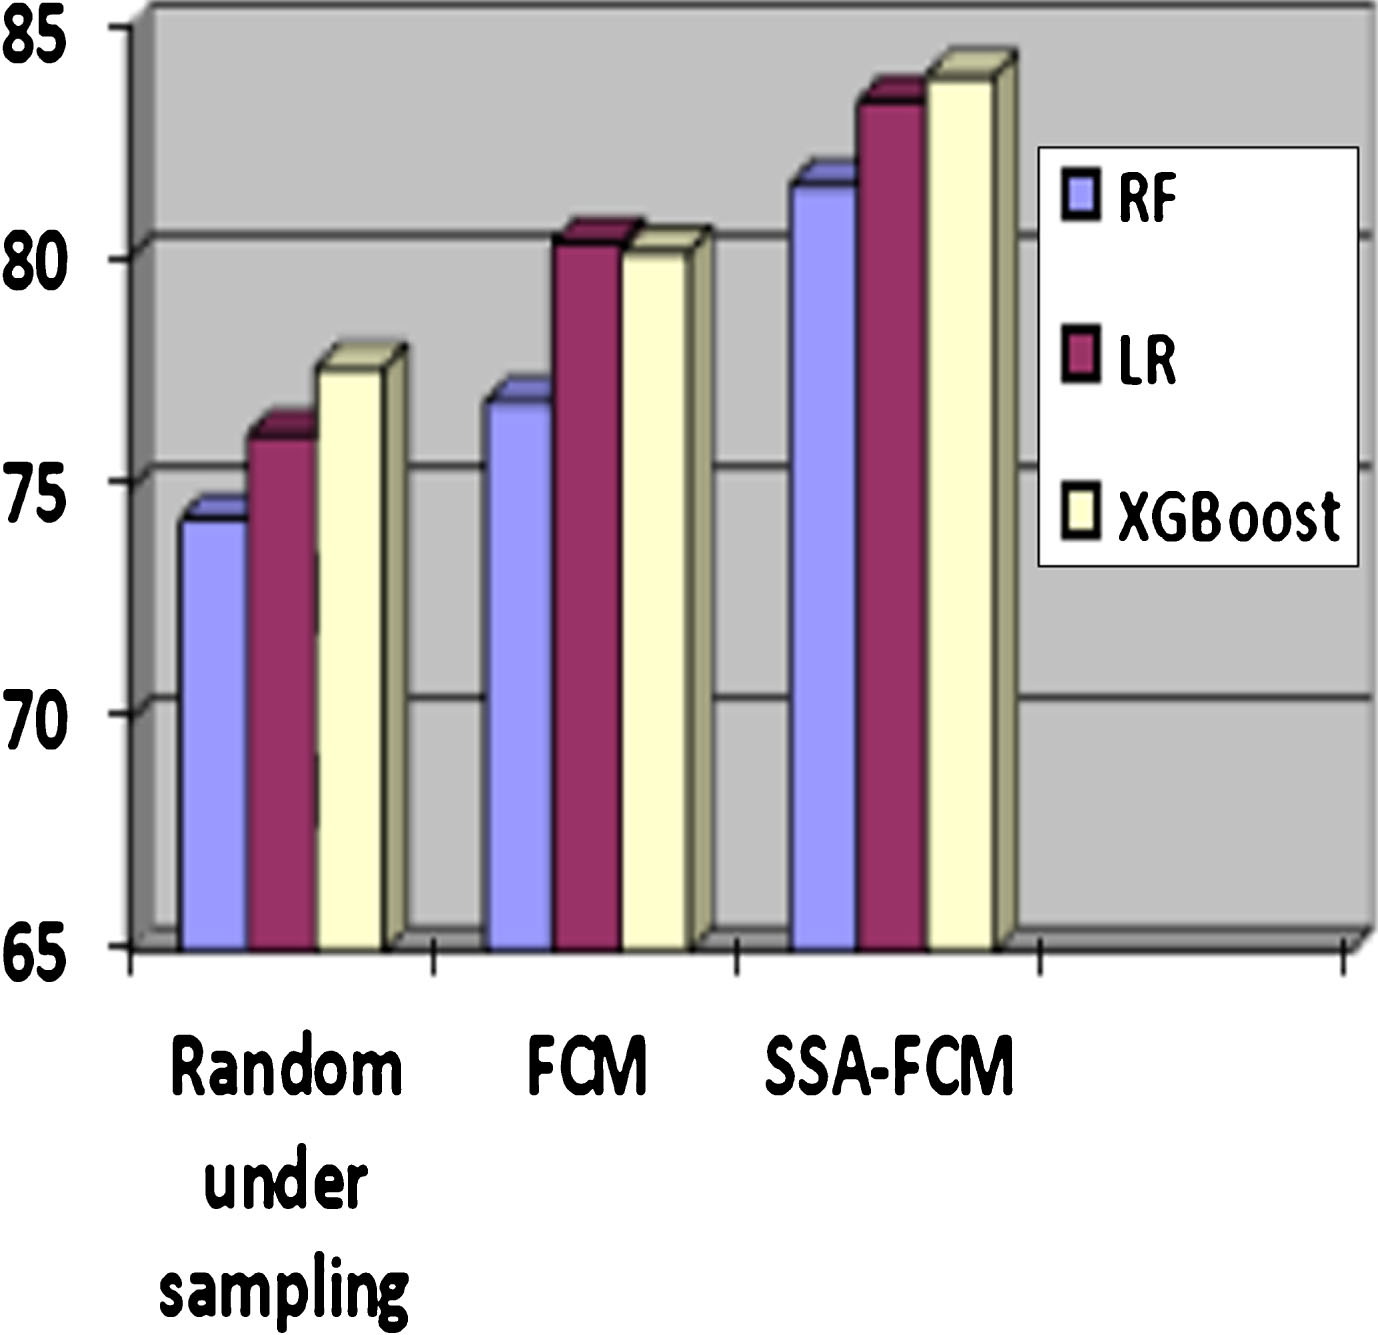
Performance Comparison of the Classifiers based on Accuracy.
In this paper, we have proposed an automobile insurance fraud detection system that uses a new hybrid fuzzy clustering based on Salp Swarm Algorithm (SSA-FCM) for outlier detection and removal. The performance of the proposed fuzzy clustering method has been evaluated by considering seven standard data sets. Moreover, the statistical tests reveal that the proposed clustering method gives good accuracy. The proposed fuzzy clustering is applied for undersampling of majority class samples of the automobile insurance data set for enhancing the effectiveness of the classifiers. The salp swarm algorithm helps in obtaining the optimal cluster centre in the SSA-FCM. The SSA-FCM calculates the distance of the datapoints from the cluster centres based on which the suspicious classes are detected. The suspicious classes are again verified using three different classifiers Random forest, Logistic regression and XGBoost. The proposed model is applied on the “carclaims.txt” automobile insurance dataset. The dataset contains 15,420 records. The SSA-FCM detected 7267 data-points as outliers. After the removal of the outliers the modified class now had 7229 genuine samples and 923 fraudulent samples. The trimmed data is fed to the classifiers for correct classification. It is observed that XGBoost classifier outperforms Random forest and Logistic Regression with a high sensitivity of 97.47% and accuracy of 83.93%. Moreover, the proposed AIFDS gives better result as compared to other recently published methods.