






Abstract
Predicting the peak time load among data center and distributing the load will minimize the usage of the power consumption and also will minimize the carbon emission from data center. Reducing the carbon emission by lessening the energy consumption in a data center will impact on environment which will lead to a reduced carbon footprint. The proposed Water Shower Model (WSM) with Circular Peak Time Services (CPTS) has reduced the execution time to 10 ms comparing with Round Robin Algorithm. The load is shared among the data centers by predicting the type of request by the user as Read Only Request (ROR) or Read Write Request (RWR). The ROR will assign the load to an optimized Container and the RWR will assign the load to a Virtual Machine. CPTS is a proposed model used to measure the carbon emission right from the idle state of the server in a datacenter and till it reaches the peak time of the load and vice versa. The advantage of existing Dynamic Voltage Frequency Scaling (DVFS) techniques is used in the proposed model to optimize the resource allotment and adjust the power and speed in computing devices which allocates only the required minimal amount of power for performing a task.
Introduction
Green Computing is to create an eco- friendly environment” [2, 32–35]. It is the process of utilizing the computing resources effectively and efficiently. Green computing is intended to focus not only efficiently accessing and using the information technology infrastructure, but to reduce the energy consumed by the IT. Its ultimate aim stands to reduce carbon footprint on the environment.
Data center
Data center is the committed space where it operates most of the Information and Communication (ICT) [1, 19] infrastructure. Data center is a place occupied with different hardware components like servers, storage devices and networking which helps to process various application software according to the need of the users. It deals with two major issues in terms of power consumption used for Information and Technology equipment’s and the other for cooling the equipment’s in a data center. As data centers make a non-negligible contribution towards global CO2 emissions [4, 37], the need for efficient operation and a sustainable use of natural resources is growing. The reduction in CO2 emissions goes hand in hand with savings in electricity costs and it is therefore a matter of growing importance for every data center [21, 39]. A proper allocation of load to a data center will reduce the power required for the equipment’s which is not utilized will meritoriously minimize not only the power consumption but will also reduce the impression on atmosphere in terms of carbon footprints. This paper focuses on the balancing the load among the servers in a data center so that no server if over-utilized and under-utilized for effective utilization of data center.
The proposed Water Shower Model (WSM) with Circular Peak Time Services (CPTS) will effectively parallelize the load amongst the different servers in a data center which in turn limit the emission of carbon from a data center which contributes towards creating an environment friendly place. The proposed model will contribute towards minimizing the carbon footprint on the environment.
Load balancing
Load balancing is the process of distributing or sharing the workload among various computer resources [3, 15] (servers, computers etc.,). It is challenging to decrease the average response time by energy consumption and power management. Load balancing is used for achieving a high user fulfillment to avoid traffic. Load balancing helps in achieving optimal resource utilization as only required number of servers are used to carry out the particular task, it does not dump requests on a single server to make it over allocated. By distributing the workload evenly we get better response times, minimizes the waiting time of the requests as well as avoids an excessive amount of overload on the servers. The demand for energy efficiency is the most precarious problem universally [8, 25–30]. The evolution and advancement of intricate huge data application has spread the establishment of massive data centers that have increased the energy demand. The transformations pleasing within the digital world and the ever-growing application services have exponentially fashioned to the energy demands. Energy Efficiency did not rise; not only because of using ideal hardware-based energy efficiency approaches. The reasons were attributed to the unfortunate software strategies and platforms. The energy usage was not only limited to the efficiency of the hardware equipment’s but also depended on the resources management strategies. This initiated the development of energy-efficient algorithms for effectively processing and provisioning resources while accommodating available workload and performance requirements. Carbon footprint is traditionally termed as the total carbon emissions which are in the form of toxic gas released in an electronic device due to heat generated by the devices caused by an individual, event, organization, or product, expressed as carbon dioxide equivalent. The latest release by IBM as that presently data centers consume up to 3% of all global electricity production while producing 200 million metric tons of carbon dioxide. A laptop that is on for 8 hrs a day makes use of between 150 and 300 kWh and emits between 44 and 88 kg of CO2 per year [38].
Virtualization [2] is a technology for segregating one physical server into multiple virtual servers. Each of these virtual servers can run its own operating system and applications, and execute it as an individual server. Minimizing the usage of power consumption by utilizing the maximum resources in the server will reduce the carbon emission. Container [2] is a standard unit of software package used for running application quickly and reliably, which uses less power consumption comparing with a virtual machine. This paper has used both the concepts of virtual machine and container for effectively minimizing the power consumption and reduced carbon emission based on the mode of operation.
Related works
DVFS (Dynamic Voltage Frequency Scaling) is the adjustment of power and speed in computing devices [5, 24]. It optimizes resource allotment for tasks. It maximizes power savings when those resources are not needed. It allows performing needed task with the minimum amount of required power dynamically. The proposed model uses the advantages of existing DVFS to save the power/energy consumption of the data center. The DVFS regulates the power consumption required for the data center according to the load either in the peak time or at regular processing of the data center. In the proposed model DVFS is enabled and disabled according to the need of the data center during the peak time load.
In [5], the authors propose a priority scheduling algorithm were the jobs are allocated based in the weightage given to it and according to the weight the vm’s are allocated. They use DVFS to control the supply voltage and frequency for servers in the cloud. They have come out with a method which can reduce energy consumption by 23%. The experimental results are obtained using cloudsim.
In [6], the authors propose an improved clonal selection algorithm based on time cost and energy consumption model in cloud computing environment. They have proved a significant improvement in the average execution time to increase the energy efficiency of the data center and effectively meet the service level agreements. The experimental results are obtained using cloudsim.
In [7], the authors propose an innovative Pareto solution and composed of a multi-parent crossover operator redesigned a two-stage algorithm and case library using the concept of genetic algorithm. They have presented a more comprehensive and accurate model. The experimental results using MATLAB is shown in terms of convergence, stability and solution diversity.
In [8], the authors propose a set of innovations like eco-metrics, eco-aware scheduling, and monitoring and adaption mechanism to significantly reduce CO2 emission in cloud applications. They have performed a real time experiment based on different case studies. The experimental results on the selection of more efficient hosts for vm’s have significantly reduced the CO2 emission. The solutions are made available as open source resources.
In [9], the authors propose to cache popular IoT resources in brokers to move the traffic loads from the server to the broker, so that the energy consumption is reduced in the server side, but it leads to an unbalanced load to the broker. To the balance the load among the brokers they re-allocate the heavily loaded brokers to lightly loaded brokers. The experimental results are obtained using simulation by their efficient latency aware popular resource re-caching algorithm.
In [10], the authors propose a novel heuristic approach which selects the problem of physical hosts for organizing requested tasks. The bayes theorem is pooled with the clustering process to obtain the optimal clustering set of physical hosts. The experimental results using simulation makes the cloud data centers to achieve a long term load balancing of the whole network.
In [11], the authors propose a method that can balance the loads and improves the effects of CPU utilization and resource allocation is improved effectively. They have designed four experiments to verify the performance method by average response time, load balancing, deadline violation rules and resource utilization. The experimental results for average response time is same as Min-Min algorithm, CPU utilization is slightly better the LC algorithm and finally for deadline violation it showed up a better performance comparing with all three models.
In [12], the author addresses the major issues regarding the electricity consumption and conflicts about the carbon footprint were discussed with the service level agreements of electricity used. The Lyapunov optimization technique is used to analyse the carbon aware and control framework for taking decision on online load balancing and server speed scaling. The simulation results show that they have achieved an optimum arbitrary time-averaged electricity cost.
In [13], the authors have proposed an online Eco-Power algorithm to accomplish eco-aware power management and load planning mutually for geographically distributed cloud data centers. They have achieved a noble balance between power and cost savings, environment protection and user quality of experience with the eco-aware power cost being cut down over by 20%.
Based on the observations of the related work the proposed model is been designed in such a way to achieve both load balancing and reduced carbon emission. The result of the proposed WSM load balancing algorithm is compared with round robin algorithm. Even though round robin algorithm is ancient algorithm most of the top industries uses round robin algorithm [41], so the proposed model is compared with round robin.
Water Shower Model (WSM) algorithm
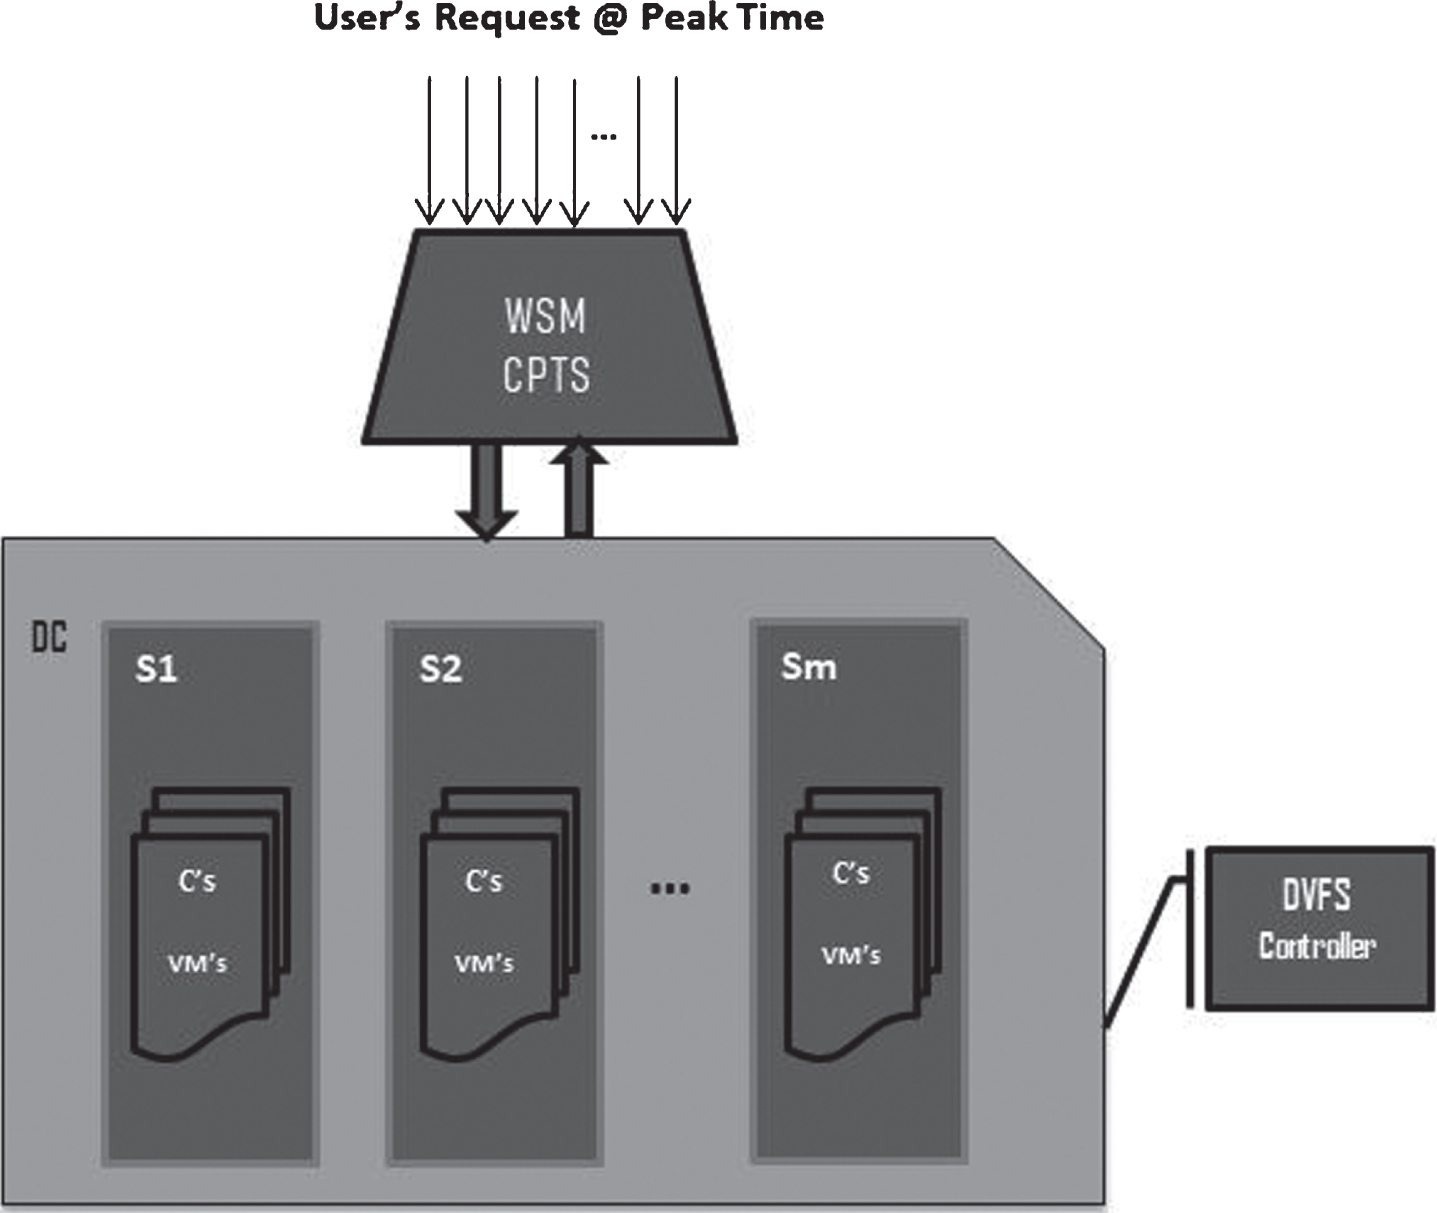
The proposed algorithm WSM (Fig. 2) is designed with a prime goal of distributing loads parallel among the servers in the data center - DC where, Let Server- S = {S1, S2, S3 … Sm} servers in a data center, each server consists of ‘m’ number of Virtual Machines – VM = {VM1, VM2, VM3, … . ,VMn} and ‘s’ number of Containers – C = {C1, C2, C3, … . ,Cs} according to its suitable job for processing the load in a VM/C. The main focus of the WSM is to analyse the peak time load and balance it consequently so that the server is not overloaded in any circumstances.
Case study ROR
Case studies ROR – Read only Request for early predicted of peak time load is considered for examination Result announcement with date and time. According to India the board examination results are announced to the public well in advance with the date and time, so it is easily known and predicted that huge load requested can be obtained in that mentioned date and time. The data center will be in a position to handle that situation with the proposed WSM algorithm in such a way that no server is over loaded and at the same time the balanced load which will reduce the possibilities of more carbon emission and reduce carbon footprint. Since all the user request is only ROR, container can be used. Containers can be used instead of virtual machine because the model of container over a virtual machine is completely different. Container is placed on top of an operating system where it manages to work with many applications on top of it. Since the case study ROR uses only fetching of information from the database and it does not require processing of information or directing the information to some other websites/servers. So in such a case container is more convenient to use and it will not use much of power consumption compared to virtual machine.
Case study RWR
Case study RWR – Read Write request for early prediction of peak time load is considered for online sale on shopping site. Many leading E-commerce websites does marketing for the sale in their site with respect to date and time of attractive deal and offers which can be understood that peak load request is expected and can use the proposed model to satisfy the need of the customer without any delay. Due to huge traffic request to a specific E-commerce site will produce heat which will directly leads to more carbon emission and produce carbon footprint. The user request is both ROR as well RWR; virtual machine can be used for processing. In this case study RWR virtual machine is given high importance because the e-commerce website will re-direct to multiple websites/server which does multiple processing of information, so it’s better to use virtual machine instead of container.
System architecture
The proposed mathematical model for Water shower Model (WSM) (1) for the Server Utilization of each Server- Si is defined based on the threshold limit set equally for all server as Maximum Utilization-(MaxUtil) in MHz and the existing work load along with the primary services of each server is named as Local Job–(lj) in MHz and the current work load or the user request or a job during peak time is named as Work Load – (wl) in MHz units of frequency.
Carbon emission is calculated only for the IT equipment utilized in a data center based on the power usage effectiveness (PUE) and carbon usage effectiveness (CUE) is defined as [21, 22], Where, the total output of the data center is equivalent to IT infrastructure and IT Equipment. The IT Equipment’s are considered as number of Servers, switches and storage systems. Carbon Emission Factor (CEF) is calculated with the total CO2 emission caused by the total data center energy [23]. The units of CUE metric are kilograms of carbon dioxide (kgCO2eq) per kilowatt-hour (kWh).
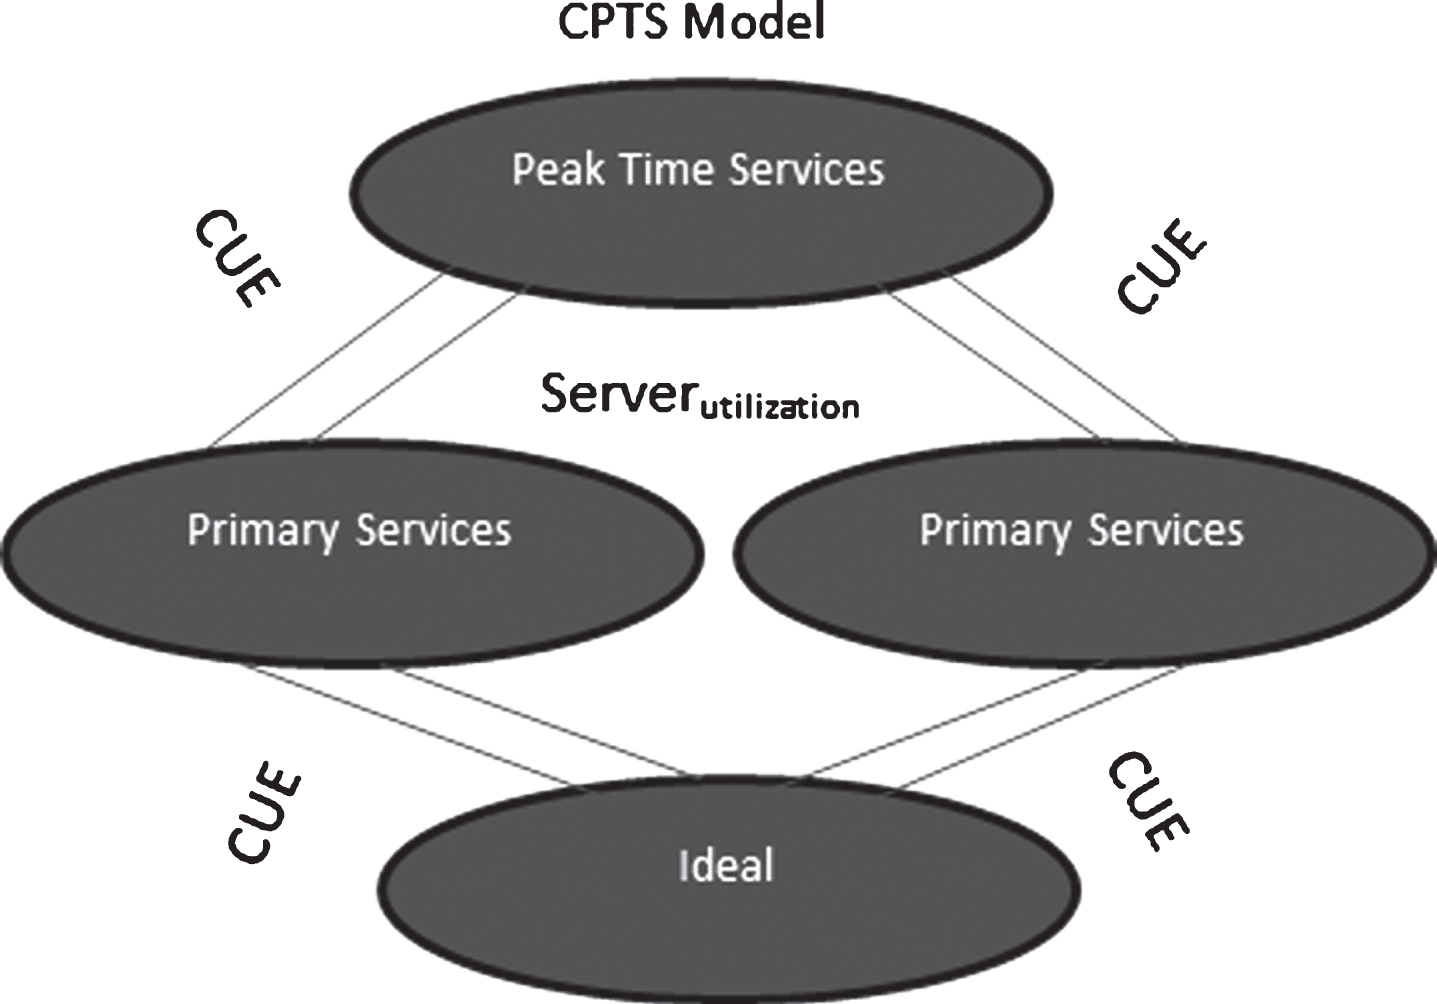
The proposed CPTS (Fig. 1) model will identify the carbon emission level in various stages of the services starting from the idle state to the primary services and primary services to the peak time services and vice versa until it reaches the idle state of the server. This cyclic format is proposed as CPTS (Circular peak time services) model. Where I symbolize the idle state of the server, Ps symbolizes Primary Services and PtS symbolizes the Peak Time Services.
Circular peak time services model (CPTS).
System Architecture: Water Shower Model (WSM) with Circular Peak Time Services (CPTS) Approach using Dynamic Voltage Frequency Scaling (DVFS).
Let for every Carbon e ={Carbon min , Carbon max } denotes the minimum and maximum ratio of the CO2 emission. This CPTS will monitor the average ratio of all servers, if it meets the Carbon max level. The load is switched over to the remaining servers which are under loaded to process the further request.
The carbon emission for each Server’s in the idle state is set to the minimum level of carbon emission, Carbon min . When the load gets increased then the carbon emission level also gradually increases, until it meets the Carbon max .
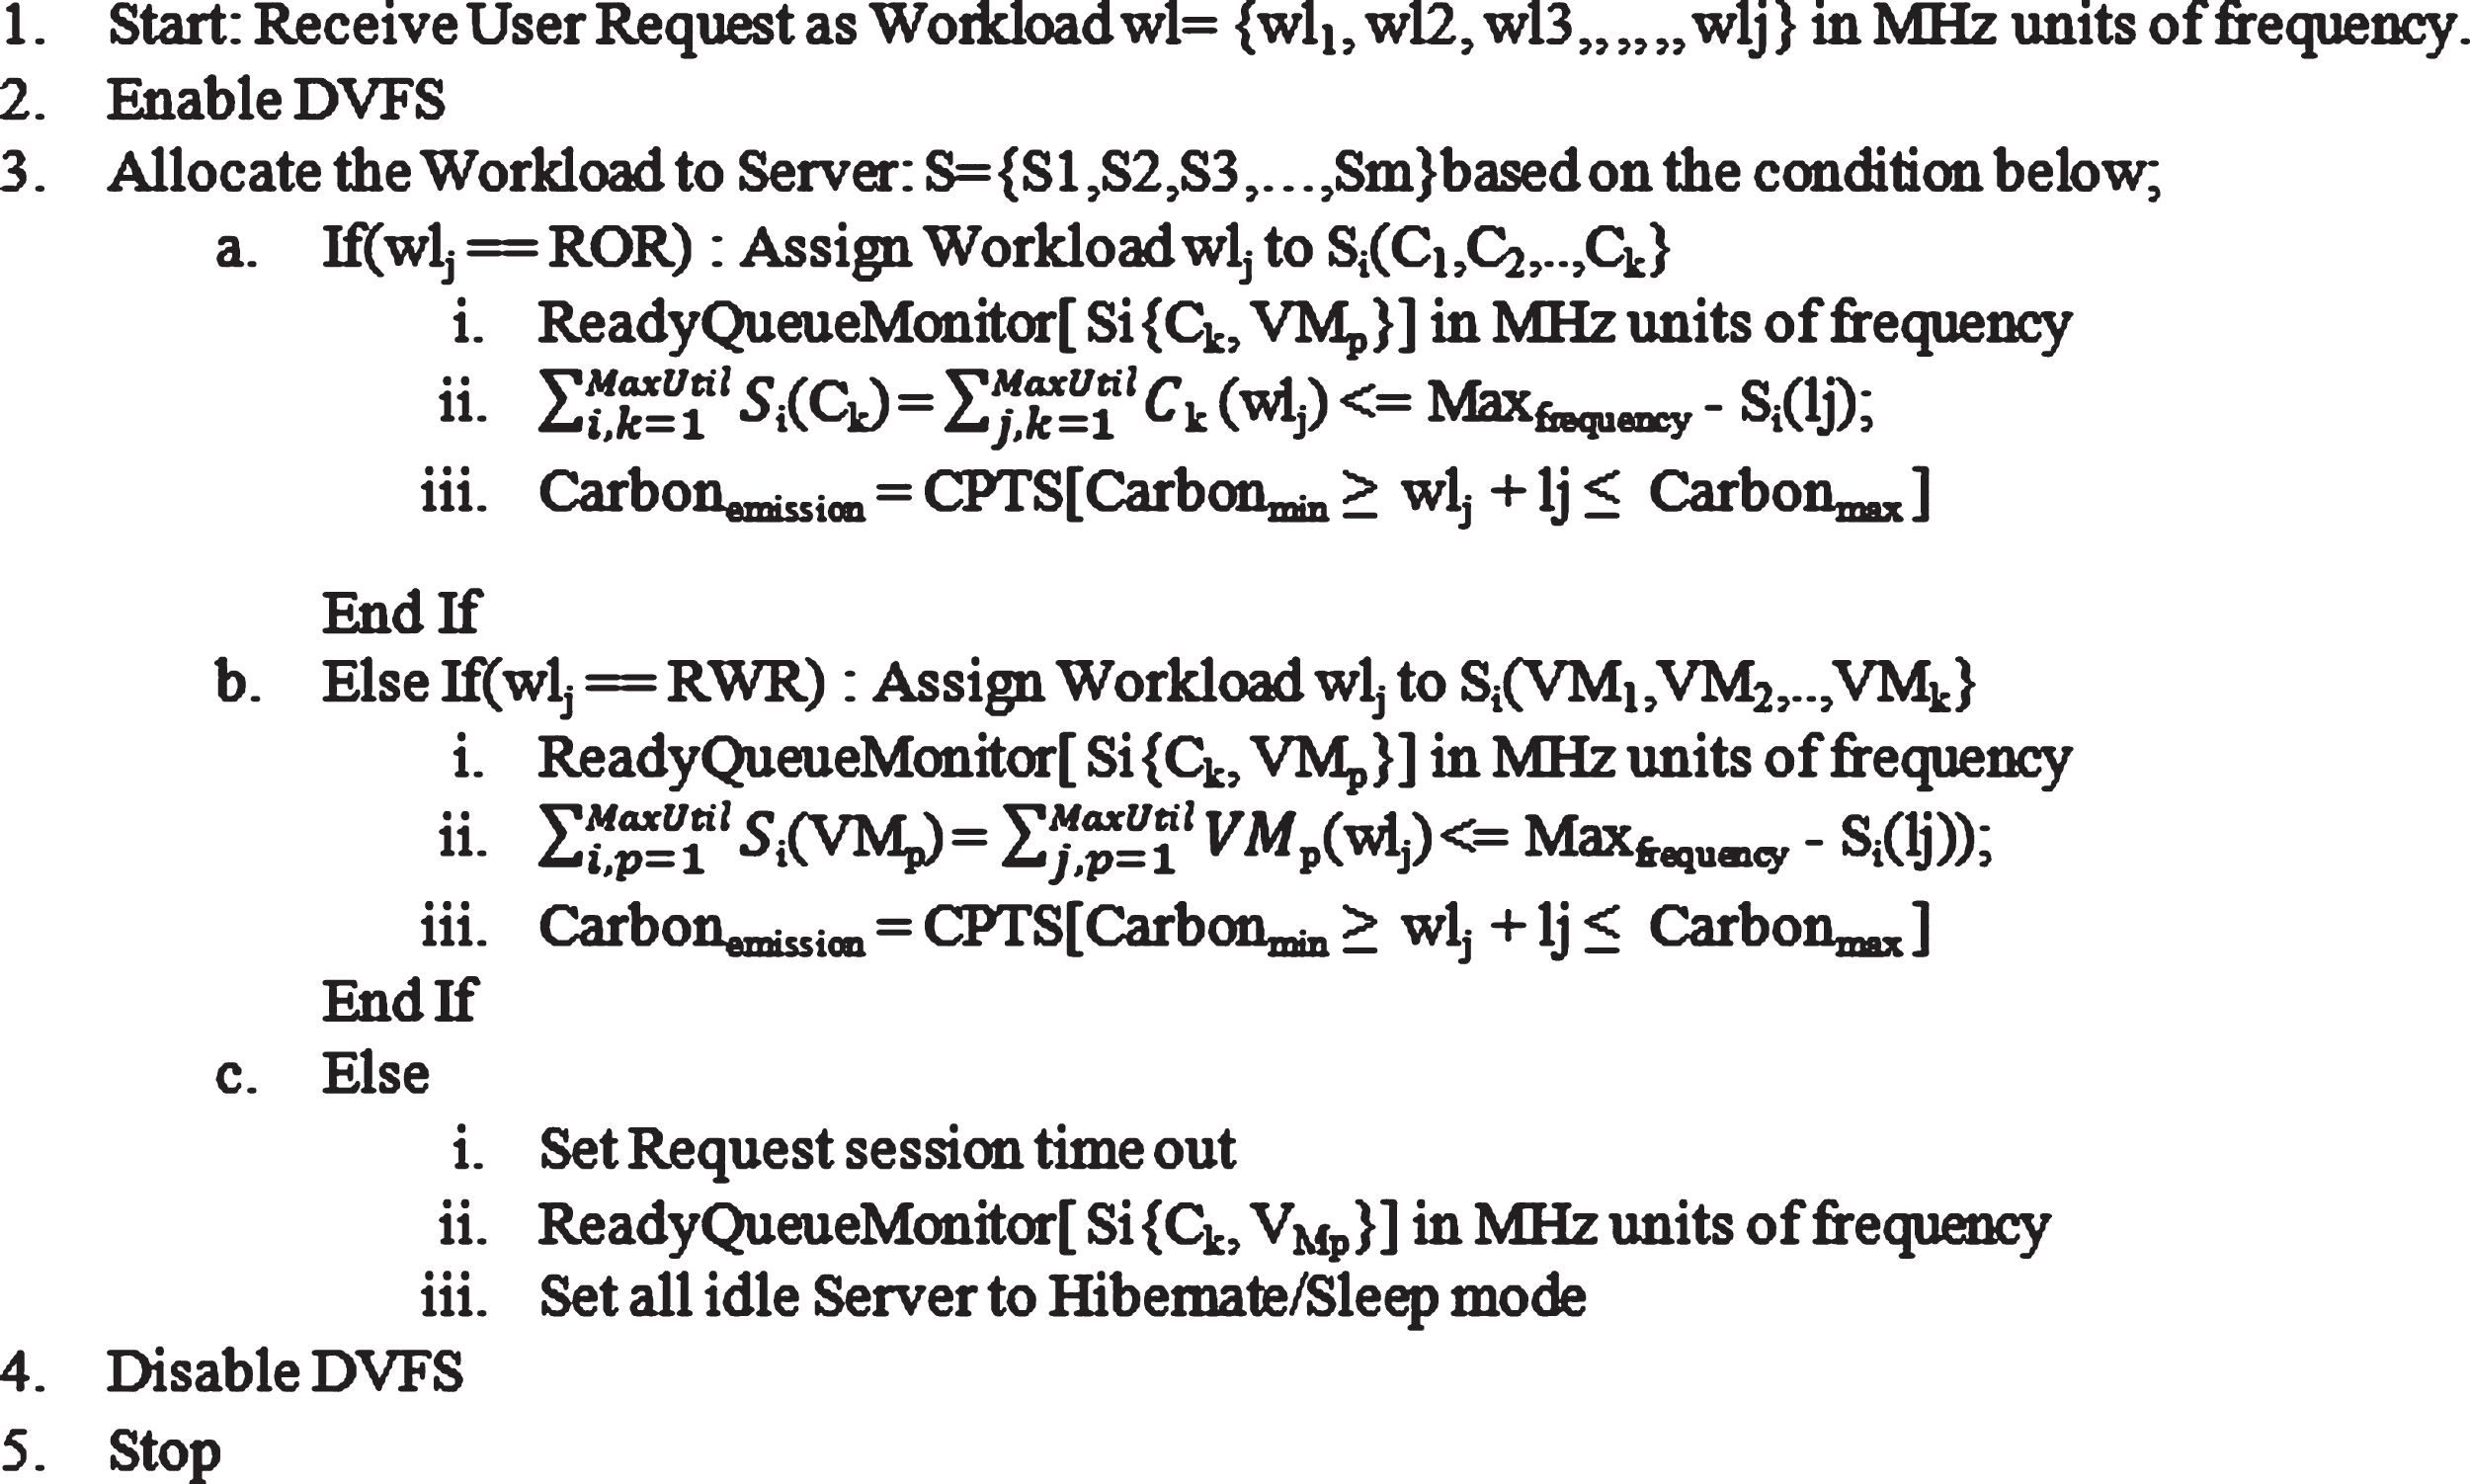
The below pseudo code in Fig. 3 Water Shower Model (WSM) with Circular Peak Time Services (CPTS) Approach using Dynamic Voltage Frequency Scaling (DVFS) shows how the user request will be processed and the carbon emission is been calculated for reduced carbon footprint for the data center. WSM-CPTS uses the DVFS (Dynamic voltage scaling technique) to reduce the power consumption of the IT equipment. The DVFS enables processors to run at different combinations of frequencies with voltage to reduce the power consumption of the processor. So WSM-CPTS uses the advantages of DVFS so that the power consumption of the data center can be minimized and a required amount of power can be utilized effectively and efficiently. Let assume the maximum and minimum working frequency of a server Max frequency is 900 MHz and Min frequency is 100 MHz respectively. The maximum and minimum frequency set for a container and virtual machine is 10 MHz – 50 MHz and 30 MHz – 100 MHz.
Pseudo Code – Water Shower Model (WSM) with Circular Peak Time Services (CPTS) Approach using Dynamic Voltage Frequency Scaling (DVFS).
ReadyQueueMonitor checks for the available server’s container and virtual machine periodically in every millisecond to allocate resources according the need of the request to be processed. The maximum utilization of each server is fixed to MaxUtil700 MHz so that the server should not exceed the frequency level as mentioned in the algorithm even in peak time to achieve (5) less CO2 according to WSM.
The ROR and RWR represent the read only and read write request from the user. As stated in the above case study case – a ROR can be managed with Container because it does read only operation for processing the user request. Whereas in case – b RWR can be managed using Virtual Machine because it requires both read write operation. Case – c will be processed when the request from the user could not be processed or when the data center load is minimal. By using both containerization and virtual machine, based on the job request the emission of CO2 can be reduced immensely. Due to this efficient processing of the workload distribution carbon footprint will be enormously reduced. The WSM efficiently allocates workload to the server that none of the server is over utilized.
The implementation of proposed Water Shower Model (WSM) is compared with the existing Round Robin Algorithm for observation and analysis. Both the algorithms are tested with 100 tasks for each with the model of 3 servers is implemented. The observations are 1) Distribution of task to all servers Fig. 4, 2) Average execution time of both the algorithms Fig. 5 and 3) Carbon Emission of both algorithms Fig. 6. In WSM algorithm the tasks were evenly distributed amongst Table 1 the server i.e. 33, 33 & 34 tasks per server. But on the other side in round robin the tasks were unevenly distributed amongst the server i.e. 70, 30 & 0. The average time taken by WSM algorithm to complete the execution of 100 tasks was 1000 m/s. but on the other side to execute the same number of tasks for round robin algorithm took 1010 m/s. According to carbon emission every second spent in web browsing generates 20 milligrams [40] of CO2; the analysis is done as well for carbon emission. The WSM emits 20milligrams of CO2 eq. and Round Robin emits 20milligrams of CO2 eq. Based on this observation the comparative study between round robin and WSM algorithm, it is proved that WSM algorithm is efficient.
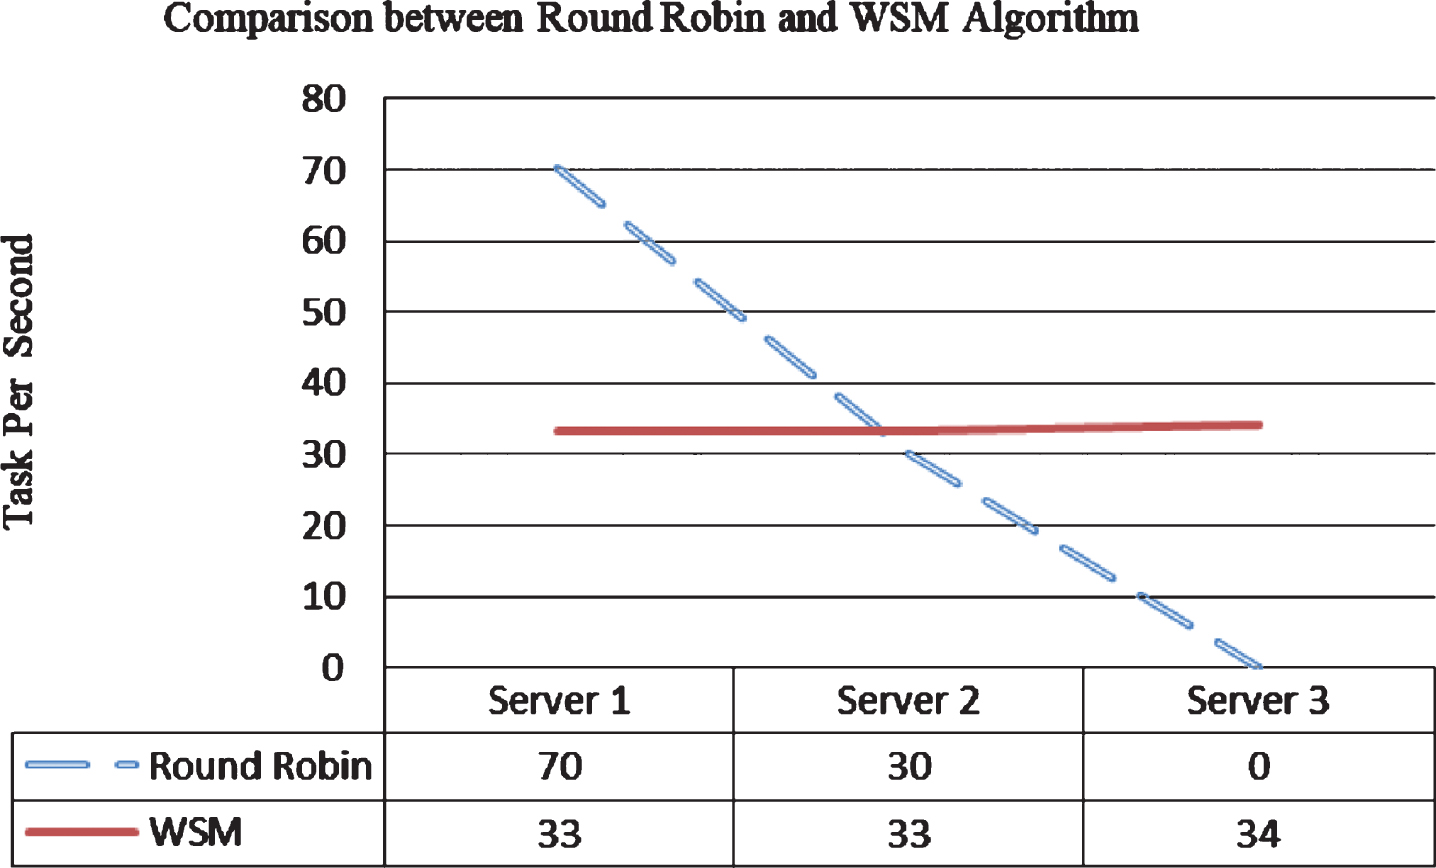
Distribution of tasks between round robin and WSM algorithm.
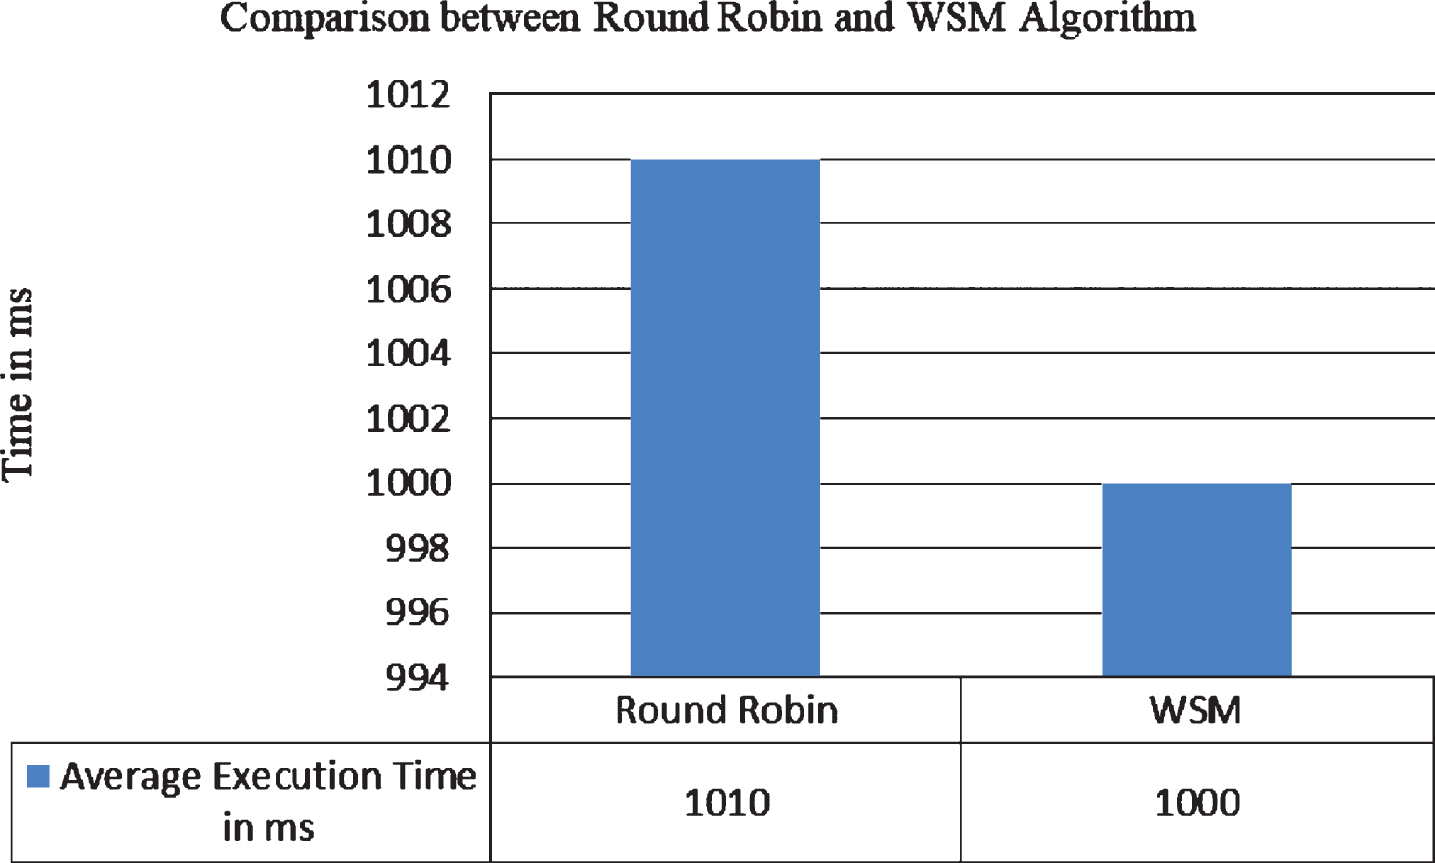
Average Execution Time between Round Robin and WSM algorithm.
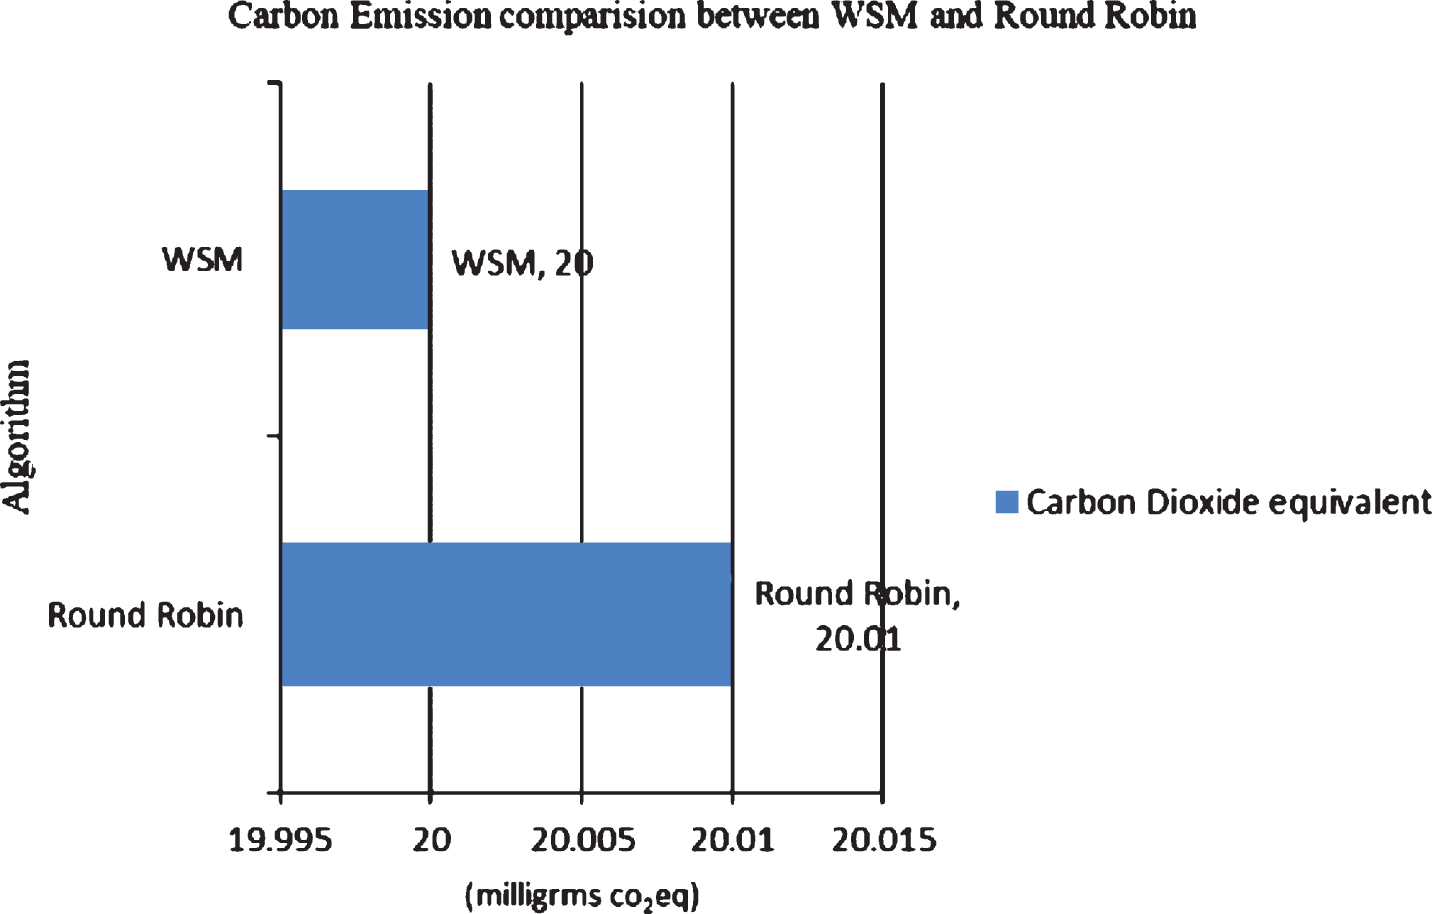
Carbon Emission Equivalent between Round Robin and WSM algorithm.
Server configuration for implementation
The WSM algorithm model with number of tasks is tested for efficiency with Round Robin algorithm. CPTS for carbon emission are yet to be tested using the simulation tool. Comparison between efficiency of Virtual Machine and Container are to be carried out in real time.
Results of various parameters are tested to obtain the efficiency of the WSM and Round Robin algorithm is show below in Figs. 4–6.
The proposed Water Shower Model (WSM) algorithm is tested programmatically over round robin without the container and virtual machine technique with 100 tasks as user request. The same is been proved that WSM is efficient comparing with round robin algorithm. The efficiency is proved based on distribution of task, average execution time and carbon emission with all the above three metrics it has showed improved results. To conclude when a particular server is over loaded, due to more heat the amount of carbon emission emitted will be huge by the observation of round robin algorithm. Whereas WSM algorithm parallelizes the load to all active servers so that carbon emission is limited. Hence carbon footprint is also gradually decreased in the environment.
Future work
The proposed model is tested for algorithm efficiency alone. So the real time comparison between container and virtual machine is to be carried out. The CPTS model is yet to be implemented using DVFS technique. The entire model is to be implemented using simulation. The working is under process and will be communicated.