
Abstract
This paper presents a multi-objective method to optimally place the Distribution Static Synchronous Compensator (D-STATCOM) in a distribution system using the multi-objective genetic algorithm (MOGA). In the proposed method, the average current total harmonic distortion (THD), installation and operation cost functions are considered as the objective functions, where input harmonic limitations for individual buses are chosen as the optimization constraints. The application of this optimization is based on a novel forward-backward harmonic load flow method by comparing input current THD, device generated harmonics and impacts of output THD on the network. The performance of this algorithm is evaluated using the Matlab software on the radial IEEE 33-bus test system. The simulation results verify the capability of the MOGA in accurately determining the optimal location of the D-STATCOM in radial distribution systems.
Introduction
By the advent of the nonlinear switches and with the advances in power electronic devices, new controllers known as Flexible AC Transmission System (FACTS) have been developed [1]. The applications of these controllers have been greatly pronounced in various areas like power flow control, reactive power compensation and stability margins improvement in AC networks [1–4]. Power electronic based controllers which have been employed in distribution systems are recognized as the custom power devices [5]. The most well-known custom power devices are Distribution Static Synchronous Compensator (D-STATCOM), Dynamic Voltage Restorer (DVR) and Unified Power Quality Conditioner (UPQC). Their applications have been proven to be quite helpful in solving power quality problems [6–9]. However, due to the high cost of these devices and the importance of the power quality issues like harmonics, flickers and interruptions for consumers, utilities and electrical equipment manufacturers, these de-vices should be optimally placed in a distribution network with cost benefit considerations [8].
For compensating the power quality problems, a great deal of researches have been carried out by the researchers. Placement of static VAR compensators (SVC), static compensator (STATCOM) and DVR for mitigating voltage sag adverse impacts on the radial distribution network have been noticed in [10]. In [11], differential evolution (DE) algorithm has been applied to determine optimal location of UPQC considering its sizing in the radial distribution systems based on an objective function defined for improving the voltage and current profiles. A unified power quality conditioner system which is called (MC-UPQC), has been introduced in [12]. This system has the capability of simultaneous compensation of voltage and current in the multibus systems. The structure of this device consists of one shunt voltage-source converter (shunt VSC) and two or more series VSCs and its operation is based on proportional-integrator (PI), artificial neural network (ANN) and fuzzy controllers. The authors of [13] have enhanced the power quality and reliability indices for mitigating the voltage sag by LCL filter and D-STATCOM. In [14], D-TSTACOM control system has been designed for flicker mitigation. However, an arbitrarily selected bus has been considered for FACTS controllers placement and no specific criterion has been proposed to allocate the optimal location of such controllers. Nichiang Genetic Algorithm (NGA) has been employed in [15] to diminish the financial losses of voltage sag occurrence. This optimal placement has been suggested in [16] using genetic algorithm (GA) based optimization to mitigate voltage sags in a meshed distribution system. An ANN based approach has been suggested in [17] for optimal placement of D-STATCOM to mitigate voltage sag in a meshed interconnected power system. In [18], the optimal placement of D-STATCOM, DVR and UPQC has been considered in an interconnected power system, and their performances in voltage sag mitigation has been studied and a comparison between these devices for selecting the proper one has been implemented. In [19], a new multi-objective function has been proposed and genetic optimization method has been employed for solving this problem. The multi-objective function includes system load-ability and total costs of distributed generation investment; and distributed static compensators and network loss. In [8], the main objective is to reduce the total loss of the radial distribution system with voltage profile improvement. Particle Swarm Optimization (PSO) technique has been employed in this work for the placement and sizing of DSTATCOM in radial distribution systems. In [9], a multi objective algorithm has been applied to account for two objective functions including voltage profile improvement and active power loss reduction by considering uncertainty in active and reactive power loads. However, in the previous studies, the harmonic impacts of D-STATCOM as a major factor in its application has not been noticed.
In this paper, simultaneous economic and technical studies are conducted to minimize both the operational costs of the D-STATCOM and total harmonic distortion (THD) of the input current. Achieving this goal, a multi-objective problem is defined to consider the desired constraints. For accelerating the above process, by mixing the conventional harmonic load flow and fast typical load flow based on the NBN and NBB matrixes [20], a novel load flow method is proposed to guarantee the accurate response of the system. Furthermore, due to the computational burden and nature of this problem, the calculation can be regarded as the non-deterministic polynomial-time hard (NP-hard) problem. Therefore, instead of using deterministic approach for solving this problem, the multi-objective genetic algorithm is employed to obtain the best results. The IEEE 33-bus test system is employed for evaluating the proper process of the developed optimization method.
Multi-objective problem formulation
The optimal D-STATCOM placement and sizing has performed to improve power quality indexes like harmonic mitigation. This process is performed by minimizing the total installation cost and current harmonic of the system, simultaneously. Therefore, a multi-objective optimization problem is formed where its objective function includes minimization of total harmonic distortion (THD) and installation costs.
Objective function
In this optimization problem there are two functions which should be minimized. These functions are listed as follows.
In which:
MOGA
A multi-objective decision problem is defined as follows: Consider an N-dimensional decision variable vector q = {q1, …, q
N
} in the solution space Q, the problem is to find a vector q* that minimizes a set of K objective functions r (q *) = {r1 (q *), …, r
k
(q *)}. A series of constraints such as W
j
(q *) = b
j
for j = 1, …, m which limit the decision variables are confined the solution space (Q). The perfect multi-objective solution which simultaneously optimizes each objective function is almost impossible [21]. Therefore, the main goal of the multi-objective optimization problems is to obtain a set of Pareto optimal solution. Since Pareto optimal set is assemble of the solutions, genetic algorithm which is one of multi-point search methods is suitable to derive the Pareto optimal set [15]. Most of the other multi-objective algorithms are dependent on the user to set their parameters simultaneously. On the other hand, the multi-objective GA does not force the user to prioritize, scale or weigh objectives. Therefore, GA has been nominated as the most popular heuristic approach to the multi-objective design and optimization problems [22]. Multi-objective optimization problem is formulated as follows:
Subjected to the following constraints:
Two sets of recursive equations can be employed to solve the load flow problem of the radial distribution network for any specific harmonic iteratively. The first set, which is called backward sweep, should calculate the branches current by going up the line. The second one, forward sweep, determines the nodes voltage by going down the line. Consider a network with i branches. Beginning and ending buses of the i-th branch are called SE (i) and RE (i), respectively (power is entered to the branch through the begining bus). Assume that
In the above equations, m is the overall number of buses located beyond the i-th branch. Using these equations, the i-th branch active and reactive power losses at h-th harmonic are calculated. Therefore, active and reactive powers at the beginning of the i-th branch and for h-th harmonic can be calculated by the following equations:
The current flowing through the i-th branch and for h-th harmonic is given by the following equation:
Therefore, the voltage of the bus at the end of the i-th branch is written as follows:
In this method, rms value of the voltage and phase-angle of the reference bus (zero number bus) are considered respectively 1.0 p.u. and zero. Also, at first iteration the rms value of the voltage and phase-angle of the all buses are assumed to be 1.0 p.u. and zero, respectively. In the flowchart shown in Fig. 1, identification of any nodes beyond each branch of the network are realized by a matrix called NBB and NBN.
To identify the nodes beyond each branch (NBB), the following algorithm is used for numbering the nodes and branches [23]. The first bus (source node) is numbered as bus number 0. Buses should be numbered on the main feeder to the end, respectively. Thereafter, the lateral branches following from the nearest lateral branch relative to the source node (if two branches have the same position relative to the reference bus, starting from each one is arbitrary) and then buses following the last bus in the main feeder are respectively numbered. Then, similarly, the buses are numbered at other lateral branches following the last bus at the last lateral branch. Numbering of branches is also similar to the numbering of buses.
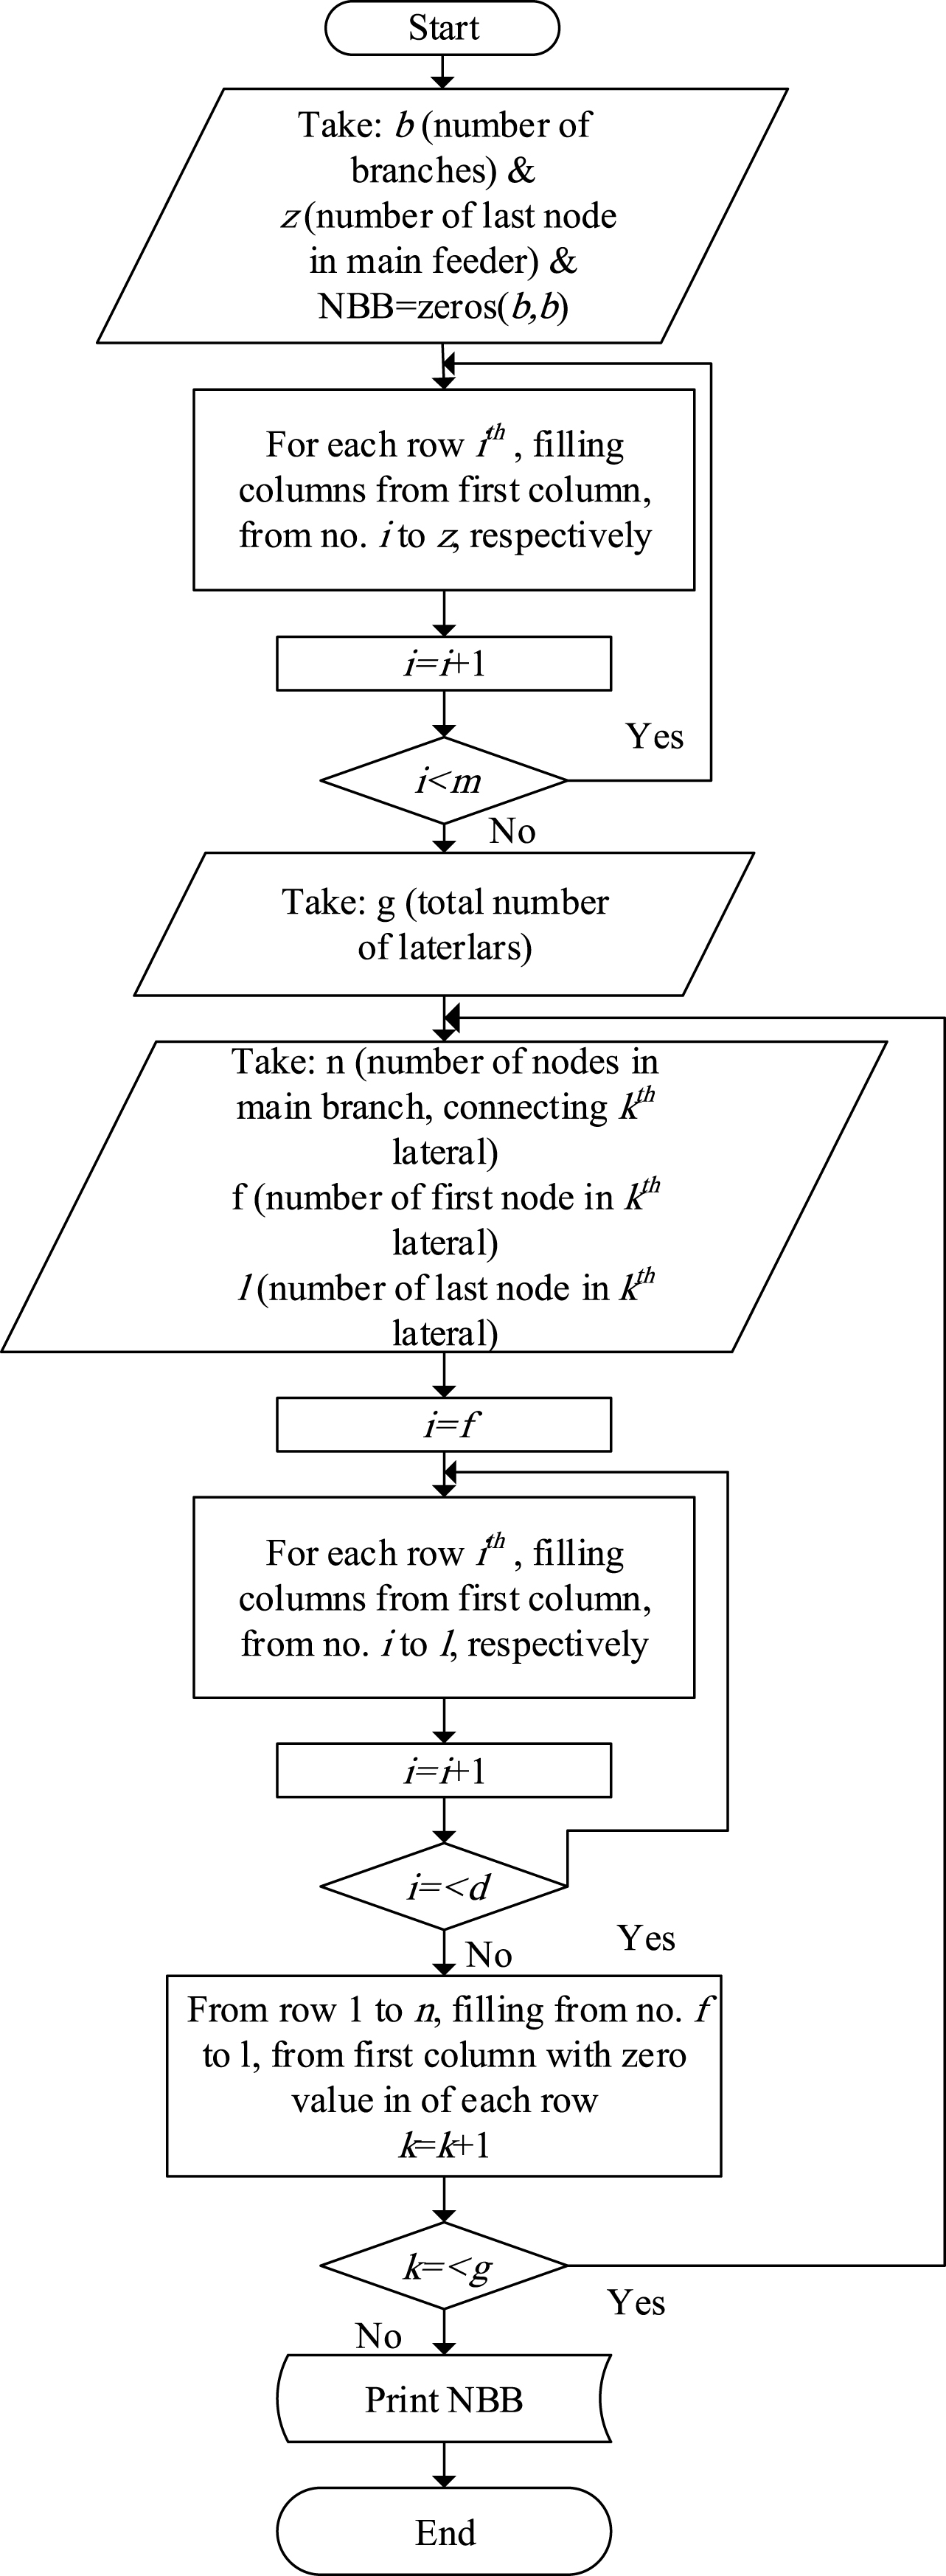
Process of NBB matrix information.
This algorithm receives the total number of branches, number of the last node in the main feeder, number of lateral branches and number of start and end nodes of each lateral branch. The output of this algorithm is a matrix named NBB. The rows of this matrix correspond to the branch network. For the ith branch, nonzero values of NBB (i, j) are the number of buses beyond the ith branches.
Also, the NBN matrix is obtained with a similar approach to NBB matrix determination procedure.
According to the Equations (1 to 10) and the procedure presented in the flowchart of Fig. 1, the harmonic power flow process can be presented as a flowchart presented in Fig. 2.
The flowchart of harmonic load flow method is shown in Fig. 2.
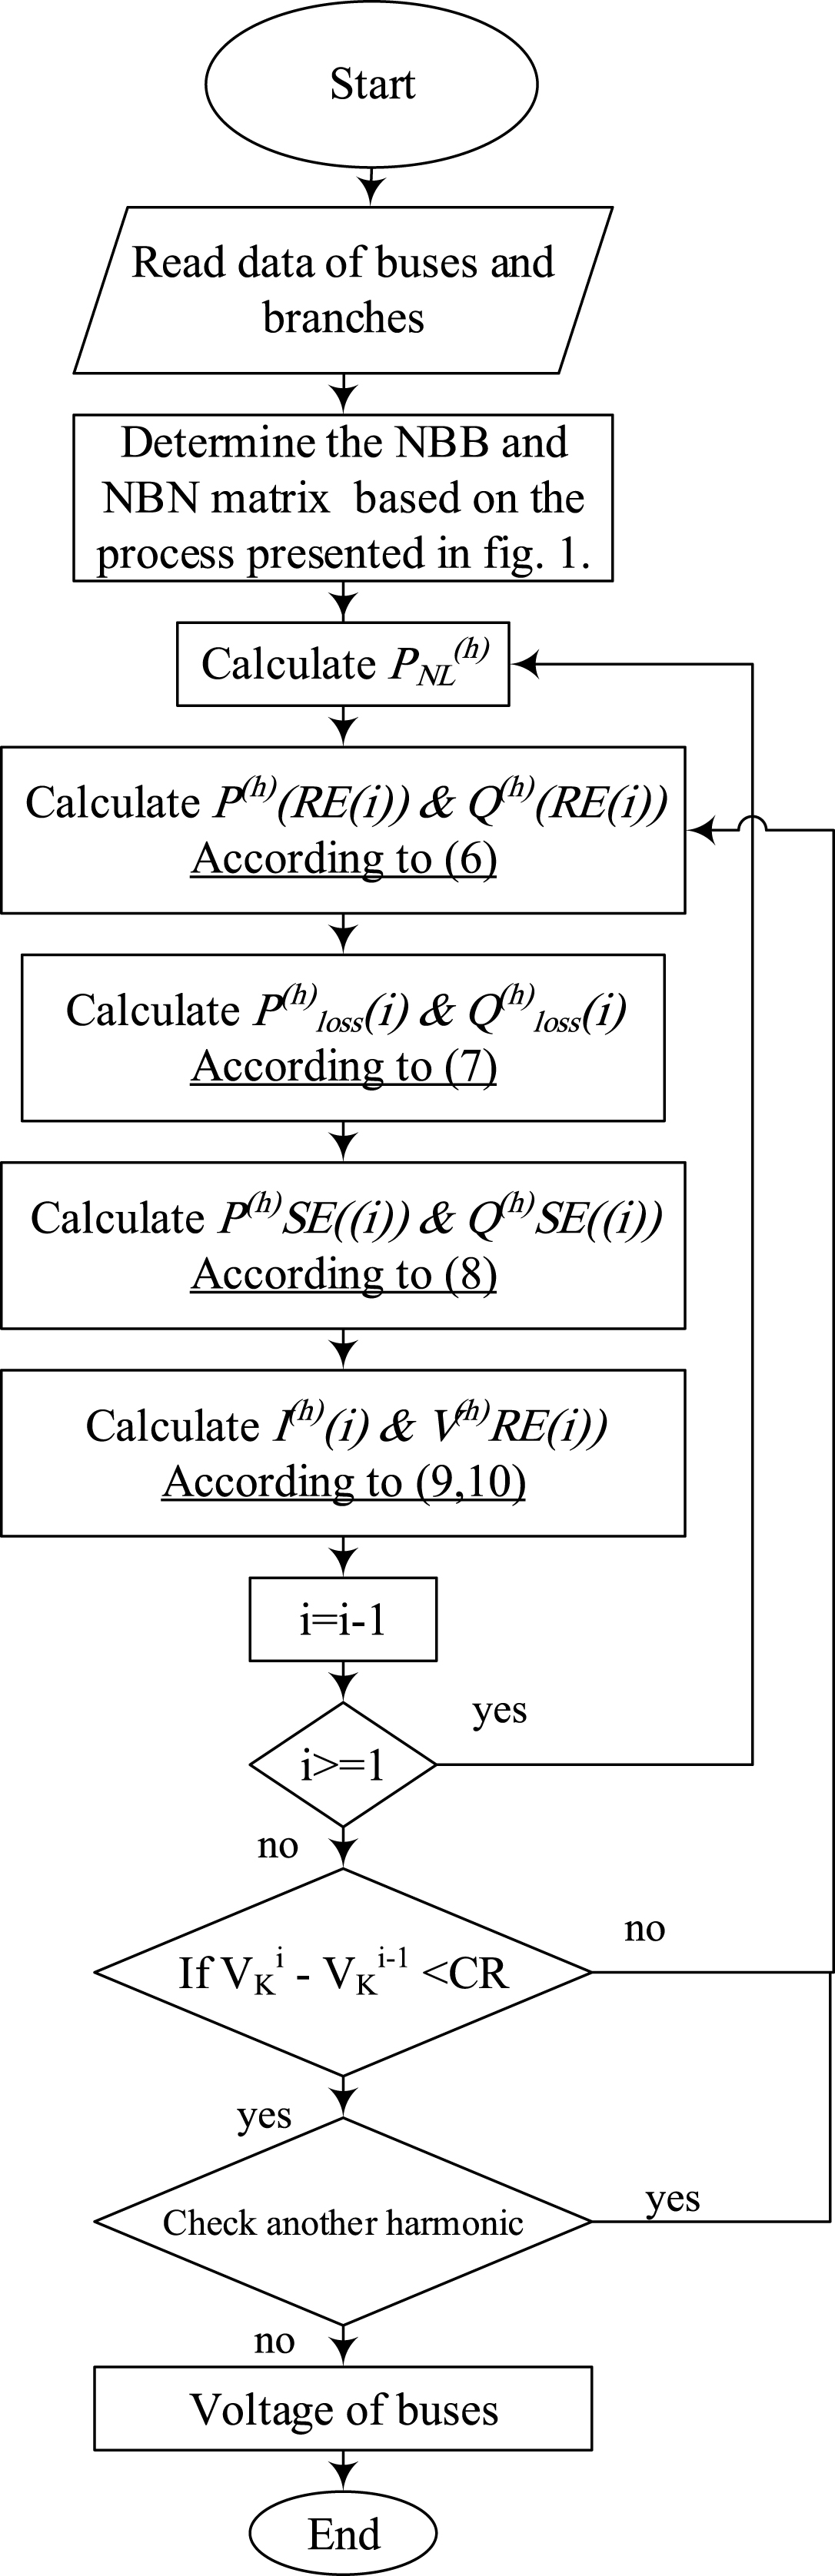
Developed harmonic load flow algorithm for placement and sizing of D-STATCOM in the distributed network.
For solving the optimal location problem of the D-STATCOM in radial distribution systems, Number of D-STATCOMs located in the system initiates from one to maximum number of this device which set as initial value at the first part of the algorithm. Then, MOGA is applied to the objective functions shown in Equations (1 to 3), based on the outline is summarized as follows [23]:
iteration = 0
Randomly generate the first population P0 of size N
Repair the first population to make it feasibleFitness evaluation of P0
Apply the sorting process for each solution based on the fitness evaluation
it = it + 1
Crossover: generate the set R i of offspring of size N
Apply the sorting process for each solution in R i
Fitness evaluation for Pi
Update the non-dominated list Qi
Evaluate and select best N solution from Pi
Then this device is located on the buses of the network one after another and the proposed algorithm tries to determine the total generating THD (THDgen) and total output of the current (Ioutput) in each iteration using a new developed forward/backward harmonic power flow method which will be described in last section 3-3. Then, after obtaining the THDgen and Ioutput from the algorithm, using the calculation result of Equations (11 and 12), the buses that record the lowest total system THD are selected as nominates for the installation locations of the devices. This procedure continues to locate this device on all buses of the system. Therefore, the most appropriate bus with optimum cost function should be selected. The flowchart of this procedure is shown in Fig. 3.
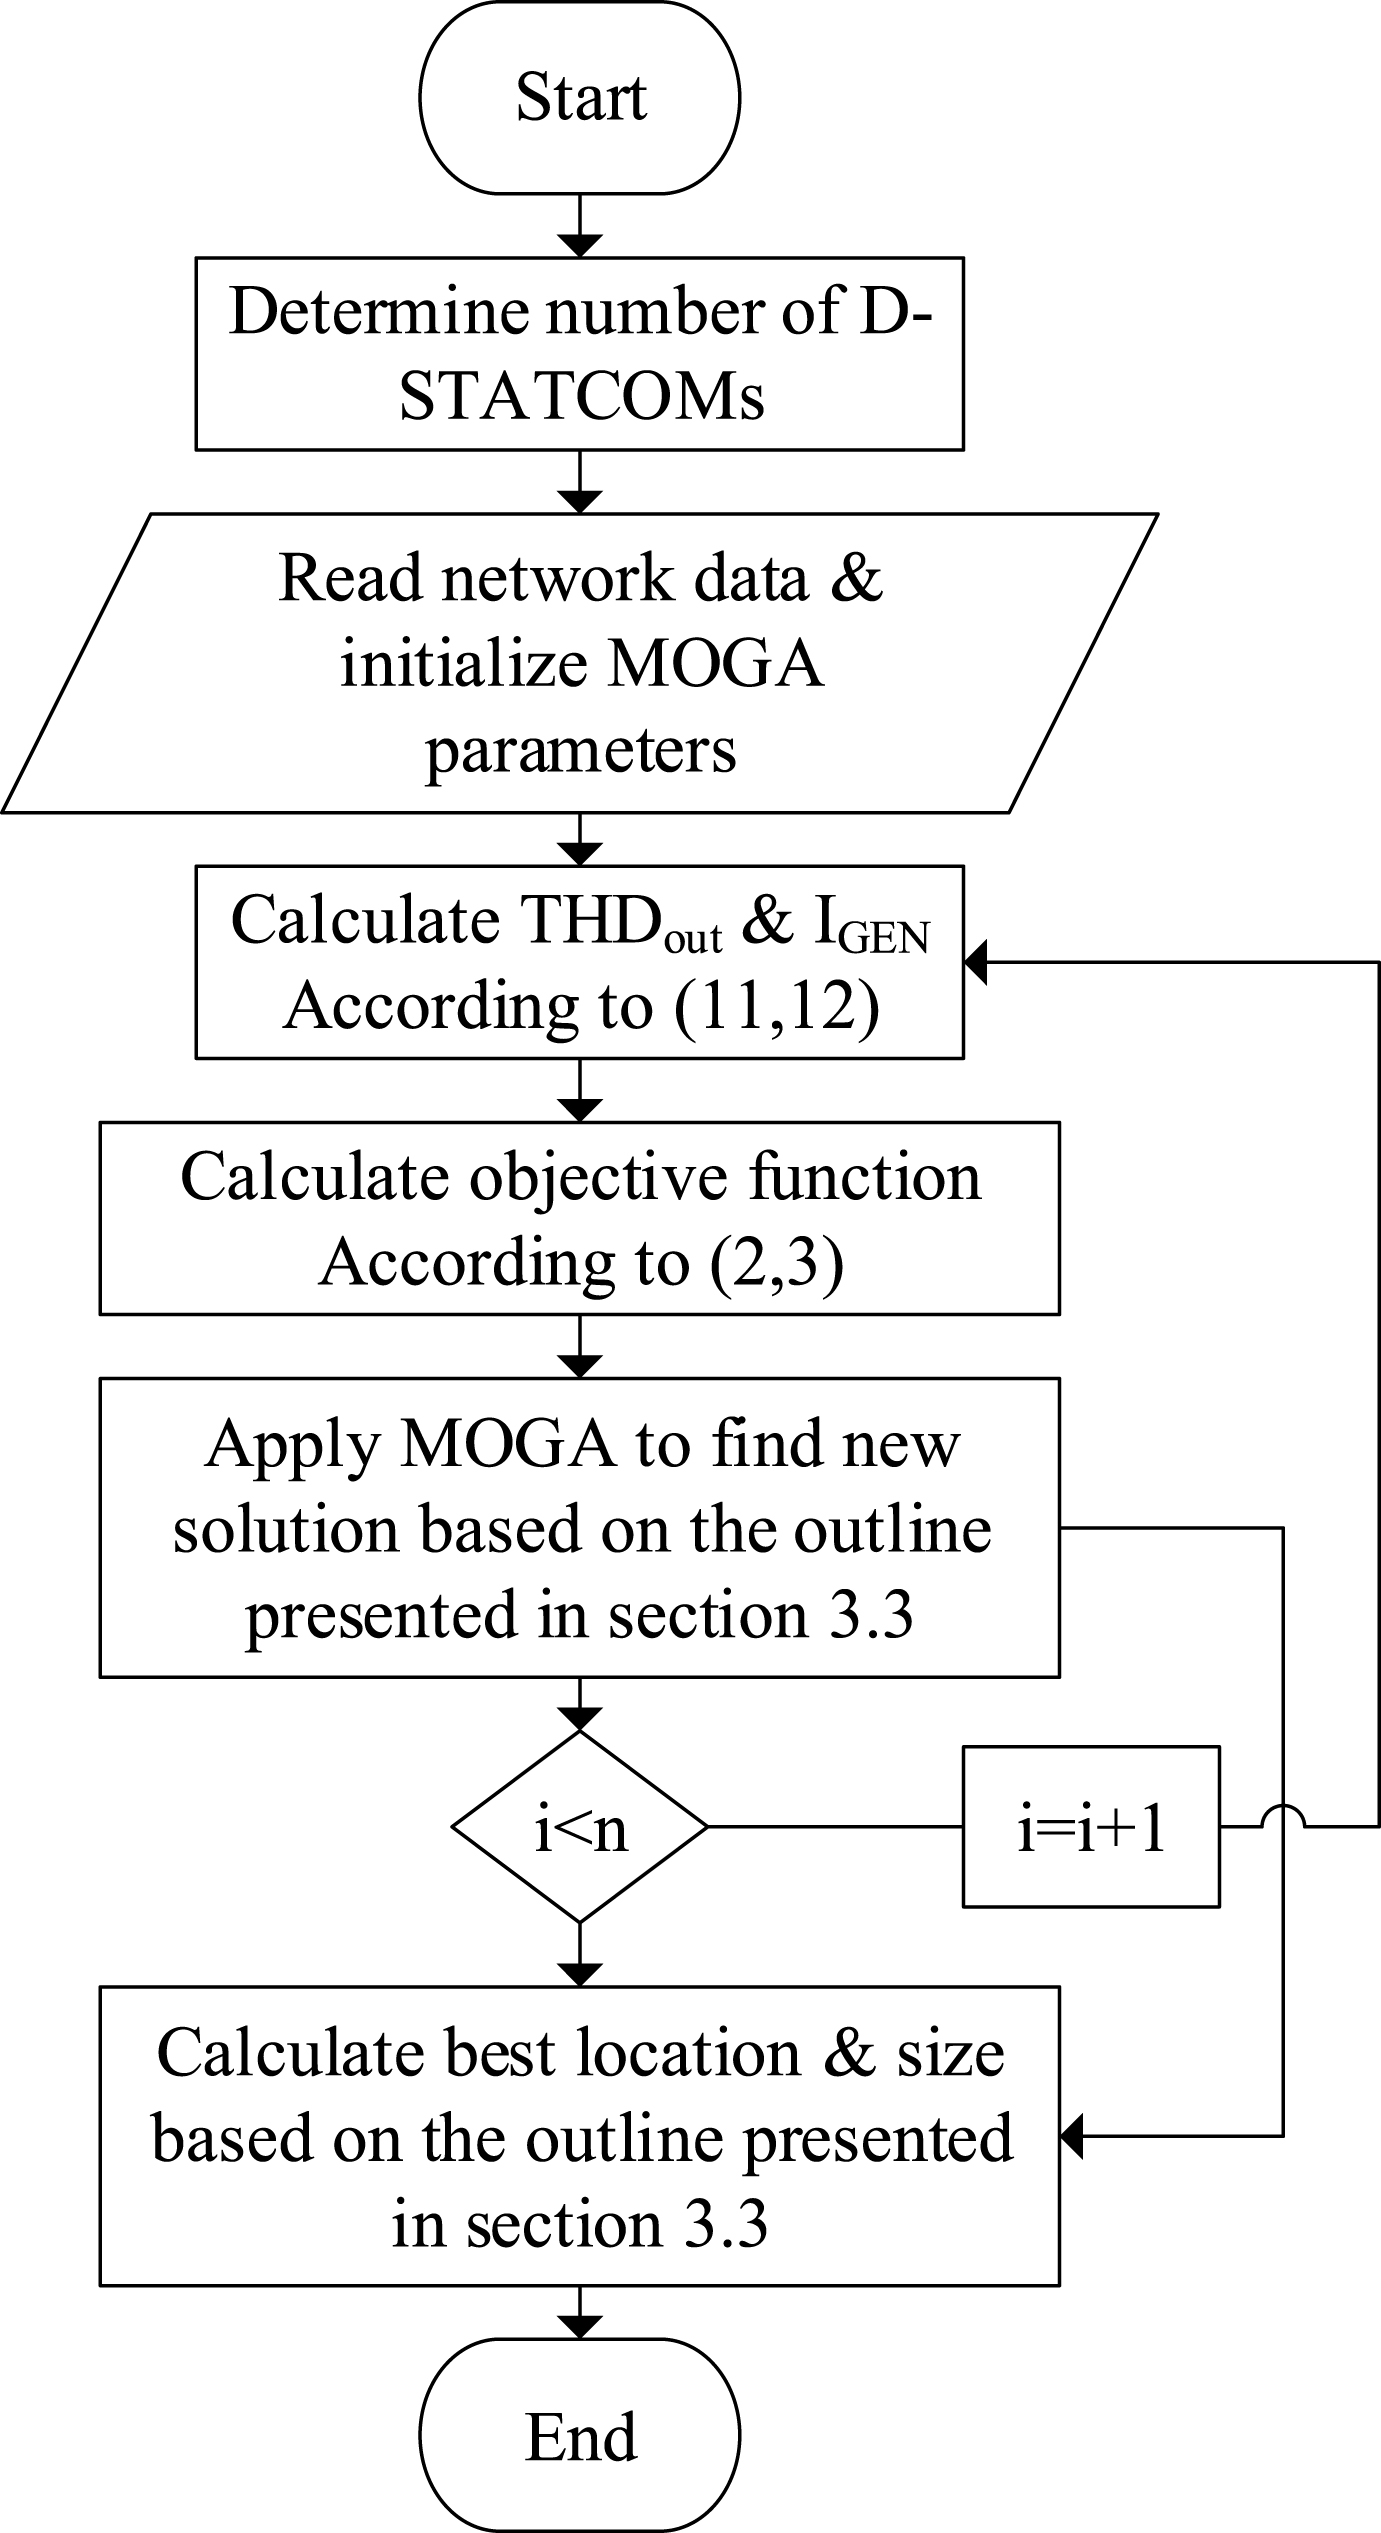
Flowchart of MOGA algorithm to find optimum solution for the placement and sizing of D-STATCOM in the distributed network.
The main focus of this paper is to optimally allocate the D-STATCOM for harmonic mitigation applications; therefore, the model of devices has been presented with some assumptions and these are not exact model. In the following, simplified model for D-STATCOM and non-linear load are presented.
D-STATCOM model
It is clear that the harmonic mitigation process of D-STATCOM is based on input current polluted by harmonics and its behavior to eliminate or at least mitigate this undesired factor and deliver unpolluted current which only has fundamental component to the network which is realized by its converter. Therefore, this process can be modeled with three currents called I i nput as the input current to the device, I g en as the self-generated current of device to mitigate the undesired harmonic component and I o utput as the desired current which will be injected to the network. This modeling is shown in Fig. 4. Current generation process of device for mitigating the harmonics can be described based on its VSC. Having simultaneous control over PWM modulation and its input DC voltage, it is possible to perform various harmonic elimination schemes like selective harmonic elimination (SHE) which is applied to achieve proper harmonic level employing proper switching control and algorithm [24]. However, this procedure needs many layer of equipment and this reality leads us to select the multilevel scheme for SHE process [26]. Therefore, it can be assumed that reducing THD level and SHE can be realized in any desired level corresponds to the cost of the converter.
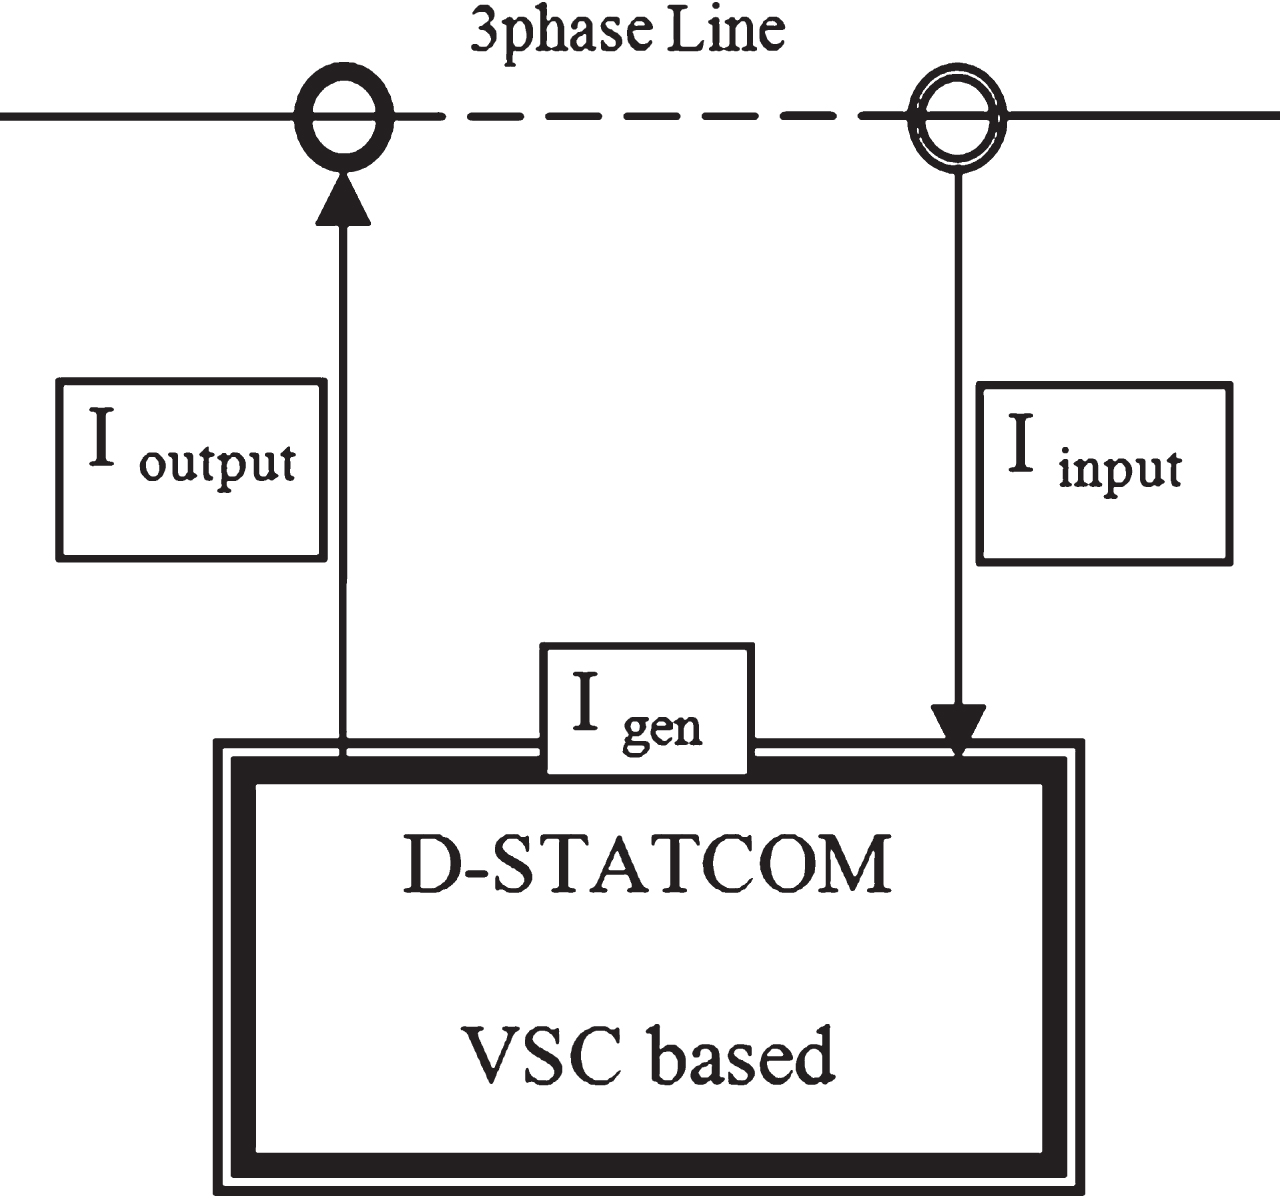
Simple developed model of D-STATCOM to mitigate the undesired harmonics in the distributed network.
In an industrial distribution system, the main equipment which needs to be dealt with in the harmonic analysis are distribution cables, transformers, nonlinear loads, capacitors and inductors. Instead of using the very accurate models, some practical and approximated models for industrial applications are employed in these paper [21, 22]. Therefore, for modeling nonlinear impacts of three-phase rectifier load on the load flow equations, the simulated rectifier is considered as a nonlinear load which is shown in Fig. 5. Therefore, for calculating the fundamental or harmonic frequency of bus voltage and consequently line current, the rectifier is modeled as a load. Based on the fundamental and harmonics voltage, the current of equivalent load is calculated using Equation (13). The harmonic components can be generated in one phase of VSC, as it is stated in Equation (14), if the actual DC current is I d [27].
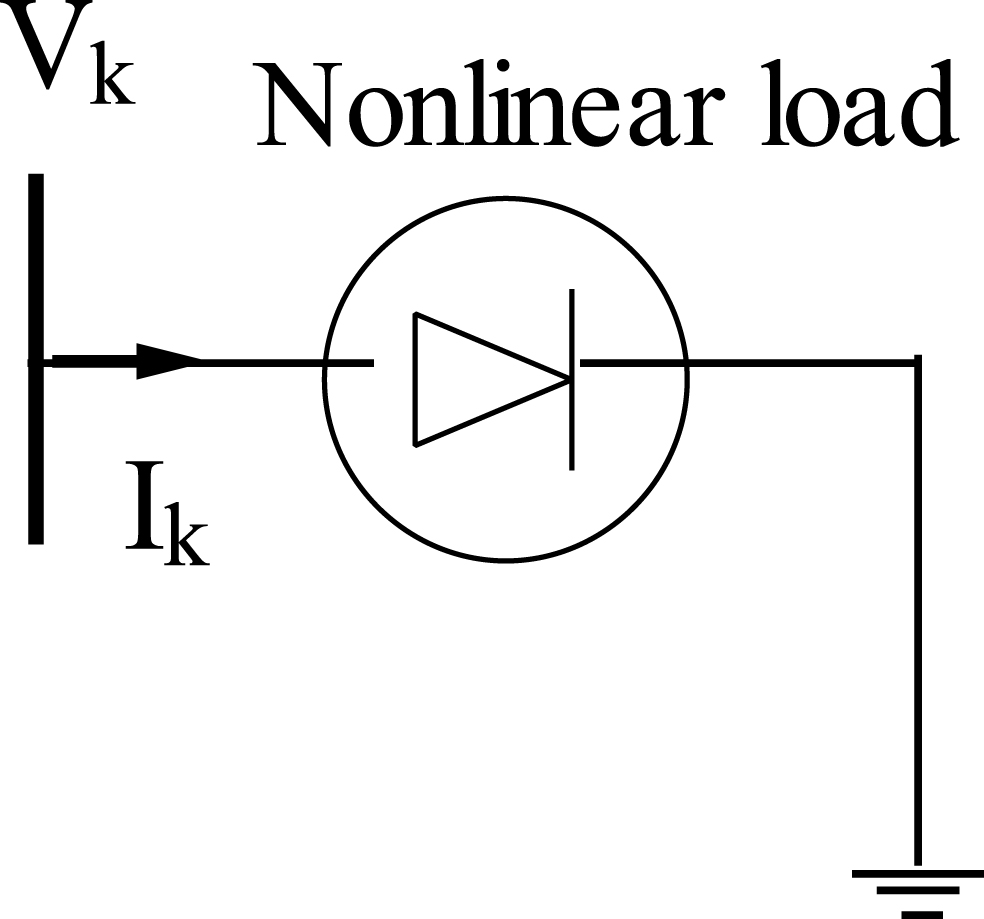
Model of nonlinear load for linear analysis.
To verify the applicability of the MOGA in optimal placement of D-STATCOM in harmonic mitigation problems, the proposed method is applied on the modified IEEE 33-bus test system shown in Fig. 6 [28].
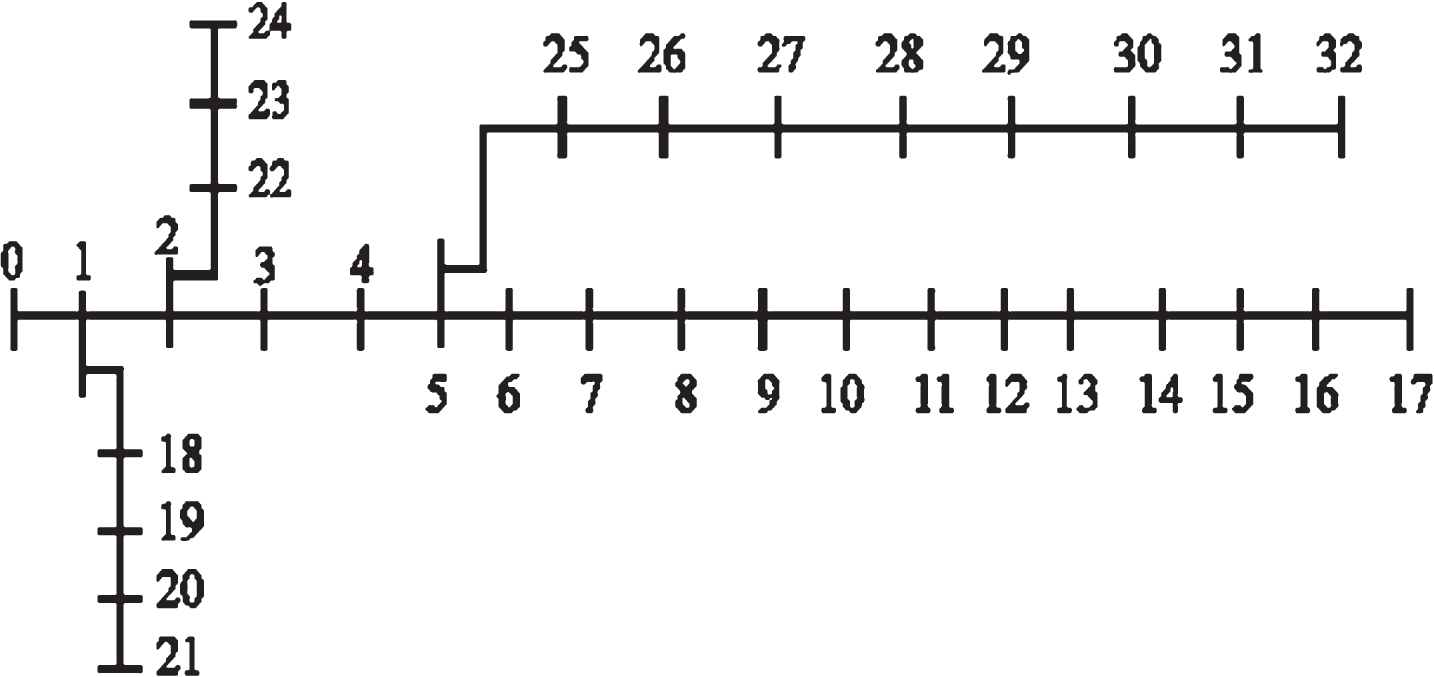
Single line diagram of IEEE 33-bus standard.
For evaluating the applied algorithm, an example of optimization output as the Pareto front in bus No.10 shown in Fig. 7 in which the vertical and horizontal axis display the first and second objective function. Each of the points shown in Fig. 7 can be considered as the optimal solution of the problem. Because, in Pareto front, the value of all points is equal in terms of optimization. Therefore, it will be possible for operators to optimal solution represent to presented point in this figure with respect to the prioritization of goals.
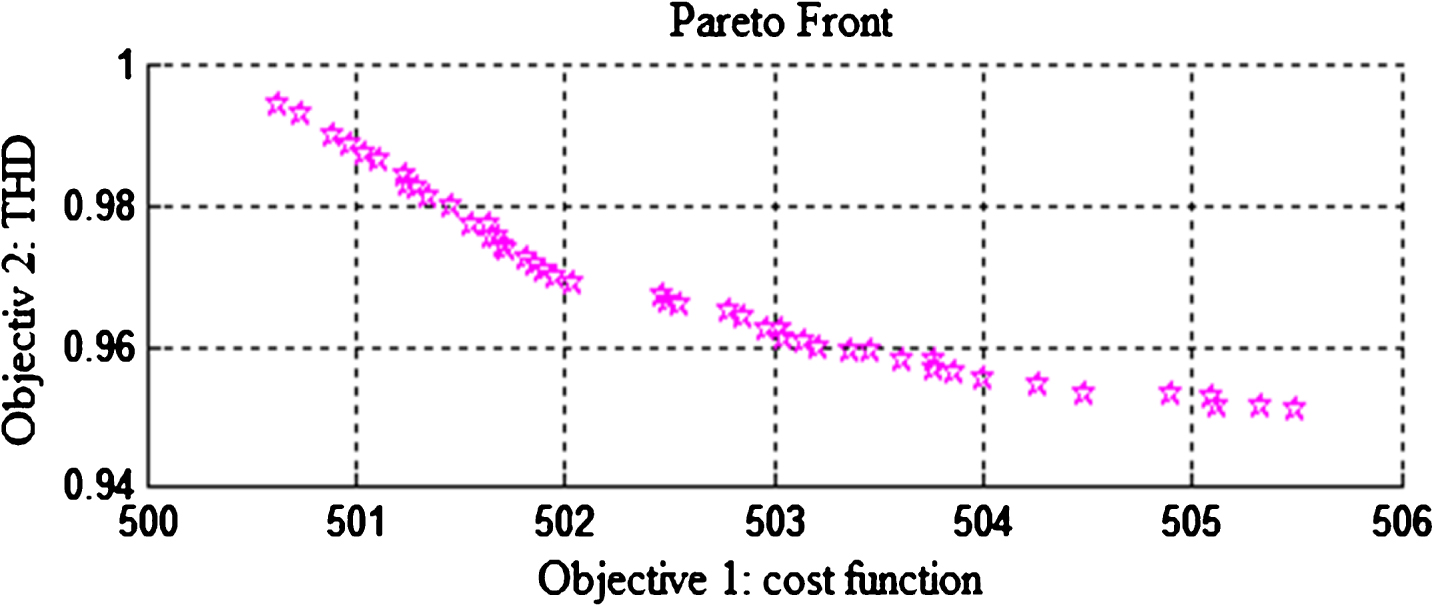
Example of the pareto front in Bus No. 10.
By solving the proposed multi-objectives problem, the pareto optimal solutions are obtained. Consequently, the best comprised solution (BSC) should be selected for proposed microgrid scheduling problem. In this regard, the max-min fuzzy satisfying criterion is utilized to select the BCS. In this method, firstly, the Fuzzy Membership Function (FMFs) are calculated [28]. This procedure can be mathematically expressed as follows:
Where z refers to the zth solution of the qth objective function.
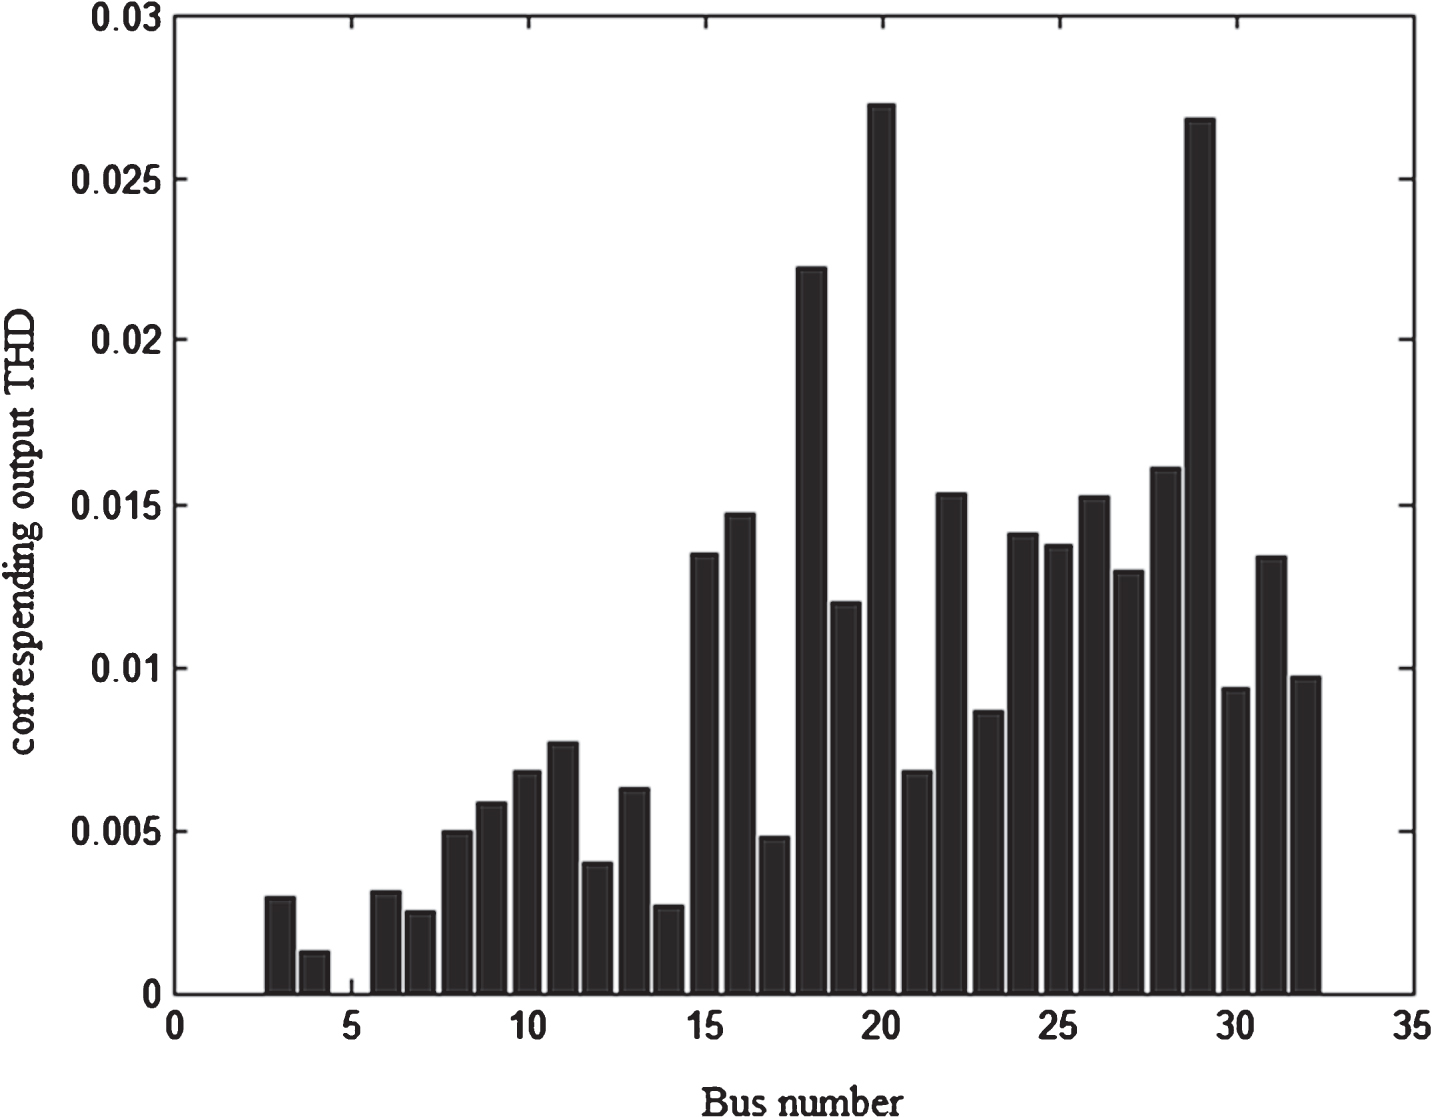
Output THD of each bus after placement of D-STATCOM on cited bus.
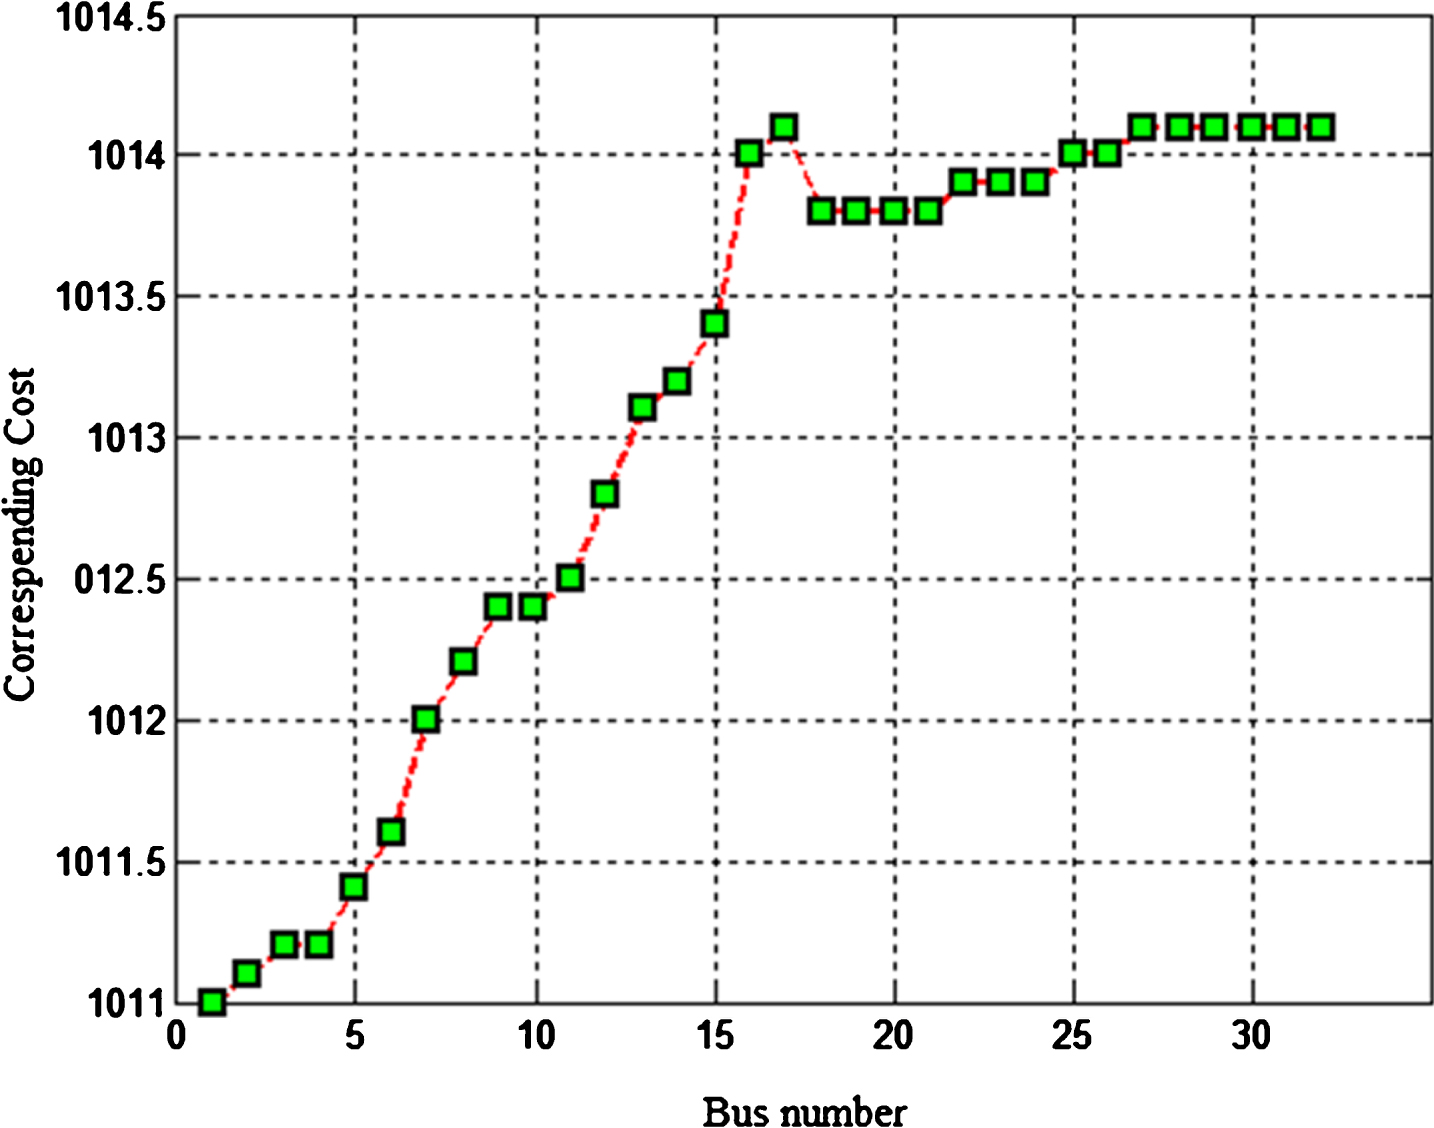
Overall cost of the system in the installed D-STATCOM bus number.
Input, generated, output and average network THD vs. installation and operation costs
After applying developed method to the test system, first objective function (installation and operation cost) and second objective function (THD minimization) are shown in Figs. 8 and 9 respectively. After determining the best location of the D-STATCOM by presented multi-objective algorithm (only one device is installed on the bus No.15), to evaluate the performance of the proposed method in the face of harmonic mitigation, the THD level of each buses should be measured. The results of this measurement are shown in Fig. 8. Therefore, it can be seen that after installing the equipment, the system’s THD level is limited to 2.5% (recorded at bus No. 19). So, it can be claimed that the performance of the installed equipment in bus No. 15 is acceptable.
The THD level of the 33-bus test system before and after placement and THD generated by D-STATCOM in each bus are stated as shown in Table 1.
Output current harmonics at the optimal placement case study
The average network THD in optimal bus number for installation of D-STATCOM is shown in Table 2. Comparing the results of the Fig. 8 and Table 1 and considering BSC method, it can be concluded that the best location for D-STATCOM considering the minimum average of the network THD is bus 15.
An improved method to determine the optimal location of D-STATCOM in distribution systems has been presented in this paper. This method applies MOGA to solve the optimal location problem using a multi-objective function, defined to enhance the power quality of the system by minimizing the output THD and the total installation and operation costs. The performance of the MOGA has been evaluated by the radial IEEE 33-bus test system using the Matlab software. Furthermore, novel developed forward backward harmonic load flow method employed to determine the harmonic generated by D-STATCOM which has faster operation time comparing to the previous ones. The simulations and comparison of the results have proved that the proposed MOGA is able to determine the most effective location of the D-STATCOM in radial distribution system and can improve the power quality level.
Footnotes
Appendix
Considering the operation of D-STATCOM described in section IV, input currents, which are polluted by harmonics, combine with generated currents produced by D-STATCOM due to the mitigation of undesired harmonics and output of this operation is unpolluted or unmitigated currents. These output currents at optimal placement case study are listed in ![]() .
.