
Abstract
The supply chain is a key element of successful operation of businesses in a turbulent economic situation. Swift management of delivery of raw materials and finished products while keeping costs as low as possible and maintaining proper customer service is becoming as vital as the quality and price of a product when gaining competitive advantage. This leads companies to a wide search for the best strategies that allow efficient management of the supply chain. The basic problem, however, is the occurrence of the so-called Forrester effect (also known as the bullwhip effect). It involves intensified transposing of changes in demand onto the execution of product flow in supply chains. The aim of this article is to develop a manner to reduce the Forrester effect using the consensus method. The first part of the article analyzed the current state of knowledge on the discussed problem. Then it presented basic elements of the developed prototype of a SCM system and defined the meth-od for reducing the Forrester effect using a consensus algorithm. The final part of the article de-scribes the way to conduct an experiment that involves verifying the consensus algorithm and analyzes the results of the verification and their influence on the reduction of the Forrester effect.
Introduction
The supply chain is a key element of successful operation of businesses in a turbulent economic situation. Swift management of delivery of raw materials and finished products while keeping costs as low as possible and maintaining proper customer service is becoming as vital as the quality and price of a product when gaining competitive advantage. This leads companies to a wide search for the best strategies that allow efficient management of the supply chain.
Modern supply chain should be characterized by the following [1]: the ability to react swiftly and satisfy rapidly changing demand, flexibility, the ability to adapt to the optimum: cost-level of service, the ability to use company resources optimally, the ability to use all available information.
A great number of companies, however, still struggle with uncertainty and changing demand in the global economy, which results in entire supply chains being unstable. It is becoming necessary to take all kinds of action aimed at developing both demand forecasts and related forecasts of product flow within a supply chain, that will project the actual demand and actual product flow in the future as accurately as possible. [2].
The basic problem, however, is the occurrence of the so-called Forrester effect (also known as the bullwhip effect). It involves intensified transposing of changes in demand onto the execution of product flow in supply chains [3]. Relatively minor changes in demand reported by end customers grow in size when the information of the demand is being communicated to manufacturers and their suppliers [4]. Information flowing through the supply chain in the form of orders is distorted and does not actually reflect only the change in demand but also contains forecasts on emergency stock [3]. The main reason behind the Forrester effect is the behavior of managers that involves rational decision making and, consequently, overestimating the increase or decrease in demand reported by end customers and assuming that the change will continue. Other sources of the Forrester effect are: time gap between order transmission and its execution as well as material flow, and the impact of promotional campaigns on creating the fluctuation of demand [5].
At present, a number of methods and tools are used that enable reducing the Forrester effect, such as integration of functions and participants of the supply chain, or process orientation [6]. The use of information technology, however, is the most significant. We are witnessing an increasing interest from organizational units in computer systems aimed at integrating the SCM (Supply Chain Management) [7]. They are used mainly to strictly coordinate the operations of business partners and allow to develop a forecast with much smaller error, however they do not entirely eliminate the Forrester effect. Subject literature [1, 8] points out, however, that the systems should present solutions that enable dynamic responses to emerging demands, which may lead to significant reduction of the Forrester effect. SCM systems should therefore present the user, in real time, with the best solution for product flow, based on current and reliable information gathered from the environment. However, as a result of the Forrester effect as well as using various methods of forecasting the flow of products, the SCM system normally presents the user with different variants of product flow among particular cooperating parties. Each variant may have different values of attributes (features) that describe product flow (an attribute, for instance, can be the date of delivery). Thus, there is inconsistence of knowledge in the system. The system should, however, have a solution that helps to select an variant that will bring satisfying gain to the user. It should be an variant that allows delivery of goods in correct amount and at correct time, at the lowest possible expense, low risk and, what is most important, with minimum distortion of information about demand as it is being communicated to the manufacturers and their suppliers. Therefore, knowledge should be integrated automatically by the system, in close-to-real time. The integration will allow, in the result, for significant reduction of the Forrester effect. SCM systems use different methods of integration of knowledge, such as negotiations [9] or deductive-computing methods [10]. Note that negotiations bring a good solution to a conflict of knowledge by reaching compromise but they require exchanging a large number of messages among the system’s components, thus it becomes difficult, often impossible, for a SCM system to operate in real time. The deductive-computing methods, in turn, (e.g. based on game theory, classic mechanics, or selection method) allow to gain high computing efficiency of the system, yet they do not guarantee proper result of knowledge integration because choosing one of the variants is often associated with high risk [11].
Existing practice of executing SCM systems has not paid attention to the consensus methods that allow for knowledge integration in close-to-real time [11], and simultaneously guarantee reaching good compromise [12]. In consensus, each side is considered, each side ‘loses’ as little as possible, each side contributes to the consensus, all sides accept the consensus, and it represents all sides of the conflict [13]. Therefore, the consensus methods allow to determine one decisive solution and this may result in reducing the Forrester effect.
The aim of this article is to develop a manner to reduce the Forrester effect using the consensus method.
The first part of the article analyzed the current state of knowledge on the discussed problem. Then it presented basic elements of the developed prototype of a SCM system and defined the method for reducing the Forrester effect using a consensus algorithm. The final part of the article describes the way to conduct an experiment that involves verifying the consensus algorithm and analyzes the results of the verification and their influence on the reduction of the Forrester effect.
Related works
Supply chain management constitutes an object of research in many academic studies. In the study [14] it is stated that a supply chain is a broader concept than logistics. Logistics is based on planning and determining the frameworks of the individual product and information flow plan in the enterprise [15]. Supply chain management is based on these frameworks but it is aimed at combining and coordinating the activities pursued by all participants of the product flow process, from the material supplier, to the producer, to the customer.
In order that such activities are possible, it is necessary to determine methods enabling enterprises to share the information indispensable for supply chain management. These methods are presented, among others, in the study [4]. They include: information centralization consisting in the enterprise’s providing all other participants of the chain with the necessary information, inventory supply management (continuous inventory supplementation) consisting in supplementing inventory with the use of the information shared by other enterprises without the need to create orders, joint planning, forecasting and supplementing consisting in establishing a division of enterprises into retailers and their suppliers, and the information about the currently demand as well as about sales tendencies, forecasts or promotions are exchanged electronically.
In order to Forrester effect reduction an experimental research using beer game has been conducted to study the difference in the performance of traditional supply chain, VMI based Supply Chain and CPFR based Supply Chain in an industrial setting [16]. The paper [17] instead presents using support vector machines in this purpose. Apart from these three methods, the authors of the studies [4, 18] proposed the use of agent programs for the purpose of sharing information and, as a consequence, the development of a multi-agent system enabling supply chain management [19]. This is because agent programs can seek and process the necessary information, draw conclusions on their basis and take appropriate actions (automatically, without a human contribution). Agents are grouped depending on the enterprise position in the supply chain, for example agents serving suppliers, agents serving producers or agents serving retailers.
In the study [20], in turn, it is noticed that in a multi-agent system each agent can pursue a different supply chain management strategy and, as a result, generate diverse solutions to the same problem. In other words, each agent can possess a different knowledge about a given phenomenon. In such a situation a conflict of knowledge occurs.
Integration of a collective knowledge is considered in different ways and on different levels. Previous attempts tended to predict group performance based on some statistic involving members’ performances. [21] measured the collective intelligence. They experimentally proved that collective intelligence is not strongly correlated with the average or maximum individual intelligence of group members but is correlated with the average social sensitivity of group members, the equality in distribution of conversational turn-taking, and the proportion of females in the group. Based on the mentioned results in this project we deal with the problem of determining knowledge of a collective regarding two aspects: with interactions of group members and without interactions. For these tasks the consensus theory will be applied, owing to this approach we can prove mathematically the statements given by experiments performed in the previous works.
In works [12, 23] a formal mathematical model for knowledge integration is presented, in which the consensus-based knowledge functions for generating integration of knowledge have been defined. In [23] author developed a general model for consensus. Consensus methodology has been proved to be useful in solving conflicts and should be also effective for knowledge inconsistency resolution and knowledge integration. The general notion of consensus and postulates for consensus choice functions (in this work also called knowledge function) were defined like: reliability, unanimity, simplification, quasi-unanimity, consistency, Condorcet consistency, general consistency, proportion, 1-optimality and 2-optimality [12]. Next, classes of consensus functions were defined and analyzed referring to postulates. In the studies [23] it is concluded that consensus methods can be employed to resolve conflicts of knowledge. Many authors carried out works on the consensus theory [12, 24], which accounted only for opinions of parties to the conflict, while disregarding the certainty level of such opinions. However, for the decision structure to fully correspond to the actual needs of decision-makers, it needs to include – apart from opinions – certainty levels of such opinions because economic decisions are most often taken in the circumstances of risk or uncertainty. Definitions of such structures and consensus algorithms with reference to the decisions structure accounting for certainty levels of agents’ opinions [25] are currently being developed in the studies concerning consensus methods.
What follows from the conducted relevant literature review is that there are currently no effective manners knowledge integration in SCM systems and therefore a consensus determination algorithm will be developed in the further part of this paper to enable this integration. As a consequence, this will lead to a situation where the system determines – on a real time basis – one variant bringing satisfying benefits to the user in terms of quantity, timeliness and cost intensity of deliveries as well as reducing the risk involved in the process of determining the correct variant. Such a behavior can enable more effective and more flexible supply chain management, which has a positive impact on the reduction of a Forrester effect.
A prototype of supply chain management system
Existing solutions [4, 20] reduce the Forrester effect narrowly, despite the fact that components of system use different methods of managing the supply chain. Additionally, the system user has to decide for themselves which variant of product flow generated by the system should be executed, whereas in the prototype of a SCM system presented in this article, the process of determining the final variant is made by the consensus module. The structure of the prototype utilizes a concept of using consensus methods presented in [24], illustrated in Fig. 1.
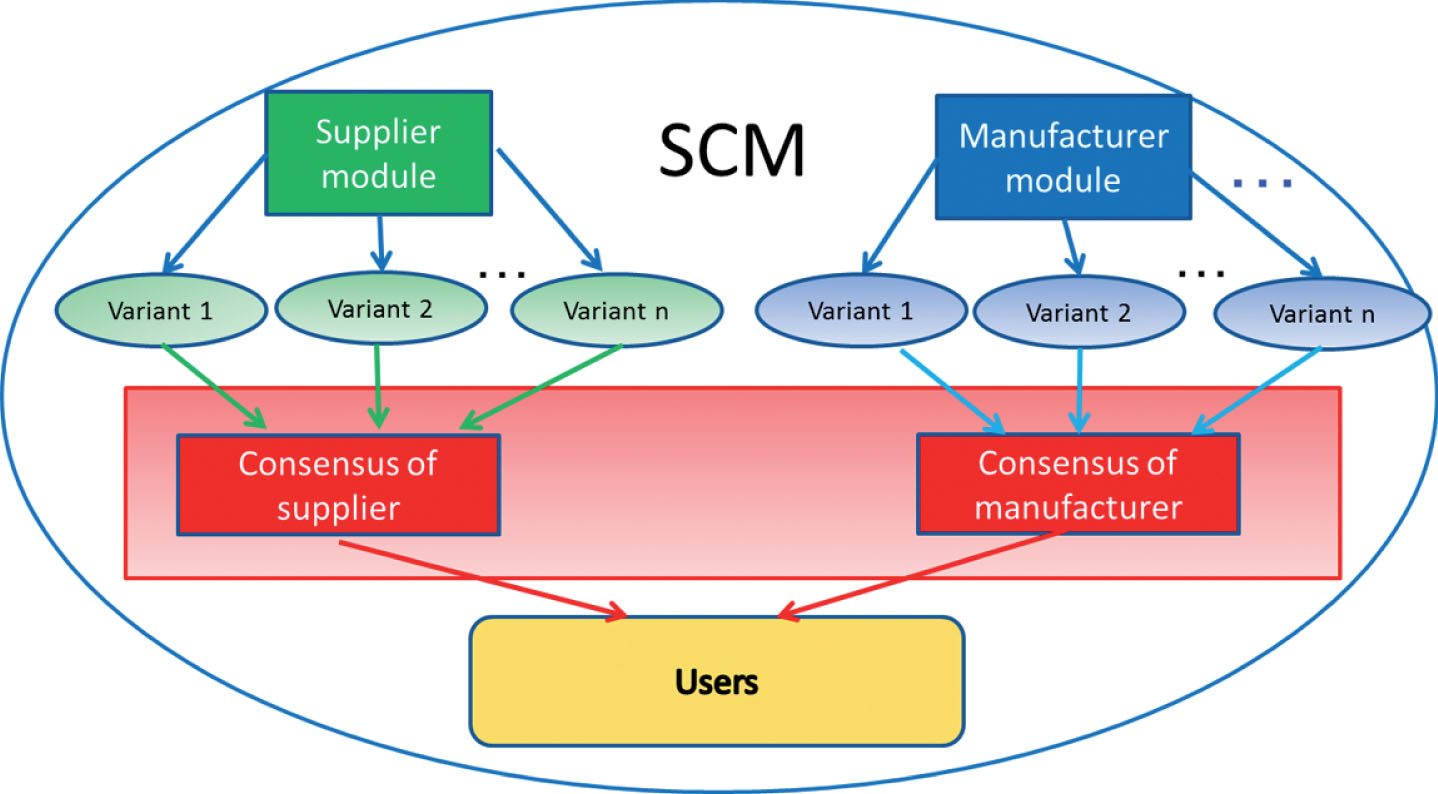
Diagram of the concept of using consensus method in supply chain management.
The prototype of the SCM system is build from decisions making components, which independently (automatically, with no user operation) find and process the necessary information, draw conclusions from it, and take proper action. This components are grouped according to the position of a business unit in the supply chain.
The concept assumes that the SCM system is divided into modules relating to suppliers, manufacturers, wholesalers, retailers and individual customers. Each module is composed of the following elements (Fig. 2):
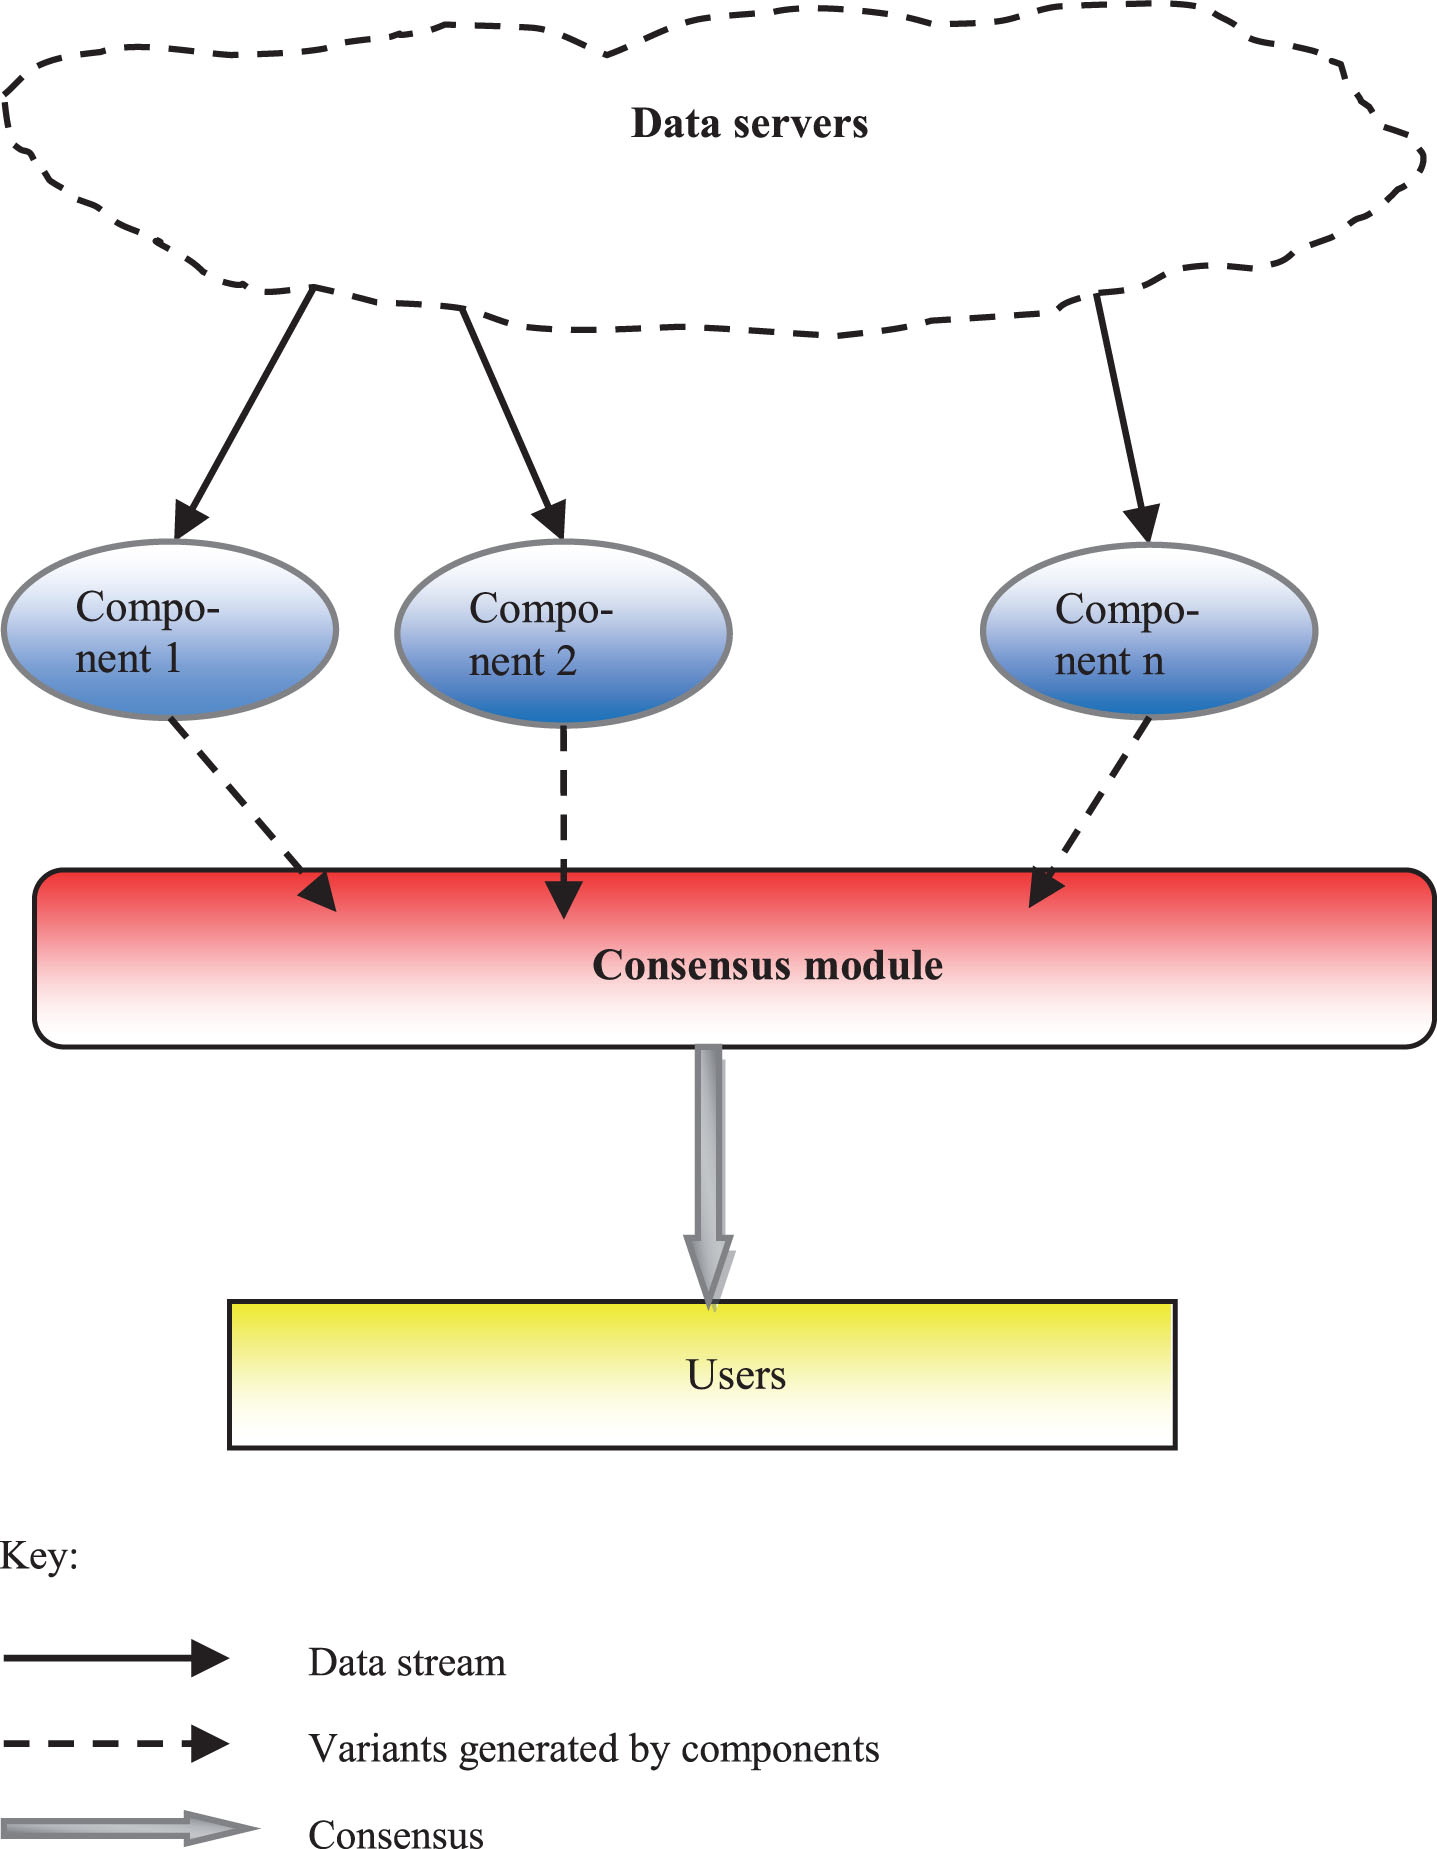
Architecture of module in SCM prototype.
data servers, decision making components, consensus module, users.
Variants generated by components are stored in a data base in the form of the following variant structure [13]:
Let: set of goods T = {t1, t2, …, t
N
} set of locations M = {m1, m2, …, m
L
}
are given.
An variant’s structure will be any sequence:
p, q, r, s, x, y = {1 . . L} ,
dt m p1 , dt m r1 , . . . , dt m xN - time and date of sending goods t1, t2, . . . , t n from location m p , m r , . . . , m x ,
dt m q1 , dt m s1 , . . . , dt m yN - time and date of receiving goods t1, t2, . . . , t n at location m q , m s , . . . , m y ,
i1, i2, . . . , i N - quantity of transported goods t1, t2, . . . , t n (size of delivery batch),
k1, k2, . . . , k N - transport costs t1, t2, . . . , t n .
A definition formulated as such enables presenting individual solution variants in a uniform structure. It is a complex and multi-value structure with different types of data.
Since, as it has already been stated, in order to reduce the Forrester effect, it is necessary to integrate knowledge, the following parts of this article will characterize the consensus module which allows this process to be executed and, as a result, to agree on the final solution presented to the user, with little distortion of information about demand as it is communicated to manufacturers and their suppliers
The essence of consensus is based on agreement [12, 23]. Therefore, the solution presented to the user does not have to be one of variants generated by components operating in the system, but it is created on the basis of these variants. As a result, the variants generated by all components are taken into consideration.
Note also that consensus is not mean. It is a solution whose distance from profile elements is minimum (considering a simple example – a profile consisting of numbers 2,3, and 8, consensus is number 3 since minimum distance to other profile elements is 1 + 0+5 = 6, while mean is 4.33).
The process of determining consensus is composed of three basic stages. The first stage involves careful examination of the structure of a set with all variants generated by the SCM system, stipulating the features that represent the variants and the domains of their value. The structures of variants also constitute the structure of knowledge in the SCM system (the variant structure has been presented in item 3). The second stage involves defining the function to calculate the distance between individual variants (the function has been described in the article [11]. The third stage defines the set of variants (profile) to determine consensus and develops algorithms for determining consensus, that is determining such variant that the distance between the variant (consensus) and individual variants generated by the SCM system is at minimum (according to different criteria of uniformity) [26].
A profile A = {W(1), W(2), …, W(R)} is a set of M variants, such as:
The algorithm for determining consensus is constructed in such a way that it determines and ascending order of values dtxy of all variants and does the same with values i y and k y . The next step is to calculate between which values in the orders is the location of the value that is the consensus. The next step determines the value of consensus of goods, location of departure and arrival, by selecting from the profile values of such attributes of an variant, where the distance between the cost of the variants and the cost of an variant determined in consensus is at minimum. The algorithm finishes when all elements of the variants are checked and consensus is found. Formal definition of this algorithm is as follows:
Let CON (x) =0. j: = dt
xy
. Determine pr(j).
If j = dt
xy
then j: = i
y
. Go to: 3. If j: = i then j: = k
y
. Go to 3. If j: = k
y
then STOP. Go to 7. Determine triple CON (t
x
) , CON (m
px
) , CON (m
px
), which meets the following conditions min(χ (CON (k
x
) , k
x
) (2)).
Computational complexity: O(N2 R).
Using the aforementioned algorithm is an SCM system will allow to skip the said analysis of individual variants and the necessity to select of them by a human user. The algorithm operates in close-to-real time.
The consensus module has a user interface illustrated in picture 3. Pressing ‘Read variants’ will read variants generated by individual components from the data base. The variants are displayed in the consensus module window. In order to determine consensus (with algorithm 1) press ‘Consensus’. The variant being the consensus is also displayed in the consensus module window.
The following part of the paper present a verification of the algorithm for determining consensus in the SCM system prototype.
The verification of consensus algorithm involved conducting a test, using the system prototype. The aim of the test was to compare the variants generated by the consensus module with variants generated by individual methods of managing the supply chains with relation to all business units operating in the supply chain. The following assumptions were adopted in the test: The initial value of stock is 100, the demand for subsequent days is determined randomly. The chronon
1
was one day. Pressing ‘Read variants’ will trigger components to start computing and shift the internal clock by one day (in order to accelerate the test, real time clock was dropped and an internal clock was used instead, where the time unit changes after pressing a button). The test was conducted for a period of 100 days (each component generated 100 variants, based on the variants from all components consensus was determined every day). The following values were measured in the test: cost of storage, cost of delivery and time of delivery. Cost of storage was calculated based on the quantity of products stored in stock (directly proportional dependence) and the duration of storage (directly proportional dependence). Cost of delivery was calculated based on the quantity transported products (directly proportional dependence) and time of delivery (inversely proportional dependence). Time of delivery was determined based on delivery dates defined while demand was planned by individual components. Average coefficient of variation was used as fluctuation and risk meter, since it is relative measures, therefore it allows to measure risk associated with selecting the target variant:
where:
V – average coefficient of variation,
s – average deviation of measured value,
E(r) – arithmetic mean of measured value.
In the experiment conducted, variants generated by individual components each day were saved. Next, based on the variants, consensus was determined. Table 1 presents the obtained results.
Results of the research experiment
Results of the research experiment
Analyzing the results of verification one can notice that the lowest average delivery costs and the shortest delivery times in the studied period have been obtained by variants generated by components a6 and a7 (236 and 232 respectively). The result obtained by consensus module (C). i.e. 249. ranks as the third in terms of the amount of average costs of delivery and delivery times in the analyzed period. So two components have generated better results than results generated using the consensus algorithm. However five components have generated even worse results.
Thanks to the use of the consensus algorithm it was possible to obtain lower average delivery cost and shorter delivery times in comparison to average delivery costs and delivery times of all components which in the studied period amounted to 261 and 1.52 respectively. It needs to be noticed. However, that even though decisions of components a6 and a7 enabled obtaining low average delivery cost and short average delivery times. they also generated high average storage costs. The lowest average storage costs could be obtained as a result of decisions generated by component a5 (124). however they also generated high average delivery costs (279) and long delivery times (2.74). The result obtained using the consensus algorithm. i.e. 199. also ranks as the third. in terms of average storage costs in the analyzed period. Application of the consensus algorithm has also enabled obtaining lower average storage costs compared to average storage costs calculated on the basis of variants of all components. which in the analyzed period amounted to 199.
While analyzing the fluctuation (coefficient of variation) connected with managing a supply chain, it has been observed that the use of the consensus algorithm enables executing the process with the lowest level of fluctuation (coefficient of variation was in case of delivery costs –0.02. 0.02% in case of storage costs. and 0.29 in case of delivery times) among analyzed methods of supply chain management.
For the remaining methods of supply chain management in the studied period the value of an average coefficient of variation in case of costs of delivery ranged between 0.5 and 0.9, between 0.03 and 0.16 in case of storage costs (component a1 achieve the same values of storage costs in all generated variants. therefore average coefficient of variation has not been calculated) and between 0.29 and 1.58 in case of delivery times. The low level of fluctuation is very important factor, which affect on Forrester effect reduction. It should be also stressed, that fluctuation of delivery costs, storage costs and delivery time influences affects one on the other. For example, if delivery time is characterized by high fluctuation then you can expect increase in fluctuation level of storage costs (high fluctuation in delivery time limits the “just in time” production, therefore it is need to store larger quantities of materials, raw materials or products in the warehouse). In addition, the measurement of fluctuation is very important to assessment how far the changes in demand reported by end customers influence on demand communicated to manufacturers and their suppliers. Level of fluctuation is also very important factor influences on financial liquidity of organizations in the frame of supply chain. If this level is relatively low, then developing of financial plans is easier than in case of high fluctuation. It is very important issue also from the controlling (management accounting) point of view. In supply chain, the problem with financial liquidity in the one of the companies can has very large impact to generate a problems with financial liquidity of the others companies. In consequence it can has very negative impact of effectiveness of business processes realized by these companies.
In order to confirmation achieved results, the statistical tests have been performed separate to delivery costs, storage costs and delivery time. Input data: results achieved by all decision making components and consensus module (group size: 100). PQStat software have been used [https://pqstat.pl/]. The following hypotheses was assumed:
H0 – the consensus results are not characterized by lower level of fluctuation (the lowest level of average coefficient of variation is not statistically significant).
H1 – the consensus results are characterized by lower level of fluctuation (the lowest level of average coefficient of variation is statistically significant).
Significance level: 0.05. First, the normality tests have been performed. Data is characterized by non-normal distribution, therefore Friedman ANOVA test have been performed including POST-HOC (Dunn Bonferroni). The results are presented in Tables 2–4 and Figs. 3–5.
Results of Friedman ANOVA test, POST-HOC (Dunn Bonferroni) for delivery costs
Results of Friedman ANOVA test, POST-HOC (Dunn Bonferroni) for storage costs
Results of Friedman ANOVA test, POST-HOC (Dunn Bonferroni) for storage costs
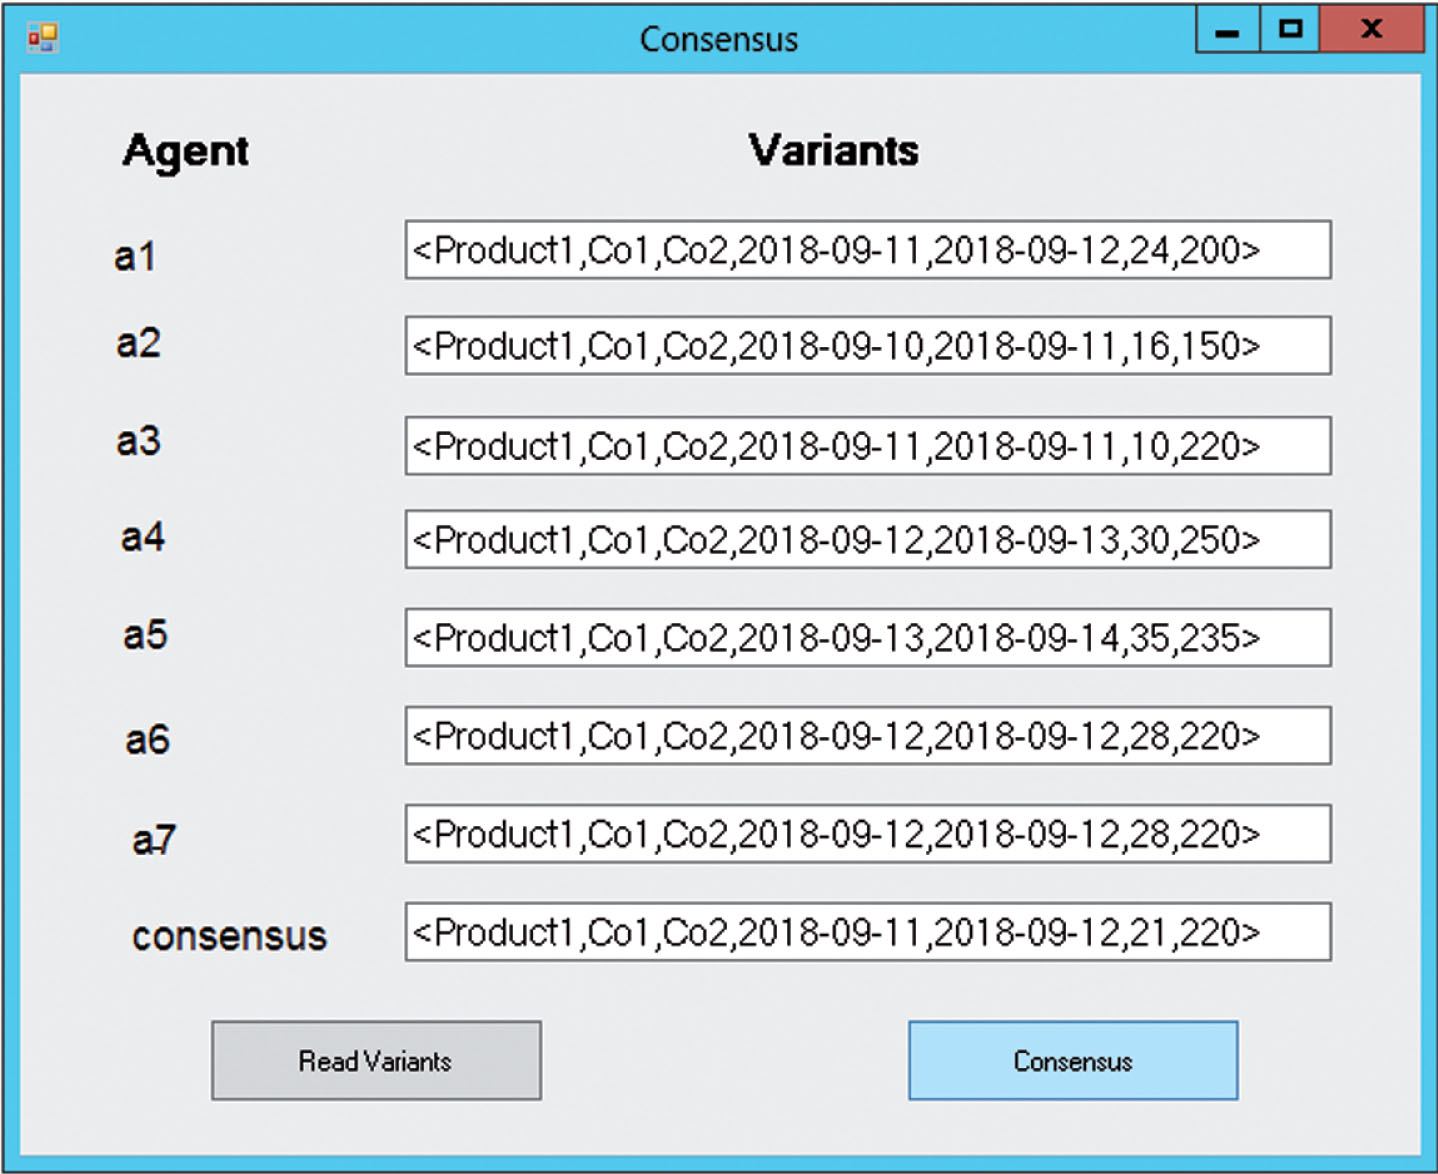
User interface of consensus module.
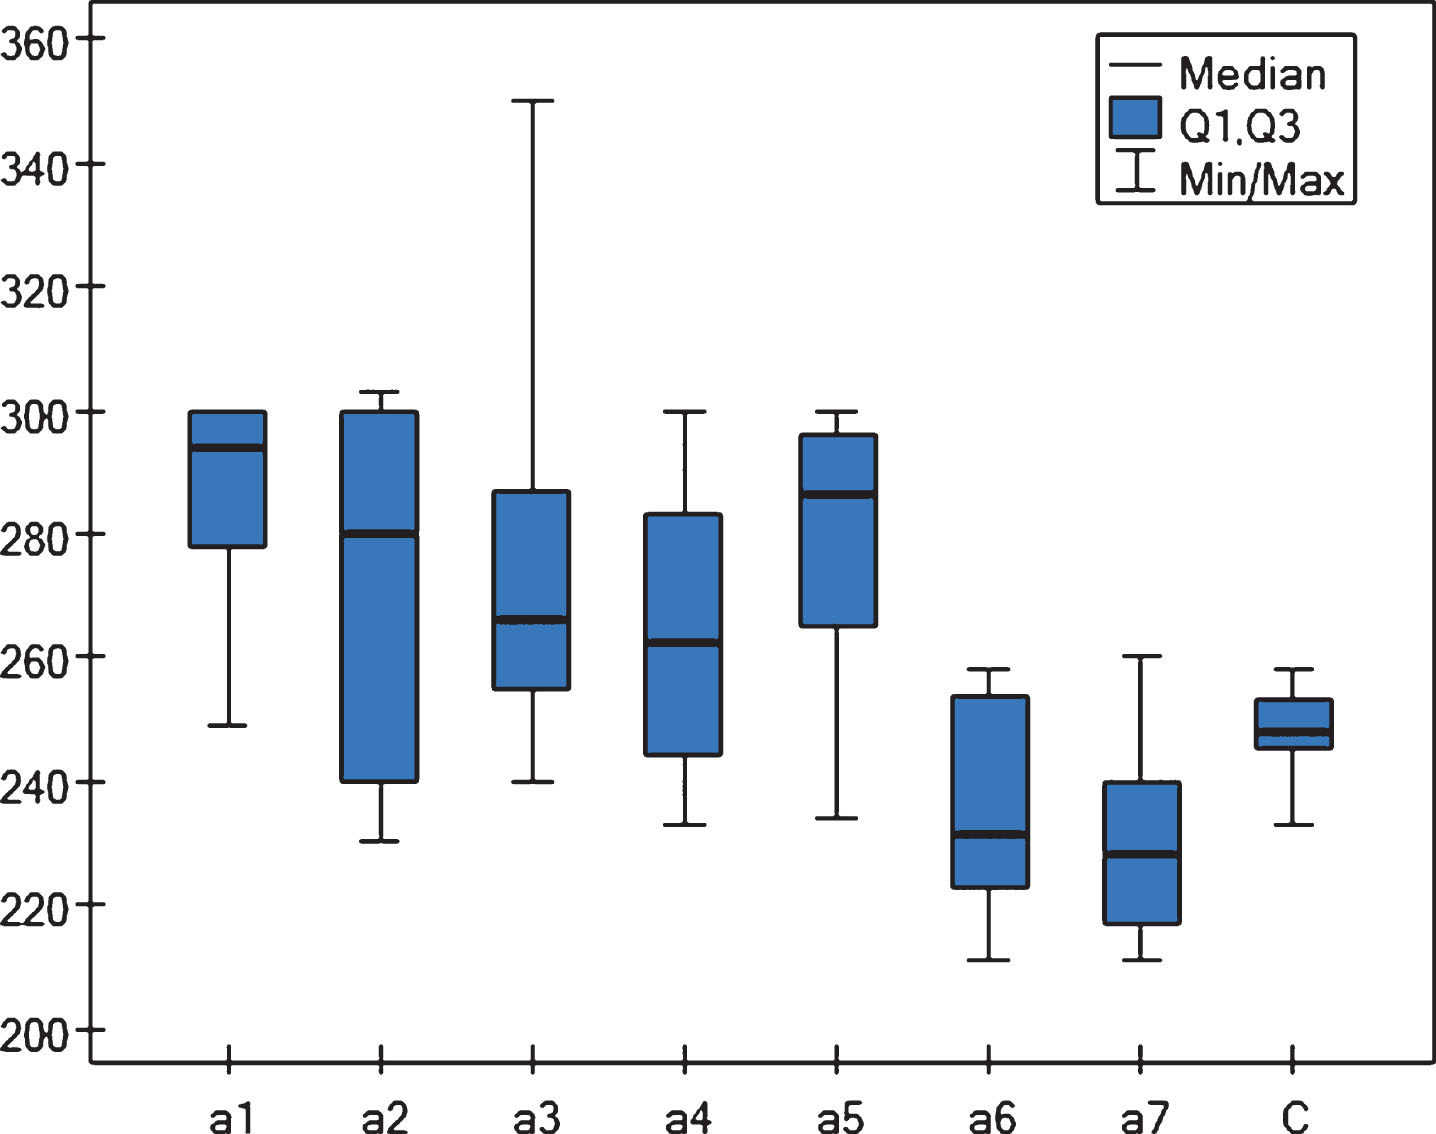
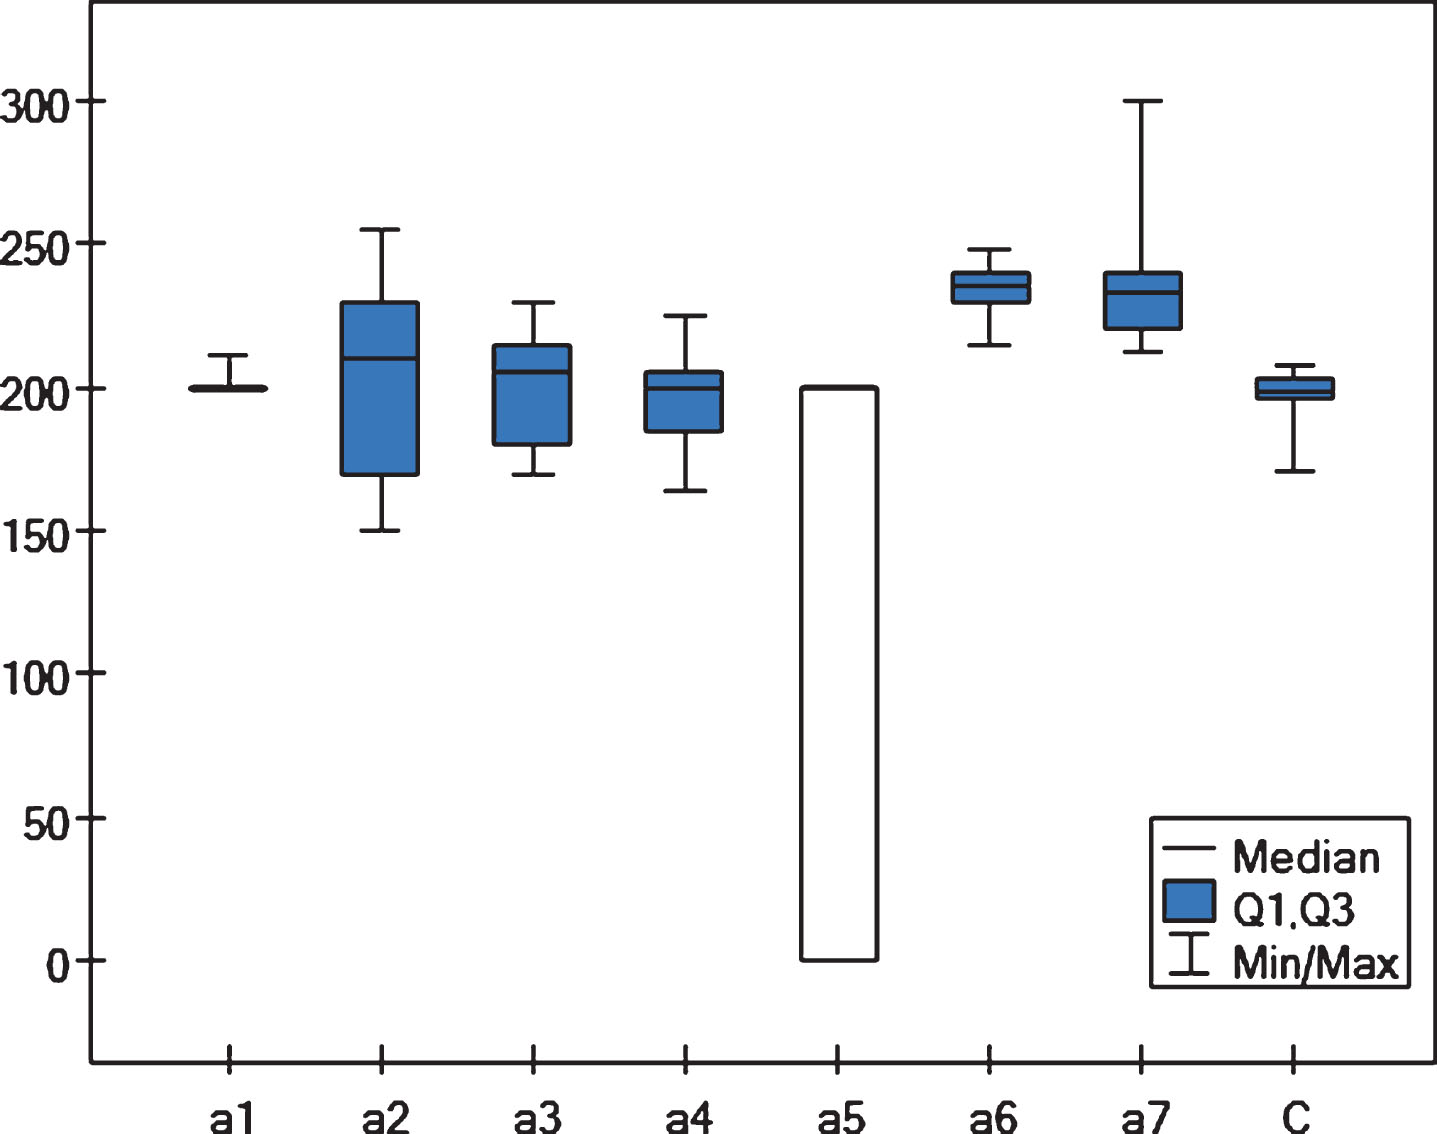
Blox-plotof Friedman ANOVA test, POST-HOC (Dunn Bonferroni) for storage costs.
Blox-plotof Friedman ANOVA test, POST-HOC (Dunn Bonferroni) for delivery time.
It can be seen then that variants generated by the integration component are characterized by: A lowest level of fluctuation of storage costs. Interquartile range between Q1 and Q3 is (Fig. 3) is smallest in case consensus; p-values (Table 2) calculated between consensus and all decision making components’ results are lowest than 0.05. Therefore H0 can be rejected and lowest value of average coefficient of variation is statistically significant. A low level of fluctuation of storage costs (one of components have lowest interquartile range between Q1 and Q3 than consensus (Fig. 4); however p-values (Table 3) calculated between consensus and all decision making components’ results in most cases are higher than 0.05. Therefore H0 can not be rejected and low value of average coefficient of variation can be statistically non significant. A lowest level of fluctuation of delivery time. Interquartile range between Q1 and Q3 is (Fig. 3) is smallest in case consensus (only component a7 has the same interquartile range); p-values (Table 4) calculated between consensus and a2 decision making component’s results are higher than 0.05 and lower in case remaining components. Therefore H0 can be rejected and lowest value of average coefficient of variation is statistically significant.
Therefore using the consensus method can positively affect the stability of a company’s financial liquidity in terms of delivery costs (if costs do not fluctuate so much it is easier to plan them) and it help maintain continuity of production (low fluctuation of delivery times lowers the risk of downtime). However the influence of using the consensus method on storage costs is not statistically proved.
To sum up. it needs to be stressed that variants generated by the consensus module enable to obtain lower costs of deliveries and shorter delivery times in a given period of supply chain management while keeping the risk lower compared to the situation when we each time use a single method of supply chain management (lowest value of average coefficient of variation). The possibility of generating target variants in real time as opposed to a situation where a decision maker has to independently select from variants generated by individual methods is of great importance too. Consequently, the level of usefulness of a selected variant increases, which results in satisfactory benefits such as: timeliness. adequate volumes of a given batch. or decreased costs of deliveries, which may in turn lead to a company obtaining good financial results.
The use of a consensus algorithm in the SCM system may lead to shortening the time of delivery, reduce the delivery costs as well as to reduce the risk of selection of the worst variant of product flow. However the main advantage is reducing the fluctuation in values of these measures. The low level of fluctuation has the positive impact on information and products flow in supply chain. In consequence it allows for reduction of a Forrester effect.
The main disadvantage is that consensus method do not guarantee that the decision will be optimal (they do not allows for achieve the lowest delivery and storage costs and shorter delivery time in all cases), but they ensure an adequate level of satisfaction, which should be determined by user (e.g. levels of accepted values of considered measures). The consensus algorithm developed in this paper do not allow for generate the feedback for evaluation the particular methods of product flow planning (the knowledge generated by this method is not automatically evaluated). The problems of storage costs fluctuation level (the positive impact of consensus method has been not statistically confirmed) and using others fluctuation measures (such as interquartile range, mean absolute difference, distance standard deviation, quartile coefficient of dispersion, entropy) are also still open. A greater number of experiments on real data is needed to more deep conclusions (e.g. why consensus results related to storage costs are statistically non significant; does this problem require modification of consensus algorithm or the problem’s source is in experimental data?).
Further research is related, among other things, to the development of the multi-agent SCM system and to implement intelligent agents allows for permanently learning (for example using cognitive technologies and deep learning technologies), the development of consensus algorithms that enable the improvement of agents’ knowledge and the implementation of these solutions in the Cognitive Integrated Management Information System [27].
Footnotes
It is the smallest unit of time and can be, for example, the second, minute, hour, day - depending on the nature of the task.
Acknowledgments
“The project is financed by the Ministry of Science and Higher Education in Poland under the programme “Regional Initiative of Excellence” 2019 - 2022 project number 015/RID/2018/19 total funding amount 10 721 040,00 PLN”