
Abstract
Housing around 17% of the earth’s total population, the Republic of India is a place where 91.6 million of its total population is above 60 years old. Elderly people in India has always been taken care of by their children; however, due to the rampant urbanization and employment constraints, children along with their own families move to the places of their employment leaving old parents alone in their houses, unattended. In this paper, a fuzzy probability transformation based system is proposed to ensure that the elderly are safe in their houses. The scope of this work is limited to learn the bathroom usage pattern of an elderly individual. If an unusual pattern is detected, the system will inform the caregivers immediately. To deal with the ambiguities, the concept of fuzzy numbers is used in the system. The proposed system utilizes the idea of the Internet of Things (IoT) to collect, transmit and present data to the stakeholders. Bayesian reasoning is used as a rider to the proposed methodology for robust decision making in cases of deep uncertainties. An alternative analysis is also performed on the same data using logistic regression and time-series analysis. The results show that the proposed method learns well with time than the other methods and provides superior accuracy.
Introduction
India is expected to witness a surge of 20% in the size of its elderly population by 2020 [1, 2]. Getting financial and personal care from adult children is a societal norm in India. However, due to the current trends of mushrooming nuclear families, a large population of the elderly is expected to stay alone in their houses. Taking care of elderly neither remains a personal affair, nor a familial responsibility. Instead, it is a societal problem which requires a support framework that anyone can use [3]. Internet of Things (IoT) is a revolutionary technology that is being used in the development of health vigilance system. Most of these IoT based technologies require their subjects to wear those devices as wristbands, waistbands, etc.
Requiring subjects to wear those devices is a problem that hampers the diffusion of such innovations in the market. With Elderly, wearable devices are less likely to be successful owing to various reasons including, but not limited to, irritation, Alzheimer, and normal forgetfulness due to aging. Several incidents of electrocution, random bathroom accidents-slips and falls, sudden bath related deaths have been reported in the past which shows the kind of risks associated with bathroom usage. These risks get increased in cases of elderly living alone. If an elderly gets fainted inside the bathroom, caretakers should be informed immediately before it is too late. Bathroom usage is a matter of privacy, and extreme care must be taken before installing any surveillance system like CCTV which violates the legislative laws and fundamental human rights in various countries. Therefore, an activity vigilance system is required to set in place that must be hassle-free to use and can keep vigil of an elderly inside the bathroom facility without compromising on the privacy. Deaths during bathing are a common phenomenon found in the elderly persons above the age of 65. Such deaths tend to occur when an elderly takes a bath unnoticed by other family members [4]. The findings of the report [4] suggest that elderly those are living alone in their houses are more vulnerable to bathroom accidents due to unavailability of someone to attend them. This motivates us to develop a system that ensure the well-being of our elderly by keeping a hassle-free vigilance on their activities inside the bathroom and yet does not violate their privacy.
This article proposes an activity vigilance system for elderly that amalgamates IoT technology and fuzzy probability transformations based learning technique to correctly vigil and promptly whistle the cases of casualties. Section 2 presents a comprehensive related work of the techniques reported in the field of elderly care in the past years. Section 3 presents an architecture for the proposed system; behavior learning technique is defined in section 4; results and alternative analyses are discussed in section 5 followed by conclusion and scope of future work in section 6.
Related work
The field of healthcare is going through an unmatched technological revolution. The isolated health monitoring systems are now transforming into ubiquitous IoT based systems capable of generating and exchanging vast amounts of valuable data [5, 6]. The utilization of ICT in the field of elderly care has some advantages [7]. The smart IoT devices are permitting a more tailored, precautionary and shared form of elderly care, where the family members or caregivers distantly [8] are monitoring elderly.
Remote elderly care has been a longstanding domain of research, and specifically, various activities of research have been conducted on this subject which could enable individuals to live comfortably, autonomously and safely while remaining in their present living arrangement. In the last few years, significant research efforts have been made mainly in the area of IoT driven healthcare appliances, prototypes, and services [13–15].
Among them, a large portion of the research is focused on specific areas of elderly care prerequisites, such as wellbeing observing and security checking [12]. Regarding elderly monitoring and care, the classification of daily human activities using wearable inertial sensors has been widely explored in the literature [9, 10]. To facilitate care for elderly people who live alone Hyun-Sik Kim et al. proposed a daily activity monitoring system for IoT supported living in home area networks [11].
Chan et al. emphasized the requirement of including a variety of sensing into implantable gadgets for observing individuals without disturbing their day by day schedules. They also highlighted that assistive, and interactive robots could not only provide people with useful services in their everyday lives but also serve as companions to reduce loneliness and social isolation [13]. Kleinberger et al. presented a similar system for the elderly where they could be prepared to deal with modern interfaces for their assisted living. The particular needs of the elderly are classified into three classes viz. comfort, autonomy, and help [10]. Hindia et al. presented a remote monitoring system focused on the application of IoT in modern healthcare systems. Wearable sensors were used to obtain vital parameters of the health of an individual, and then a new scheduling approach was proposed based on the dynamic scheduling technique [14]. Mighali et al. describe a reliable system for controlling the body movements and position of the subject in a modest, low-cost, and low-power way.
Predicting the health and wellbeing of an individual is remaining not only the matter of medical science; instead, many computational methods of forecasting the health parameters are available [15]. Estimating the time taken by an elderly in a bathroom facility is a classification task. Pandey et al. used a time series approach to model a classification system where crop production is classified into fuzzy sets [16]. Use of magnetic switches, infrared movement sensors, and pressure sensitive mats has been advocated by way of a four-level alert framework to monitor home activities smartly [17]. A design methodology was proposed by Damian et al. that targets the elderly care problem not only from the designer’s perspective but also considered the contacting authorities and potential users’ requirements [18].
A technique to alleviate the real-time video streaming service disruptions applied to a video supervision system in a smart home model was proposed to monitor the safety and activities of residents [19].
Efforts have been made to monitor elderly health using RFID by assessing different health parameters during kitchen work, washing activities, urination, and other acts in the accommodation [20]. Incorporation of IoT enables a variety of data collection on a considerable scale, but the extraction of knowledge from this data can lead to user privacy issues [21–23]. Latencies in the operations of elderly care and monitoring systems cannot be permitted which may result in severe consequences [24–26]. Other essential contributions reported in the area of IoT based healthcare, elderly care, and living assistance is summarized in Table 1.
Key works of literature in the field of Elderly care and smart homes
Key works of literature in the field of Elderly care and smart homes
An extensive literature review on elderly care and monitoring shows that there are various techniques and systems available that perform constant monitoring of activities, health, and well-being of the elderly at home when they are living alone. It is noticeable that research activities in the area of elderly care services based on the wireless sensor network (WSN) [36], can be considered as an initial effort in IoT based elderly care. Even though researchers have been working towards a fully functional elderly care smart home, some research gaps and challenges need to be addressed with a specific end goal to reduce the costing and remove the compulsion of wearable, without compromising the privacy of our elderly.
The authors find four significant concerns listed below, as an outcome of this literature survey related to elderly care The most pressing concern for elderly monitoring is associated with the compulsion of wearing sensors for physiological parameter measurement. Elderly peoples get irritated of using these wearables; therefore, non-wearable IoT based systems should be preferred which could allow elderly to move freely. Monitoring the activities of the elderly through CCTV surveillance profoundly compromises the privacy of our elderly. The Multimedia and Bigdata generated by such systems are moderately prone to misuse and averse to privacy. Elderly monitoring systems require a high degree of timeliness and real-time processing; casualty alarms must be prompt. Accuracy and precision are also essential characteristics of an elderly care system. The decision making of such systems should be very accurate and precise to avoid false alarms and yet maintain the credibility of the system. Building an elderly care system requires robust decision making, promptness, privacy, hassle-free operability, and bearable cost. The authors propose an activity vigilance system for elderly that maintains a balance of each of the mentioned attributes and provides a cost-effective real-time tracking with intimations.
The basic operation of the system can be understood using Fig. 1. The system requires a door sensor fixed to the bathroom door, which sense the opening and closing events of the door. Each door event—opening or closing, is sent to an Android device paired with the door sensor sharing the same wifi network. This system is implemented using Arduino microcontroller chipset and an on/off switch. An old mobile phone with Android Jelly Bean 4.3.1 is used as an android device to receive the data sent by the Arduino device. Once the data is received, it is preprocessed and processed into useful information to send the emergency alerts to many subscribers through various modes of communications.
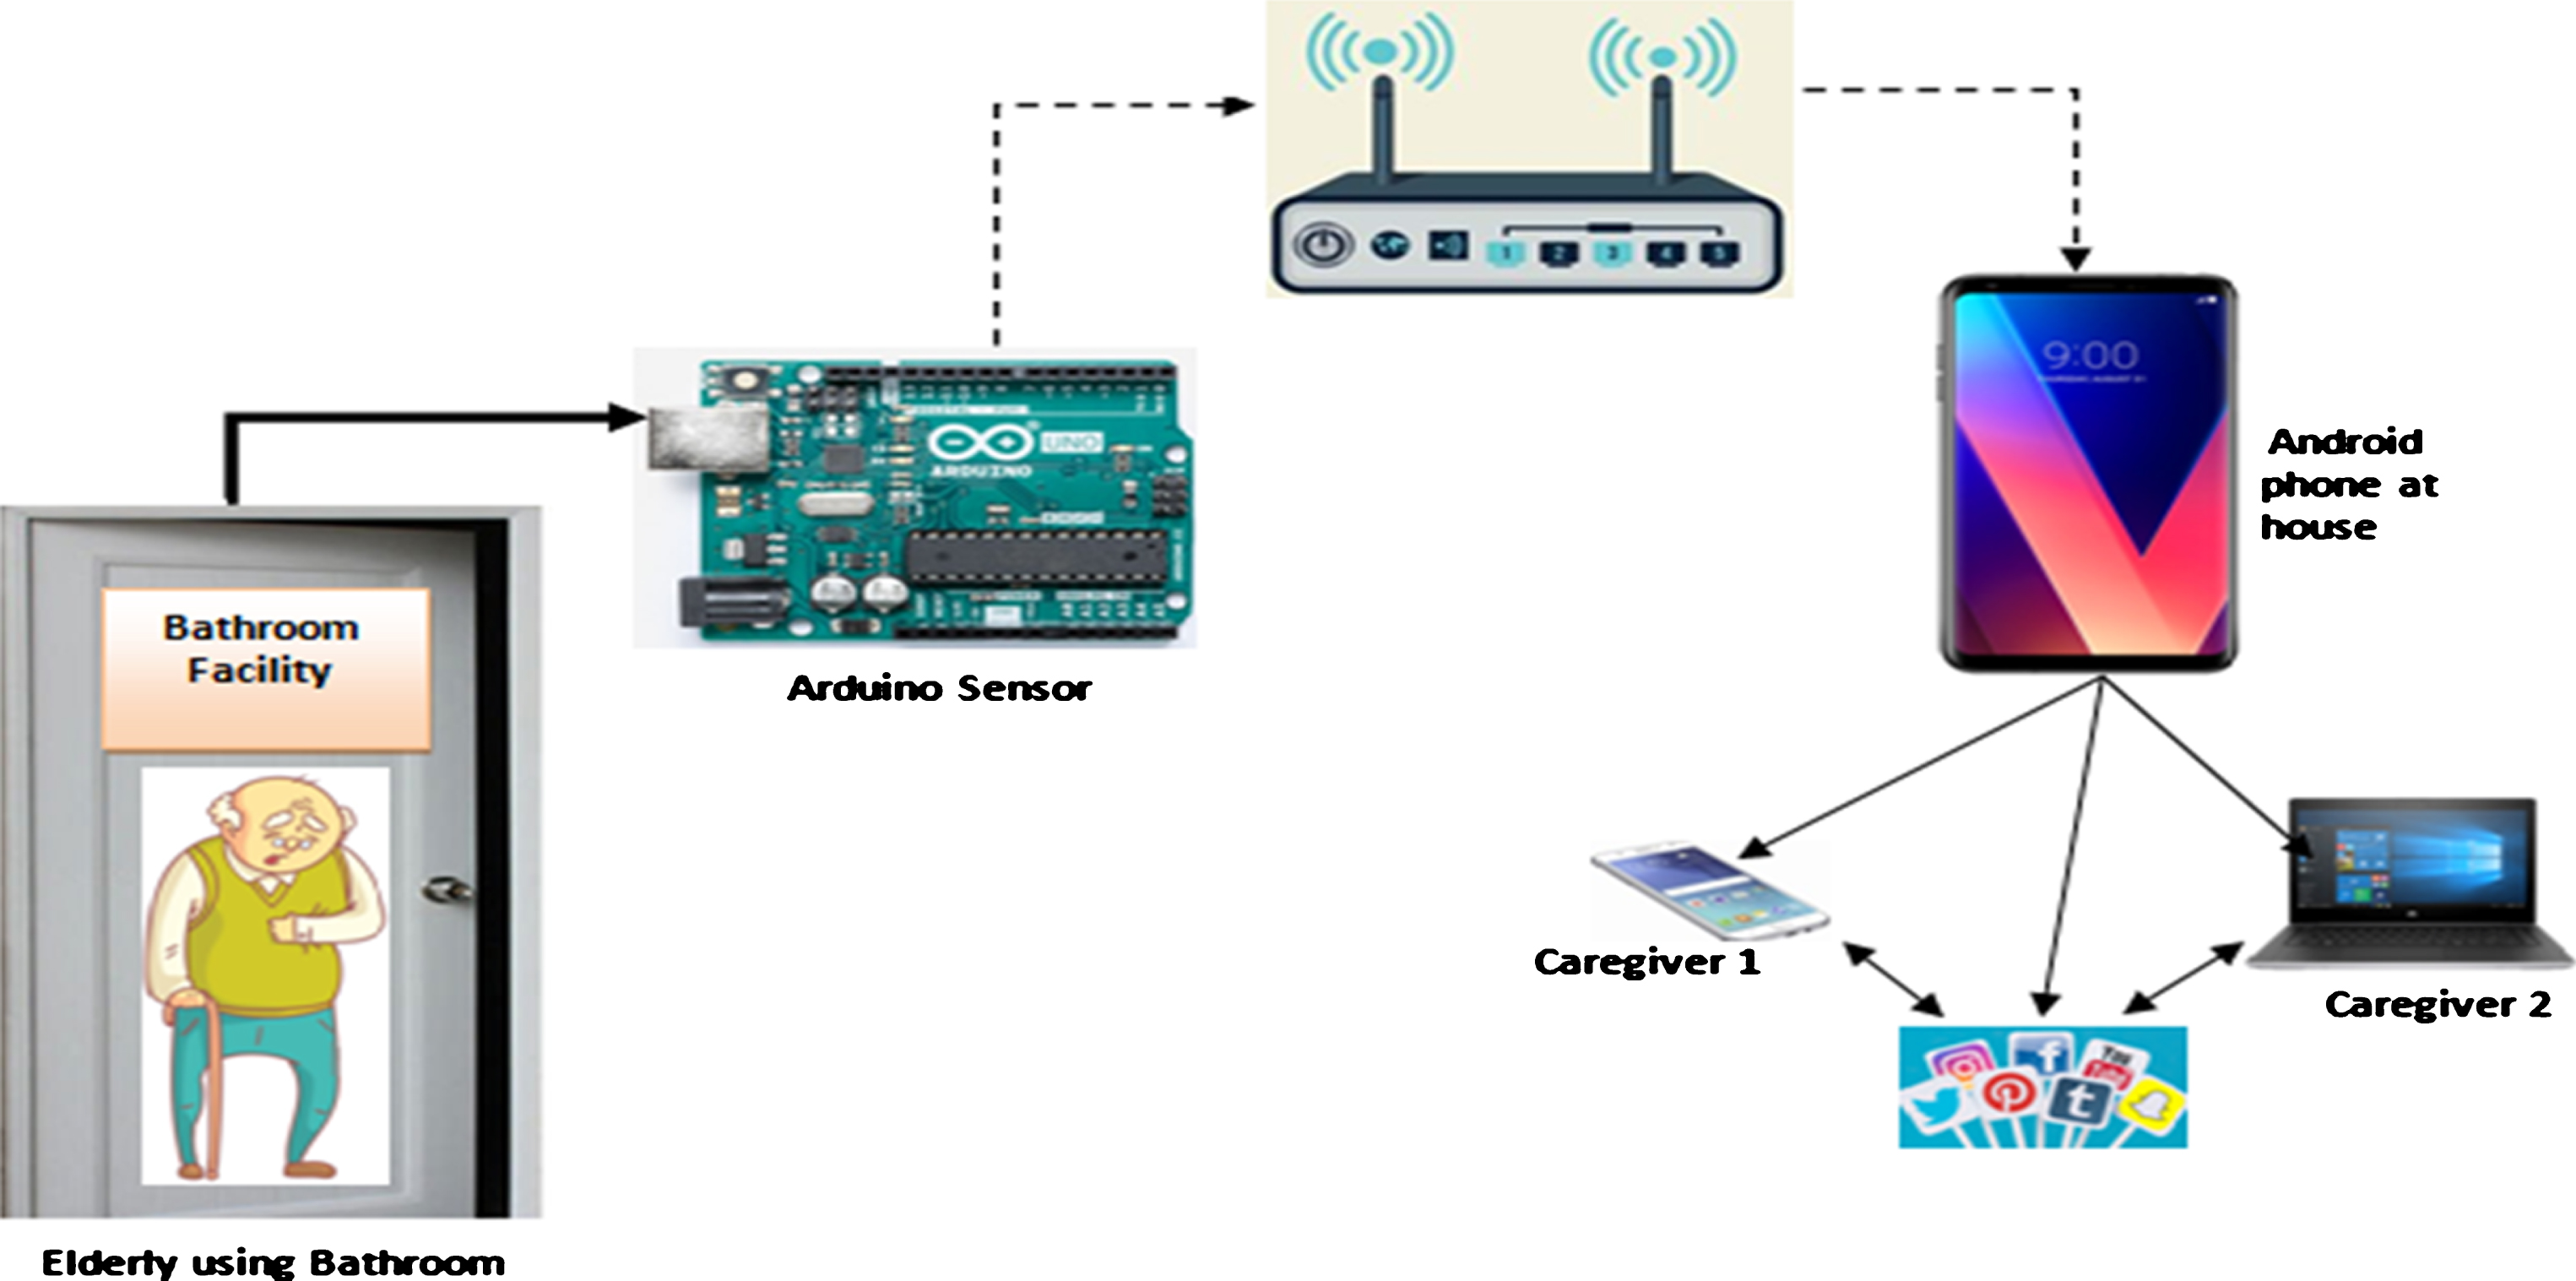
Overall system.
The proposed architecture described through Fig. 2 assumes that the bathroom is engaged when the first {Door_Open, Door_Shut} event occurs. Similarly, when the second {Door_Open, Door_Shut} event occurs, the bathroom is supposed to be vacated.
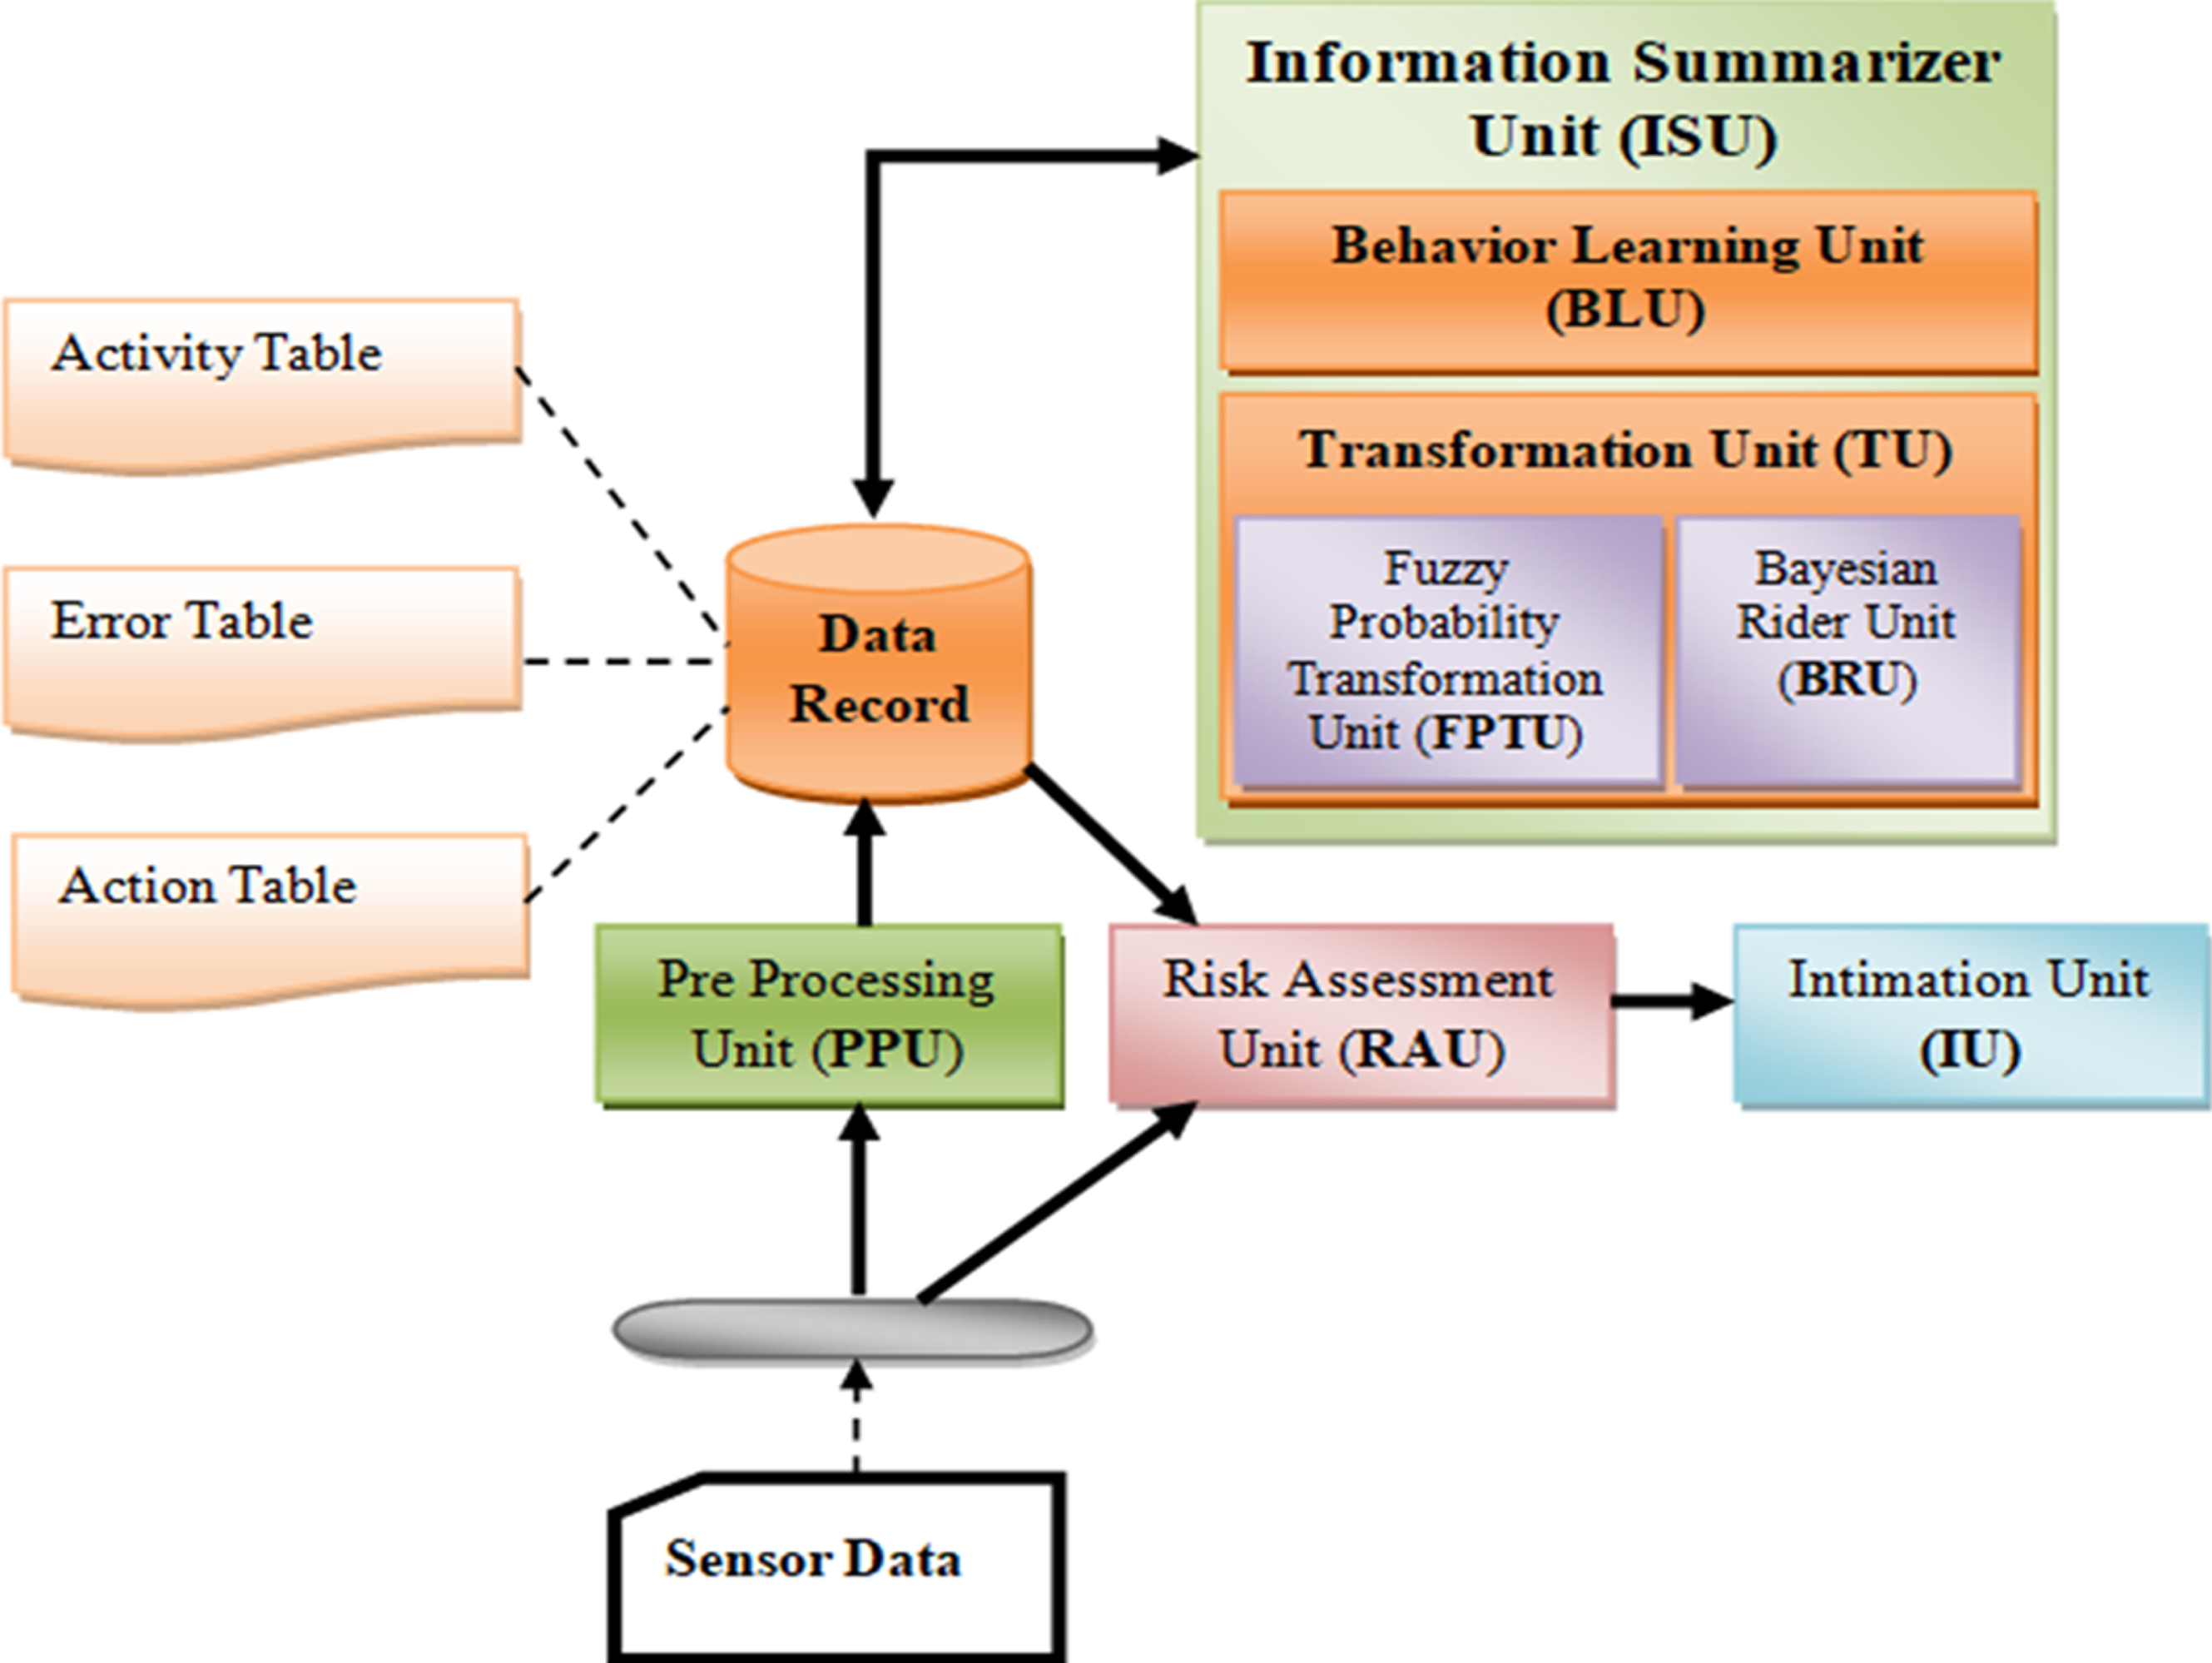
Proposed architecture for health vigilance system.
Risk Assessment Unit (RAU) serves two purposes: it absorbs the data from the sensor and assesses the possibility of casualty when the bathroom is engaged; and, it also commands the intimation unit (IU) to send alerts to the subscribers. Like RAU, Pre-Processing Unit (PPU) also handles two tasks: restricting noisy events from getting recorded; and, formats the data and store it in the activity table (Table 2).
Summary of the bathroom facility usage by the subject for 100 days
This is an essential part of the proposed methodology that sets a data environment for further information extraction and interpretation. A careful look into the Table 2 reveals that on 06-02-2018, an elderly used the bathroom 10 times starting as early as 4:07 AM in the morning for about 121 seconds and finally for 168 seconds in the night at about 23:10 PM. In the meantime, the elderly subject has availed the bathroom facility for eight more times. Based on the above knowledge, an intermediary table is prepared and shown as Table 3.
Facility usage pattern for 06-02-2018
Facility usage pattern for 06-02-2018
A buffer is used by the PPU to discard noise. The buffer stores the first {Door_Open, Door_Shut} event and waits for the complimentary {Door_Open, Door_Shut} event for a premeditated time. If the second {Door_Open, Door_Shut} event doesn’t occur in the time limit, the event doesn’t qualify to be recorded. Otherwise, the buffer releases the events for further processing. Note that the noise doesn’t only mean erroneous behavior; it may also reflect the unfortunate incident the proposed system is intended to deal with. Suppose an elderly goes inside the bathroom, and hence the first {Door_Open, Door_Shut} event occurs. Now, due to slippery conditions inside the bathroom, an elderly slips and falls and becomes unconscious.
Undoubtedly the complimentary {Door_Open, Door_Shut} event can’t occur in an expected time limit and is a typical case to send casualty alarms by Intimation Unit (IU) to the caretakers. Since the said event is a rare one and doesn’t reflect a regular pattern to record into the system, the system considers this as a noise too. Such events instead are recorded in an error table for further analysis and reporting purposes. The task of Information Summarizer Unit (ISU) is to extract useful information from the activity table and populate the subject action table (Table 5). The IS unit is made-up of two subunits, viz. Behavior Learning Unit (BLU), and Transformation Unit (TU). TU itself comprised of Fuzzy Probability Transformation (FPT) unit and Bayesian Rider Unit (BRU). The working of BLU, FPTU, and BRU are explained in sections 4.1, 4.2.1, and 4.2.2 respectively. It is observed that IS takes at least ten days of data from the activity table to provide some meaningful interpretations; however, the accuracy of results improves only with time.
Subject action table comprises five attributes, however, while the activity table contains timestamps value for door_open and door_shut events only. The significance and derivation of different attributes of the subject action table is explained in section 4. RAU uses the subject action table to assess the risk of bathroom casualty. The circadian rhythms of a person predominantly govern bathroom usage pattern. However, errors and irregularities in the pattern due to various factors disturb this pattern. To address this issue, a fuzzy number approach [37] to represent various times, at which the subject uses the facility, is used.
Table 2 represents the activity table populated by the PPU. The opening of the bathroom door is denoted by Door_Open event and closing by Door_Shut. The events captured by the Arduino are sent to the android device, where PPU takes care of recording formatted information as shown in the activity table. Note that each row of the table shows two Door_Open and two Door_Shut events which together define one complete cycle of usage pattern. In a hundred days of observation, we usually observe 8 to 11 cycles in a day. However, sometimes we also observe as low as 4 cycles which were the days when the subject visited his relatives in the same city.
A closure look at Table 3 helps to derive certain postulates P1, P2, etc.
P1: Subject uses the facility 10 times a day.
P2: Subject uses the facility with a mean of 3476/10≈350 s.
P3: Subject uses the facility for performing two major types of activities with their respective means and standard deviations in seconds.
The proposed method adjusts these postulates overtime to derive meaningful conclusions [38]. The proposed system provides first alert after ten days. This essentially means that prior learning of at least ten days is essential to avoid so many false alarms. Once the activity table gets populated for the first ten days, the subject action table (Table 5) can be populated by the system.
The proposed method takes into use the bathroom trigger times and time duration values of the past hundred days at the most to take decisions about bathroom casualty alarms. Hundred days is just a predefined value that may be adjusted accordingly for different subjects. A representative trigger time for the hundred bathroom trigger times for one cycle can be computed as “median value of longest pattern with minimum time consumed after arranging the above times in ascending order.” Note that the longest pattern cannot be more than 900 sec (or 15 minutes). We demonstrate the methodology for computing representative trigger time for the first cycle using first seven days data: 04:07:11, 04:00:30, 03:54:14, 04:10:10, 04:08:22, 03:50:59, and 04:04:42. Table 4 shows the deviations observed in cycle 1 of the first seven days, patterns and the sum of corresponding time deviations. ABCD, for example, takes the smallest sum of deviations value, but BCDEF and CDEFG are both having the length of five-time slots with a sum of deviations well under the upper cap of 900 seconds. Since pattern CDEFG takes lesser time than BCDEF, therefore, it qualifies. Thus, the representative facility trigger time value for the first cycle will be 04:07:11, the value of code E. Thus, representative values for different cycles are computed and inserted/updated in subject action table (Table 5).
Facility usage time calculation
Facility usage time calculation
Subject action table
Estimated Occupancy Time (EOT) is the time duration for which the bathroom is expected to be engaged by the elderly. This, of course, depends upon the type of activity being performed inside the facility. To discover the types of activities an elderly perform inside the bathroom; our system performs k-means clustering on the past hundred days data. In our case, clustering results in two significant clusters: one with a mean (μ) of 99 s and standard deviation (σ) of 33 s; and, the other with μ = 1240s and σ = 860s. As a result of this cluster analysis, one can deduce that two kinds of activities are being performed inside the bathroom by the subject. Let’s name the activities as type ‘0’ and type ‘1’, for convenience. Other clusters owing to the small means and number of elements are considered as outliers and, therefore, are discarded.
RAU uses subject action table to assess the risk and command IU to inform caretakers. After RAU records a Door_Open event, it waits for a time equal to the Occupancy Time Limit (OTL) which is the sum of EOT (μ) and 2.5 standard deviations (σ) of activity type distribution. Occupancy time limit is the maximum time the subject can be assumed safe inside the facility. Beyond OTL, OTL = EOT+2.5 σ, the subject may be assumed to be in need of urgent assistance or medical aid. For example, if the subject occupied the facility at 6:20 AM in the morning and does not vacate the facility in OTL of 181 seconds, RAU will command IU to send casualty alarms.
Assuming representative times for each cycle as the vertex and thirty minutes long timeline as the base, appropriate fuzzy numbers can be created for the representative values in the subject action table. For each time interval represented by the base of a fuzzy number, the count of type ‘0’ and type ‘1’ activities can be determined which forms the basis of the transformation unit. Note that the subject action table comprises of n number of cycles, where n is the mode of the cycles per day for the period considered.
Associating an activity type to a representative time value is a classification problem which can be handled by using a simple probability-based classification. However, to counter the instances of ambiguity, the proposed system uses a novel approach of fuzzy probability transformation. Since the system is using probabilities to associate an activity type to a representative time value, competitive probabilities may pose a problem. To handle this situation of competitive probabilities, the system also utilizes the concept of Bayesian reasoning. This section covers a detailed description of the different steps involved in assigning an activity type to a representative time.
Fuzzy probability transformation
We define Fuzzy Probability Transformation (FPT) as: “An approach to filter probabilities of little interest by assigning an appropriate fuzzy number to a representative value.” Mathematically FPT can be defined as a transformation function
We present here a set of three different cases to demonstrate the working of FPT, but before that we define different fuzzy numbers along the 24-hour format timeline as shown in Fig. 3. Figure 3 represents five fuzzy numbers from F1 to F5 along a timeline. F1 is a fuzzy number that ranges from 3:52:11 to 4:22:11 with 04:07:11 as its vertex. In the same way, other fuzzy numbers can also be defined.
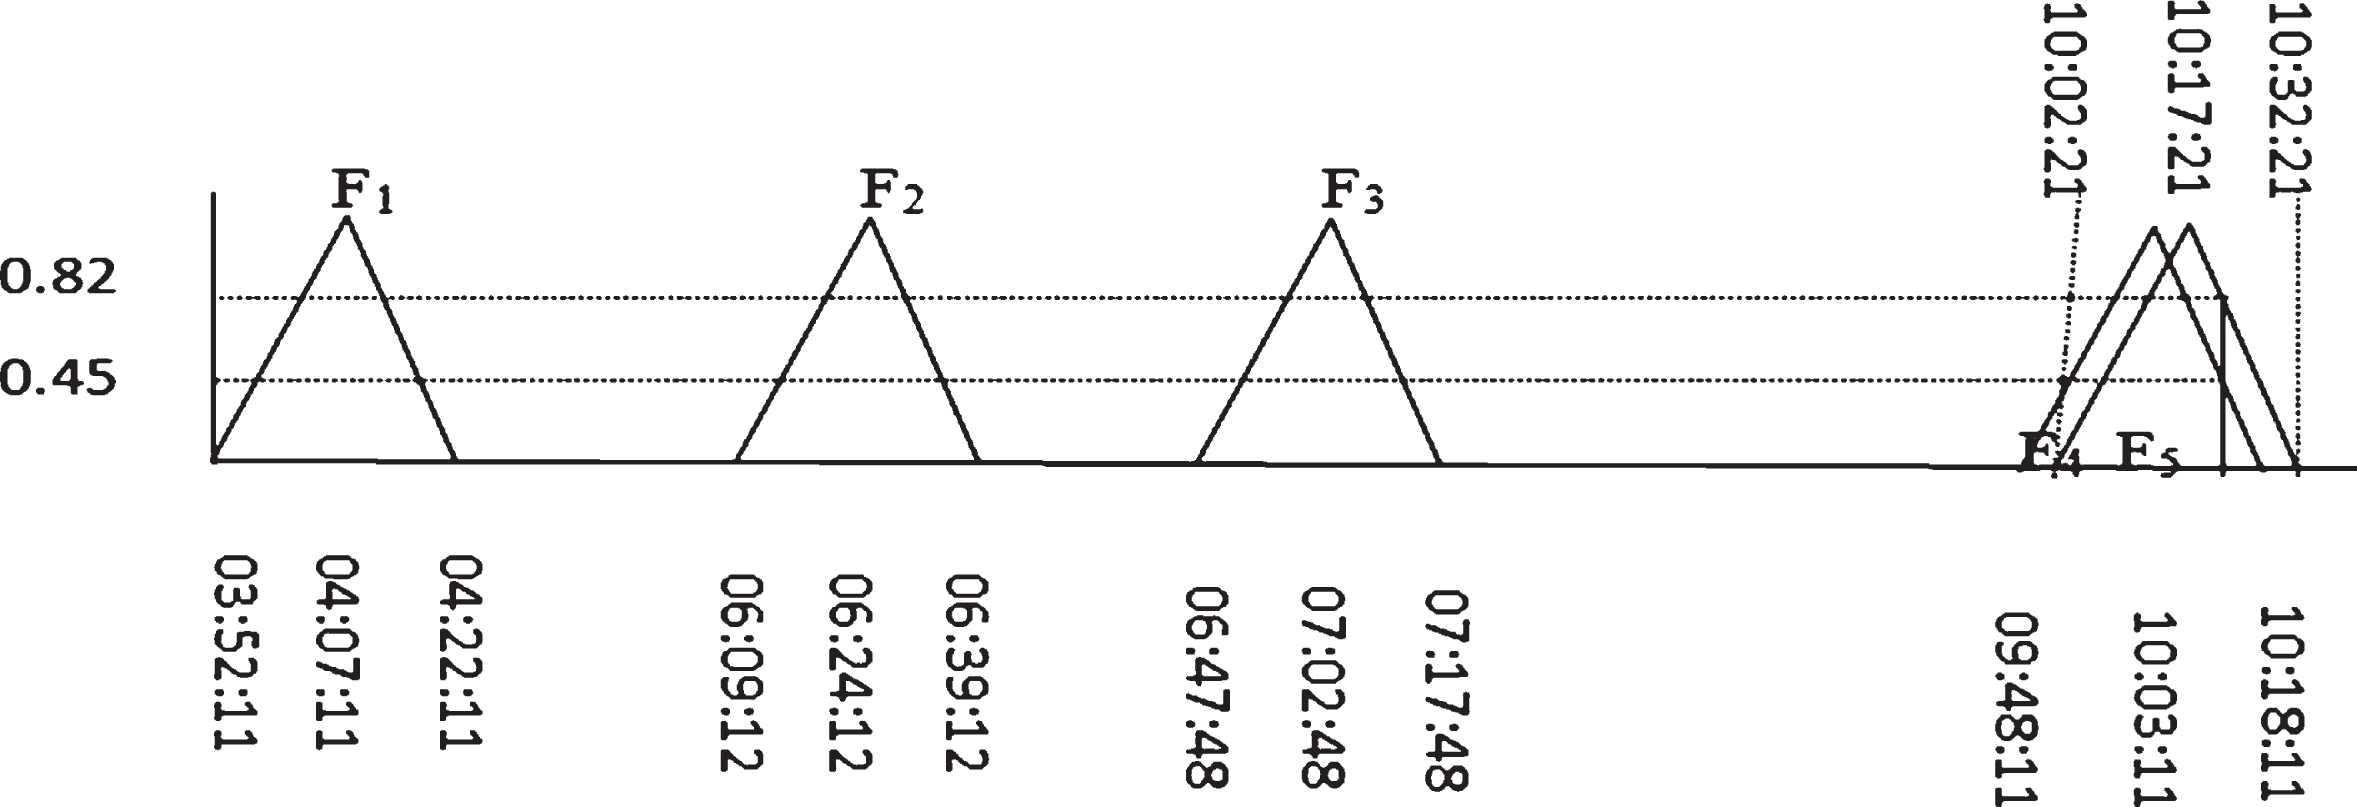
A fuzzy-based system to resolve activity type conflict.
Once a fuzzy number
Experimental results
For experimentation purpose, we installed this system in a house occupied by a male person, over 65 years of age, living alone, and having a bathroom. We continually monitored the performance of our system after 10, 25, 50, 75 and 100 days. The performance metrics used and the results for the first interval of 10 days are tabulated in Table 6. The system performance for all five intervals was compared, and it is observed that learning improves with time. Section 5.1 briefly explains the terminologies used in contingency table [39].
Contingency table showing performance measures after 10 days interval
Contingency table showing performance measures after 10 days interval
confusion matrix: Specific table layout that visualizes the performance of a classifier algorithm.
condition 0 (C0): number of type ‘0’ cases in the data.
condition 1 (C1): number of type ‘1’ cases in the data.
true 0 (T0): number of activities that are correctly predicted as type ‘0’.
true 1 (T1): number of activities that are correctly predicted as type ‘1’.
accuracy: fraction of correct predictions to the overall predictions=
false 0 (F0): number of activities that are incorrectly predicted as 0.
false 1 (F1): number of activities that are incorrectly predicted as 1.
precision: fraction of relevant instances among the retrieved instances=
sensitivity: fraction of relevant instances retrieved among the total relevant instances
Performance matrices at intervals
After ten days, the PPU was turned off, and the performance of RAU was observed for the next five days. We observed that: In the next five days, type ‘1’ activity was performed 12 times, type ‘0’ 36 times. For a total of 19 times, type ‘0’ activity was falsely predicted as type ‘1’. For a total of 8 times, type ‘1’ activity was falsely predicted as type ‘0’.
Performance results for the remaining intervals are shown in Table 7.
Performance results for different intervals
Performance results for different intervals
After a period of first ten days learning, our system correctly predicts ‘0’ activities for a total of 17 times, and it incorrectly predicts ‘0’ activities as ‘1’ 19 times. Similarly, the system predicts type ‘1’ activity as type ‘1’ 4 times and incorrectly predicts type ‘1’ activities as type ‘0’ 8 times. Thus, an accuracy of 44% is reached for the first ten days interval. Similarly, precision and sensitivity for type ‘1’ activity are inferior to type ‘0’ activity.
The low precision of the order of 0.17 for type ‘1’ activity reveals that the system is not learned enough that it largely predicts type ‘0’ activities as type ‘1’. Disagreement between prediction and observation is also apparent from a negative MCC value. Results for all the five intervals are summarized in Table 7. From Table 7, it is clear that the precision and sensitivity of type ‘0’ and type ‘1’ activity improves with time. However, the precision of type ‘1’ activity appears to be at the lower side, while sensitivity looks relatively high. The reason behind this is that the system predicts type ‘0’ activities as type ‘1’. This is where a trade-off is required between sensitivity and precision. In our system, since the age of the elderly is about 65 years and he is clinically healthy; therefore, we can trade a little risk for the convenience of avoiding false alarms. So, the proposed system turns out to be a fit model under the environmental setup we are working in.
Also by looking at the curves of sensitivity and precision, we can deduce that the growth of precision and sensitivity for the two activities is almost similar. Table 7 shows that the improvement in the accuracy of the system increases with time from 44% to a reasonable accuracy of 74%. The developed model is found to be much superior to a random prediction system owing to the MCC value of 0.4.
Alternative analyses
The problem of triggering a help alarm at the right time for an incapacitated elderly inside the bathroom facility is essentially a classification problem. All that we need to do is correctly classify the activity type as type ‘0’ or type ‘1’ that the subject is expectedly performing inside the facility. Type ‘0’ activity takes considerably lesser time to complete than type ‘1’. Therefore, the type ‘0’ activity if falsely predicted as type ‘1’ would mean larger EOT and hence larger OTL value which will result in triggering the alarm at a later time than it should. Similarly, type ‘1’ activity if falsely predicted as type ‘0’ activity would result in unnecessary annoyance to the caretaker and disbelief on the system alarms.
Since the only feature, our prediction is based on is the time-stamp value when the subject enters inside the bathroom; therefore, it can be said that our hypothesis, hθ (x), is some function of trigger time ‘x’, where ‘θ’ is a vector of parameters. We say, if hθ (x)≥0.5, then the activity type is “1” else it is “0”, where 0 ≤ hθ (x)≤1. When hθ (x) is implemented by a sigmoid function g(z), such that g (z) =1/[- 2.5pt (1 + e -) - 2.5pt] z , and z = θ∧ (T)x, where θ∧ (T) is the transpose of the vector of parameters θ, this type of classification method is called logistic regression [40]. For our facility usage data, we perform the logistic regression with a cosine function as decision boundary on the same intervals of 10, 25, 50, and 75 and 100 days as we did for the proposed method. We used the developed model for reproducing the classes for the same set of the first ten days of data, and the results are shown in Fig. 5. Observe that some type ‘1’ (green) activities are predicted as type ‘0’ (red) and some red activities are predicted as green. We obtained an accuracy of 58% after over fitting considerations. We then utilized this model for predicting the next five days activities and obtained an accuracy of 48% as shown in confusion matrix Table 8. We also observe that the logistic regression approach does not learn well with time and ceases to improve on accuracy beyond 61% after the third learninginterval.
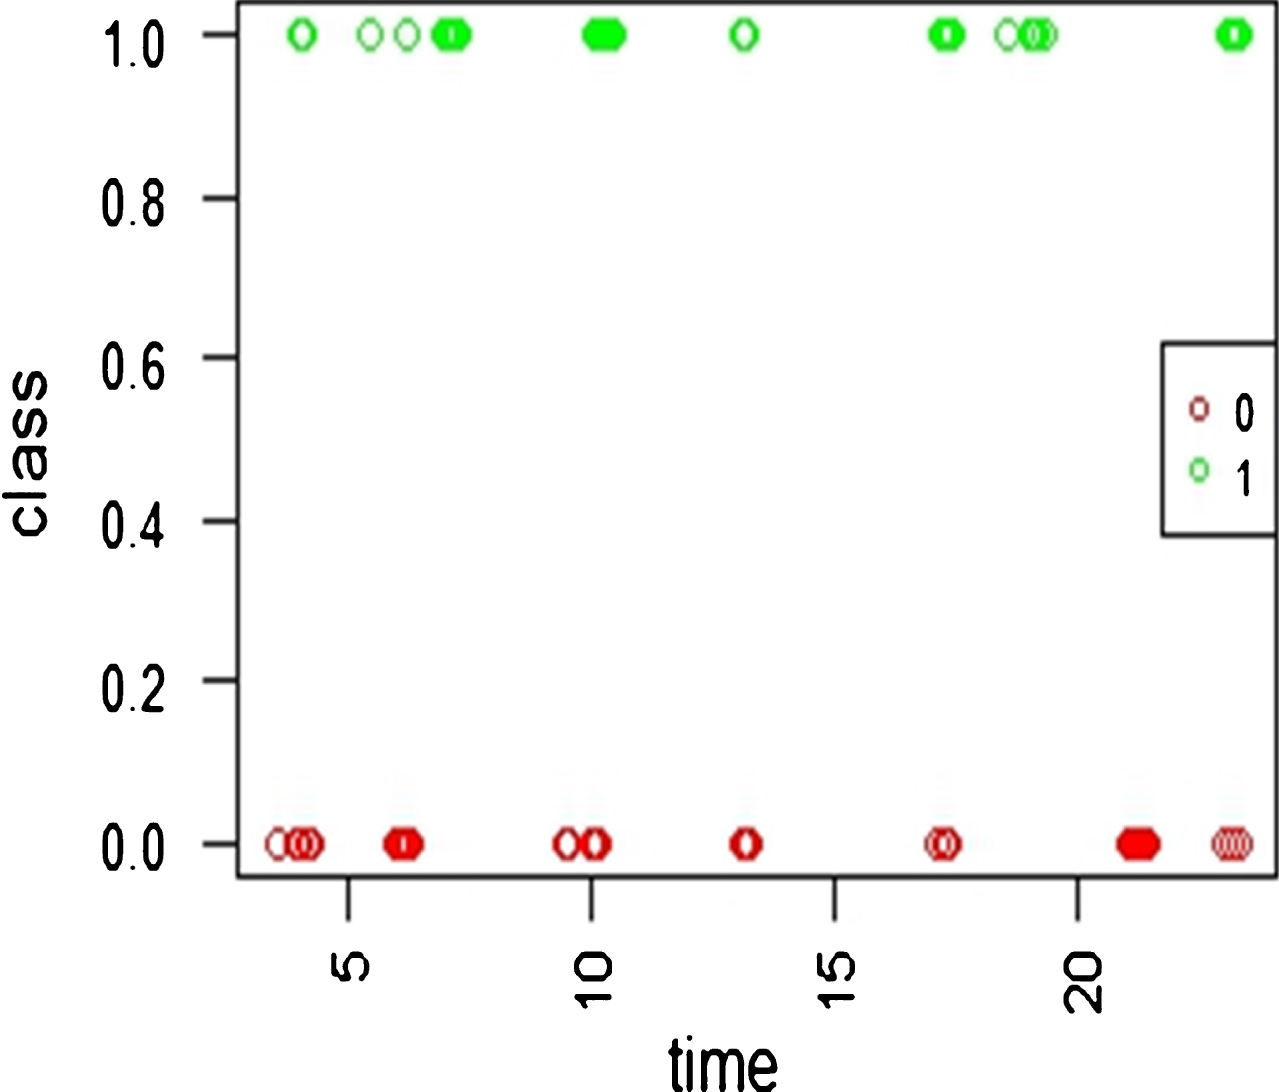
Distribution of activities inside the Bathroom facility for the first ten days.
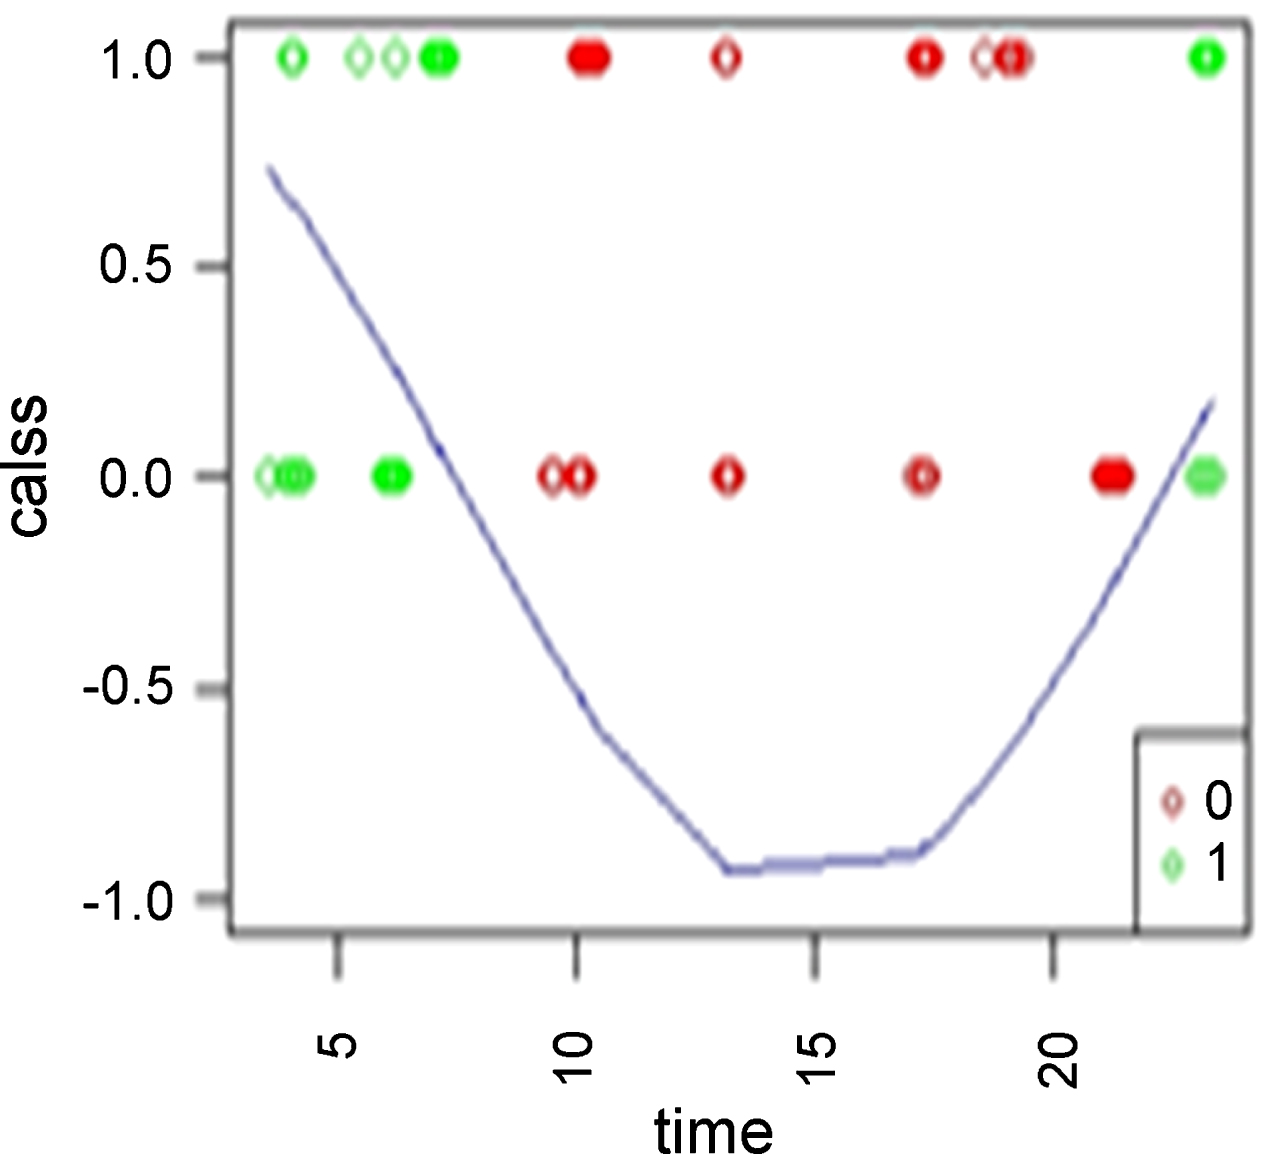
Logistic regression with cosine decision Boundary.
Confusion matrix obtained after applying Logistic Regression for the first interval
Another possible alternative to predict the activity types of the subject inside the bathroom facility is doing a time-series analysis. Unlike the logistic regression method, where we observed the classes (‘0’ & ‘1’) for learning purpose, here in the time-series analysis we use the time duration values for the facility usage as shown in Table 3. Note that Table 3 shows only ten such values; however, the time-series analysis was performed over the intervals of 10, 25, 50, 75 and 100 days. For the 10 days interval time-series analysis, the data can be seen as consisting of 10 days of observations with a frequency of 10. An exploratory analysis over the data provides following insights: data possess negligible trend, the presence of seasonality is apparent, autocorrelations are not insignificant (Figs. 6 and 7). Insights mentioned above encouraged us to perform ARIMA forecasting [41]. An ARIMA model can be represented as
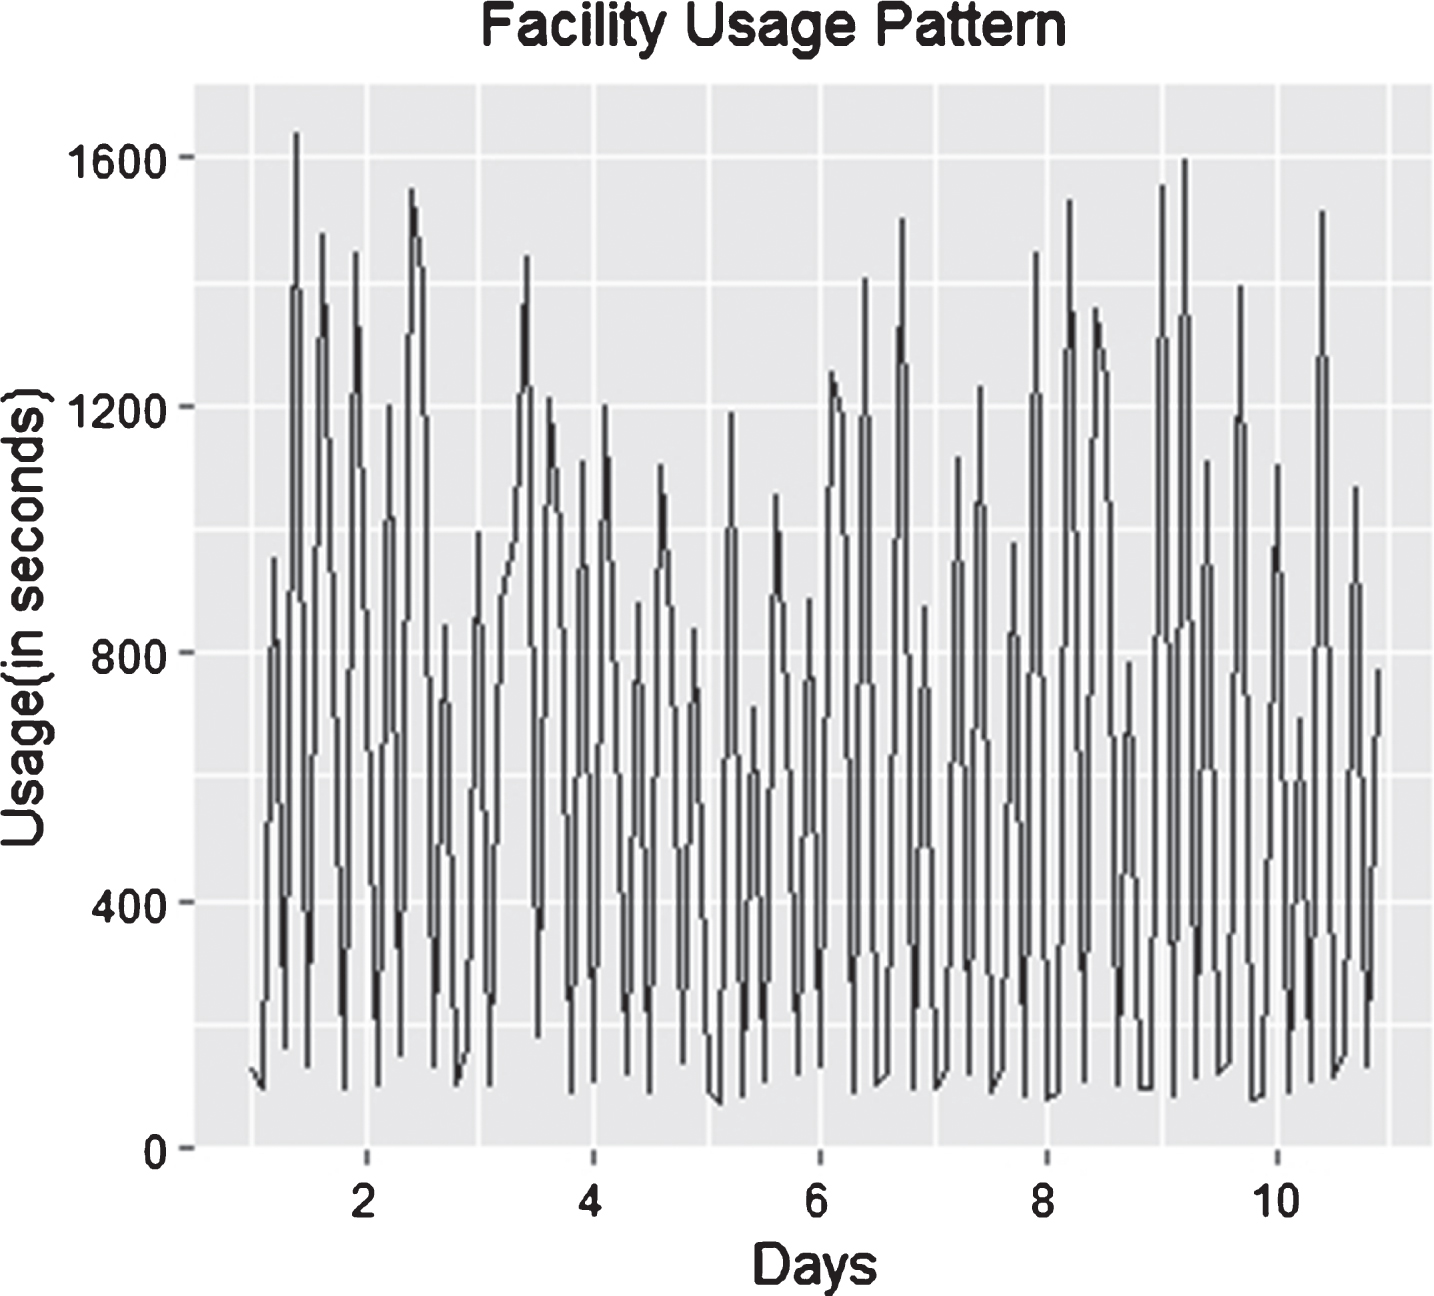
Facility usage time-series for the first ten days.
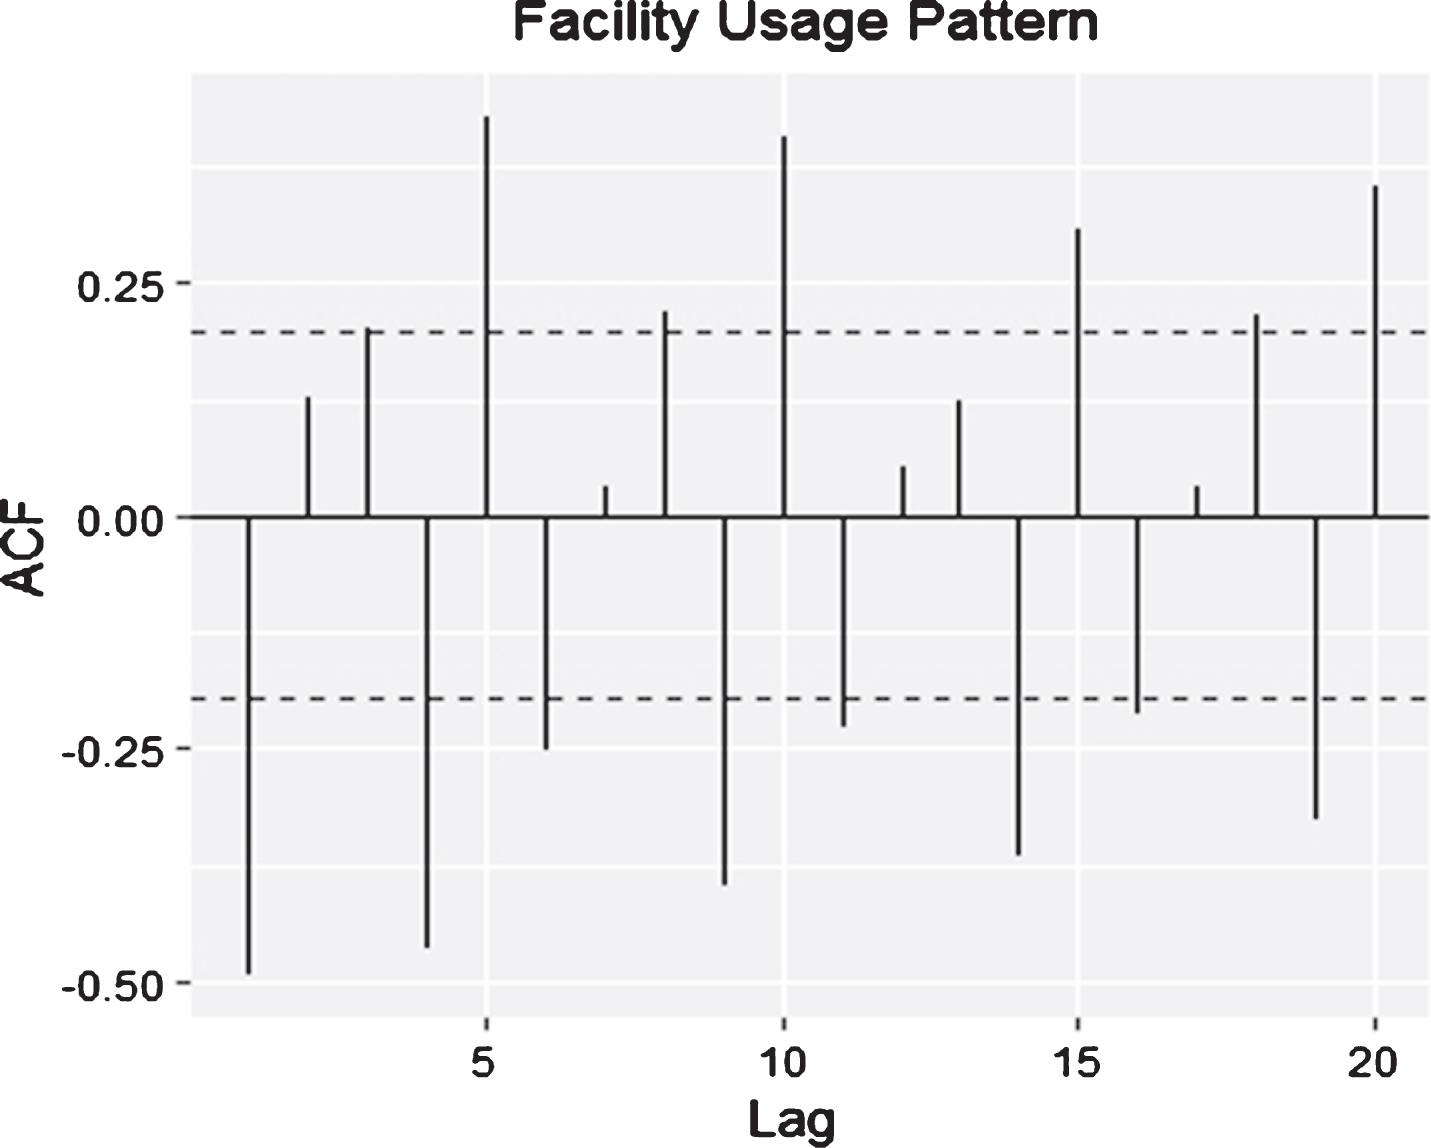
ACF plot for the time-series for the first ten days.
p = order of the autoregressive part;
d = degree of first differencing involved;
q = order of the moving average part.
The idea behind performing forecasting is to decide a threshold over which the predicted values will be classified as type ‘1’ otherwise as type ‘0’. Box plot in Figure 8 for time series data provides useful information about the range of usage time values for each trigger time in a day. The boxes at third, fifth and eighth time places show a minimum facility usage time value of around 600 sec. At the ninth time value, we observe that the range of usage time values is meager. At all other trigger time values, a larger range is observed which shows that both types of activities are being performed for those trigger time values. Note that the small circles in the box plot represent outlier values. Thus, we can safely assume a threshold of 500 sec below which the activities can be classified as type ‘0’ and above as type ‘1’. Now, we can classify the forecasts obtained after applying model (2) on the ten days facility usage pattern to get appropriate activity types.
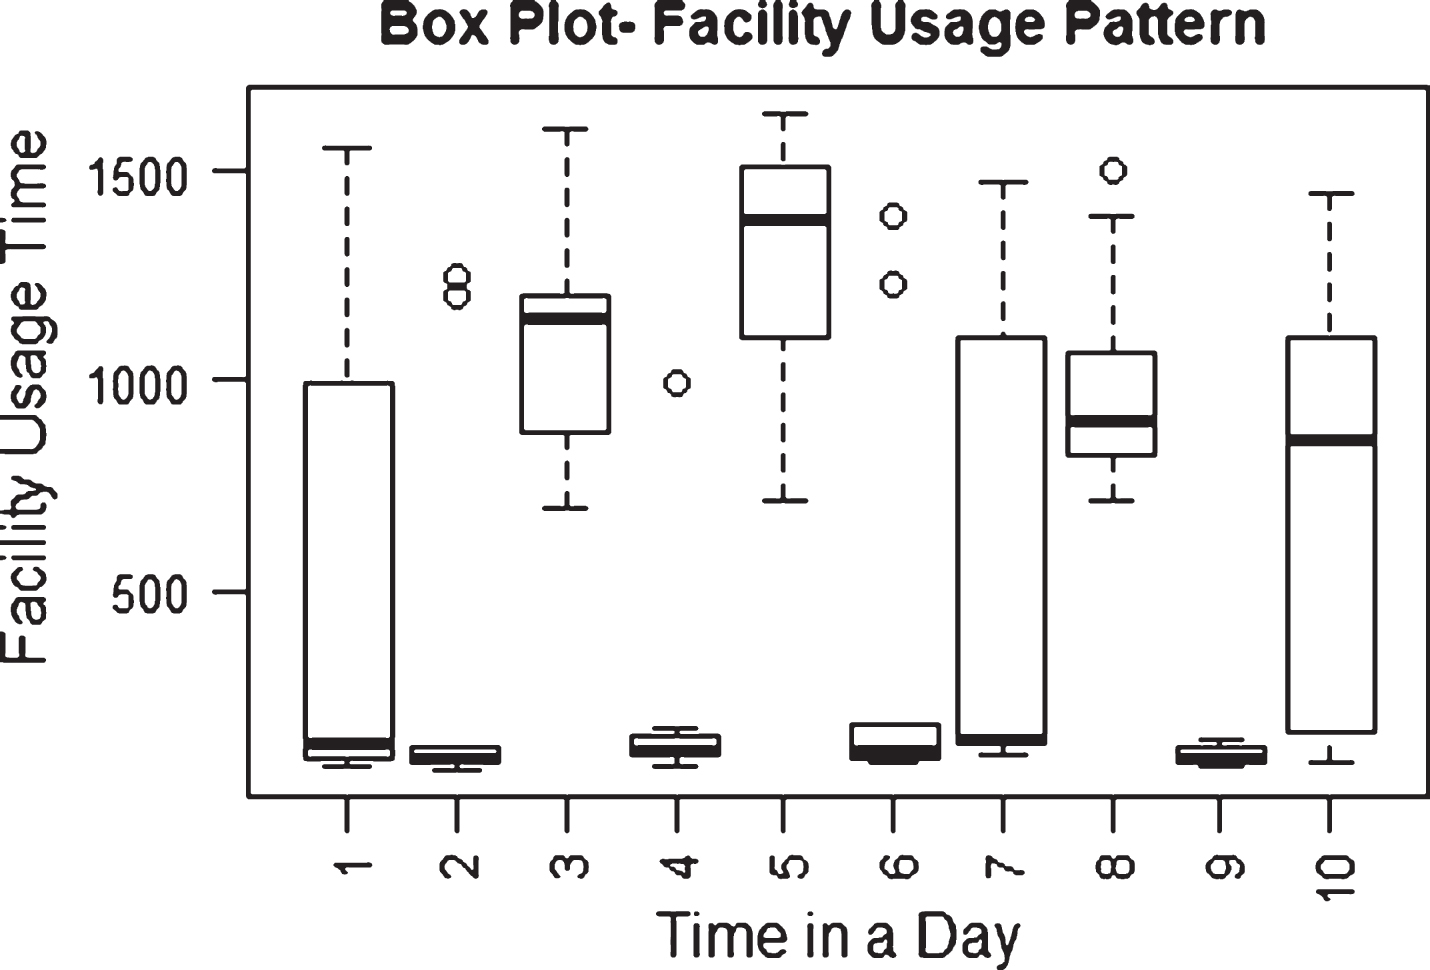
Box plot for the time-series for the first ten days.
After performing ARIMA forecasting for the next five days and then classifying the forecasts into activity types with a value of 500 as the threshold, we obtain an accuracy of 58%, as shown in confusion matrix Table 9. We also observe that the ARIMA forecasting approach does not learn well with time and ceases to improve on accuracy beyond 66% after the third learning interval.
Confusion matrix obtained after applying the ARIMA model for the first interval
This paper discussed a fuzzy probability transformation based activity vigilance system. The system used fuzzy probability transformations to predict the time an elderly subject is expected to take inside the bathroom. If an elderly takes more time than a computed time by the system, emergency alerts will be sent. There are manifolds advantages of the proposed system viz. the system is prompt in alerting caretakers in cases of emergency, the system performs vigilance 24x7 without even get noticed, the system respects the privacy of the subject, and there is no need to wear any gadget to make the system operational.
The system doesn’t take more than 100 days of data to learn. The reason behind not using more than 100 days of data for learning is more physiological than technical. With aging, the health and hence bio-clock of an elderly subject also varies, therefore, taking quarterly or yearly data to judge the current behavior is not justified. Still, the authors acknowledge that the number of days required for learning purpose is a matter of further investigation.
The proposed system is compared with two other learning methods: logistic regression and time-series based classification. The system found to perform superiorly than others on an established metric of accuracy. The system is prone to perform incorrectly for some noisy situations, for example, consider a case when an elderly subject, by being outside, opens and shut the door of the bathroom and then he enters the bathroom. In this case, our system will assume that the subject is outside the bathroom facility while, in reality, he is inside. To deal with such noisy situations is a challenging task to work further.
Footnotes
Acknowledgments
Authors acknowledge the support extended by Prof. Aruna Tiwari (IIT Indore M.P) for her valuable suggestions regarding this work. Authors also acknowledge the support extended by JUET, Guna in providing the online academic resources required for conduction of this research. The authors are grateful to the anonymous referees who provided useful comments on this paper.