
Abstract
SMEs have a very important performance in any current economy because they contribute both to the generation of wealth and to the creation of jobs. In this article we analyze a sample of 12,658 Catalan SMEs and show the level of association that exists between some of their financial ratios to construct a synthetic measure that explains their business size. For the study of financial ratios, we used three data analysis techniques first, and to find the optimal number of clusters, we used the Two-Phase Clusters algorithm. Subsequently, and once the optimal number of groups was known, the most probable business size (cluster) for each company was calculated through a Fuzzy Clustering analysis. Finally, the optimal cluster, estimated for each company, was validated with a Probit model. The results allowed knowing that the size reported by each company is not necessarily equal to the synthetic measure proposed in this article. It is suggested to validate our results with an accounting analysis, other equally robust methodologies or algorithms, such as neural networks.
Introduction
The significance and relevance of this study regarding SMEs lies in the importance they have in the economic development of a country or region [23]. Although it is true that its growth and development has been framed in a particular economic and political context, it is increasingly necessary to implement models that allow this sector to operate in a relevant way, under the conditions that global competences require. In this context, there is no doubt that SMEs generate a large number of jobs to support the national and international economy [4].
Among the advantages of SMEs, the following stand out: they are an important engine for the development of a country; they have great mobility, which allows them to expand or decrease the size of their production plant as well as change their essential technical processes; due to their dynamism they have a high possibility of growth and with the possibility of becoming a large company; they may employ a significant portion of the population. Among its disadvantages, [11] already highlighted the following; they find it difficult to reinvest their profits to improve their equipment and production techniques; they do not have specialized and trained personnel, they do not pay competitive salaries; they have deficiencies in the quality of their production because in many of them quality controls are minimal or simply do not exist; they have problems due to the lack of their organization, such as: insufficient sales, competitive weakness, poor service, poor customer service, products with high prices and of poor quality, excessive fixed assets, poor location, lack of inventory, tax problems, lack of adequate and timely financing, difficulty of access to technology, supplies, market, information, credit and support services [5, 27]. On the other hand, much of the empirical evidence, [10] has shown that small companies located in business concentrations are able to overcome some of the obstacles mentioned above and others due to their financial information, can classified of medium-sized, if your information is analyzed with a Probit probability model [26].
Conceptual framework
The definition of SMEs
One of the main problems in studying the existence of differences in structure both economic and financial between different business sizes is the criterion for classifying companies as medium, small or micro [6]. The problem not only contemplates the variables that must be used, but also the limits or cut-off points for each of those variables 1 . The review of the criteria used to define the size of a company allows us to make the following observations: I) The criteria used are, in all cases, one-dimensional and the two classic approaches used are: 1) the number of employees or, 2) the figures related to total sales. However, the first classic approach has the drawback that by using only one productive factor (labor), without considering the technology of each sector, the size of those companies based on their monetary capital is undervalued and, in turn, the size of the companies whose base is, precisely, the labor force is overestimated. Furthermore, this approach does not consider temporary work or unpaid work (for example, the work of corporate partners).
The second classic approach has the dilemma that, in addition to capturing size, it includes the different degree of efficiency of companies. That is, two companies with the same number of workers and the same volume of assets may belong, as a consequence of their degree of efficiency, to different groups of companies if their sales volume were different; II) There is no general agreement on the limits that must be established for each of these criteria: in some works, SMEs are considered as those companies with less than 100 workers, while in others cases, these companies are considered as those that they have up to 500 workers and; III) The use of different criteria and cut-off points for each of them makes it difficult to compare the results obtained in the multiple works carried out to date [9]. Of course, this problem prevents the application, with any degree of rigor, of existing laws on funding criteria and payment of taxes for different companies according to their size reported by themselves [30].
This lack of agreements also exists in the different definitions of SMEs, which are established by various institutions and public administrations. Without a doubt, this lack of perfectly defined criteria limits all those companies that can and want to have access to different types of subsidies. For this reason, and in order to unify criteria, in [19] is proposed the following: When it is required to distinguish between small and medium-sized companies 2 , a small company is defined as one that; a) It has no more than 50 workers; b) It has a turnover of not more than 7 million euros or a balance sheet of not more than 5 million euros and; c) It complies with the independence criterion, that is, that 25% (or more) of its capital or of its voting rights do not belong to another company or, jointly, to several companies [1].
Uses and precautions of financial ratios
A financial ratio, in very general terms, defines the relationship between two numbers. In the accounting field they are a set of indices that express the result of relating, at least, two accounts in the Balance Sheet or the Statement of Profit and Loss [8]. These financial ratios provide important information that is intended to strengthen the decision-making, generally correct, of some people or analysts who are interested in a particular company [20, 24]. The relative simplicity in the calculation of financial ratios can transform its use into a simple technical application, which can lead to the indifference of what its contribution really is, that is, its interpretation or grouping [31]. A recurring mistake that is made, to facilitate the work of analysts, is to seek previously fixed rules for a faster and more comfortable interpretation, but which, in general, does not achieve the desired objective when making use of financial ratios [7]. This is due to the fact that the realities and needs of the environment of each company are different [17].
On the other hand, the ease of building or creating financial ratios has caused them to become more numerous. This dynamic generates a new problem, which is summarized in the following question: How to select the financial ratios to be used? 3 This question is not easy to answer because it is a complicated task and depends on different factors, among them: the objective of the analysis, the analyst’s perspective, the prevailing economic reality, in which the analyst’s experience will be essential to define a typology or a set of financial ratios that are important for the reality to be analyzed [28].
The objective of this article is to present a level of association between some financial ratios, previously analyzed, to construct a synthetic measure that defines the size of a company. Galindo’s [2] proposal is adopted, where it is shown that business size can be seen as a set of variables, related to each other, that would act as a substitute for this concept. The main result of this work is to present a new approach, through the financial information reported by a significant group of companies, for assigning size to a company. The algorithms used to classify the 12,658 companies analyzed allowed detecting 2 groups (24% of the companies were classified in the first group, while 76% of the companies were classified in the second group) of companies instead of 3. Of this classification, it follows, that some companies should not have the size they report, which suggests complementing the results of this work with an accounting analysis to verify if tax evasion is present in these companies or if the size reported is to obtain better subsidies. The only limitation presented in this article is that the results depend on the financial information used, so if other financial ratios are considered, then the results may not be the same. This article is organized as follows: Section 2 describes the methodology used. In Section 3 the most outstanding results are presented. In Section 4, the main conclusions of the article are presented.
Methodology
The database we use in this article contains 12,658 SMEs in Catalonia, Spain and 22 financial ratios reported by each of these companies (Table 1).
Financial ratios
Financial ratios
We divide the analysis of financial information into two stages: 1) We analyze the financial ratios using the technique called Conglomerates in Two Phases (CTP) to obtain the optimal number of estimated groups and, 2) Since we know the number of groups to estimate, we use the Fuzzy Clustering algorithm to integrate the final clusters. Then, we use the final clusters as the initial variables for a Probit model, which we use in order to know the maximum probability of belonging to the cluster previously calculated by the Fuzzy algorithm, and them, below we describe the algorithms we use for data analysis.
The CTP procedure is a Machine Learning tool that discovers the natural groupings (conglomerates) of a data set that would not otherwise be possible to detect. This technique has the great advantage of comparing the values obtained, by selecting a criterion for the model, and can automatically determine the optimal number of clusters [14, 29]. In this algorithm, the verisimilitude distance measurement assumes that the model variables are independent. Furthermore, it assumes that each independent variable has a normal distribution, but empirical tests indicate that this algorithm is quite robust in the absence of both the assumption of independence and for the distributions of the variables. However, it is important to consider to what extent these assumptions are fulfilled [3]. We use this algorithm only to calculate the optimal number of conglomerates, so we do not analyze their statistical results.
Fuzzy C Means
A cluster generally is a set of elements having a strong mathematical similarity between them and simultaneously weak similarity to other elements [21]. The clustering technique is the detection of subspaces (clusters) in a data space. In traditional clustering algorithms, each element belongs exclusively to a single cluster. The fuzzy clustering algorithm associates a cluster, to each element, using membership functions. [15]. The result for the fuzzy algorithm is a grouping, not an excluding partition. Fuzzy grouping techniques emphasize, in much of the existing literature, the minimization of the distances between the elements belonging to a data sample [13, 16]. The objective function for a family of algorithms with fuzzy grouping is as follows [16]:
Where Z ={ z1, z2, … . . , z
N
} are the data that must be classified and U = [μ
ik
] ∈ M
fc
it is a matrix with blurred partition of Z. In addition,
μ
ik
represents the degree of membership for each element z
k
to the center of the prototype C
i
and where C = [c1, c2, … . , cc] ci ∈ Rnis the vector of centroids to be determined and:
Equation (3) is a norm that is determined by the choice of matrix B (for example, identity makes the norm the Euclidean distance), and m ∈ (1, ∞)is an exponent which determines the “fuzziness” of the resulting classes (the higher m, the more fuzzy the identified sets are). The minimization of the objective function (1) is a nonlinear optimization problem that is solved with the Fuzzy C-Means algorithm. The stationary points of the objective function (1) are found by adding the condition that the sum of the belongings to all the groups, for an element, is equal to 1. The conditions necessary for the objective function (1) to reach its minimum are resolved by Dunn (1974):
Equation (5) provides a value for c i as the weighted mean of the data that belongs to a class and where the weights are the membership functions.
The Probit model measures the relationship between the intensity of a stimulus and the proportion of cases that present a response to this stimulus. This type of model is useful for situations in which a dichotomous response is available, which is thought to be influenced or caused by the levels of some independent variables. Furthermore, this probabilistic model is suitable for experimental data [12]. This type of data analysis allows estimating the intensity necessary for a stimulus to induce a certain proportion of responses [18].
For each value of the independent variable (or for each combination of values with multiple independent variables), the dependent variable must contain the count of the number of cases that the response of interest presents and that takes those values of the variable(s) independent(s) Probit analysis is closely related to logistic regression. In general, Probit analysis is appropriate for experimental designs, while logistic regression is more suitable for observational studies. The Probit model provides the estimates of the effective values for the different response rates, while the logistic regression provides the estimates of the odds ratios for the independent variables [12]. If we consider the probability of y = 1 be p and the probability of y = 0 be (1- p). Then the expected value of y is the probability that the event will occur:
If we now consider this probability as a function of a vector of explanatory variables
The estimator of β under this specification will be inconsistent if the distribution is not normal or if the estimated error is heterocedastic and where,
A Probit model allows us to estimate probabilities, marginal effects, and other ancillary outcomes, as long as an assumption is made in the data: This probabilistic model assumes a normal distribution of random variables (independent variables in the model). Probit analysis is an alternative to the Logit method. Between these probability models there are no significant differences in practice, unless the sample contains numerous observations with extreme values [26].
The 22 financial ratios in Table 1 presented perfect multicollinearity. To eliminate this problem, we opted for a distance analysis with respect to the financial ratio called “size” (tamany). We use the Chebychev distance, standardized by its standard deviation (in absolute value) for each financial ratio. This analysis allowed us to better appreciate this distance and to carry out a selection of the financial ratios. In this way, we classified 19 financial ratios to be considered in this empirical study (Table 2).
Grouping of selected financial ratios
Grouping of selected financial ratios
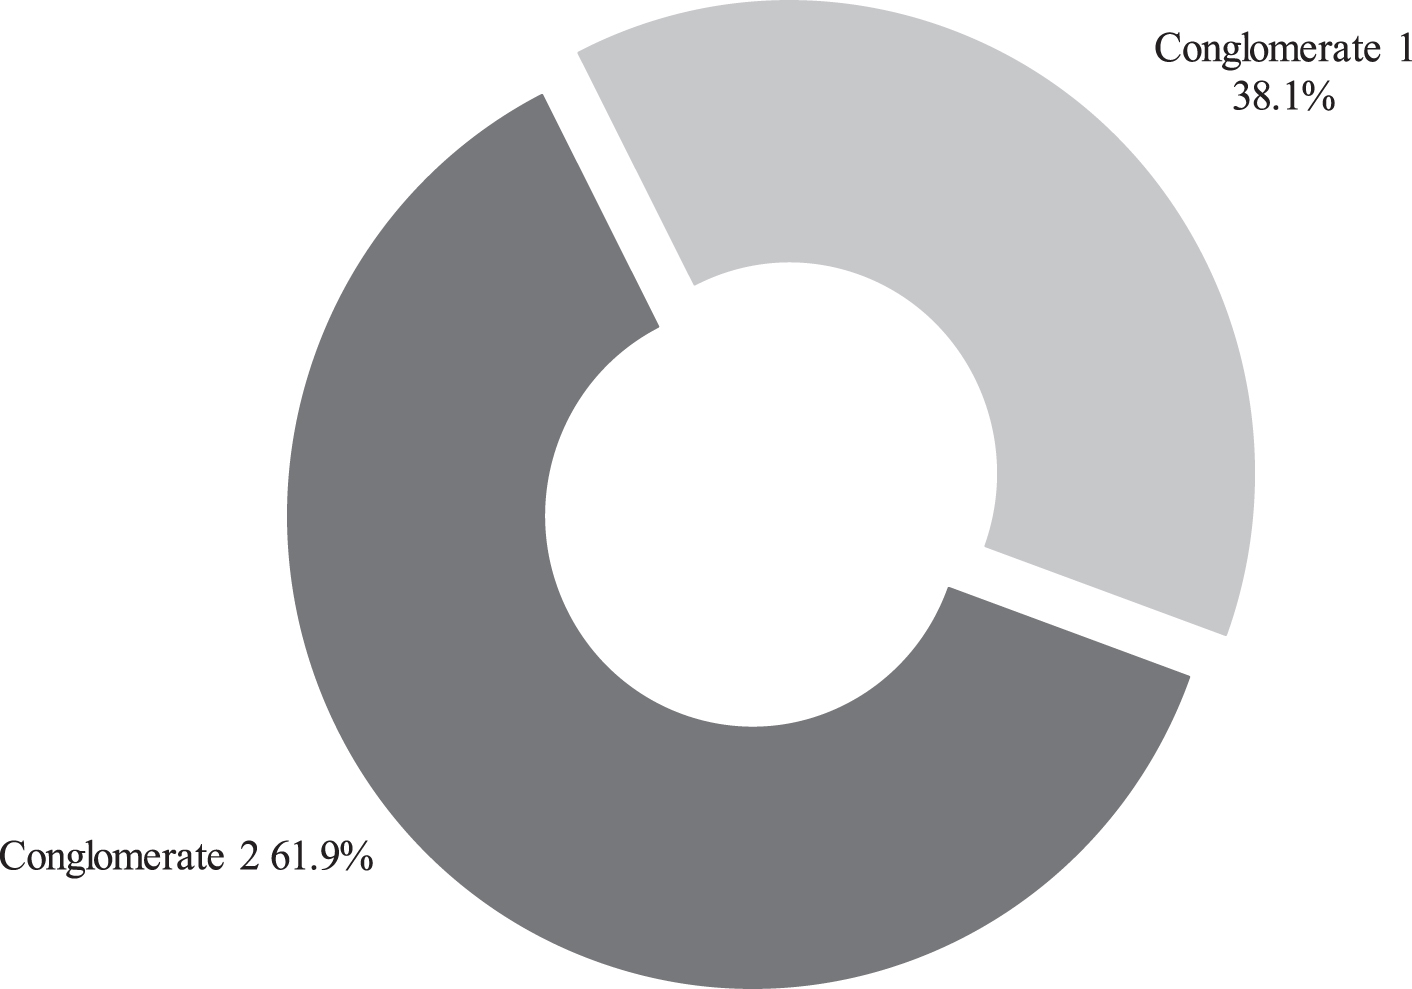
For the financial ratios in Table 2, we obtained that, through a CTP analysis (performed with the SPSS statistical package), the optimal number of resulting conglomerates was two. The distribution of the companies in the two estimated conglomerates is shown in Table 3, while the importance of the attributes is presented in Fig. 1.
Distribution of conglomerates
Importance of attributes.
For all the financial ratios of the two estimated conglomerates we performed a robust test for equality of means. We use the Brown-Forsythe and Welch statistics because they are preferable to the F statistic if equality of variances between the financial ratios is not assumed. The results of these two statistics implied that the means differ statistically in each predicted conglomerate, since the level of significance is less than 5%. These results imply that all the financial ratios in Table 2 are important for our empirical study (Table 4).
Robust tests for equality of means
It is important to mention that if we omit the financial ratio that refers to the “number of workers” and only consider the 19 financial ratios of Table 2, then we obtain for the initial groups 1 and 2, and in most of the financial ratios, statistical differences for both variance and mean. Furthermore, for initial groups 2 and 3 we find statistical evidence for equality of variances, but slight evidence for equality of means. With these results we verify that there is statistical evidence to assume the fact that in reality there must be two large groups of companies and not three. Based on these results, we opted to consider two clusters, as calculated from the beginning by CTP analysis.
(a) Distributed in F asymptotically.
After we obtained the optimal number of conglomerates, we proceeded to calculate the two clusters using the Fuzzy C Means algorithm. To do this, we analyzed the 19 financial ratios in Table 2, without any transformation, using the Fuzme 3.5b statistical package to detect direct relationships between them and achieve a more representative grouping.
We carry out this analysis for the following fuzzy exponents: 1.1, 1.3, 1.5, 1.7 and 2. The membership level for each fuzzy clustering and for each fuzzy exponent is presented in Table 5. Also, the membership error for each Fuzzy clustering is shown in Table 6.
Membership level with different fuzzy exponent
Membership error for each fuzzy exponent
Once we calculate the centroids for each fuzzy exponent, we consider, without loss of generality, the fuzzy exponent equal to 1.7. For this fuzzy exponent, we present in Table 7 their level of membership, with respect to each initial group of companies.
Level of membership
The fuzzy algorithm allows us to observe that a large percentage (76% - 9,621 companies) of all the companies that we consider in this analysis can be classified in cluster 2, that is, as medium-sized companies. On the other hand, we calculate that 90% (6,895 companies) of small companies can be classified as medium-sized companies.
It is important to remember that a Probit model measures the relationship between the intensity of a stimulus and the proportion of cases that present a response to this stimulus. This probabilistic model is useful for situations where a dichotomous response is available and is thought to be influenced (or caused) by levels of some, or some, independent variables and is particularly suitable for experimental data. Furthermore, a Probit analysis allows estimating the intensity necessary for a stimulus to induce a certain proportion of responses. The information for financial ratios using a Probit analysis is shown in Table 8.
Information on the data analysed using a Probit model
(a) Cases rejected due to group values outside the range.
With this type of analysis, we find an optimal response on the convergence of the model from 89 iterations, which allows us to appreciate the consistency of the Probit model. As a result, and because a financial accounting analysis is not the main objective of our empirical study, the estimation of the parameters is presented in Table 9. In the results of Table 9 we can see that 12 financial ratios are Statistically significant at 95% confidence, which suggests a refinement of the model.
Estimation of the parameters using a Probit model
a. Model PROBIT: PROBIT (p) = Intersection + BX. b. Corresponds to the grouping variable size.
The information in Table 9 helped us to know the maximum probability of belonging to each cluster predicted using the Fuzzy C Means algorithm. The results for this section of our analysis are presented in Table 10.
Average probability of membership
Through the Probit model, we found that cluster 2, calculated using the Fuzzy C Means algorithm, presented the highest probability of membership for all the companies analyzed. In other words, cluster 2 seems to absorb most of the companies that showed a change of cluster. However, this cluster change should not be understood as the probability of “attraction” to the cluster, rather the Probit model provides us with the probability that the new cluster (if there was a cluster change) is correct. In Table 11 we show the result for the contrast of the correct specification of the model: we obtained, in this case, a significance level of 1. This last result confirms the validity and correct specification of the Probit model, but also suggests a refinement of the model.
Result for the contrast of Pearson’s goodness of fit
(a) Statistics based on individual cases differ from statistics based on aggregate cases.
In Table 12 we present the distribution of the predicted groups with respect to the initial groups. It is clear that the Probit model confirms the result obtained with the fuzzy algorithm, that is, a large percentage of small companies have financial information to classify them as medium-sized companies. Finally, the final distribution of all the companies analyzed is shown in Fig. 2.
Results of the classification through a Probit model
The results assume a fuzzy exponent of 1.7.
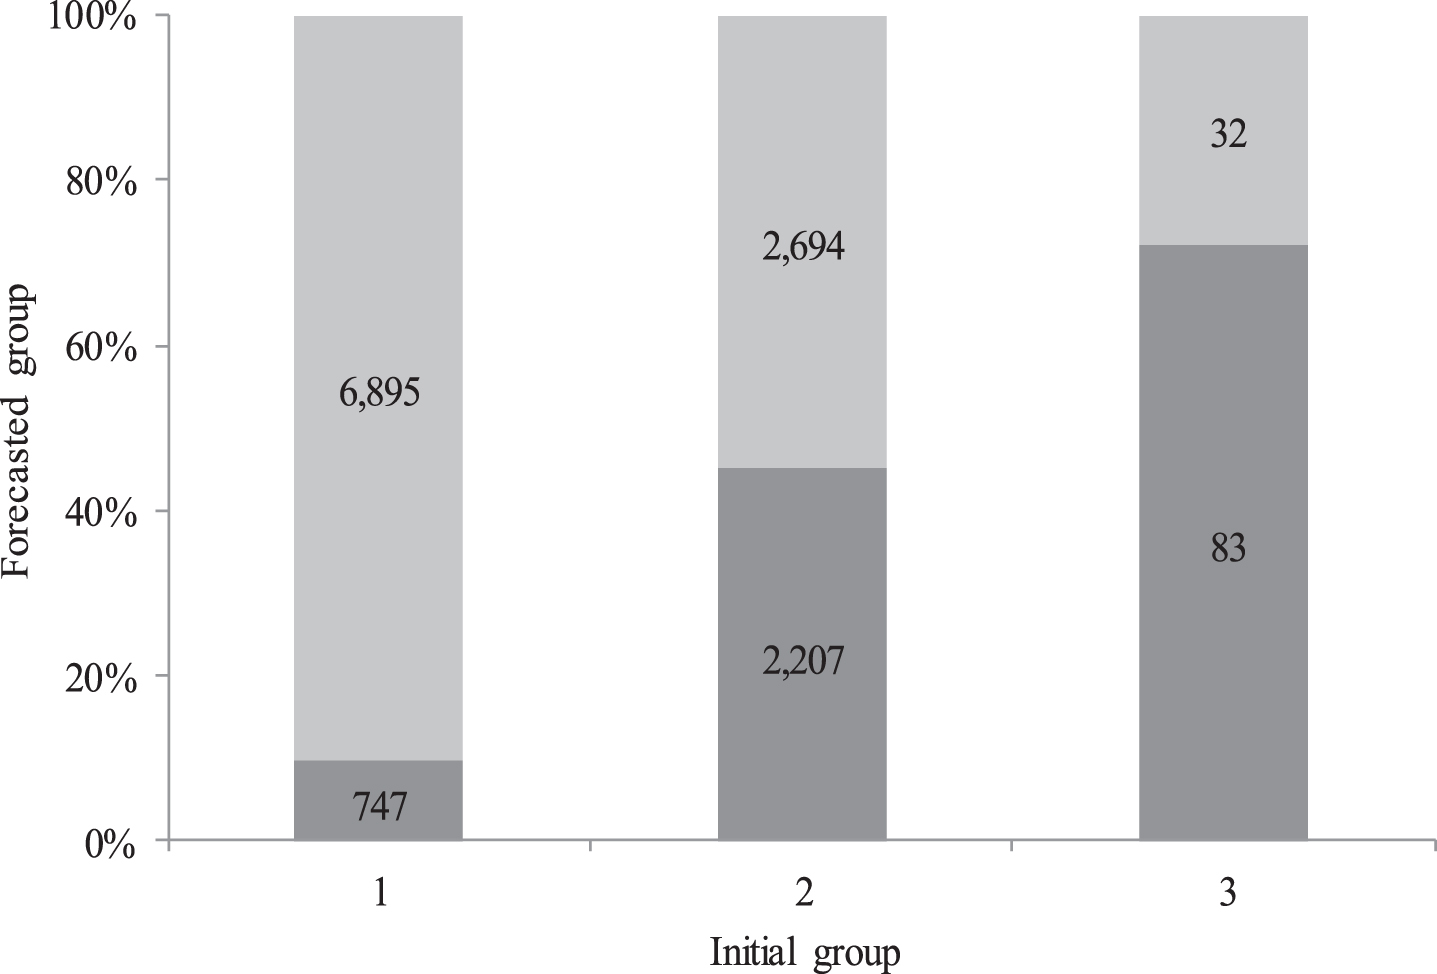
Distribution of predicted groups.
The criteria most used to define the size of a company are quantitative, and specifically, the number of employees and total sales figures. In our article we do not establish quantitative limits for these two criteria, what we do do is propose a novel methodology that discriminates, through its financial information, why a company should belong to the group of small, medium or micro-companies.
In this work we calculate the optimal integration of two clusters using the CTP algorithm. We use this result to form two fuzzy clusters using the Fuzzy C Means technique, where we obtained an average attribute importance of 76.24% for fuzzy cluster 2 and an average attribute importance of 23.76% for fuzzy cluster 1. Also, we found an optimal response, based on 89 iterations, using a Probit analysis to estimate the probability of belonging to each cluster predicted using the Fuzzy C Means algorithm: the group with the highest average probability of success was fuzzy clustering 2. Therefore, we can deduce that there and is statistical evidence for a refinement of the Probit model and involve other statistical analyzes and, with this, emphasize the consistency of the results. However, the results we obtained with this methodology were quite acceptable.
For the 12,658 Catalan SMEs analyzed in this article, and based on 19 selected financial ratios, we present statistical evidence that the initial groups should not be three, but two. In other words, the size reported by each company analyzed is not necessarily equal to the size we calculated using the methodology of this article. These results are confirmed because we found that for companies with a size 3 (medium-sized company), 72% were classified with a size 1 (micro-company); 28% were classified with size 2 (small business) and none were classified with size 3 (medium business). Similarly, we found that 45% of small companies (size 2) have financial information to be classified as micro-companies (size 1). On the other hand, 90% of micro-companies (size 1) have financial information to be classified as small companies (size 2).
Although these results cannot be considered conclusive, we can take them into account as a first study that presents a new methodology to define the size of a significant sample of companies. This result suggests that we carry out an accounting analysis to verify if some companies incur tax evasion (those companies that report a small size but could be a larger size) or if some companies report a larger size, when in reality they do not have it, to opt for better financial subsidies from the government.
Footnotes
There are undoubtedly multiple factors that influence the classification of a company, including: other synthetic ratios, the territorial effect and the effect of the economic and/or political environment, to name a few.
In this article we define the following: 1 = Micro company; 2 = Small business and 3 = Medium business.