






Abstract
The reasons for consumers’ resale behavior are complex and sometimes diverse, and the investigation of consumer resale behavior is not a simple matter. Therefore, only through a lot of investigation and inquiry can we reach relevant conclusions. Based on machine learning and BP neural network, this paper constructs a consumer online resale behavior measurement model. The contraction-expansion factor can balance the global search and local search capabilities in different iteration periods, and the differential evolution operator is introduced to solve the problem of lack of population diversity. After building the model, this study collects data through questionnaires, and combines neural network training models to take data training and data prediction. In addition, this study compares and analyzes real data with predicted data, and visually displays the comparison results through statistical graphs. The results show that the method proposed in this paper has certain effects and can provide theoretical references for subsequent related research.
Introduction
In the traditional supply chain structure, manufacturers are responsible for research and development and production of products, and then sell the products produced to consumers through their downstream distributors or retailers. At this time, the retailer is in the final stage of commodity circulation and is responsible for the sales function of the product. This product distribution model is called retailer resale [1], that is, after a manufacturer wholesales its products to a retailer, the retailer acquires product ownership, and then the retailer sells the product to consumers. At this time, the pricing right is owned by the retailer, and the retailer can also decide to launch other consumer services such as product promotion activities or advertising according to the actual situation. Under the retailer resale model, a retailer specializing in sales has accumulated rich sales experience, a clearer understanding of consumer needs, and a better grasp of changes in the needs of the end consumer market. However, many studies and examples show that there is a “double marginal effect” in the resale model of retailers. Because upstream and downstream companies in the supply chain are trying to optimize their profits, the supply chain has experienced two price increases, which results in a “double marginal effect” that inevitably damages the overall profit of the supply chain. Therefore, companies in the supply chain are constantly exploring new business models in order to improve their competitiveness and obtain higher profits [2].
With the advent of the era of big data and the changes in the development of the C2C model, domestic and foreign scholars have not studied much about the consumer behavior of the C2C model under big data. This is a relatively new topic and will receive more and more attention. Moreover, in the latest domestic article on the research of big data in the frontier of business management, it also gives a certain direction, which gives a strong support to the research of this article [3]. Therefore, the study of consumer behavior in the context of big data provides a certain basis and help for continued discussion in this area. At present, there are not many articles on the consumer behavior of the C2C model in the context of big data, and there are not many studies on the relationship between big data and the C2C model and consumers, and articles using empirical research are rare. Therefore, this paper will have a great impact on consumer resale behavior in the C2C model under big data environment [4].
This research is to explore consumer resale behavior under such a realistic background in order to provide some practical conclusions for the development of the C2C model. This has a very important role in helping sellers establish a suitable marketing strategy, and also provides suggestions for promoting the further development of China’s C2C model. Compared to the B2B model, the C2C model faces greater challenges in obtaining big data and using big data technologies. Therefore, it is more meaningful to study the mechanism of the action of big data on consumer behavior in this model.
Related work
The literature [5] based on the study of planned behavior theory found that behavioral attitudes, subjective norms, and perceived behavioral control all have an effect on behavioral intentions. In particular, perceived behavioral control has a significant impact on behavioral intentions, and is an important influencing factor that determines system adoption. The results of analysis and research in the literature [6] show that behavior attitude, subjective norms, and perceived behavior control can explain 39% of behavioral intention variance and 27% of behavioral variance, respectively, which further proves that planned behavior theory has good explanatory power and predictive power. By investigating the purchase intentions of Danish and Swedish consumers in online grocery stores, [7] found that compared to the rational behavior theory model, planned behavior theory can better explain purchase intentions, and verified that individual perception has a direct positive effect on behavior implementation intention. The theory of planned behavior has been proved to have good explanatory power and predictive power. Considering the usefulness and ease of online shopping as a new technology, many scholars have conducted a series of studies on the factors affecting online shopping based on technology acceptance models. Based on the technology acceptance model, the literature [8] incorporates innovation diffusion theory compatibility variables, planned behavior theory subjective normative variables, and security, privacy, and self-efficiency variables to predict the degree of consumer acceptance of online shopping. The results show that compatibility, the perceived ease of use of online shopping, and the perceived usefulness are highly positively related to purchase attitudes, and attitudes determine intentions, subjective norms and self-efficiency have a certain correlation with purchase intentions, but the correlation coefficient is relatively low. This is contrary to the previous conclusion that the subjective norms have a significant and positive effect on shopping intentions. The reason for this result may be that there are too many variables in the model, which weakens the influence of subjective specifications. The literature [9] found in the research on C2C that subjective norms, the perception of the ease of use of the website, the perceived usefulness of the website, seller competitiveness, and the attitude of sellers to customers all affect consumers’ intentions for online shopping on C2C websites, and intentions directly affect their actual purchase decisions on C2C websites. Based on the technology acceptance model, research in the literature [10] found that the perception of ease of use of online shopping and perceived usefulness of online shopping have a significant impact on consumer behavior. The literature [11] considers that the perceived ease of use of online shopping affects the perceived usefulness of online shopping, the perceived usefulness of online shopping has an impact on attitude and intention, and attitude variables directly affect intention. Based on the most basic technical acceptance model framework, the literature [12] studied Internet users’ intentions for using e-commerce websites and found that when a website is mainly used for a query task, the perceived usefulness of online shopping and the perceived ease of use of online shopping have an impact on usage intentions. However, when a website is mainly used for a purchase task, the perceived ease of use of online shopping has no effect on the intention of use, and the perception of usefulness of online shopping has an influence on the intention of use. In addition, the literature found that the perceived ease of use of online shopping affects the perceived usefulness of online shopping. The literature [13] took consumers with Internet usage experience in the US and South Korea as research objects to study online shopping behavior. According to a sample from the United States, research has found that the perceived ease of use of online shopping influences behavior indirectly by the perceived usefulness of online shopping. According to a sample from South Korea, the study found that only the perceived ease of use of online shopping has a significant impact on shopping behavior. On this basis, they speculated that the prediction effect of the TAM model on network consumption behavior is more effective in the more mature e-commerce environment. Moreover, most of the empirical analysis results show that the TAM model can only explain 40–60% of the user’s behavioral intention, and nearly half of the relevant influencing factors cannot be explained, and its interpretation of external variables is relatively vague. Considering that China’s e-commerce environment is not yet mature, in order to avoid the possibility of such deviations, the research model of online shopping behavior intention in this paper is not based on technology acceptance model but based on extended planned behavior theory. In the above literature review, it was found that most scholars believe that subjective norms, perceived behavior control, and perceived usefulness and perceived ease of use of the website have an influence on the behavioral intentions of online shopping. When it is used for a purchase task, the perceived usefulness directly affects shopping attitudes and intentions, while the perceived ease of use has an indirect effect through perceived usefulness. The research in the literature [14] shows that the higher the consumer’s involvement in purchasing, the more information search activities. The search activities change with changes in shopping attitudes. The more shopping is regarded as a pleasure, the more consumers tend to do more searches. When shopping, consumers will consider their entertainment and enjoyment in the process. The literature [15] used a technology acceptance model and combined environmental psychological theory to jointly explain consumers’ online purchase behavior. After empirical investigation and data analysis, it is found that the perception of online shopping fun has a significant impact on repurchase intention. The research in the literature [16] found that concentration has a significant effect on shopping behavior intentions. Based on a literature review of research related to technology acceptance models, the literature [17] studied the initial consumer behavior of Chinese consumers for IT technology. The analysis of the research data shows that perceived usefulness of online shopping, perceived ease of use of online shopping, and perceived use of entertainment directly or indirectly affect consumers’ long-term and short-term Internet usage intentions. The literature [18] research shows that perceived entertainment can affect consumers ’ attitudes to online shopping, the perceived usefulness of online shopping and consumer attitude factors affect consumers’ online shopping behavior intentions, the perceived ease of use of online shopping has no effect on consumers ‘attitudes towards online shopping, and the perceived entertainment and trust factors of shopping have a positive and significant impact on consumers’ final decision to adopt online shopping.
QPSO algorithm description
The principle of QPSO is analyzed in the following, the limitations of the algorithm are discussed, an adaptive shrinkage factor and a differential evolution operator are introduced, and an autonomously improved QPSO algorithm is given.
In quantum space, when the properties of aggregate states are satisfied, particles can search through the entire feasible solution space, thereby greatly improving the global search ability of the algorithm. First, we discuss how particles move in quantum space.
(1) Establishment of δ potential well model
In quantum space, the speed and position of particles cannot be determined at the same time, so the wave function g is usually used to describe the state of the particles. The expression of wave function
In the equation, Q is a probability density function and satisfies the normalization condition:
The Schrödinger equation for particles moving in quantum space is:
m is the mass of the particle, and
We assume that particles move in space and have a potential well of δ. The form of the potential energy of a particle in a one-dimensional δ potential well is as follows:
We set y = x–p and m as the mass of the particles. At this point, the Hamiltonian operator is:
At this time, the Schrödinger equation of particle motion in the harmonic oscillator is:
At this time, the Schrödinger equation of particle motion in the harmonic oscillator is: When ɛ → 0+:
Due to y ≠ 0, Equation (7) can be written as:
To satisfy the following conditions of the bound state:
The solution of Equation (9) must be:
We assume that the solution of Equation (9) has the following form [22–24]:
In the above equation, C is a constant. According to Equation (8), we can obtain:
Because ψ (y) satisfies the normalization condition, the following three equations are obtained:
In the above equation, L is the characteristic length of the δ potential well.
If we set
The final expression of the probability density function Q is:
(2) QPSO algorithm update equation
According to the analysis theory of particle convergence trajectory, if each particle can converge to its local attraction point p i = (pi1, pi2, ⋯ , p id ), the algorithm has the possibility of convergence. Among them,
or
In Equation (17), (18), and (19), t is the current number of iterations of the algorithm, and r1d (t) and r2d (t) are random numbers between [0, 1], P
g
is the global optimal position of the particle swarm. Since learning factors c1 and c2 usually take equal values, Equation (19) is transformed into:
In the above equation, φ
d
(t) is a random number uniformly distributed between 0 and 1. Therefore, Equation (18) is transformed into:
The PSO system is then viewed as a quantum particle system. According to the theory of particle convergence analysis, if it is assumed that the particle’s j-dimensional potential well is P
ij
(t) when it is iterated to t times, the wave function of particle i is:
According to the Equation (16), the probability density function Q is:
The probability distribution function F is:
In Equations (22), (23), (24), L ij (t) is the standard deviation of the bi-exponential distribution.
If
Then, it can be obtained that at the t + 1-th iteration, the position of the j-th dimension of the i-th particle is as follows:
In the equation, u
ij
(t) is a random number uniformly distributed between 0 and 1. The calculation equation of L
ij
(t) is:
In the above equation, C is mbest, which is also called the average optimal position. It is the center point of the optimal position of all particles. The calculation expression is:
Among them, N is the number of particles in the group, and p i (t) is the individual optimal position of the i-th particle.
The particle position update expression of the standard QPSO algorithm obtained through the above derivation formula is:
In the above formula, α is the only parameter that the algorithm needs to adjust, called the compression-expansion factor, which is used to control the convergence speed of the particles. During the iterative process, the calculation of the individual and global optimal positions is exactly the same as that of the PSO algorithm. The biggest difference is that the speed information is removed from the QPSO algorithm.
The QPSO block diagram is shown in Fig. 1. The algorithm flow is as follows:
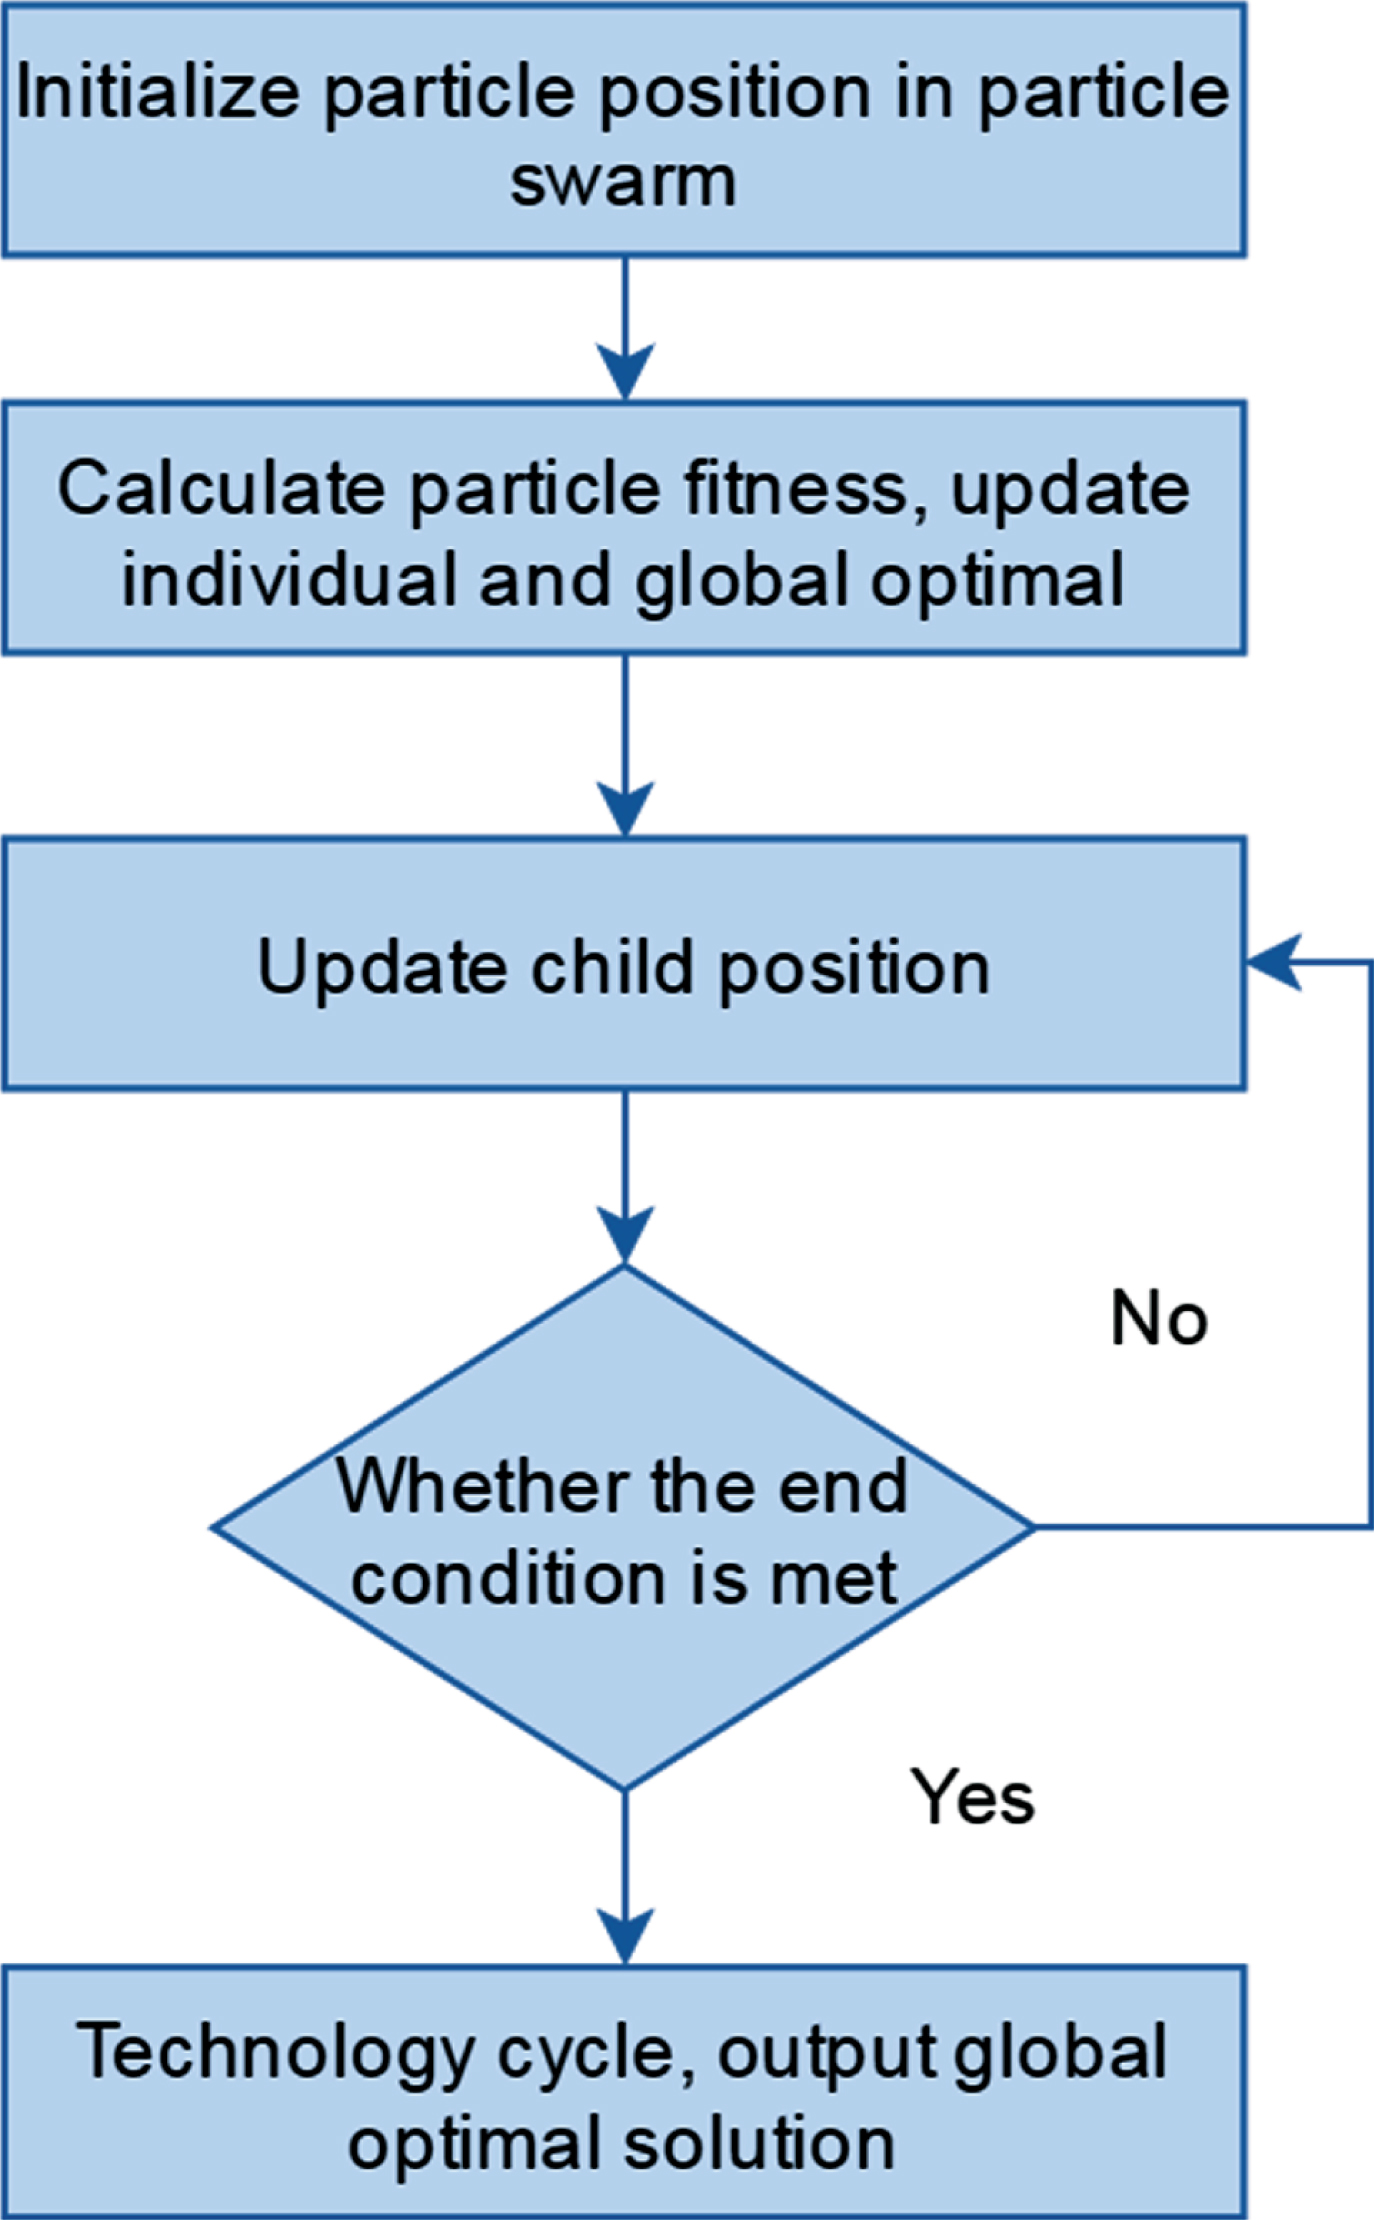
Basic flow chart of QPSO algorithm.
The position information of each particle in the space is randomly initialized; The fitness of the particle is calculated and compared with the fitness p
i
of the best position pbest. If the current particle fitness is better, then the current best position pbest is replaced, otherwise p
i
is unchanged. According to formula (27), the average optimal position of the particle swarm is calculated; The fitness of each particle is compared with the fitness g
i
of the best position gbest of all particles. If the particle’s fitness is better, the global best position of the particle is replaced. According to formula (20), the position of a random point is obtained; According to formula (28), the new position of the particle is obtained; The step (2) to (6) are repeated until the preset termination condition of the algorithm is satisfied.
The QPSO algorithm inherits the usual advantages of the PSO algorithm, but there are still some limitations. The advantages and disadvantages are listed in the following. The calculation model of the QPSO algorithm is more concise and has only location information. The particles of the QPSO algorithm will appear in any position with a certain probability, so as to achieve the purpose of global search. There are few parameters that need to be adjusted in the PSO algorithm. However, the QPSO algorithm needs to adjust fewer parameters, that is, it only adjusts a compression-expansion factor.
QPSO algorithm has better search ability and robustness. The QPSO algorithm still loses group diversity when dealing with complex numbers. When the particle position evolves to a certain degree, the optimal position pbest experienced by a single particle will be closer and closer to the optimal position gbest of the group, the search range of induced particles will be reduced, and eventually the population will gradually lose its “vigor”.
The selection of the contraction-expansion factor α will have a great impact on the convergence speed and accuracy of the QPSO algorithm. The smaller α is, the more favorable the local search is, but the convergence speed of the algorithm is sacrificed. The larger α is, the more favorable is the global search. Moreover, the algorithm will converge faster, but it is not easy to obtain accurate solutions.
When the algorithm is in the early stages of iteration, because the global extreme value and the historical extreme value of the particles are relatively large, we need a larger search speed to approach the global extreme value. Therefore, in the initial stage of the algorithm, it is better to set α to a larger value. In the later stage of the algorithm’s iterative calculation, the historical individual limit value of the particles is very close to the global limit value. At this time, the search speed should be slowed down and the local search capability of the algorithm should be strengthened. Compared with the initial period of the algorithm, α should be appropriately reduced to improve the local search capability of the algorithm and enhance the accuracy of the algorithm.
The traditional contraction-expansion factor α is generally calculated using the following formula:
In the above formula, α0 and α m are the initial and final values of the contraction-expansion factor settings, which are generally set to 1.0 and 0.5 according to experience. As can be seen from the above formula, the change of the traditional update formula is a linear straight line, monotonically decreasing, and it is difficult to meet the demand for flexible and dynamic changes in the contraction-expansion factor.
Starting from the aggregation degree k (t) of particles, we combined the Gaussian curve to give an adaptive and more flexible contraction-expansion factor update formula. The degree of particle aggregation indicates the degree to which particles are gathered at a specific location or several specific locations. The degree of aggregation of the particles can well reflect that the algorithm is in the iterative period and serves as an important basis for the dynamic adjustment of the contraction-expansion factor α. The specific calculation formula of the particle aggregation degree k (t) is:
In the formula, avgp i (t) is the average value of the individual extreme values of the particles, and p g (t) is the global optimum of the current particle. The larger k (t), the greater the degree of particle aggregation, indicating that the algorithm is in the late stage of iteration. The smaller k (t), the smaller the degree of aggregation of particles
According to the degree of particle aggregation k (t), the updated formula of the improved contraction-expansion factor α is:
Figure 2 is a comparison diagram of a conventional contraction-expansion factor and an improved contraction-expansion factor α. It can be seen from the comparison diagram that in the early stage of the algorithm’s iterative calculation, the value of the shrinkage-expansion factor of the improved update formula is greater than the value of the traditional update formula, which is conducive to the global search of the algorithm. At the later stage of the algorithm iteration, it is necessary to strengthen the local search. At this time, the factor of the improved formula drops faster than the factor of the traditional formula, which is beneficial to the local search in the later stage of the algorithm and enhances the search accuracy. In general, the improved update formula will be more conducive to the global search and local search of the algorithm in the early, middle, and late stages of the algorithm.
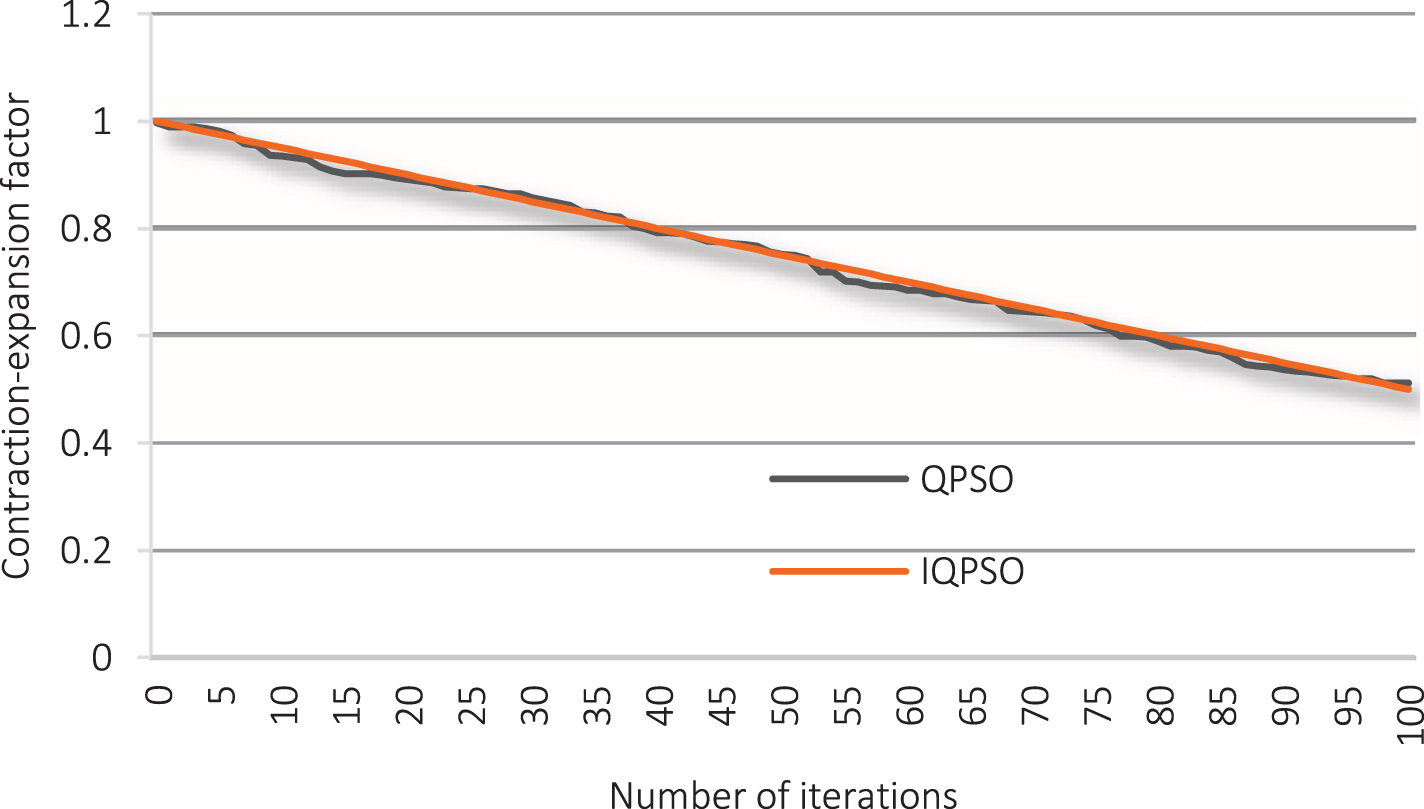
Change diagram of contraction-expansion factor.
The improved contraction-expansion factor can well balance the global search and local search capabilities in different iteration periods. However, in the late iteration of the algorithm, due to the high degree of particle aggregation, it is easy to cause the lack of group diversity, which leads to problems such as local convergence or “stagnation” in the algorithm iterative calculation. Therefore, a differential evolution operator is introduced to solve this problem when the algorithm stagnates or falls into a local optimum.
From the updated formula of the QPSO algorithm, we know that the first term p
id
is an important factor that determines the new position of the particle, and we can obtain:
By combining the two items on the left side of the above formula, the following formula can be obtained:
By analyzing the above formula, it can be known that during the search process, when the particle’s current position x id , individual optimal position pbest id and global optimal position gbest d are very close, the value of the first term (pbest id - gbest d ) of the formula will be very small, or even 0. Then, this term will not work in the update formula. A more serious situation is that it will lead to the lack of diversity of the particle population and increase the probability of the population falling into a local optimum. In order to maintain the diversity of the population, a differential evolution operator is introduced.
For any particle i in the current particle group, two particles at different positions are randomly selected, namely particle j and particle k (i ≠ j ≠ k), and then the position difference between particles j and k can be obtained:
We use Equation (34) instead of (pbest
id
- gbest
d
) in Equation (33), and in order to increase the randomness, add a random number between 0 and 1 between two terms to get a new evolution equation:
It can be seen from the improved formula (35) that the introduction of the differential evolution operator will solve the problem of reduced diversity in the population, and avoid the algorithm falling into a local optimum to the greatest extent. In addition, an improved contraction-expansion factor αupdate formula is adopted to enhance the search performance of the algorithm in each period of iterative calculation.
This paper builds a model with a three-layer structure of BP neural network. The feed-forward neural network architecture is shown in Fig. 3. It consists of three levels: input layer, hidden layer and output layer, and the hidden layer can include one or more layers. Neurons in any layer are connected to all neuron nodes in the previous layer, but there is no connection between neurons in the same layer, and the signal is transmitted layer by layer.
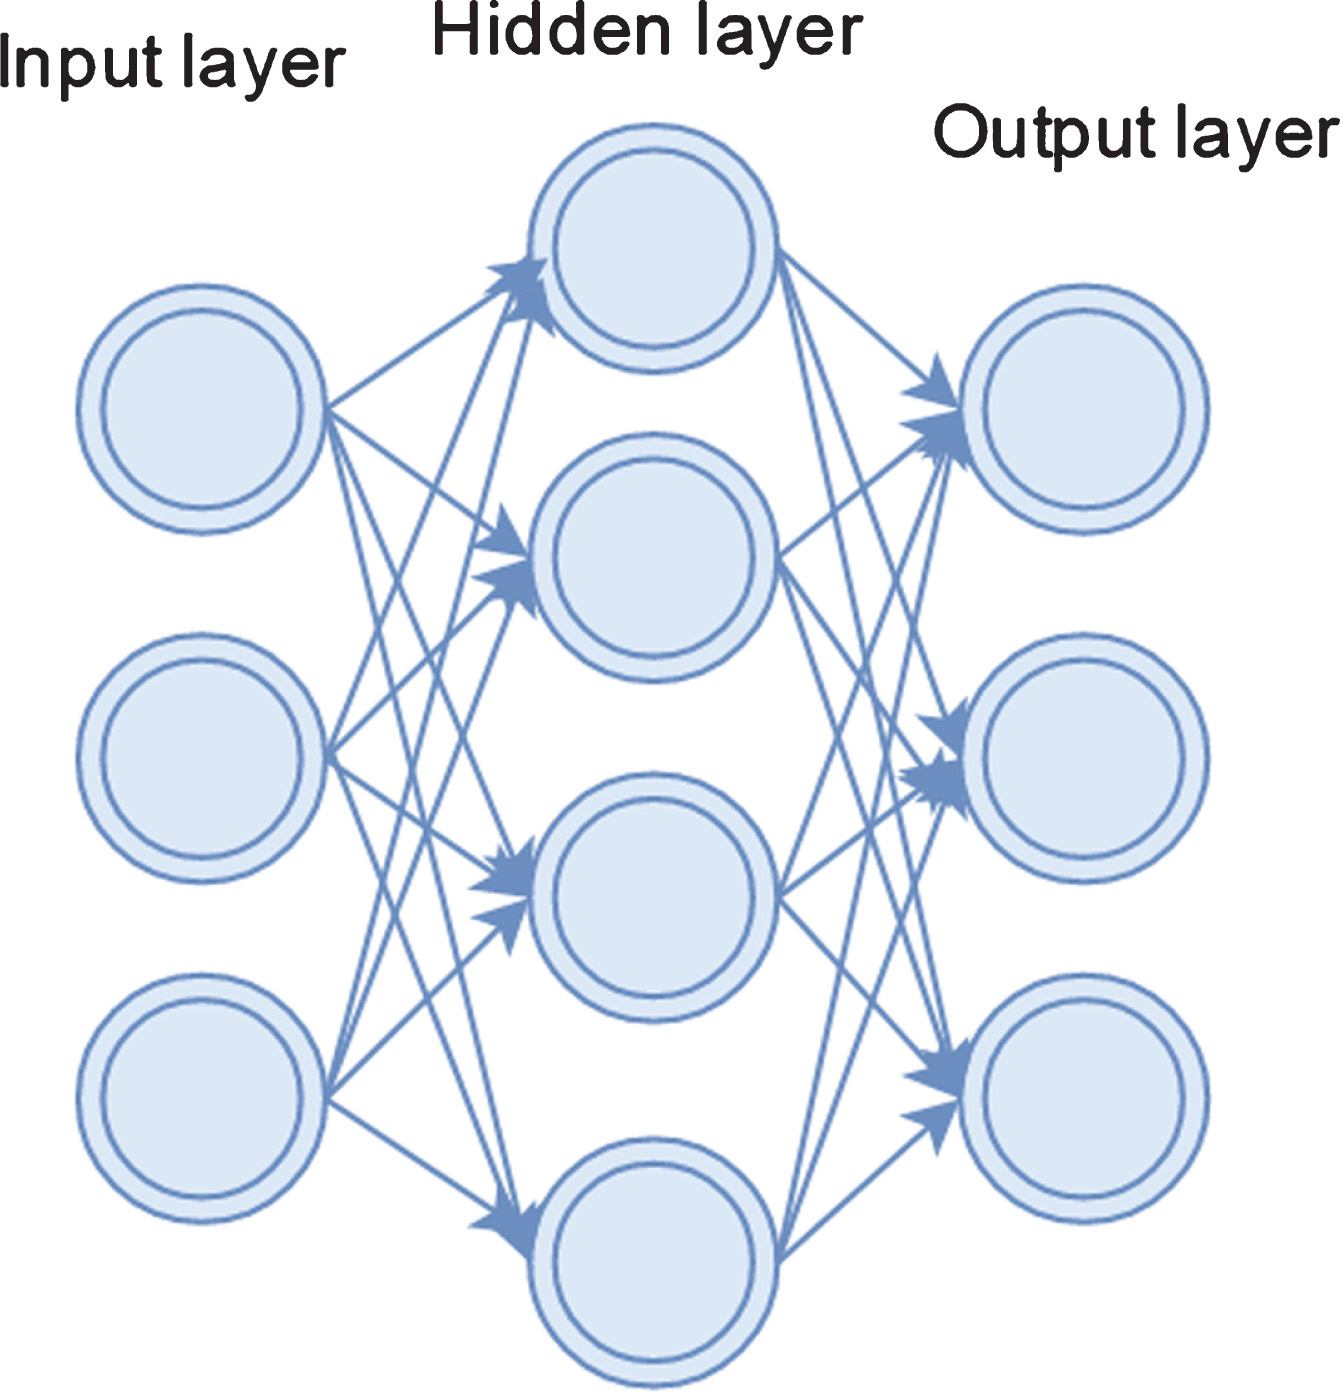
Schematic diagram of the three-layer structure of the BP neural network.
The standard learning algorithm steps of BP neural network are shown in Fig. 4 below:

BP neural network learning process.
BP network has self-learning ability and generalization ability, so it is especially suitable for solving problems with more complicated internal mechanisms. However, the learning speed of ordinary BP algorithm is slow, and the possibility of network training failure is large. The Levenberg-Marquardt algorithm (referred to as LMBP) is an improved BP algorithm, which combines the Newton method and the steepest descent method, significantly improves the speed of network learning, and also greatly improves the accuracy. Confusion matrix of neural network model prediction results as show in Table 1.
Confusion matrix of neural network model prediction results
In the beginning of the experiment, Python was used for programming, and MySQL was used to store data. However, due to the high time cost when extracting more complex features on MySQL, the experiment turned to use Alibaba Cloud’s ODPS platform. ODPS is a distributed massive data processing platform that provides rich data processing functions and a flexible programming framework. Moreover, it can provide massive data storage and computing services with low real-time requirements
The total number of samples is 40957 and the positive and negative ratio is 1:7.6. The division ratio between the training set and the test set is 0.6:0.4. The total number of features is 181, including 171 numerical variables and 10 dummy variables. Moreover, L2 regularization is adopted.
The number of predicted samples is 24,477, and the number of true positive examples is 2,913. The number of accurate positive predictions is 1,765, the accuracy of positive examples is 84.90%, and the recall rate is 60.59%.
The source of the sample data was 391 valid data collected from the questionnaire, the first 321 were selected for the training data, and the remaining 70 were selected for the test data. In order for the network model to easily extract and process data during training and prediction, improve the calculation speed, eliminate the influence of singular sample data on the network, and accelerate the network convergence speed, it is necessary to normalize the original data and map the sample data to [–1,1]. The commonly used methods include maximum and minimum method and Z-score method. In this study, the original data is normalized using the maximum and minimum method, which is a linear transformation of the sample data and will not cause the original information to change. The ROC curve of the model prediction result is shown in Fig. 5. The corresponding table is shown in Table 2.
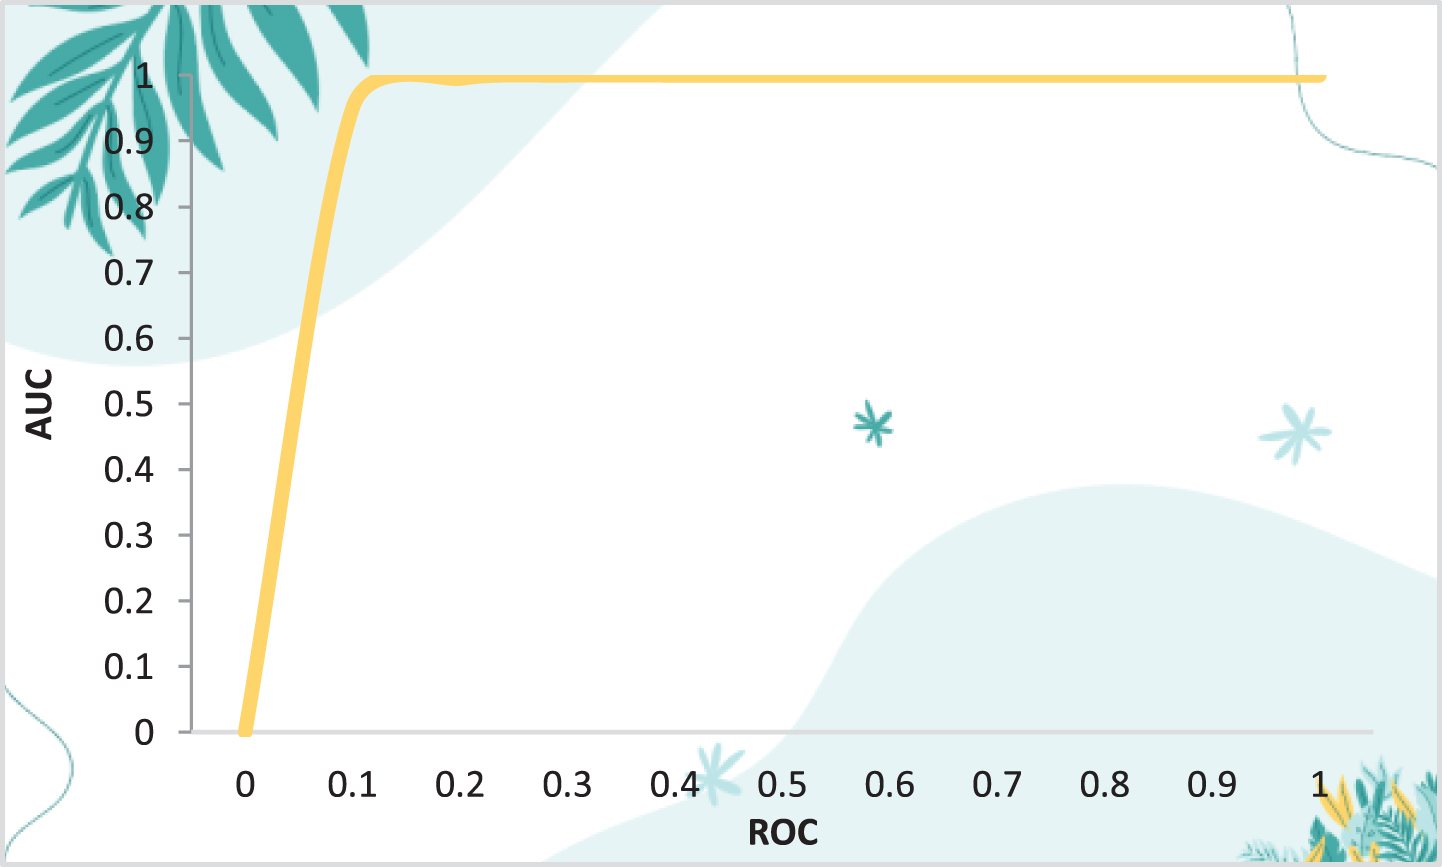
ROC curve of model prediction results.
Network training results
The area, AUC, under the ROC curve of this logistic regression model is 0.9756, and the model’s prediction effect is better.
In this study, two algorithms, ordinary BP neural network and LMBP neural network, were used to train 321 data sets. The results show that the general BP training effect is worse than LMBP, the number of iterations is much more than LMBP, and the training error is larger than LMBP. However, the LMBP reaches the predetermined accuracy after 21 iterations, and the time is extremely short, and the error is much smaller than that of the ordinary BP.
Figure 6 shows the training results based on the LMBP algorithm training. The horizontal axis represents the number of iterations, and the vertical axis represents the error. The preset precision is reached when iterating to the 21st time. When the iteration stops, the error is 0.00073608, and the gradient at this time is 0.0275, so we can see that the actual iteration error is already less than the target error level.
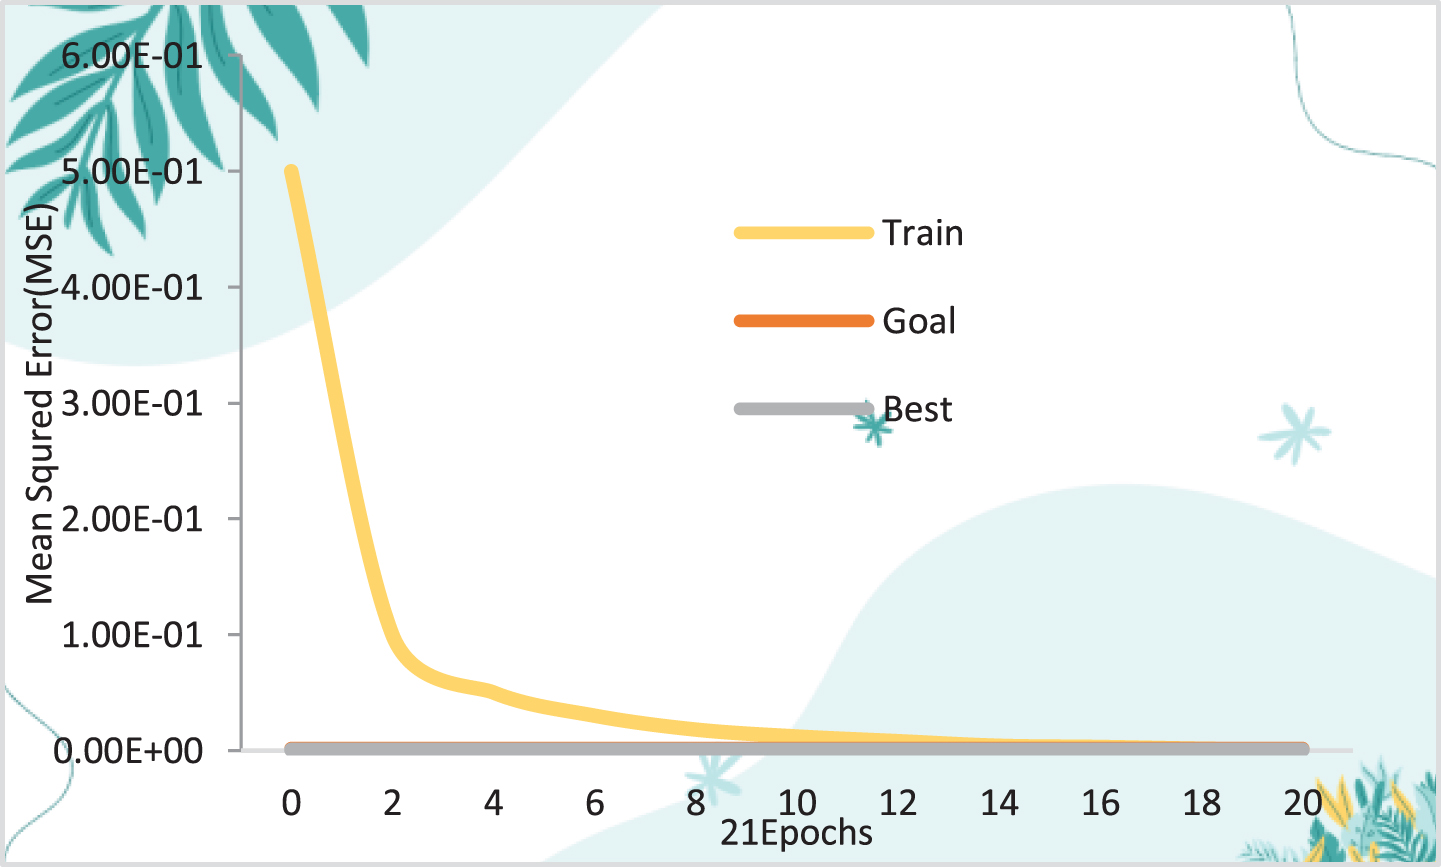
The result diagram of network training based on LMBP algorithm.
The observations and fitting values (processed with an inverse normalization function) of the training samples (partial samples) are shown in Tables 3 and 4 below. The corresponding statistical graphs are shown in Figs. 7 and 8.
Observed values of training sample data
Fitting values of training sample data
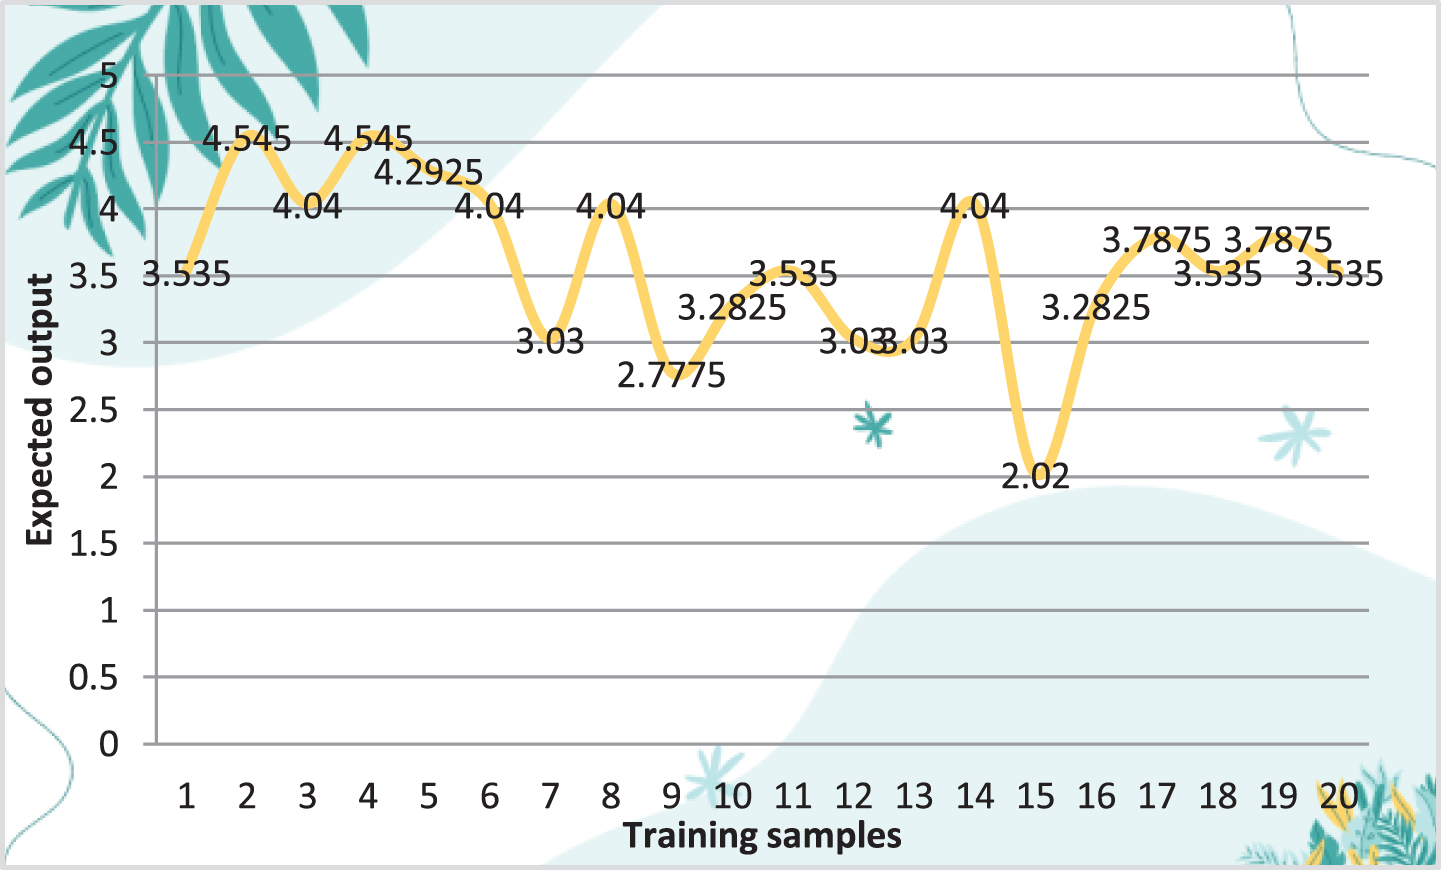
Statistical diagram of observed values of training sample data.
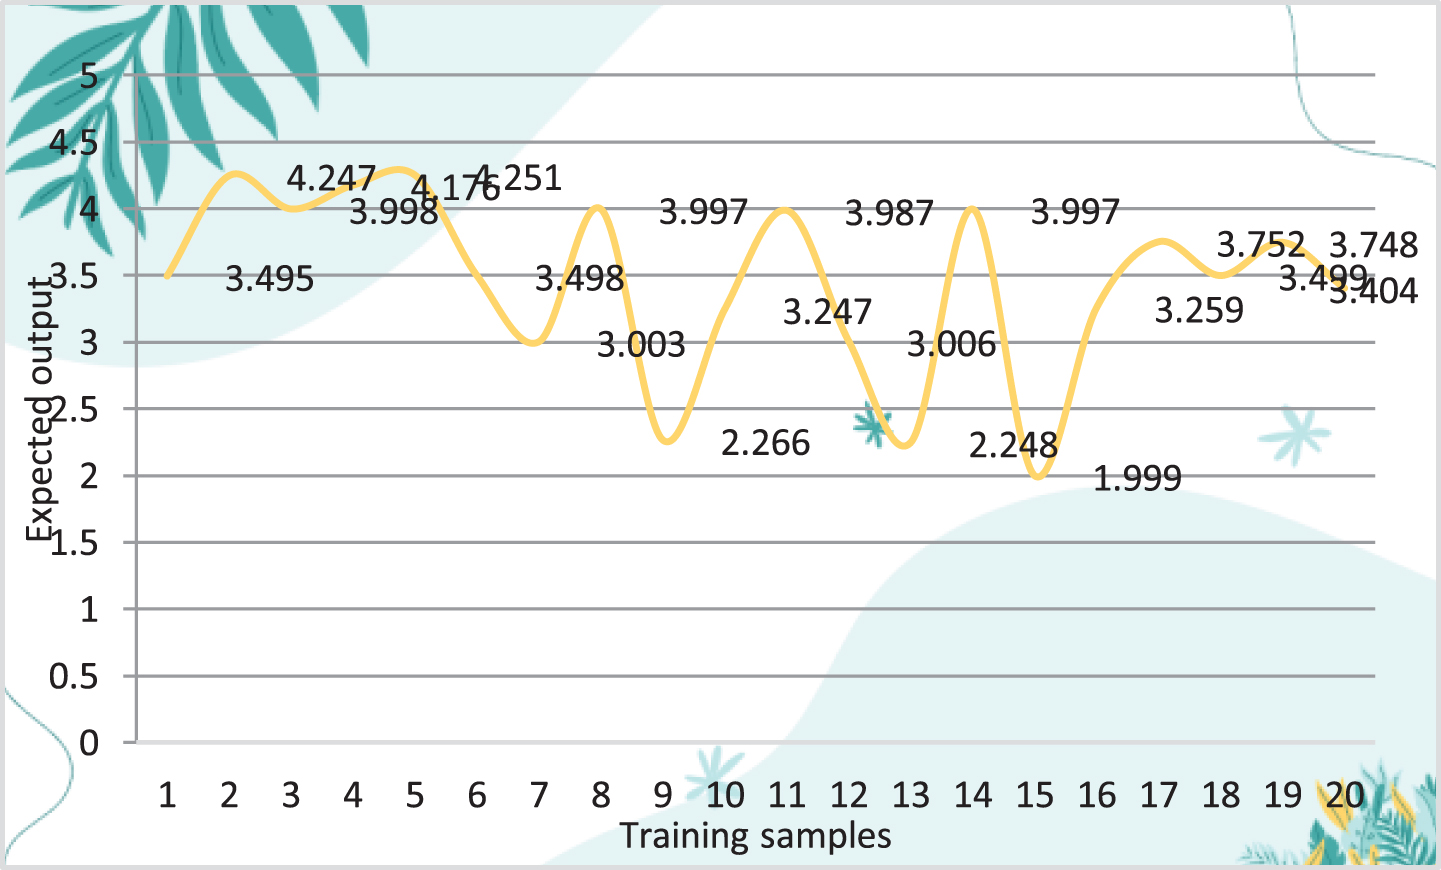
Statistical diagram of fitting values of training sample data.
In Fig. 7 and Fig. 8, the observation value of the training sample is the original value of the sample data collected by the questionnaire survey, which is the comprehensive score of the respondents’ perceived trust level. The fitting value of the training samples is the simulated output value obtained after the original value of the sample data is input to the network, which shows the advantages and disadvantages of the network training effect. If the observed values and the fitted value curves tend to coincide, it means that the network model setup is reasonable and effective, and the comparison of the output values with the original values can initially reflect the network’s simulation capabilities. By comparing the observed data in Table 3 with the fitted data in Table 4, it can be seen that the error is small, and the data are basically close. The table only lists the data values of some samples. The comparison between the overall sample observations and the fitted values will be shown in the form of graphs in the following, which is more intuitive.
Due to the unsatisfactory fitting effect of ordinary BP, the LMBP algorithm is used to calculate the error between the observed values of the training samples and the test samples and the model fitting values. The results obtained are shown in Fig. 9 and Fig. 10.
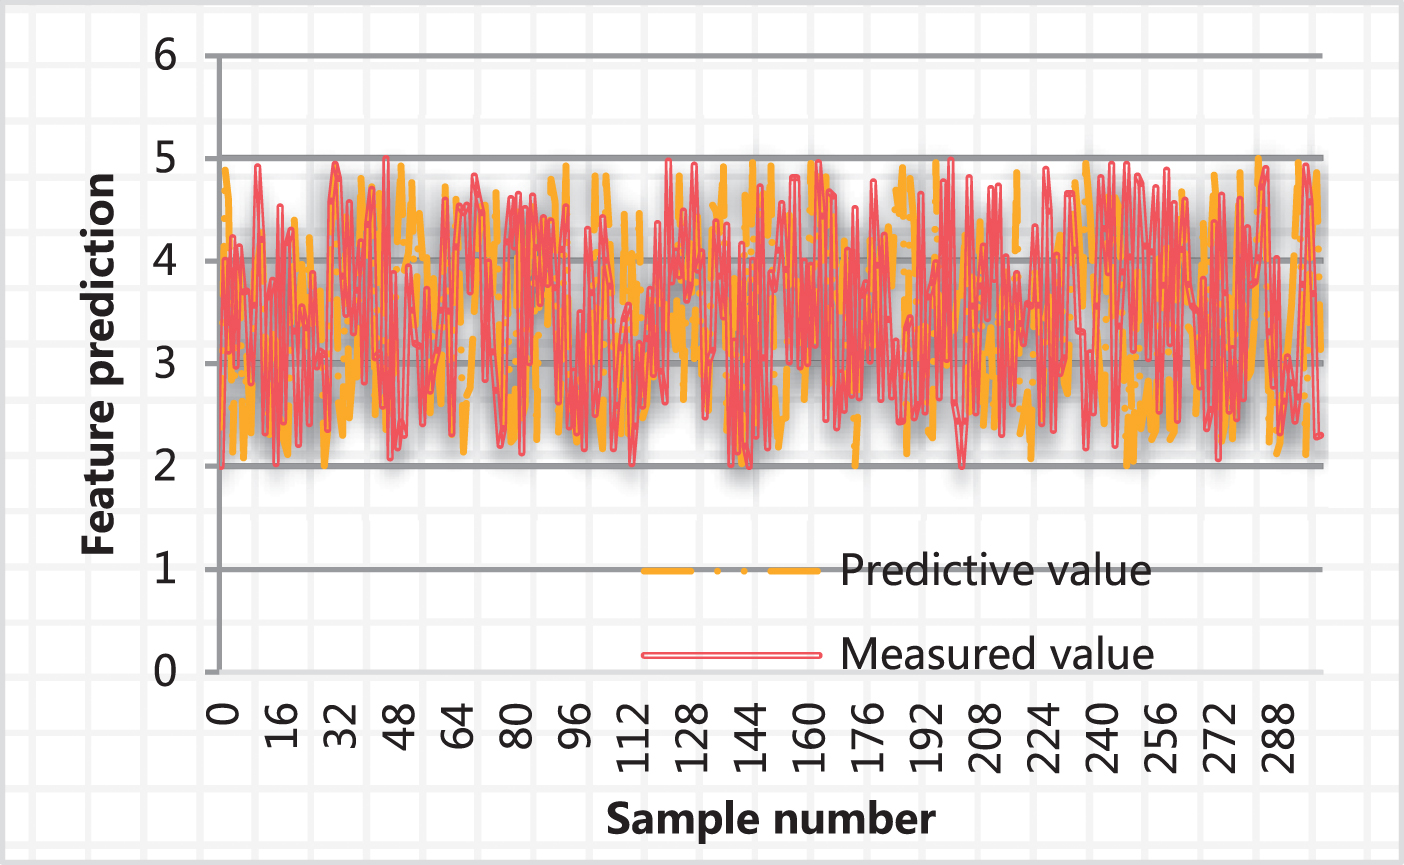
Comparison of predictive value and measured value of training samples.
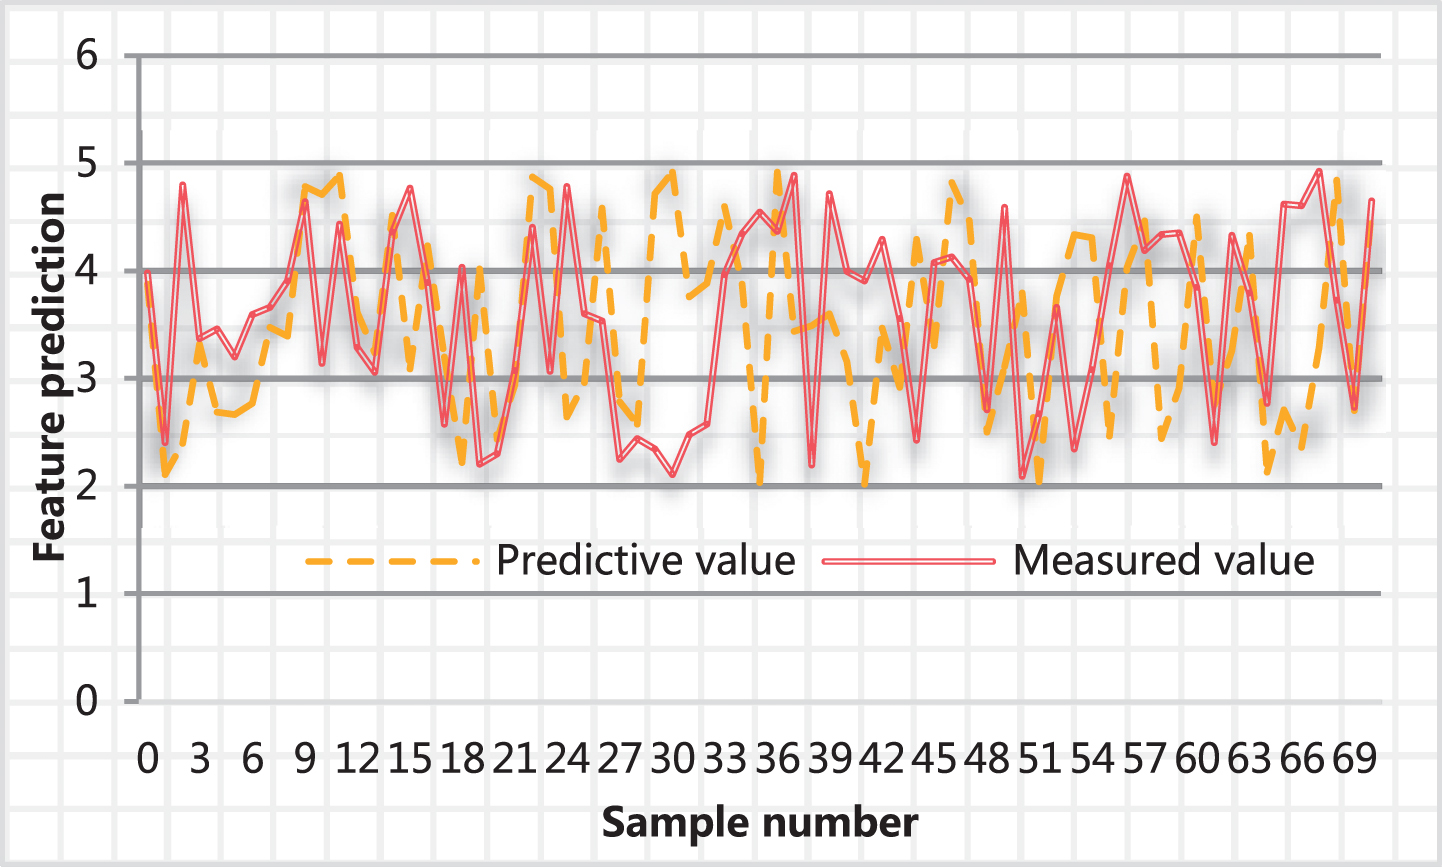
Comparison of predictive value and measured value of prediction samples.
Figure 9 shows the actual evaluation curve and BP prediction curve of the training group data. The two curves are very close, which shows that the network training effect is close to the actual situation. Figure 10 shows the actual evaluation curve of the prediction group data and the BP prediction curve. The two curves basically coincide, which shows that the effect of the simulation output is better.
E-commerce is becoming more and more engaged in our lives, and some large shopping sites can bring together a large number of goods and users. Moreover, the low information utilization rate caused by information overload also bothers merchants and consumers. The personalized recommendation system effectively filters and extracts large amounts of product information according to consumers’ own tastes and purchasing needs, and provides consumers with more targeted product recommendations, thereby improving consumer satisfaction and loyalty The prediction model established in this paper is to infer the short-term purchase intention of users based on historical behavior data of resale behavior of online consumers, thereby laying the foundation for personalized recommendations.
The purchasing habits of different types of consumers are significantly different, so for different types of consumers, the feature weights obtained by model training are actually different. By modeling users with similar consumption habits, the estimation of feature weights will be more accurate. If the consumers can be clustered by purchasing power, whether there are repeated buying habits, the buying cycle, and the purchase conversion rate of the four behaviors, and the same type of consumers are modeled to make purchase predictions, the prediction effect of the sub-model will be much improved. Moreover, the prediction effect of integrating the results of different types of consumer purchase prediction models in proportion will be higher than a unified consumer prediction model. However, this will cause less data to be used in the sub-model, and the number of positive samples will be insufficient. Therefore, it is necessary to pay attention to controlling the number of sub-models to 3–5. At the same time, what proportion of the prediction results of the sub-models are integrated into the final results, it also needs to be debugged according to the prediction results in the later period.
In the model established in this article, the features used by logistic regression and GBDT are consistent. However, logistic regression is a generalized linear model, and the premise of the assumption is that the features must have a strong linear correlation with the prediction results. Moreover, too many categorical variables have a great impact on logistic regression. Therefore, the characteristics of constructing logistic regression have greater limitations. However, GBDT is a non-linear model, which is more tolerant of categorical variables, so it performs well on many data sets, which makes the limitations of constructing features smaller. Therefore, according to the applicability of the algorithm, different feature sets can be established for training.
Conclusion
Consumers’ online resale behavior is a product developed by the times, it is different from the flea market in the original reality, and it has the adaptability of the times and the rapid development trend. By studying consumer network resale behavior, it will not only benefit the development of resale e-commerce, but also promote the development of e-commerce for general goods. Although China’s economic development is currently facing many difficulties and challenges, its situation is still developing in a good direction. Moreover, something innovative has emerged in our economy, that is, the sharing economy. It is precisely because of the promotion of the sharing economy that the second-hand trading platform is developing at such a high speed. Although China’s e-commerce is in a leading position in the world, and the rules of e-commerce are becoming more and more perfect, it is still a weak link for the online secondary market. This paper constructs online resale behavior of consumers through machine learning and BP neural network and performs online consumer resale behavior measurement. The research results show that the model proposed in this paper has certain effects.
Footnotes
Acknowledgments
This work were supported by University of Science and Technology Liaoning youth fund plan(research on consumers online resale behavior based on Mental Accounting Theory, Grant No. 2017QN20,2017.1-2019.12),University of Science And Technology Liaoning TalentProject Grants, and the Liaoning Social Science Planning Fund Program(Research on College Students’ Entrepreneurship Project - Team Matching Method and Application based on the Jingyou Character of Entrepreneurship Ability, Grant No.L17DGL008).