






Abstract
There are many factors that need to be considered when planning a city’s green economy, so it is difficult to simulate the planning effect through manual models. In order to improve the effect of urban green economic planning, this paper improves the traditional algorithm and combines the principle of machine learning algorithm to build a model that can be used in urban green economic planning. Moreover, this paper considers the measurement of green economic efficiency from the perspective of input, expected output and undesired output. In addition, this paper compares and analyzes the green efficiency calculated by the SE-SBM model, including horizontal comparison analysis and vertical comparison analysis, and conducts model simulation analysis in combination with data simulation research. Finally, this paper sets the simulation area, combines the data to perform model performance analysis, summarizes the data with statistical analysis methods, and draws charts. The research results show that the model constructed in this paper has a certain effect and can be applied to the design stage of urban green planning.
Introduction
At present, there are relatively few studies on the influencing factors of my country’s green economic efficiency and these studies lack systematicity. By analyzing the relationship between economic development scale, industrial structure, urbanization level, foreign direct investment, education expenditure, environmental governance and other variables and the green economic efficiency of the country and the three major regions of east, middle and west, this paper empirically studies the impact based on inter-provincial panel data. Finally, this paper uses the panel threshold model to test and analyze whether the above factors have a threshold effect on the overall national green economic efficiency. At present, the academic community focuses on the economic growth effects of the above factors, but there are relatively few studies on the green economic efficiency effects of the above factors and whether there is a threshold effect between the two [1].
At present, China’s economy has shifted from a stage of high-speed growth to a stage of high-quality development, and the mode of economic growth has gradually shifted from past investment-driven to total factor productivity-driven. High-quality economic development is inseparable from the strategic guidance of the five development concepts of innovation, coordination, greenness, openness, and sharing. Green development has increasingly become an intrinsic requirement and an inevitable choice for transforming China’s economic development mode and resolving economic development conflicts. How to improve the green total factor productivity taking into account the improvement of environmental performance has become the key to achieving high-quality economic development. In the high-quality development stage, the “structural dividend” released by the optimization of the economic structure and the “reform dividend” brought about by the reform of the market-oriented system are the two key “keys” to the improvement of green total factor productivity. At the 2016 Central Financial Leadership Group meeting, the Party Central Committee proposed a supply-side structural reform with the core of improving overall productivity. The reform focused on solving the problem of distorted allocation of production factors such as labor, capital, land and innovation, and adjusted the supply structure by optimizing the economic structure to adapt to changes in the demand structure. At the same time, a reasonable economic structure can make the various elements coordinate well and optimize the allocation of resources, thereby greatly improving the productivity of society. Therefore, timely adjustment of the economic structure is particularly critical to improve the green total factor productivity [2]. “Reform bonus” mainly refers to the economic efficiency improvement brought by China’s continuous in-depth market reform. Since the reform and opening up, the economic transformation in the direction of market-oriented reforms has brought China’s world-renowned economic achievements, and the market-oriented process has also continued to advance in depth. The marketization of green factor productivity mainly comes from two aspects. First, market-oriented reform promotes the micro-technological progress of enterprises, thereby promoting the improvement of green total factor productivity. Second, market-oriented reform will promote the improvement of resource allocation and increase the productivity of the whole society. Therefore, if the structural dividend and the reform dividend can be fully released, the green overall productivity will be significantly improved, and the operating efficiency and quality of the Chinese economy will enter a new stage [3].
In the background of rapid depletion of resources and serious environmental pollution, the concept of governing the country and governing the world has gradually turned to green development. In March 2015, the Ministry of Environmental Protection of my country announced the launch of “Green National Economic Accounting” again. In November of the same year, the “13th Five-Year Plan” proposal adopted by the Fifth Plenary Session of the Eighteenth Central Committee of the Communist Party of China for the first time positioned “green” as a “development concept”. Since the implementation of the reform and opening-up policy, the achievements of my country’s economic development have amazed the world, and people’s material lives have been well improved. However, economic growth is highly dependent on resources and environment is a long-term serious problem in my country’s economic development.
Related work
The measurement of regional technological innovation capability has experienced the development process from single index measurement to multi-index measurement. The literature [4] first applied innovation theory to the national level, emphasized the importance of innovation ability to a country’s economic growth, and believed that patents can measure a country’s innovation ability well. The literature [5] proposed that a comprehensive evaluation index system of regional technological innovation capabilities should be constructed from three aspects: innovation infrastructure, industrial cluster innovation environment, and the quality of the connection between science and technology and industry. The literature [6] constructed an evaluation index system for regional technological innovation capabilities from three aspects: technology development, technology transformation and application, and technology introduction and exchange. The literature [7] constructed the evaluation index system of regional technological innovation capability from the aspects of science and technology input and technology output. The literature [8] built an evaluation index system of regional technological innovation capability from five aspects: knowledge creation, knowledge flow, enterprise technological innovation capability, technological innovation environment, and innovation performance. The literature [9] constructed the evaluation index system of regional technological innovation capability from four aspects of R&D investment, personnel quality and structure, innovation and technology output and technology diffusion.constructed a regional technology innovation capability evaluation index system from three aspects: technology input capability, output capability of scientific and technological achievements, and output capability of industrial achievements. The literature [10] constructed the evaluation index system of regional technological innovation capability from four aspects: economic development, technological input, technological sustainable development and technological output.
Problems such as shortage of resources and deterioration of the ecological environment have brought unprecedented challenges to the development of the world economy. GGDP is the most commonly used concept in green accounting. However, there is still no unified and clear definition of GGDP. There are currently two definitions of GGDP that are frequently applied:(1) GGDP is the result of adjusting the current GDP with the cost of natural resource loss and environmental pollution loss; (2) GGDP is the result of increasing the value of ecosystem services based on the current GDP. Among them, the first definition focuses on the negative effects of resource depletion and environmental pollution caused by human social and economic activities. The research on GGDP accounting based on the first definition started earlier. Literature [11] proposed the concept of net economic welfare, and advocated to deduct the relevant social costs of urban pollution and other social costs brought about by human socio-economic activities from the current GDP, and to the value created by economic activities such as housekeeping activities and social obligations that have been neglected in the past. In contrast, the second definition emphasizes the positive value of economic services and ecological services. The literature [12] first began to account for the service value of the global ecosystem. However, due to the relatively complex accounting of ecosystem service value, there is relatively more research on GGDP accounting using the first definition.
The literature [13] believed that the implementation of sustainable development is a process. Moreover, it believed that sustainable development is a process of coordinating and solving the contradictions between economic development, resource conservation, and environmental protection through knowledge creation and technological innovation activities, so as to achieve the coordination and balance between human social systems and natural ecosystems. The literature [14] proposed that the role of technological innovation in optimizing the economic structure, transforming the economic growth mode, realizing the sustainable use of resources, and promoting the coordinated development of human society and nature is gradually increasing, and is the decisive force for the sustainable development of the regional economy. The literature [15] measured green economic growth with GGDP per capita. Through panel data research in 8 countries including Australia, Austria, Brazil, Italy, the Netherlands, Sweden, the United States, and the United Kingdom, it was found that trade openness has a significant negative impact on green economic growth. The literature [16] deducted the resource depletion cost and environmental degradation cost from the current GDP to calculate the regional GGDP and establish a panel data model. The literature [17] incorporated the environmental pollution index into the DEA (Data Envelopment Analysis) model to measure the green economic efficiency of the region. Moreover, its research on building a dynamic panel data model found that market openness, human capital, energy intensity, and government regulations all have a significant role in promoting green economic growth. Moreover, the proportion of the secondary industry has a significant inhibitory effect on the overall and green economic growth in the central and western regions, but it has a significant promoting effect on the eastern regions. The literature [18] used the Russell model of two options to revise and found that energy saving and emission reduction are the core driving forces of green economic growth, and it mainly produces effects by promoting technological progress. At the same time, it found that high GDP growth and excessive capital investment would instead inhibit my country’s green productivity growth. Based on the DEA model of the SBM directional distance production function, the literature [19] measured industrial green total factor productivity. The empirical results show that R&D input intensity, foreign capital dependence, foreign trade dependence and industrial pollution intensity have a significant positive effect on the growth of industrial green total factor productivity. Based on the joint regression panel data model, the literature [20] found that industrial upgrading has a significant positive impact on the growth of industrial green total factor productivity, while intellectual property management requires interaction with industrial upgrading to have a significant positive impact on the total factor productivity of green industry. The literature [21] found through the empirical study of the fixed-effect panel model that independent innovation has a significant promotion effect on industrial green economic growth and has a stronger promotion effect on low-tech areas. The article [22] dealt with IoT and human behaviour data with the collection and analysis of data from distinctive resources. The article [23] implements cooperative cognitive intelligence in the field of vehicular communication. The article [24] proposes the concept of SmartBuddy for implementing intelligent and smart city-based environments. The article [25] uses partitioning algorithm for speeding up the process of video processing. The article [26] does IoT and BigData Analytics in the real time environments using Hadoop ecosystem.
Model basics
Data Envelopment Analysis (DEA) is one of the non-parametric technical efficiency analysis methods [27, 28]. The CCR model based on the constant return to scale and the BCC model based on the variable return to scale are the two most basic models for the application of data envelopment analysis theory.
(1) CCR model based on constant returns to scale
The CCR model assumes that there are n DMUs, denoted as DMU
j
(j = 1, 2, ⋯ , n). Each unit has m types of input
The planning formula of the input-oriented CCR model is as follows:
(2) BCC model based on variable returns to scale
The CCR model is based on the constant return on scale of production technology, that is to say, all DMUs evaluated are in the stage of optimal production scale, that is, the stage of constant return on scale. The BCC model is based on the variable scale returns of production technology, and it adds constraints on the basis of the CCR model, so that the production scale of the projection point and the production scale of the evaluated unit are at the same level.
The output-oriented BCC model planning formula is as follows:
The input-oriented BCC model planning formula is as follows:
The super-efficient SBM model is expressed as follows:
(1) SBM model based on unexpected output
The radial DEA model often ignores the slack problem of input and output when measuring the efficiency of DMU. Therefore, the results of the radial DEA model may have a certain deviation. In response to the problems in the radial DEA model, Tone introduced the SBM model based on the radial DEA model by introducing input and output relaxation variables into the objective function. In addition, the SBM model is also a non-angle, non-radial efficiency evaluation model, which can effectively prevent deviations in efficiency measurement results due to differences in the choice of output angle or input angle during the measurement process. We assume that m types of inputs
The best production feasibility set P (x) for each period is:
Among them, y g , y b , x represents some kind of expected output, undesired output and input factors. λ represents the weight of each decision-making unit. At the same time, the sum of the non-negative weight variable and the weight variable is 1, which represents the variable scale return of production technology. If the constraint that the sum of the weight variables is 1 is removed, it means that the returns to scale remain unchanged.
The set of production possibilities of the SBM model considering undesired output is:
Therefore, the SBM model based on constant returns to scale can be expressed as:
Among them, s represents the relaxation variable of input and output, and λ is the weight vector. Meanwhile, the objective function ρ is to evaluate the efficiency value of DMU, it is strictly decreasing with respect to s-, s
g
, s
b
, and the value of ρ is between 0 and 1. At the same time, it measures the efficiency from both input and output angles. When ρ < 1, it indicates that the evaluated unit is inefficient, and there is a need for input-output improvement. When ρ = 1, it indicates that the evaluated unit DMU is valid. At this time, we can obtain the SBM model based on variable returns to scale, which is expressed as:
(2) Super-efficient SBM model based on unexpected output
Referring to the SBM model, the SE-SBM model with constant returns to scale can be expressed as:
The SE-SBM model with variable returns to scale can be expressed as:
λ is the objective function of weight vector, and ρ se is the efficiency value of evaluating DMU. At the same time, a larger ρ se indicates that the unit is more effective. It should be noted that the production frontier corresponding to each period is different, and the efficiencies calculated by the DEA model and the SE-SBM model are relative efficiency values, not absolute efficiency values. In addition, the green efficiency calculated by the calculation model in this paper is also a relative value rather than a decisive value. Therefore, the green efficiency calculated by the SE-SBM model is comparative analysis, including horizontal comparative analysis and vertical comparative analysis, but it is not suitable for absolute value analysis.
The SBM directional distance function is defined as:
When analyzing the inefficiency changes of the evaluated unit in period t and period t + 1, it is necessary to refer to the inefficiency values in the two periods obtained from the production frontier. However, the inefficiency values obtained with reference to different frontiers are different. By referring to the production frontier of period t and the production frontier of period t + 1 respectively, four inefficiency values are obtained. After that, the Green Lunberg Productivity Index (GLPI) was defined to measure the level of green productivity. The green Lunberg productivity index between period t and period t + 1 can be expressed as:
The Green Lunberg productivity index can be decomposed into technological changes and efficiency changes, as shown in Equation (15). Among them, the technological change value is greater than 0, which means that technological progress promotes (impedes, does not affect) green productivity growth. Meanwhile, the efficiency change value is greater than (less than, equal to) 0, which means that efficiency improvement promotes (impedes, does not affect) green productivity growth.
Green economic efficiency refers to the degree of greening of urban green economic efficiency and is an assessment of the quality of urban green development that comprehensively considers energy consumption and environmental issues. This paper mainly considers the measurement of green economic efficiency from the perspective of input, expected output and undesired output. Moreover, this paper uses capital stock, labor, and energy consumption as input factors, adopts the output value of the local municipalities as the expected output, and selects industrial sulfur dioxide, industrial wastewater, and PM2.5 as the undesired output. The selection and processing of specific indicators are as follows:
Labor input (L): This paper uses the number of employees at the end of each year in various cities as an indicator of labor input.
Capital investment (K): It refers to the actual capital stock invested in economic operation. In my country’s statistical data, capital investment indicators cannot be obtained directly, and different scholars have different measurement methods for capital investment. Some scholars use the original value of fixed assets to measure, and some scholars use the net value of fixed assets to measure. However, the previous two methods of measurement are flawed.
This paper uses the perpetual inventory method to estimate the capital stock. Its basic principle is that the capital stock is a weighted sum of past investments, and the equation is as follows:
ω
τ
is the weight of investment before τ, and It-τ is the amount of investment at constant price before τ. Therefore, we can get the capital stock formula:
Energy input (E): Regional GDP is an indicator of value added. Energy is used as an intermediate input variable, and traditional total factor productivity measurement generally does not take it into account. After considering environmental factors, some scholars have included resource inputs in the calculation of total factor productivity and used it as the main source of undesirable output. This paper uses the energy consumption of standard coal as a resource input indicator.
Output indicators are divided into expected output and undesired output.
Expected output: Expected output is also called “good output”. In terms of expected output, this paper selects the actual regional GDP of each city as the output indicator. Meanwhile, the actual regional GDP of each city is equal to the nominal regional GDP of each city divided by the consumer price index.
Unexpected output: Unexpected output is also called “bad output”. In the study of most scholars, the undesired output mainly uses traditional environmental pollutant emissions such as sulfur dioxide, industrial dust and chemical oxygen demand. However, they neglected the most important environmental pollutant smog at this stage. Taking into account the availability of data, this paper selects industrial sulfur dioxide, industrial wastewater, and PM2.5 as undesirable outputs.
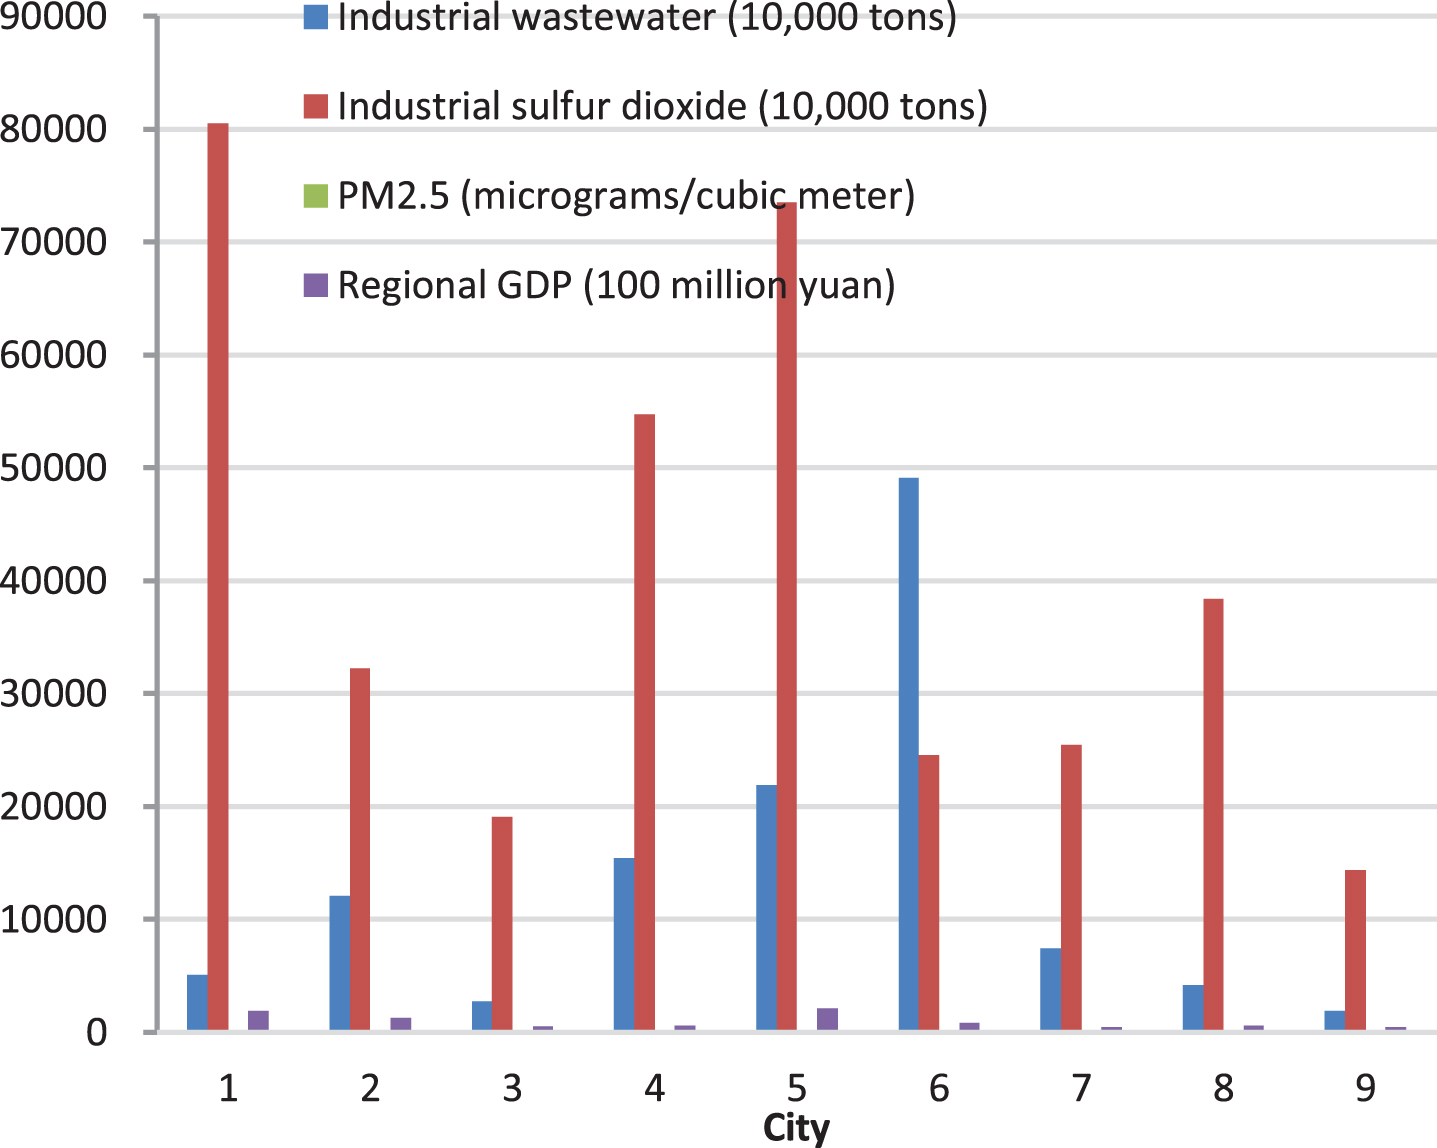
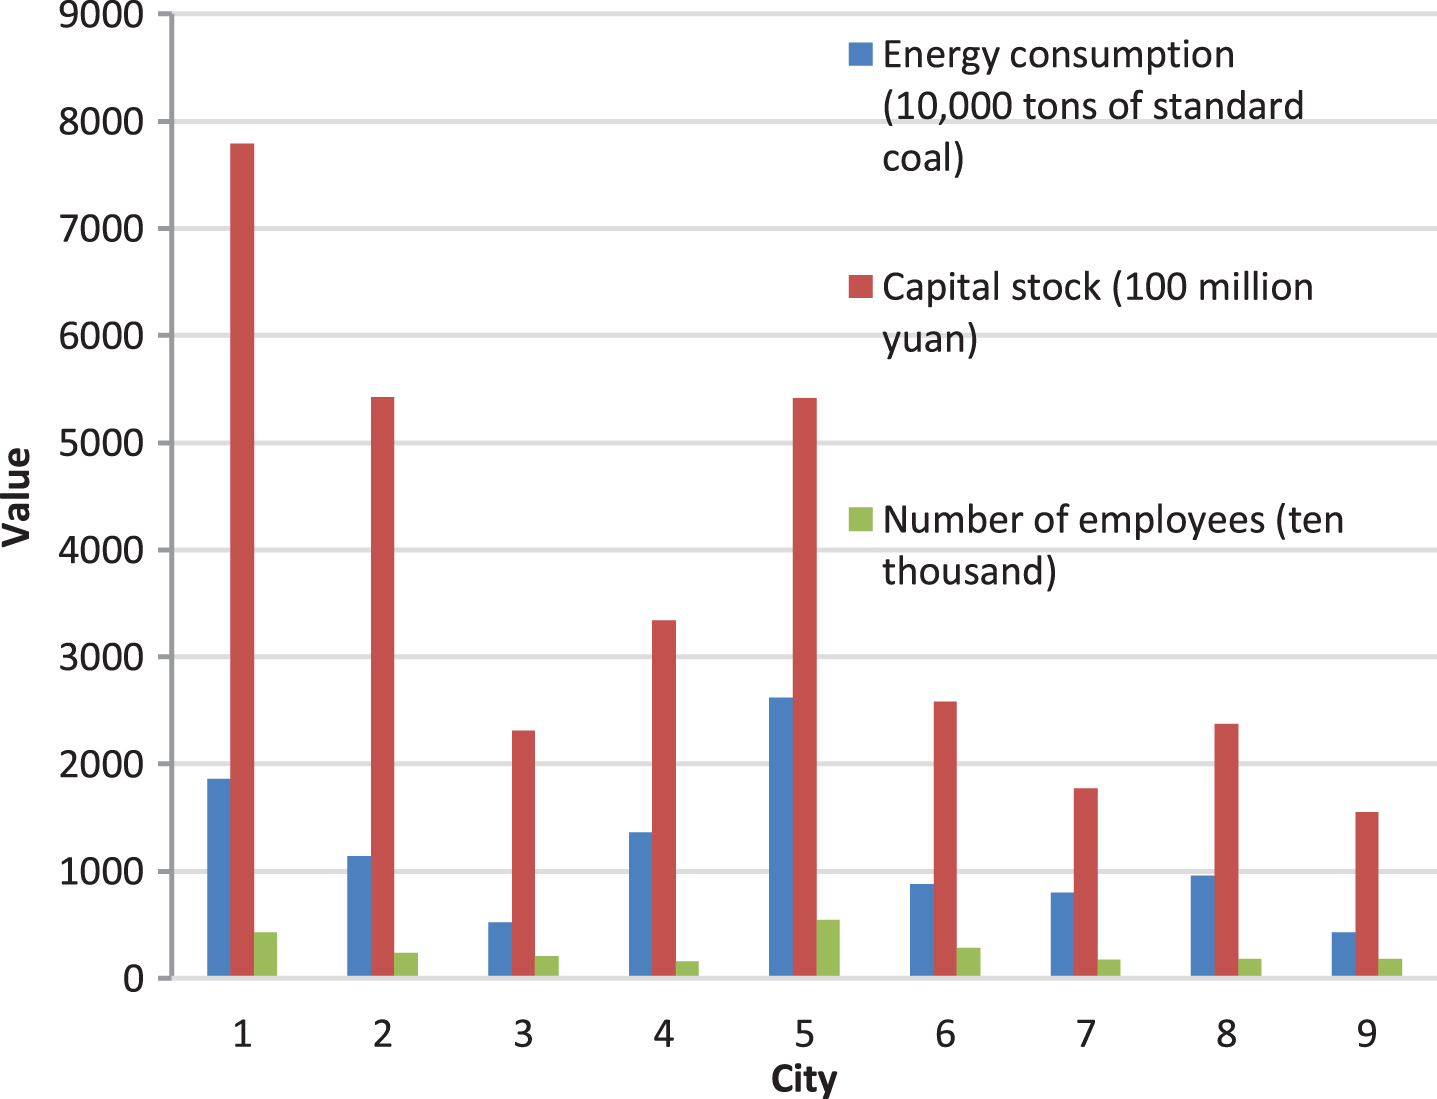
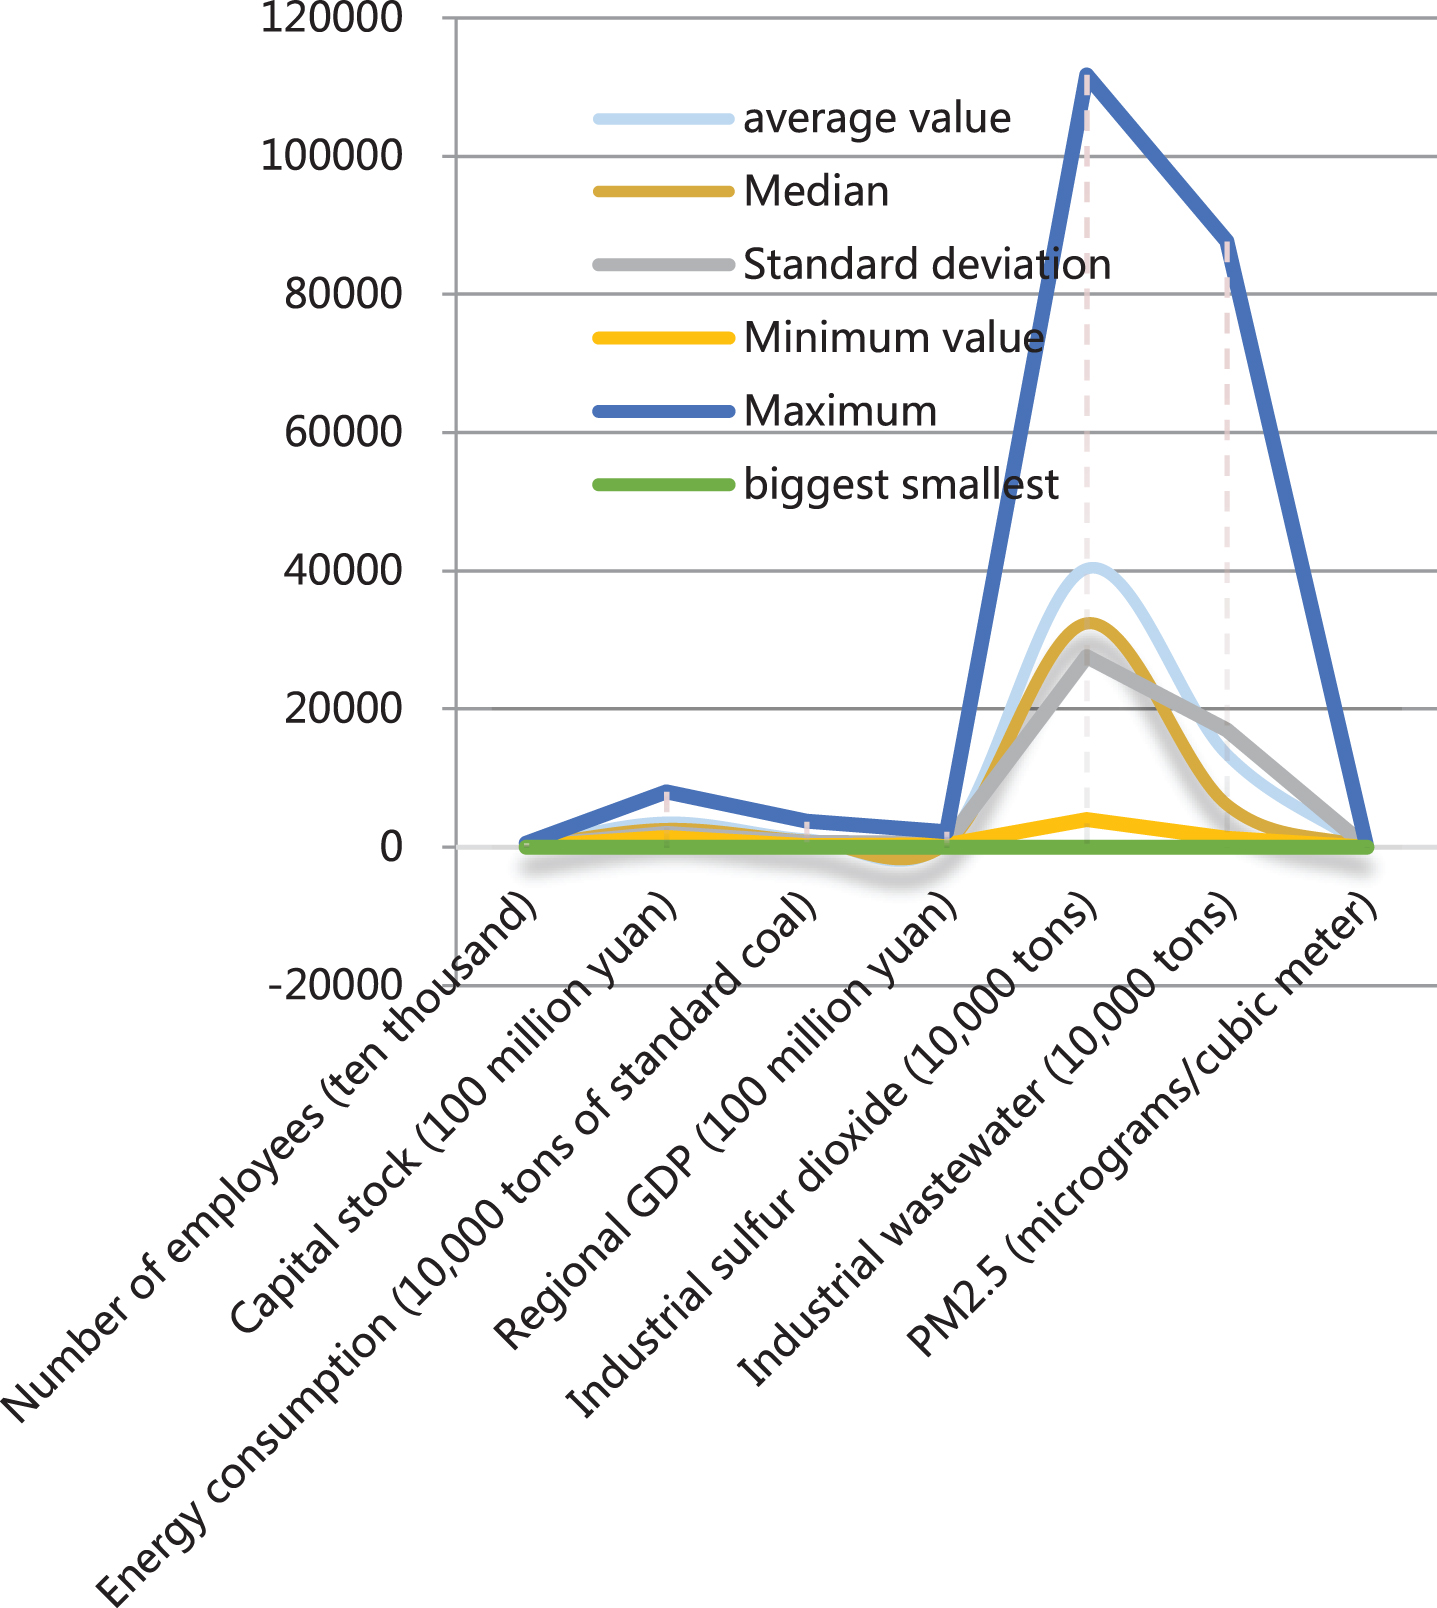
Based on the variables selected above, the data of a region from 2009 to 2019 is collected and collated. The descriptive statistical results of the input-output indicator data of the nine prefecture-level cities are shown in Table 1, Tables 2 and 3, Fig. 1, Figs. 2 and 3.
Average value of output indicators in the region from 2009 to 2019
The average input indicators of each city in the region from 2009 to 2019
Statistical table of the statistical description of the input-output indicators of the cities in the region from 2009 to 2019

Statistical graph of the average output indicators in the region from 2009 to 2019.
Statistical graph of the average input indicators of the cities in the region from 2009 to 2019.
The statistical description of the statistical description of the input-output indicators of the cities in the region from 2009 to 2019.
It can be seen from Table 1, Tables 2 and 3: There is a gap in the economic development level of each city. The impact of economic activities of various cities on the environment varies greatly.
As a non-parametric analysis method, DEA has the advantage that it does not require a specific production function as a prerequisite, and also does not require preset parameters and index weights. It is to transform the objective function problem into a linear programming problem, so that the evaluation result of the decision unit is more accurate and objective. However, when there is excessive input or insufficient output, that is, there is non-zero slack in input or output, the radial production efficiency measurement will overestimate the efficiency of the evaluation object. The angle-based measurement of production efficiency ignores the result of a certain aspect of input or output technology, so it is not accurate. Moreover, too few evaluation units will also bias the measurement of the traditional DEA model. Due to the problems existing in the evaluation of green economic efficiency based on traditional DEA analysis, this paper uses the non-radial and non-angle SE-SBM (Super Efficiency SBM) model that considers undesirable output to measure the green economic efficiency of nine prefecture-level cities.
This paper assumes that each city uses m kinds of inputs
The calculation model of green economy is:
In this section, this paper measures the growth of green total factor productivity in nine prefecture-level cities in the study area. This paper assumes that nine prefecture-level cities (n = 1, 2, ⋯ , 9) used three input factors (m = 1, 2, 3) during 2009–2019 (t = 1, 2, ⋯ , 11) to obtain one expected output (s1 = 1) and three undesired outputs (s2 = 3). The specific measurement steps are as follows:
(1) First of all, this paper puts energy and environmental factors into the productivity analysis framework and builds a productive frontier. Each decision-making unit includes the use of m inputs
The definition of matrix X, Y
g
, Y
b
is as follows:
Then, the best production feasibility set P (x) for each period is:
(2) Secondly, this paper describes the behavior of saving energy, reducing emissions and reducing pollution by solving the directional distance function of SBM. Referring to SBM, the directional distance function is defined as:
(3) Finally, this paper solves the green Lunberg productivity index and its decomposition value to explore the dynamic changes of green total factor productivity and its driving factors.
According to Chambers et al (1996), the Lunberg productivity index between period t and period t + 1 can be expressed as:
Moreover, this paper decomposes green total factor productivity into efficiency change (EC) and technology change (TC).
A Green Lunberger Productivity Index (GLPI) greater than 0 indicates green economic growth, and a Green Lunberger Productivity Index less than 0 indicates a green economic decline. Like other similar literature, technological change is the process of outward movement of the production frontier, which measures the increase in productivity caused by new knowledge, new skills or inventions. Meanwhile, technology change value greater than (less than, equal to) 0 means that technological progress promotes (impedes, does not affect) green economic growth. Efficiency change refers to the change in the distance between the production frontier and the actual output. At the same time, an efficiency change value greater than (less than, equal to) 0 means that efficiency improvement promotes (impedes, does not affect) green economic growth.
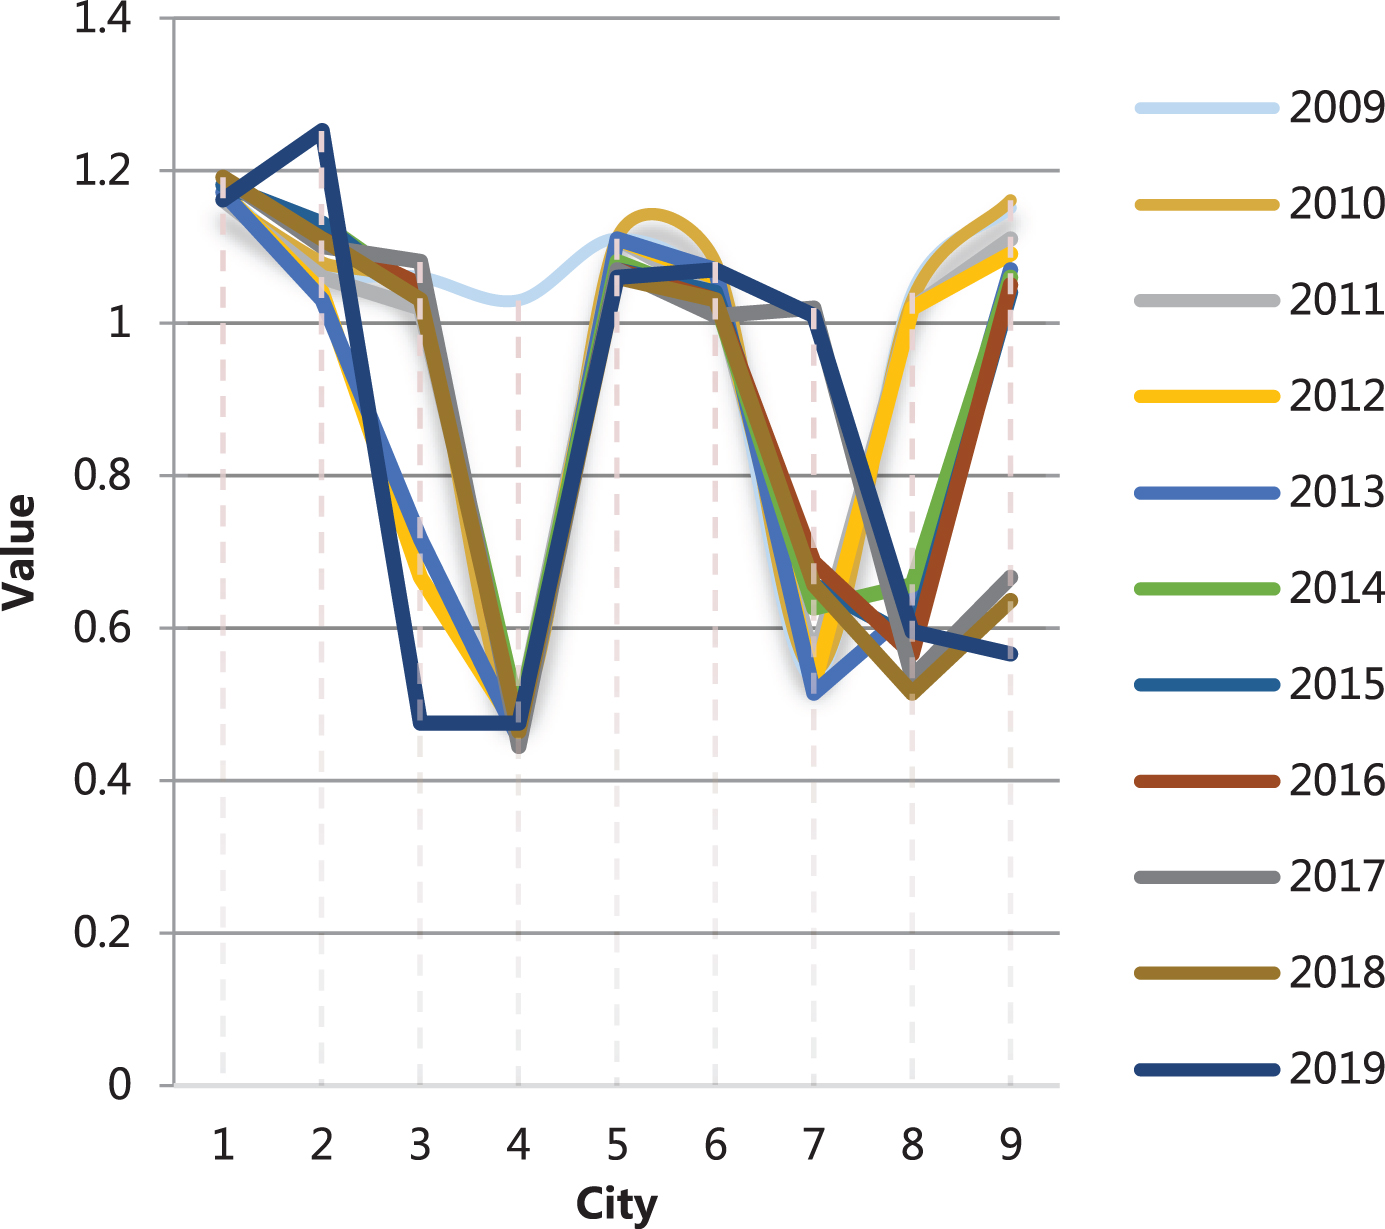
This paper uses Maxdea software to estimate the 2009–2019 green total factor productivity growth rate and its decomposition value in 9 prefecture-level cities. The specific measurement results are shown in Table 4, Tables 5 and 6, Fig. 4, Figs. 5, and 6. Among them, the green Lunberg productivity index, efficiency change value and technology change value are expressed by GLPI, EC and TC, respectively.
Growth rate of green total factor productivity by city
Efficiency change rate of various cities
Technology change rate of various cities
Statistical graph of the growth rate of green total factor productivity by city.
Statistical chart of the efficiency change rate of various cities.
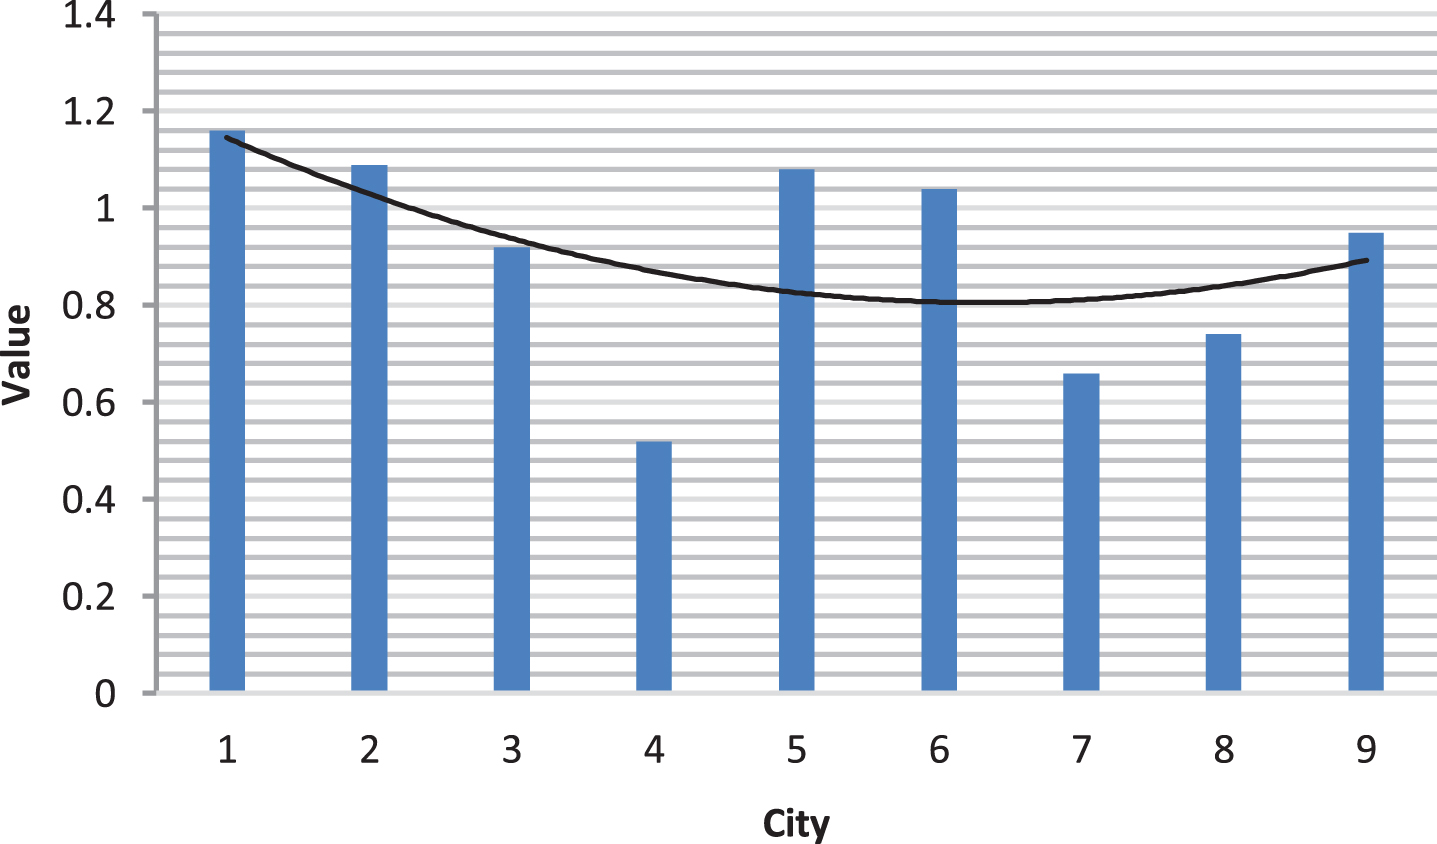
Statistics of technology change rate of various cities.
Table 7 shows the influencing factors of green economic efficiency. Through analysis, we can know the impact of various factors on the efficiency of green economy. Among them, economic development and green economic efficiency are negatively correlated, and the regression coefficient is significant at 0.1%. The reason is that in the early stages of economic development, people are mainly concerned with the growth of the production economy, without considering the constraints of environmental resources. In addition, the coefficient of the quadratic term is positive and the significance is more than 1%, It shows that when the economy develops to a certain stage, with the improvement of the economic level and the rise of per capita income, the degree of attention to the environment is also rising. At the same time, green economic efficiency supports “environmental Kuznets curve”.
Analysis of influencing factors of green economic efficiency
The impact of industrial structure on green total factor productivity. The regression results in Table 8 show that neither the proportion of GDP added by the secondary industry nor the proportion of GDP added by the tertiary industry has a significant effect on green total factor productivity, with P values of 0.440 and 0.989, respectively. The reasons why the industrial structure is not significant to green total factor productivity are as follows. On the one hand, the explanatory variables may be insignificant because the amount of data is not large enough. Although the above method can solve insignificant problems to a certain extent, it cannot be completely eliminated. On the other hand, the impact of industrial structure on green total factor productivity is more reflected in the long-term growth effect, and the transformation of industrial structure is also a long-term concept. Therefore, in the short term, the impact of industrial structure on green total factor productivity has produced insignificant phenomena.
Analysis of influencing factors of green total factor productivity growth
First of all, based on the problems existing in the analysis and evaluation of green economic efficiency by traditional DEA methods, this paper uses a non-radial and non-angle SE-SBM model that considers undesired output to measure the green economic efficiency of nine prefecture-level cities. Moreover, this paper analyzes the differences and development trends of green economic efficiency in each city from the perspective of time and space and conducts redundancy analysis and convergence test. Secondly, this paper considers the green Lunberg productivity index of energy and environmental factors and the relaxation effects of input, expected output and undesired output, and double decomposes it to measure the green total factor productivity growth of 9 prefecture-level cities. Further, this paper uses the panel model to conduct an empirical analysis of the factors that affect the efficiency of green economy and the growth of green total factor productivity.
From the perspective of the research content, most scholars’ research on green economic efficiency focuses on the measurement of “efficiency” in the “static” sense and ignores the measurement of green total factor productivity growth in the “dynamic” sense. However, this paper combines the two, which is the innovation of this paper.