
Abstract
Nowadays, the Expansion and evolution of the global financial system oblige lenders to develop stricter requirements for assessing creditworthiness of borrowers. This paper analyses the problems prevalent in the existing credit models of coastal cities in China Pearl River Delta, including data centralization, difficulties in detecting forged data and delay in data transmission; we constructed a CDDC model based fuzzy sets that employs all the issues. The related results showed that the technology fuzzy sets decentralizes and expands data sources, acquires and processes data automatically and self-perfects its ability to rank borrowers into cohorts of creditworthiness. Moreover, the CDDC model out-performs the traditional model in assessing creditworthiness and reducing delinquencies and defaults. That means our fuzzy sets model employs decentralized data sources, destroys historical data regularly and facilitates training and improvement. It ranks creditworthy borrowers in a better fashion than the statistics-based traditional credit model.
Introduction
Nobel laureate Robert Mondale prophesied that the global financial system inevitably will become more complex, but assessments of creditworthy borrowers will guide its development and will remain its foundation as well as the cornerstone of national economic development. Its over-emphasis on subjective evaluations subverts scoring capital valuations objectively. Moreover, difficulties in recognizing altered and forged data delay transmission and impede efficiency. Above all, these problems render the traditional model ineffective for identifying the creditworthiness of cohorts of borrowers.
When scholars and practitioners recognized that the decentralization and the non-tamperable characteristics of blockchain technology can potentially solve these problems, the coin-day destruction credit model (CDDC model) emerged. It adopts the blockchain and takes ‘coin-days’ as the meridian for eliminating historical data. By doing so, it reduces alteration and falsification of data while automating and decentralizing data processing. The CDDC model uses multiple indexes to evaluate borrowers and incorporates big data into a decision tree. Its neural network enables repeated evaluations of the model’s efficiency in conon the application of this technology for financial junction with indexes and resolves problems with traditional credit models, allowing lenders to assign borrowers to appropriate cohorts of creditworthiness.
This paper is divided into four further sections. Section 2 introduces our research framework, compares blockchains and traditional credit models, introduces the concept of coin-day destruction and presents the construction of our model. Section 3 presents our CDDC model, highlighting data selection, construction, training and verification. Section 4 discusses results and evaluates the CDDC model’s effectiveness. Section 5 suggests its practical applications.
Literature review
A blockchain facilitates transactions and assures authenticity of data through cryptographic verification. Its chain structure simplifies systems and enhances data transmission. Through cryptography blockchain technology secures electronic data, guarantees its reliability and protects it from attack. Such an approach can be widely used in electronic data and equity transaction processe. The recent highlights of the global financial blockchain research have focused payment services. Features such as decentralization, maintenance of trustless consensus, collective maintenance and database security have drawn attention to blockchain-based credit systems globally [1]. Further, blockchain technology’s decentralization and peer-to-peer exchanges reduce dependence on third-parties, and distributed storage enhances security and transactional efficiency. The blockchain improves lenders’ operational efficiency while reducing costs, risks and compliance burdens. It brings revolutionary change in credit assessment [2].
Credit evaluations based on data flow are superior to traditional scoring-based credit assessments [3]. Operator data are important in constructing and improving the credit model. Credit information and risk prevention data are essential for the construction of the credit model to ensure the controllability of risks during the process of credit evaluation. Although the traditional credit assessment model incorporates extensive borrower information, it does not consider borrowers’ systemic social and economic risks [4].
In addition to the traditional data dimensions such as financial strength and user background, a credit assessment model that takes into account borrowers’ potential and geographical location using big data is more scientific and effective than the traditional model [5]. A traditional credit model struggles to discern false information and guard against systemic risks, so dubious information must be screened from a reversed direction. Introduction of the auxiliary model has improved risk identification [6]. A credit assessment model should not only identify a borrower’s creditworthiness in advance but also evaluate risks continuously.
Blockchain technology can establish a comprehensive commercial credit assessment system led by one central department that links multiple organizations and shares information equally. The credit system based on data flow is superior to the traditional credit evaluation system based on expert scoring. The introduction of operator data plays an important role in the construction and improvement of the credit model. Credit information and risk prevention data are essential for the construction of the credit model in a way that they ensure the controllability of the risks during the process of credit evaluation. While as much personal credit information has been included as possible in the data of credit model includes personal credit information, the systemic risks brought about by the social and economic environment through macroeconomic variables still needs to be taken into account. The inclusion of business potential and geographical location in the construction of credit management system with big data is deemed more scientific compared to the traditional method, not to mention that the evaluation effect is also better. With the traditional credit model, it is not only difficult to identify false information in just one attempt, but it is also not possible to guard against the systemic risks, so it is necessary to screen the dubious information from a reversed direction. The introduction of the auxiliary model has greatly improved the success rate of risk identification. The credit management model should control the customer’s credit in advance and monitor the risks that enterprises may face through continuous screening and evaluation. In combination with the block chain, there are two main points to which the future innovation of credit management theory can be directed: one is the establishment of a commercial comprehensive credit management system that is led by the central department, joined by multiple organizations, and features the sharing of information on an equal footing; the other is the combination with big data to create a refined and standardized credit model with an improved predictive capability.
Research method
Section 2 discussed the theoretical basis of introducing blockchain mode and big data algorithm into credit management, taking the biological logic of collective intelligence, information sharing logic and smart contract theory as the links, while introducing the ideas of blockchain decentralization, egalitarian participation, automation, coin-day destruction and data sharing into credit management. Next, the model is introduced in detail.
Model
Unlike a traditional credit model, the CDDC model uses ‘coin-days’ as an indicator to replace the cash flow index in the traditional model, reflecting a borrower’s cash flow. Coin-days eliminate the possibility of falsifying historical data and historical cash flow through repeated transfers.
The CDDC model embodies decentralization, coin-day destruction and automation. The model weights near-term data more heavily and reduces their weightings as they age until they are destroyed. Considering that relatively old historical data have limited reference value, in each of the different stages, the weightings of the historical data should be redistributed according to the time span and destroyed according to the idea of coin-day destruction [7]. The CDDC model is automated in three respects. First, it automatically collects data for specific fields and converts semi-structured data into standardized data for processing. Second, it automatically adjusts model parameters and weights. Third, a machine learning algorithm constantly adjusts the model’s accuracy on the basis of the feedback results of the model evaluation.
The CDDC model reduces reliance on single agencies for data and decentralizes collection of data from open sources. Alongside the financial data customarily collected by credit information services, it accesses borrowers’ life and work informatio, extensive administrative data and side-data captured by crawler algorithms. The CDDC model’s machine learning algorithm uses the neural network, decision trees [8, 9], K-neighbour classification, support vector machine classification, pattern recognition, K-means clustering and other algorithms to adjust the model. It uses indexes such as CAP and K-S to evaluate existing models. The model’s parameters and weights adjusted per predetermined rules according to feedback. The algorithm is decentralized in that all parties may accept or reject rules for adjusting parameters and weights.
Technology
Accommodating the needs of the traditional model and big data, the CDDC model first screens indexes for entry using information values (IV values) and random forests. Collinearity is eliminated by disassembling and reassembling indexes in temporal sequence. During the design stage, the model uses simulated data that match the characteristics of actual data. Its workflow appears as shown in the Fig. 1 below.
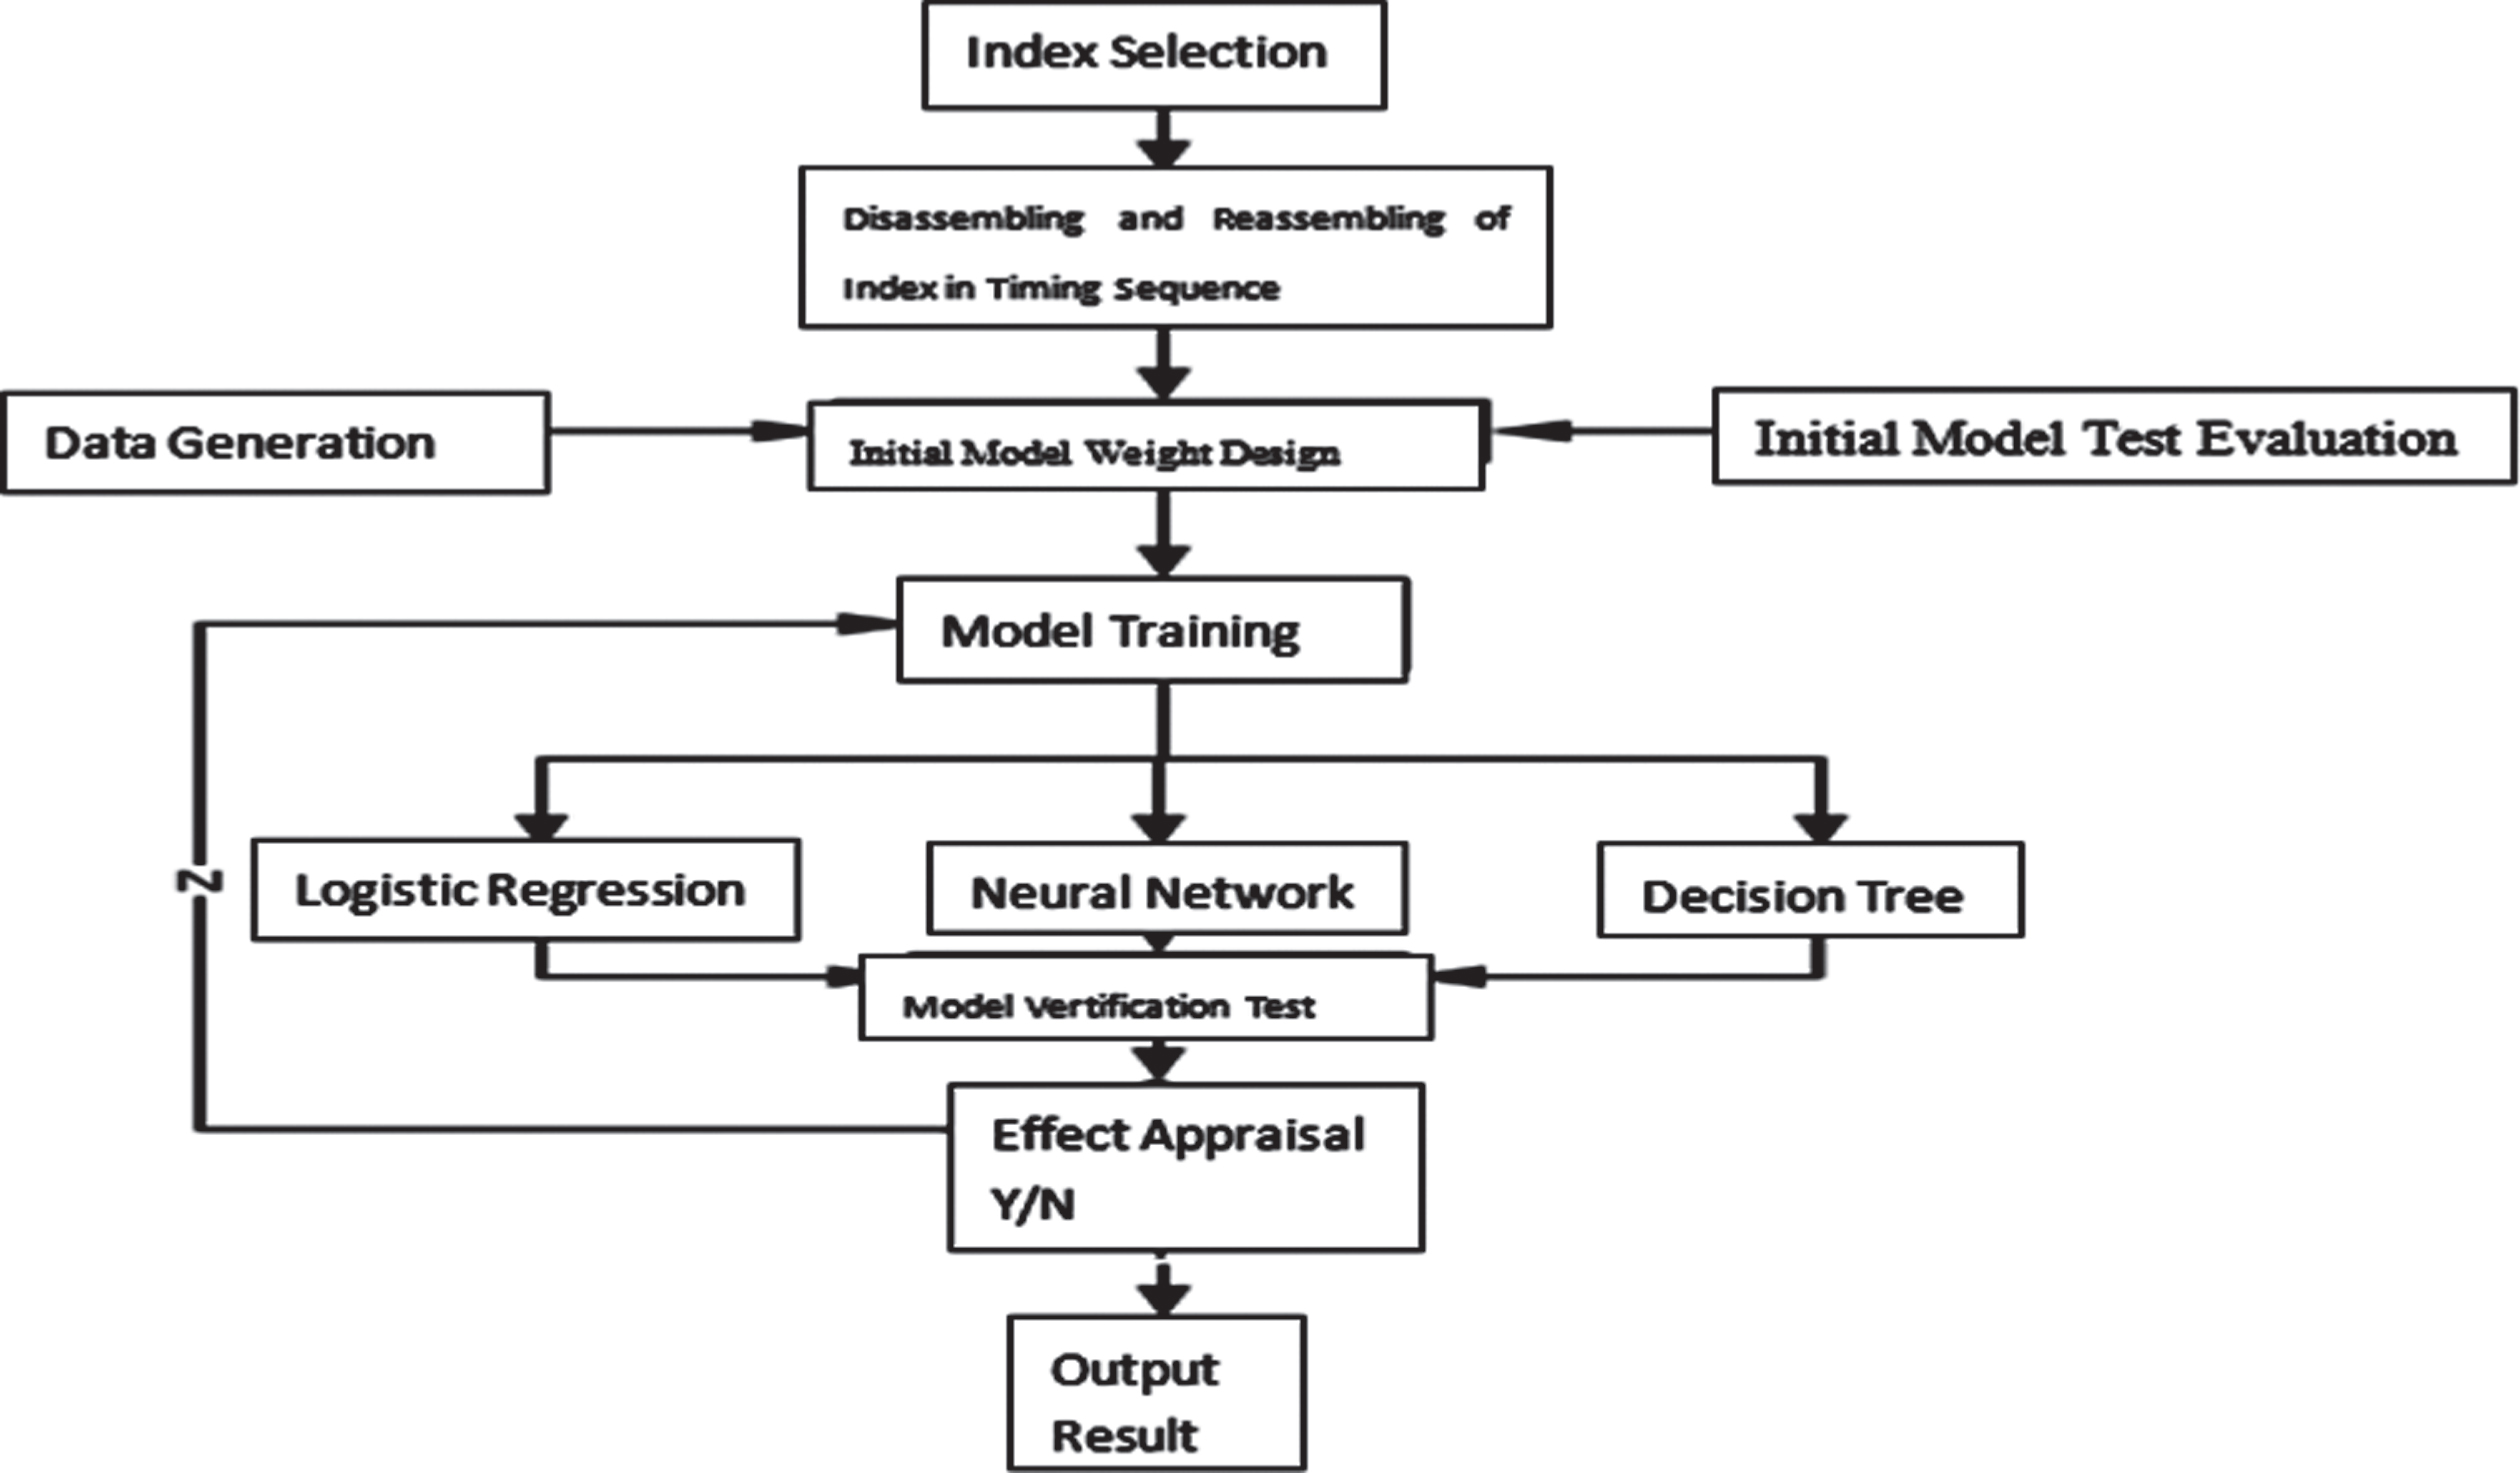
Workflow of CDDC model.
First, data are discredited by IV value, and lift values of each variable are calculated to measure the percentage of dishonest applicants. A high proportion of dishonesty indicates that distribution of a variable is overly centralized and merits deleting. Equation (1) delivers the weight of evidence (WOE) value of the index.
IV value can be calculated per Equation (3) and Equation (4).
IV value also refers to the predictive ability of the index on the target variable. High values may result from unevenly distributed data in the training set. Low values indicate poor predictive ability of the trained indices. We exclude indices with overly high and low IV values.
The random forest method divides the dataset by selecting characteristics and screening them according to the predictive ability of the index. The method lets the model process massive data rapidly and is widely used in finance to choose indexes. Implementation is as follows: ① We selected N samples with replacements as root nodes for the decision tree from the sample and used them as training set data. ② Among M attributes of each index, we selected as many m as split attributes for the nodes, after which we selected one type as a split attribute.
We constructed a decision tree and random forest by repeating the above steps to calculate eigenvalues of the index and to screen it into the model according to the correlation of variables. Use Python to select 46 among 180 indices to enter the model by combining both methods. We used logistic regression to design the model’s initial weightings. According to WOE values, we assigned weights to each index and each level. The scoring range was 0–2,000 points with a benchmark of 1,200.
Model training
The logistic regression model should be trained to construct data for the training set. Following the initial calculation, the model can be improved constantly by iterative recalculation to adjust the index and weightings. To train the model we used logistic regressions, neural networks and decision trees. We assessed the effectiveness of training using F-scores, ROC curves, AUC values and K-S values. We used these methods in each step of training and chose the optimal result as the basis for the next training. We repeated these steps until we reached a satisfactory result. The training process is shown in the Fig. 2:
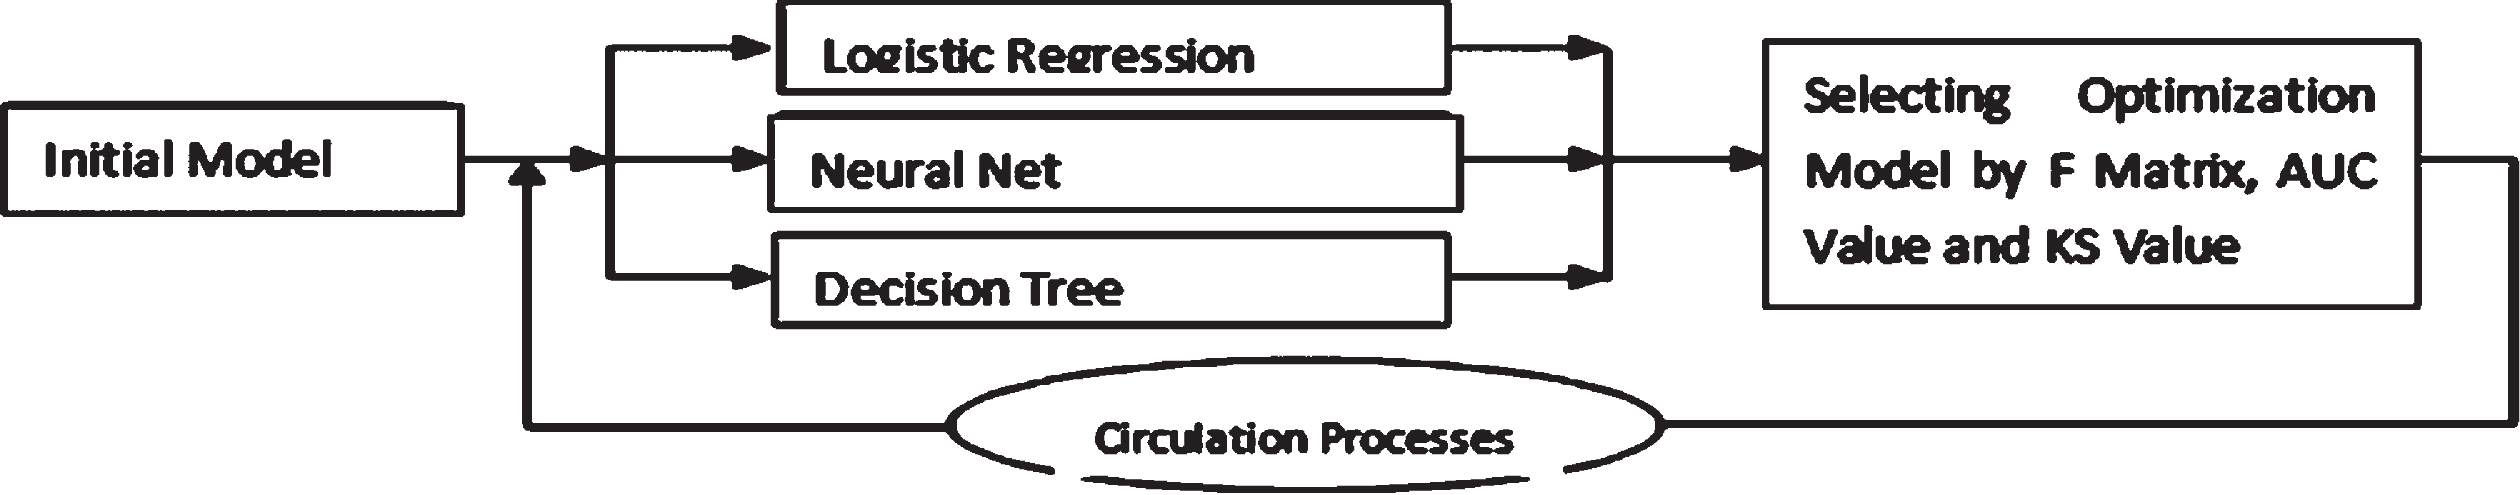
CDDC model training process.
Section 3 introduced the construction and training process of the CDDC model. After the initial model had been constructed and each step of training has been completed, the effectiveness of the model was evaluated. The results of which will be introduced hereinafter in this chapter.
Data description
To preserve security and privacy, the CDDC model uses simulated data randomly generated to match the distribution of actual credit information. Collection from multiple sources assures data are decentralized. Numerical variables are generated randomly to accord with the skewness and kurtosis of actual normally distributed data. Nominal variables are generated randomly to accord with the distributed relations among dependent variables that indicate whether borrowers have breached a contract and the independent variables. Our simulated data mimic actual data and are sound simulacra. The initial sample generated 15,000 data points.
Using the initial model, we generated 3,000 samples for 46 indicators as initial test sets. To verify the effectiveness of the model’s design and weightings, we compared results with a set of dependent variables from the samples (see Table 1).
Evaluation of initial data
Evaluation of initial data
F-scores show that the model correctly assessed 95% of actual creditworthy borrowers and erroneously assessed 5% as less creditworthy—a false acceptance rate (FAR) of 5%. The model correctly assessed 98% of less-creditworthy borrowers and erroneously assessed 2% as creditworthy—a FAR of 2%. The nearer the ROC curve is to (0, 1), the greater is the deviation from the 450 diagonal, which shows the greater effect of the model. The AUC value lies beneath the ROC curve; the closer it is to 1, the greater is the model’s effect. The AUC value of the initial model (0.872) indicates relatively good recognition performance. K-S values span 0 to 1 and distinguish between positive and negative samples in the model. The initial model’s K-S value (0.612) indicates it distinguishes cohorts of creditworthiness well.
Each of the model’s 10 training iterations randomly generated 3,000 data points. Our guiding intentions were to minimize risk of delinquency and default and to expand identification of less-creditworthy borrowers (see Table 2).
Comparison of the 1st Training
Comparison of the 1st Training
After 10 iterations, the CDDC model’s ability to assess creditworthiness gradually stabilized. In practice the model generally can identify dishonest borrowers regardless of disguise. Even if applying the model reduces lending, it better assures that less-creditworthy borrowers are not deemed creditworthy, thereby reducing delinquencies, defaults and losses (see Table 3).
Comparison of the 10th Training Iteration
After construction and training, we used customary factor analysis and regression to construct a traditional credit model as a baseline for comparison with the CDDC model. We constructed the traditional credit model as follows. We reduced the dimension of variables by factor analysis and extracted effective informational features among index data. We found that 70.52% of effective information in the 10 factors was extracted. Through stepwise regression we selected seven initial factors in the regression. Chi-square tests show significant effects on dependent variables.
We applied the traditional and the CDDC models to 3,000 data points from the tenth training iteration. We used F-scores, K-S values, ROC curves and AUC values to evaluate and compare. Results are as follows (see Tables 4 and 5):
Evaluation of the CDDC Model
Evaluation of Traditional Credit Model
Looking at the F matrix and basing on the principle of risk minimization, the recognition ability of less-creditworthy borrowers was put into more focus. Results indicate the CDDC model identified 100% of questionable borrowers from the 3,000 samples, whereas the traditional credit model could only identify 89% of them. Defaults and delinquencies potentially are less under the CDDC model. Its K-S value (0.658) exceeds that of the traditional credit model (0.436), indicating the former is more discerning than the latter. The ROC curve of the CDDC model lies above that of the traditional credit model, indicating a greater coverage area. AUC values are 0.896 for the CDDC model versus 0.759 for the traditional model. Irrespective of the index, the CDDC model surpasses the traditional credit model.
We assigned both models 2,000 points and compared their default-delinquency rates after grouping users (see Tables 6 and 7).
Credit Grouping Strategies under the CDDC Model
Credit Grouping Strategies under the Traditional Credit Model
With 1,200 points as the lower value, default/delinquency rates in the CDDC model are 0.11% versus 0.32% in the traditional credit model. Again, the CDDC model better recognizes potential for defaults and delinquencies.
This study has applied blockchain technology to resolve deficiencies in traditional credit assessment models. After explaining the merits of blockchain technology, we constructed a CDDC model that employs it. We showed that it decentralizes and expands data sources, acquires and processes data automatically and self-perfects its ability to rank borrowers into cohorts of creditworthiness. Moreover, the CDDC model out-performs the traditional model in assessing creditworthiness and reducing delinquencies and defaults.
Nonetheless, our CDDC model needs enhancements. Constrained conditions prevented the model’s initial design from attaining universal participation and data-sharing. Therefore, interfaces in the model need to be coded for improvement and more data platforms should be considered for access. Information sources need to be expanded to cover all credit data and the blockchain-based data-sharing platform needs to be established to expand the model’s application. We designed the CDDC model to sort borrowers into credit cohorts and minimise misidentifying less-creditworthy borrowers as creditworthy. Future CDDC models need to incorporate borrower experience, among other factors, and reduce false acceptance of less-creditworthy borrowers through multidimensional identification.
Footnotes
Acknowledgments
This paper belongs to “the Provincial Department of education in Science and technology project 2019” under Grant [number GJJ190271].