






Abstract
Brain-Computer Interface provides and simplifies the communication channel for the physically disabled individuals suffering from severe brain injury related to brain stroke and lost ability to speak. It helps these patients to connect with the outside world. In the proposed work, the electroencephalogram signal is used as an input source taken from Bonn University database that is divided into three class of data consisting of 247 samples each. It is further processed by Tunable Q-Wavelet Transform signal decomposition technique where the signals are subdivided into various sub-bands depending on the value of Q-factor, redundancy factor, and number of sub-bands. A novel custom technique uses Q-factor of 3, redundancy value of 3 & 12 number of sub-bands for high pass filtering as well as Q-factor of 1, redundancy value of 3 & 7 number of sub-bands for low pass filtering combined with nine statistical measures for feature extraction purpose. The classification is performed by using multi-class support vector machine giving the accuracy of 99.59%. The accuracy performs best when compared with the existing research results Furthermore, the comparative study has been performed on the same dataset by using deep neural network along with support vector machine giving an accuracy of 100%. Other evaluation parameters such as precision, sensitivity, specificity, and F1 score are also calculated. The classified data help transform the signal into three communication messages that will help solve the speech impairment of disabled individuals.
Keywords
Introduction
Brain-computer interfaces (BCI) helps in analyzing the bio potentials signal acquired from the brain activity. It extract the information and decode them into various messages that are communicated to interfaced devices to predict correct gestures of the disabled person. The chief objective of this type of BCI system is to exchange or retrieve suitable information from disabled people who are suffering from Neuro degenerative diseases such as cerebral palsy, stroke, amyotrophic lateral sclerosis, one or other type of spinal cord injury.
Basically, to interrelate, affect or to give stimulus to the environment, the brain activity signals are used by the humans. Brain-Computer Interface is the fastest developing technology which helps the person having difficulty in the movement of limbs or to express their thoughts by aiding them with the proper assistive devices. Hence, it becomes the important area of public cognizance.
Modern days BCI uses Electroencephalogram (EEG) to obtain activity in the brain which helps in performing various tasks such as the movement of cursor, selecting particular letter or alphabet in the BCI system or to help the disabled person with neuroprosthesis. BCI thus uses the transformation algorithm to convert this brain activity signal obtained from the patient into output signal which further helps in predicting the thoughts of the disabled person. Person suffering from stroke or any such disorder recuperates with the help of BCI interfaces. To enhance the performance of medical professionals or surgeons, it is very helpful in future. This technology is providing the motivation in the field of research and development to help medical practitioners, scientists, doctors and public, etc.
The decryption of the EEG signals related with the whole body motion, various senses & motor imagery are the main focus of BCI studies. Thus, it became very important to cognize the various experimental prototype used in the BCI system. In order to operate the neuro rehabilitation devices, the basic tasks is to select the most suitable BCI application amongst the existing options. Various acquirement methods like functional magnetic imaging (fMRI), Infrared Imaging (IR) or positron emission tomography etc. are used to capture the actions related to brain. But, Electroencephalogram (EEG) is found to be the most useful for Non-invasive approach.
BCI system can be used to reflexively deploy the thoughts of the person who unable to speak. Establishment of communication link between the BCI system and brain can be done by using invasive or non-invasive recording technique. The former uses the implanted electrodes in the body while the later uses the acquired signals like EEG, Magnetoencephalograhy, Spectroscopy, etc. EEG based BCI system are frequently used because of its various advantages like portability, low setup costs, non-invasive nature and high temporal resolution. To drive such EEG based BCI system, the synchronization of motor imagery plays an important role.
In literature, assessing various EEG based BCI models concerning their pros and cons from various perceptions are going on. EEG decryption algorithm & classification methods are assessed for each model. Brain controlled wheelchair has been developed for paralyzed person to move from one place to another which shows BCI technology plays a vital role in development of the medical support system. In various Psychiatric & neurological diseases such as Alzheimer’s disease where the patient loses the ability to communicate, BCI system helps them to convey their thoughts & emotions with the help of such systems. Thus, BCI system proves to be the boon for the paralyzed or disabled person [1].
Normally, evoked EEG and spontaneous EEG are two types of signal used in BCI system for recording the signal. Evoked EEG is the result of neural stimulus while spontaneous one results from precise mental activity. For testing the probability of identifying a couple of mental tasks from the available EEG signal various new approaches has been taken into consideration. To assist the paralyzed and disabled person for communication, brain computer interface can be used. For this process, it typically uses motor imagery based EEG signal. EEG signal are very sensitive to the artifacts because of its non-stationary nature. The mood, posture, mental or physical state of the patient are the different sources of artifacts for EEG signal [2]. EEG signal based night time polysomnography recording is time consuming, costly and person dependent. However, the essential step of feature extraction is achieved for data reduction to obtain the values after preprocessing which is stimulating task due to difficulty and variability of this non stationary complex signal [3].
BCI technique is very useful for the disabled people to communicate with the outside world. In most of the EEG based BCI system, feature extracted depends on frequency characteristics of individual channel and do not consider the correlation between different channels. In this work, for the improved feature extraction purpose, wavelet packet and common space pattern (CSP) is used. Firstly, the author uses wavelet packet decomposition for the desynchronisation of the EEG signal into beta rhythms & co-rhythms and then spatial filtering is applied through CSP algorithm to calculate the wavelet energy as well as to extract the features. Because of the use of two techniques, the correlation information between the channels is obtained. Support vector machine is then used to provide high accuracy in classification [4].
Brain signal i.e. EEG are recorded by the wearable scalp with the help of electrodes. It plays a very important role to find out the disorder and disease that affect the brain. But, such signals are non-stationary, non-linear and weak in nature as it consists of artifacts as well as noise. So, for analyzing such type of EEG signal higher order statistical features must be used for better signal processing. The single component obtained from every channel of EEG signal is called as event related potential. Thus, ERP is helpful to detect and extract the single component produced by precise event while EEG signals helps in extracting the features [5]. Li Shunan et al. analyzed the EEG signal and worked on synchrony analysis which is a method of feature extraction creates relations between pair of signal [6]. Earlier research work uses wavelet coefficients, entropy based feature and fractal dimension entropies which are nonlinear methods applied to identify the disease. The Nonlinear features obtained from data of epileptic subject is used for trail to diagnose the disease. 50% (normal) -50 % (suspected) mix sample of data is used from whole brain with six different features helps to identify the disease [6].
Navid Ghassemi et al. developed a novel approach of diagnosis of epileptic seizures by using EEG signal. The foremost step is to decompose the signal into different windows in which high pass filter mask of 0.5 Hz cut-off frequency is passed. The specific values of tunable – Q wavelet transform gives the segmented signal into nine different sub-bands. The Hybrid features i.e. a mixing of statistical features, various entropy features and nonlinear fractal dimension features such as katz etc. are extracted from each sub-band to give the feature value to the classifier. Binary and multi-level classification had been taken in the work for 5, 10, 23 sec signal. It outperforms compared to the other method of same disease detection. The work also used hybrid combination of Matlab and Python for incorporating feature extraction and classification respectively [7]. Bio potentials signal like EEG uses tunable-Q wavelet transform to perform disintegration of signals to eight different frequency sub bands. It outperforms as compared to other conventional transform of wavelets in which adjusting the Q factor is not possible. But in TQWT, signals are adjusted in accordance with Q factor. TQWT shows better localization in time and frequency domain so it is best for time frequency representation of signal [8].
The Spontaneous diagnosis of disease basically depends on the classification of bio-potential signal with the help of feature extraction & pattern classification. From the development of artificial intelligence field, it has been proved that deep neural network is very suitable for the same purpose as it can classify the huge amount of data which further leads to feature extraction and automatic diagnosis of disease. So, it operates better than any medical professional. Jingshan et al. used two dimension deep convolutional neural network (CNN) to classify the bio potential signals into five classes. For this purpose, the author first transformed the five classes of data and converted the time domain data into frequency domain and then gave the same as input to the 2D-CNN. The classification results shows that with 2D-CNN model the accuracy of 99.00%, size of batch parameter of 2500 with lowest loss are obtained. The author also compared the performance of 1D-CNN model with the 2D-CNN model but the accuracy with the former one is only 90.93%. Thus, the conclusion is drawn that 2D-CNN model is the best for the classification purpose [9].
Shalu et al. proposes deep convolutional neural network (DCNN) for motor imagery actions acknowledgement in the designed system. The proposed method firstly transforms the EEG signal into images and then symbolizes it in time frequency representation using various transforms like STFT and CWT followed by signal classification using deep convolutional neural network (DCNN). The parameters such as specificity, sensitivity, F1-score, kappa value and accuracy are used for the evaluation purpose. The result shows that CWT has better accuracy of 99.35% then STFT [10].
Choong Wen Yean et al. reviewed in the clinical studies that classification problem can be solved best by using machine learning algorithms. The primary objective of this work is to link the different distance metrics of EEG signal and to classify the input data. The nearest class for classification is considered by distance metrics through K-Nearest Neighbor (KNN) classifier. In this study, it is reviewed that city block distance evaluation parameter outperforms well as compared to other conventional method of classification [11].
In our proposed work, the EEG signal are decomposed by using tunable Q wavelet transform into various sub bands, which are processed along with nine statistical measure to multi class SVM and deep neural network classifier to classify the communicating messages with greater accuracy as compared to previous work done. The later part of the article is arranged as follows: Section II describes the design methodology of the system, TQWT decomposition, extraction of feature. Section III gives the information of features vector processing in classifier. Section IV describes the result with evaluation parameter and conclusion part.
Design methodology
The structure of the complete design methodology is shown in Fig. 1 and detailed description of the work is mentioned in this section in which EEG data is separated into three class of data from the original raw time series database. Total 247 files are presented in each class of the database. Each file is having 4096 sample values in it. The EEG signal is decomposed by using tunable Q wavelet transform which decays the signal into various sub bands depending on the system structural value of K which gives higher and lower frequency values of filter bank. For high pass filtering, the value of K = 12 which gives 13 sub bands and for low pass filtering, the value of K = 7 which gives 8 sub bands are used. In feature extraction, the 13 decomposed signal values for high pass and 8 decomposed signal values for low pass are then passed with the nine statistical measures to give the 117 feature value of one set and 72 feature value for another to get total 189 feature vector per segment or per sample. As the number of sample is very large compared to the number of features taken in the proposed work, the comparative study of SVM and deep neural network are also required. Furthermore, the set of extracted features are given to the SVM classifier as well as deep neural network classifier to identify the brain activity so as to relate the classified output to give communicating information or messages from the subject.
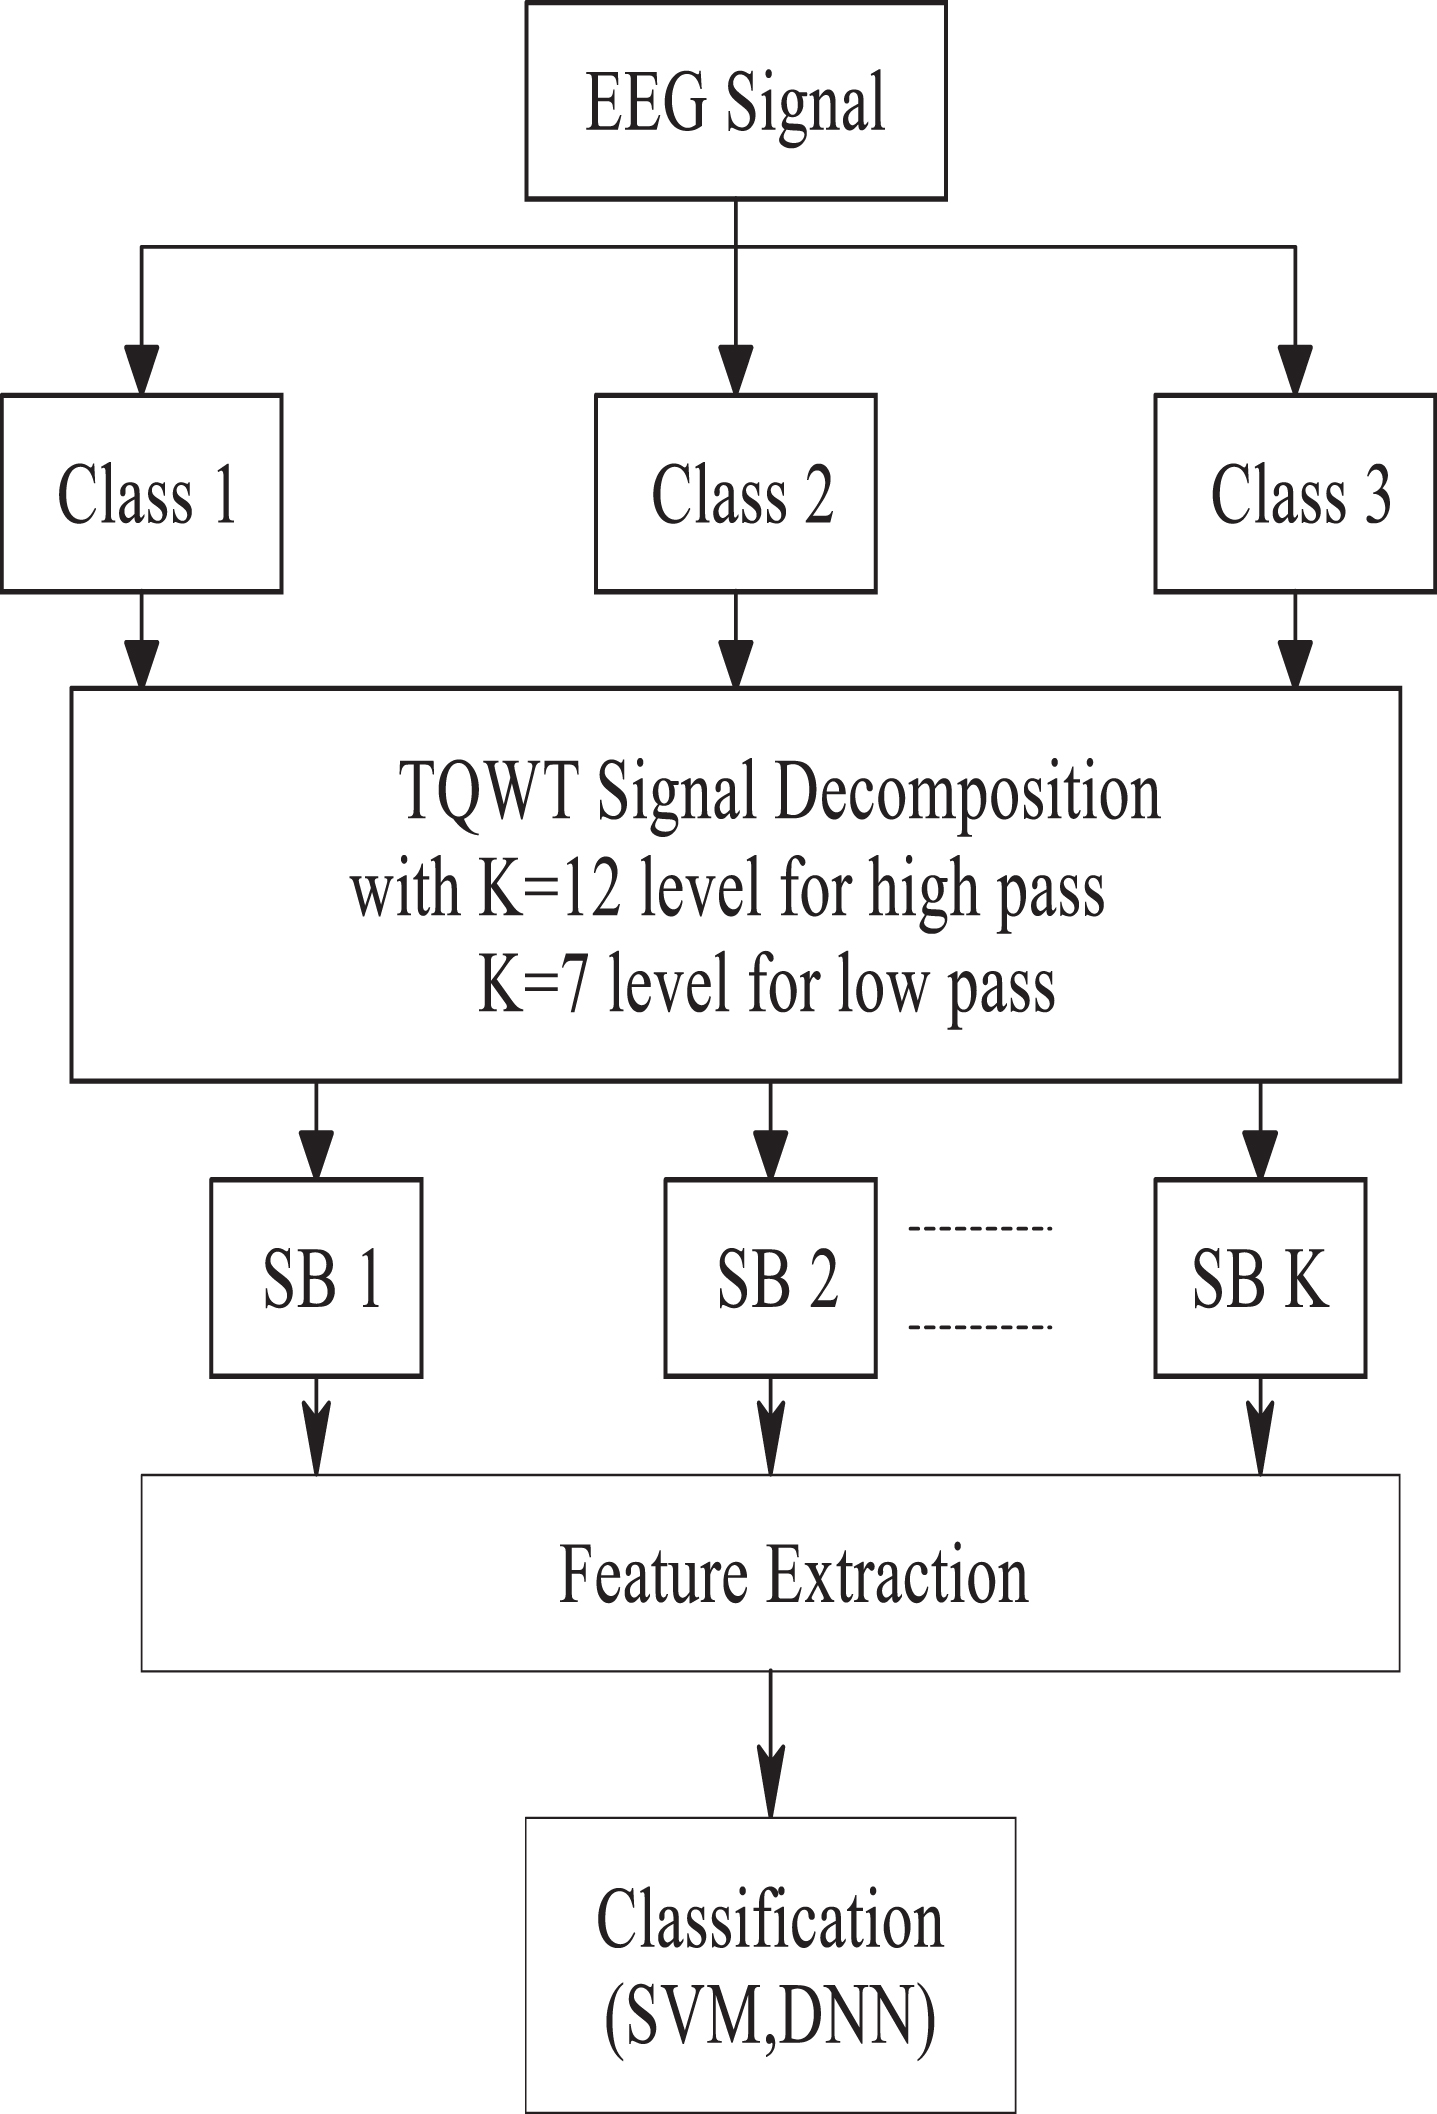
Block diagram of Proposed Architecture based On TQWT.
In this section, the foundation of information of the EEG database is given which is existing online at http://epileptologie-bonn.de [12], Bonn University. Set of datasets are available viz. Z, O, N, F, S which are sampled with 4096 samples each segment having duration of 23.6 sec with the sampling rate of 173 Hz. with 12 bit resolution. The one dimensional time varying EEG data is having the spectral higher and lower frequency of the signal acquired system as 0.5 Hz to 85 Hz respectively. Figure 2 shows the raw electroencephalogram signal acquired of a class by the system.

Sample waveform of EEG Data Signal.
The processing and study of oscillatory signal like EEG signal or non-stationary signal can be done using the wavelet transform with high value of the Q-factor while for non-oscillatory signal like image the value must be low. So, the advanced version of the flexible wavelet transform presented by Selesnick called as TQWT comes into picture. The various advantages of TQWT includes its perfect reconstruction, fully discrete nature, conceptually simple & easily defined parameter in terms of Q-factor [13].
TQWT is used for the decomposition of finite oscillatory and non-oscillatory input signal with adjustable Q-factor value. TQWT provides the tuning of the type of oscillatory signal with the help of Q-factor and such provision are not present in maximum number of the wavelet transform. The various parameter included in the analysis of TQWT are Q, r, K where Q is Q-factor, r is redundancy factor and number of levels or sub bands are denoted by K. Q- Factor is the ratio of resonant frequency to bandwidth and is unit less quantity, redundancy factor (r) define the sampling process of the signal based on the Nyquist rate (r can be 3 or 4),but in proposed work it is r = 3 and K represents the number of stages for sub band extraction. TQWT disintegrate the finite EEG signal into several number of bands which is classified as low pass H0(w) and high pass H1(w) banks using filter [7, 8]. The expression for low pass filter Ho(w) and high pass filter H1(w) response are given from Equation (1) to Equation (6) Below [13]:
And θ (ω) is the response of frequency plot obtained from filter equation of the Daubechies that is given by Equation (5).
Also, Q, r, and K can be used to derive α and β as given in Equation (6):
The input signal is separated into lower and high frequency component i.e. in sub-band signal after first level of decomposition. Then, the same procedure is followed recurrently to finally obtain one low pass sub bands & K high pass bands.
TQWT firstly decays the sequential stage by dividing the input with signal frequency in the range 0.5 Hz to 100 Hz to its half value. In high pass filtering, the EEG signal decomposes into 13 sub bands by using 12- levels of TQWT with Q = 3 & r = 3 as shown in Fig. 3. Figure 4 indicates the frequency response of signal and Fig. 5 shows the wavelet of sub band for high pass filtering.
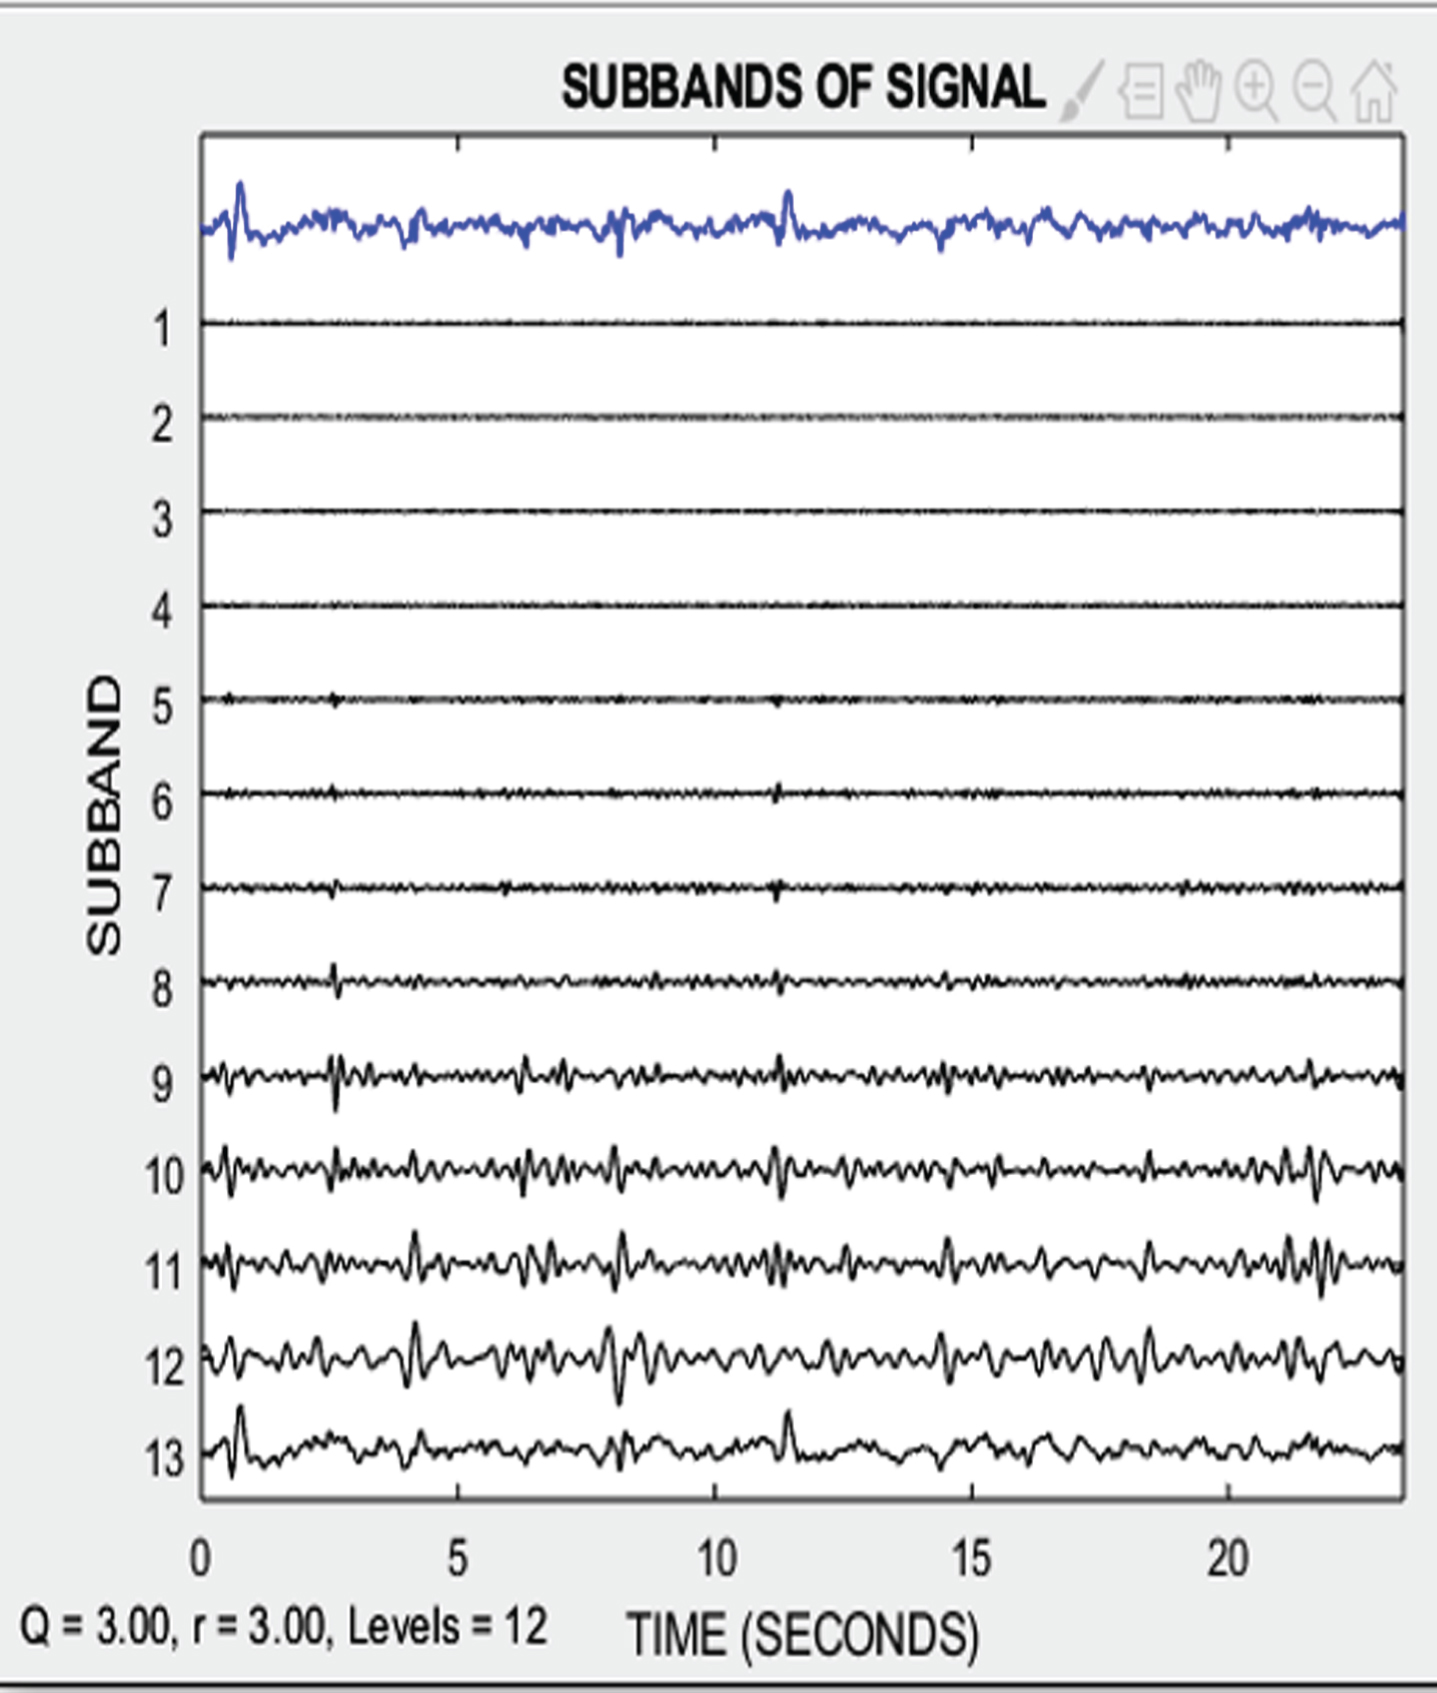
Sub band decomposition with K = 12, Q = 3, r = 3.
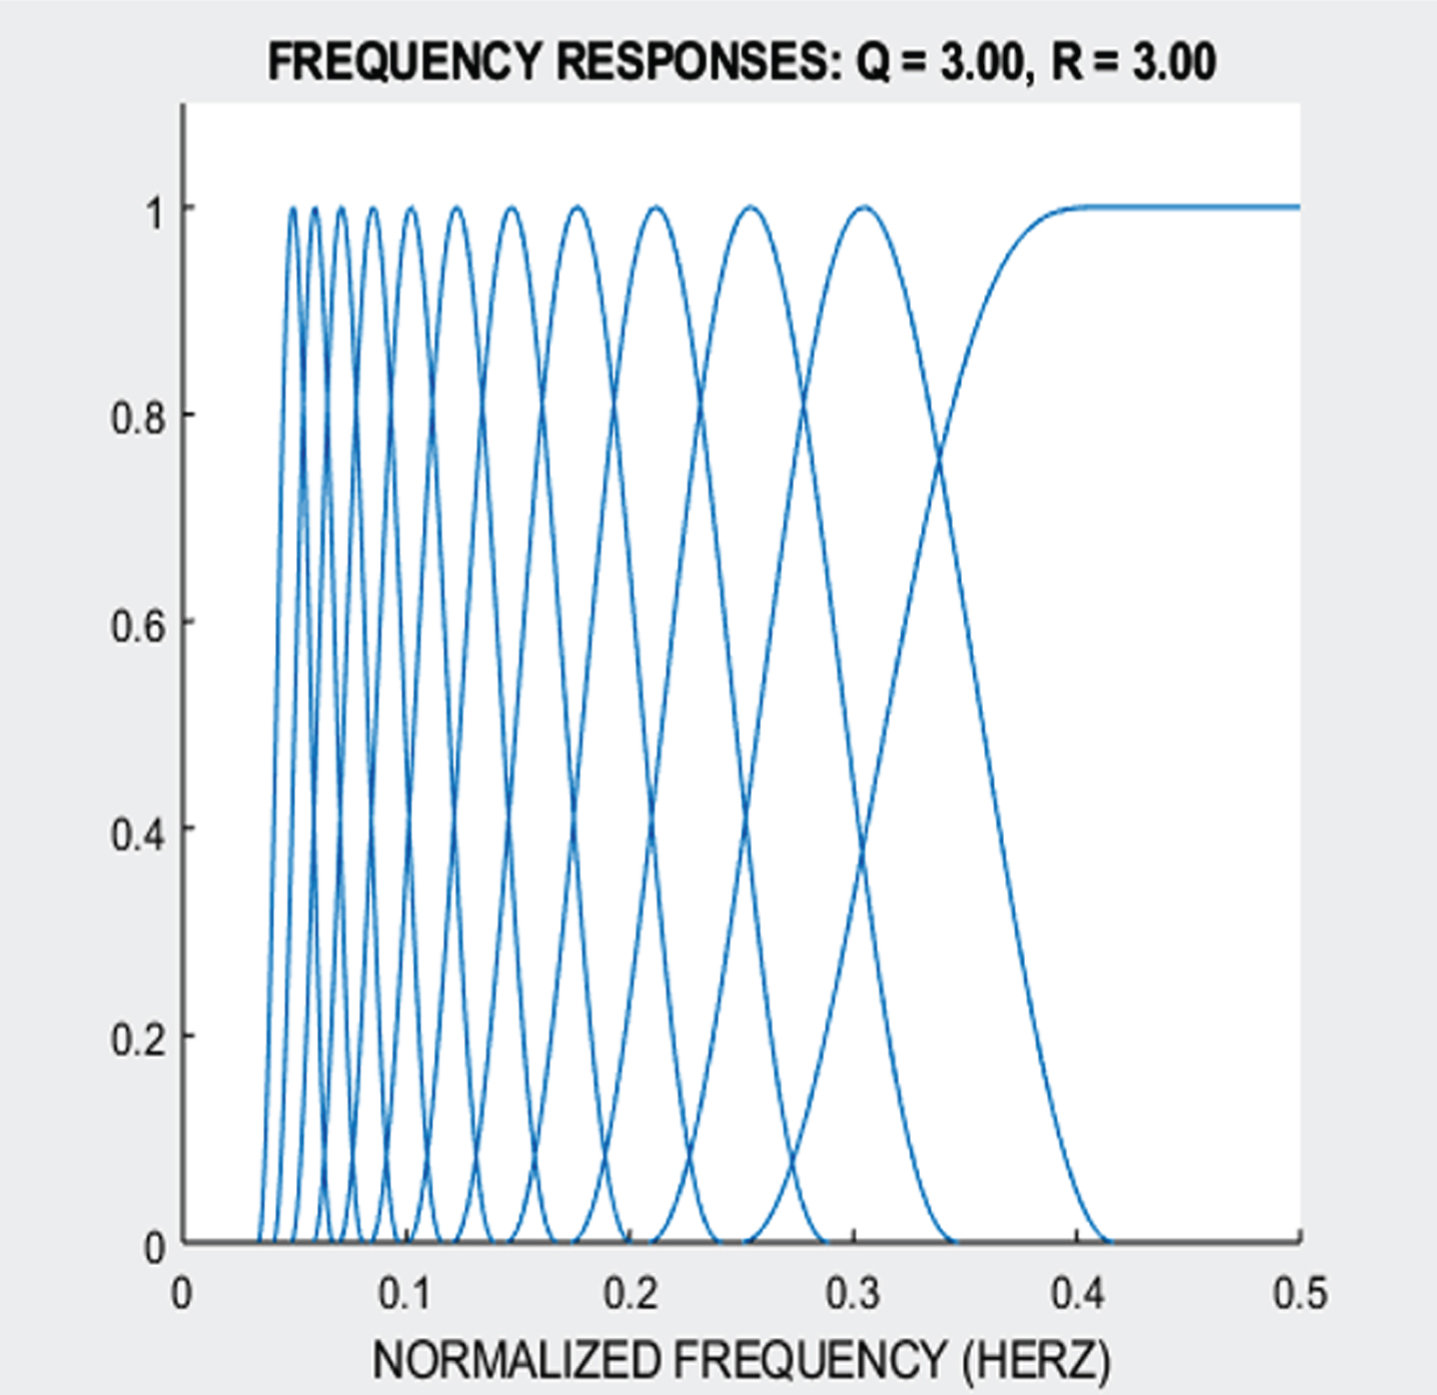
Frequency response of signal with K = 12, Q = 3, r = 3.
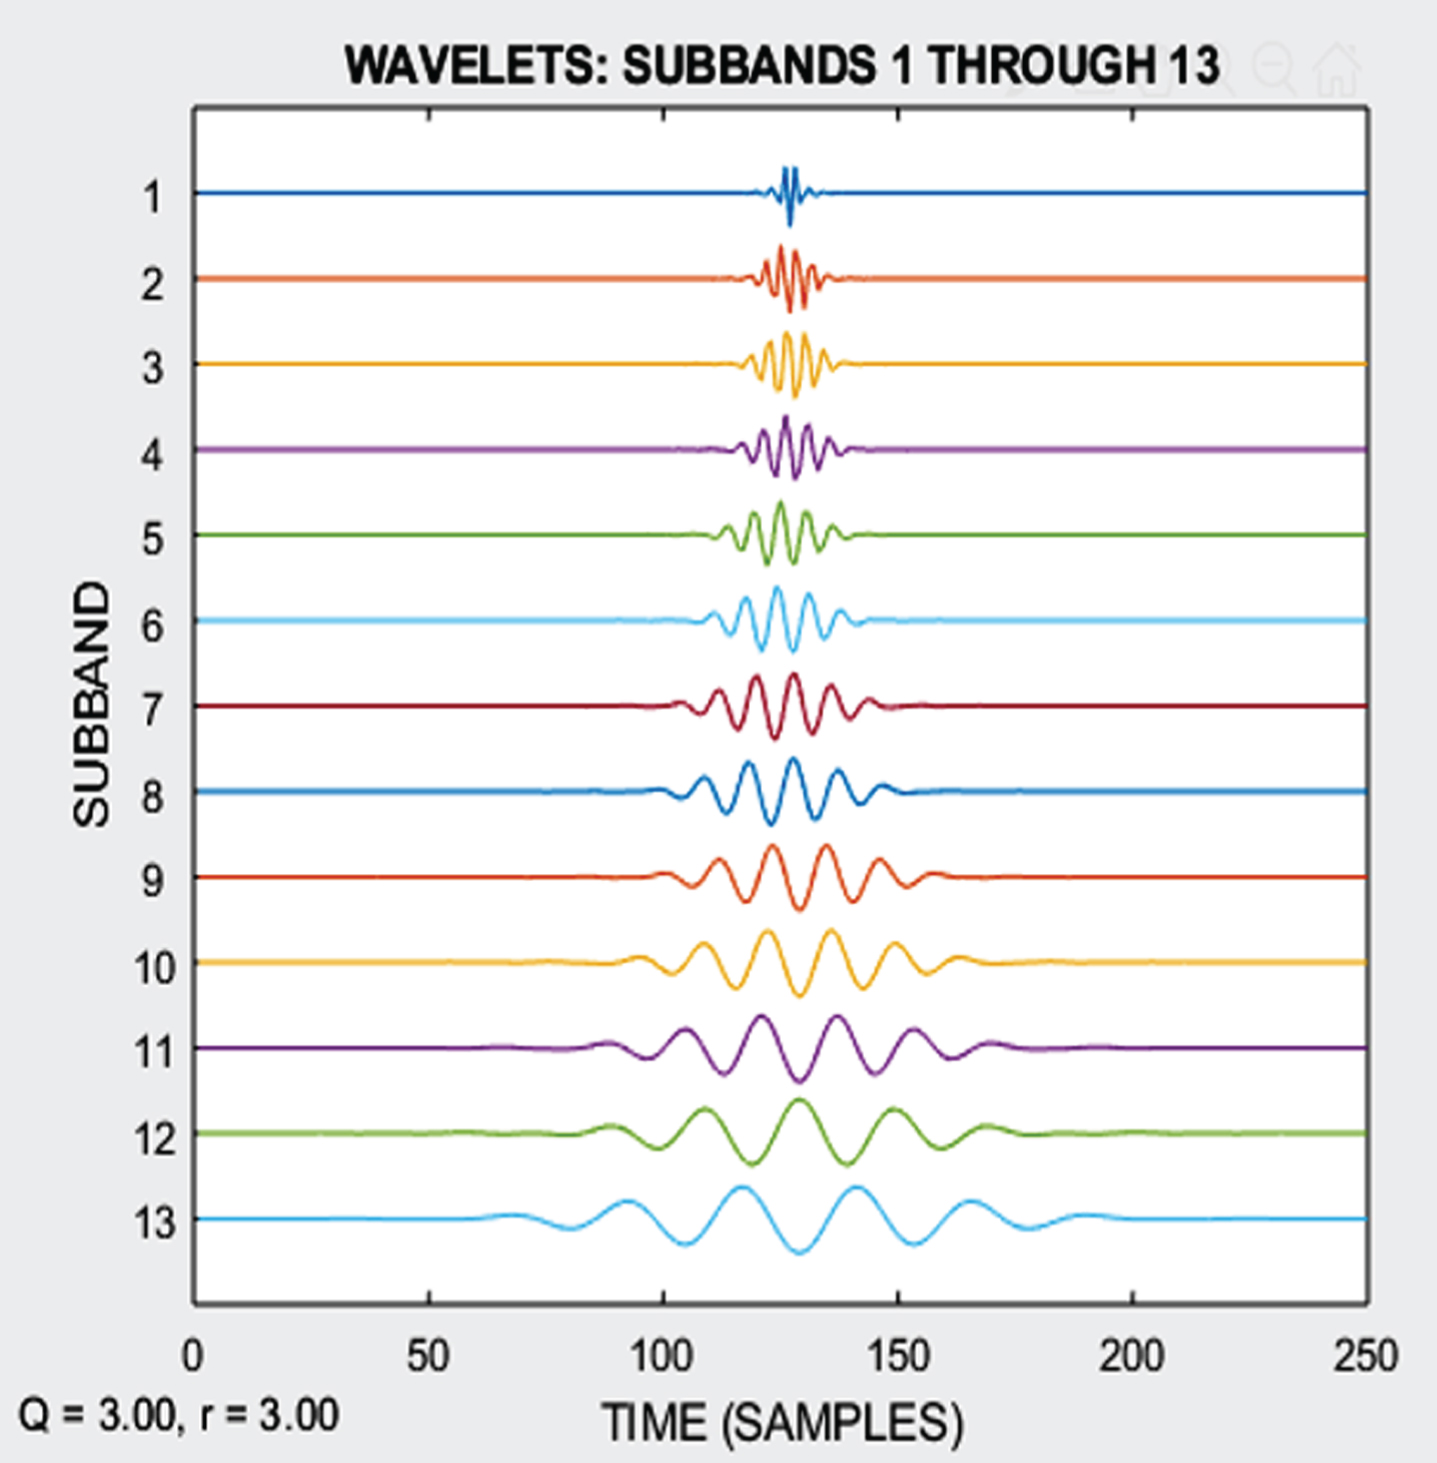
wavelet of Sub band with K = 12, Q = 3, r = 3.
In low pass filtering, TQWT decays the sequential stage by dividing the input with signal frequency in the range 0.5 Hz to 100 Hz to its half value. EEG signal then decomposes into 8 sub bands by using 7- levels of TQWT with Q = 1 & r = 3 as shown in Fig. 6. Figure 7 shows the frequency response of signal and Fig. 8 shows the wavelet of sub band for low pass filtering signal.
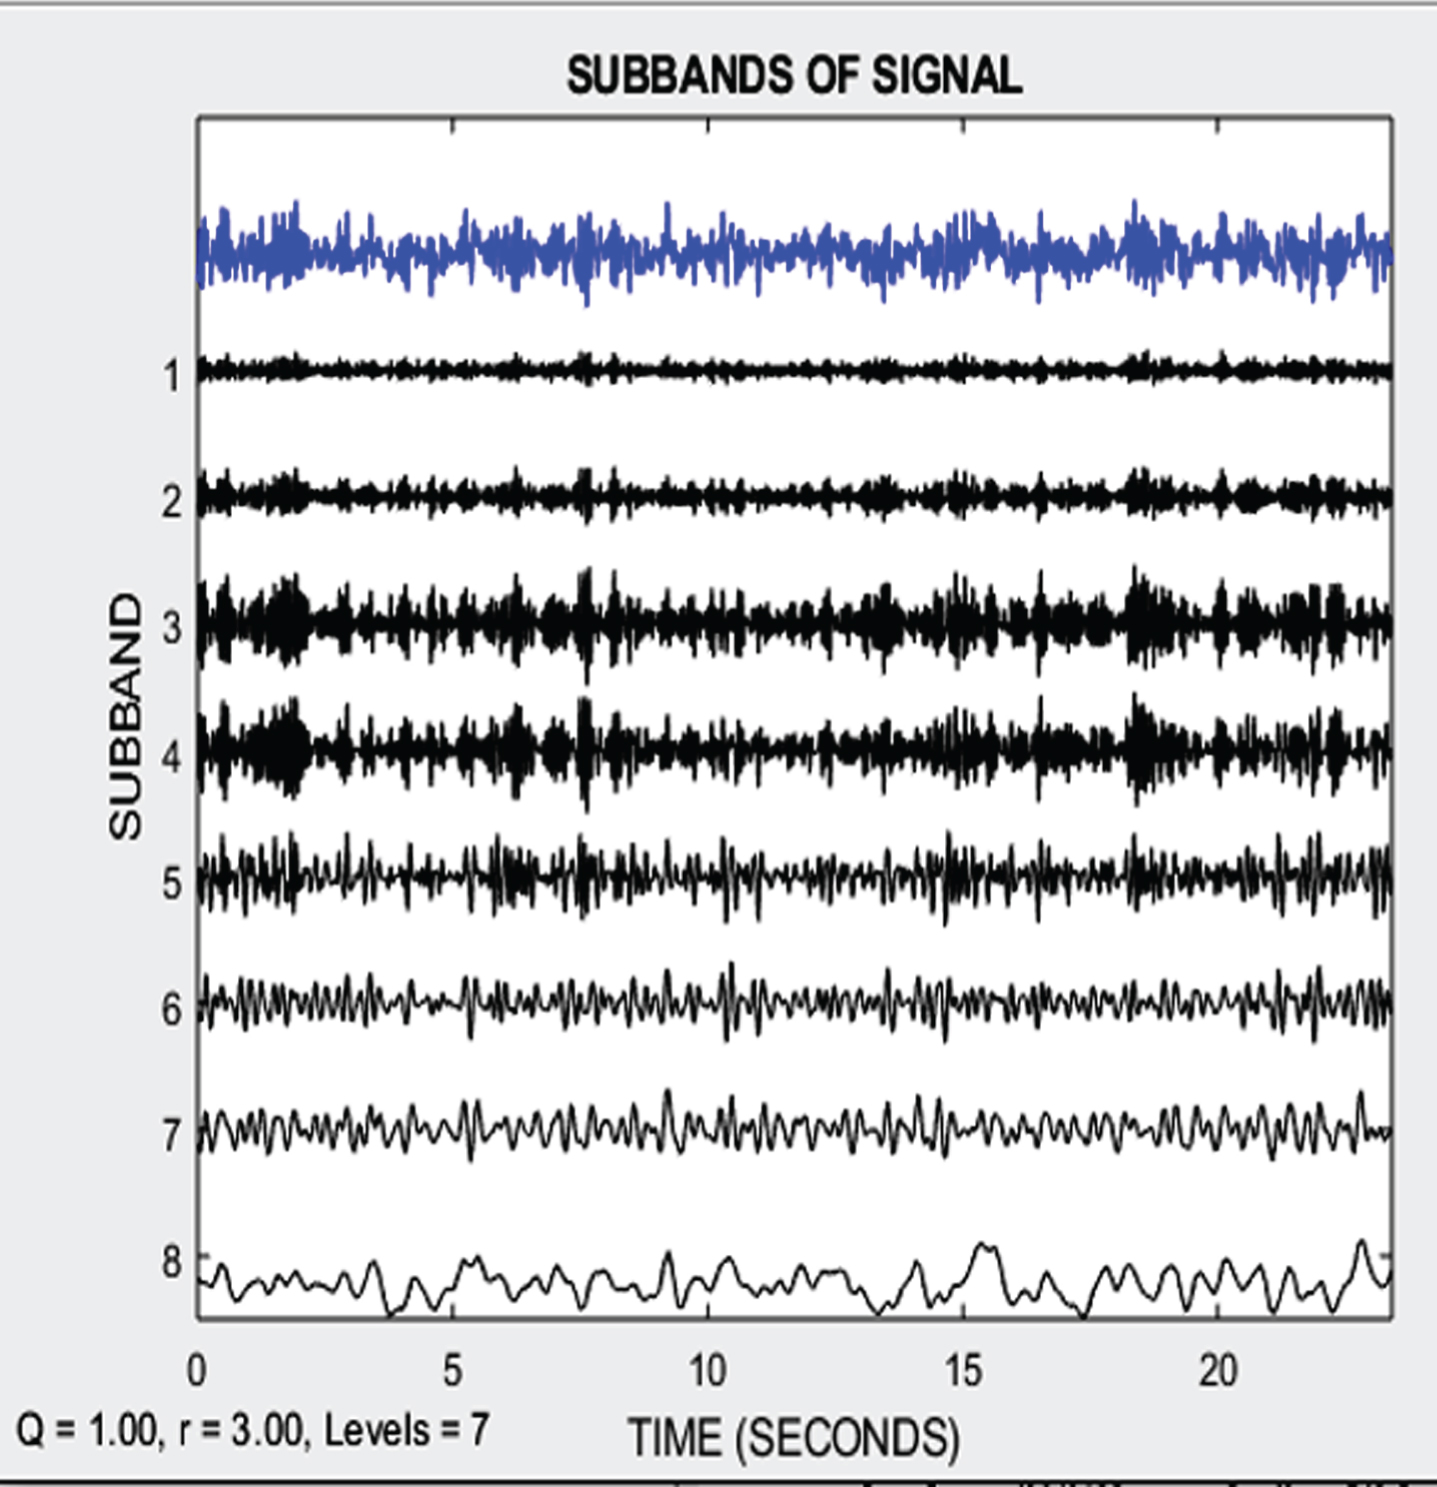
Sub band decomposition with k = 7, Q = 1, r = 3.
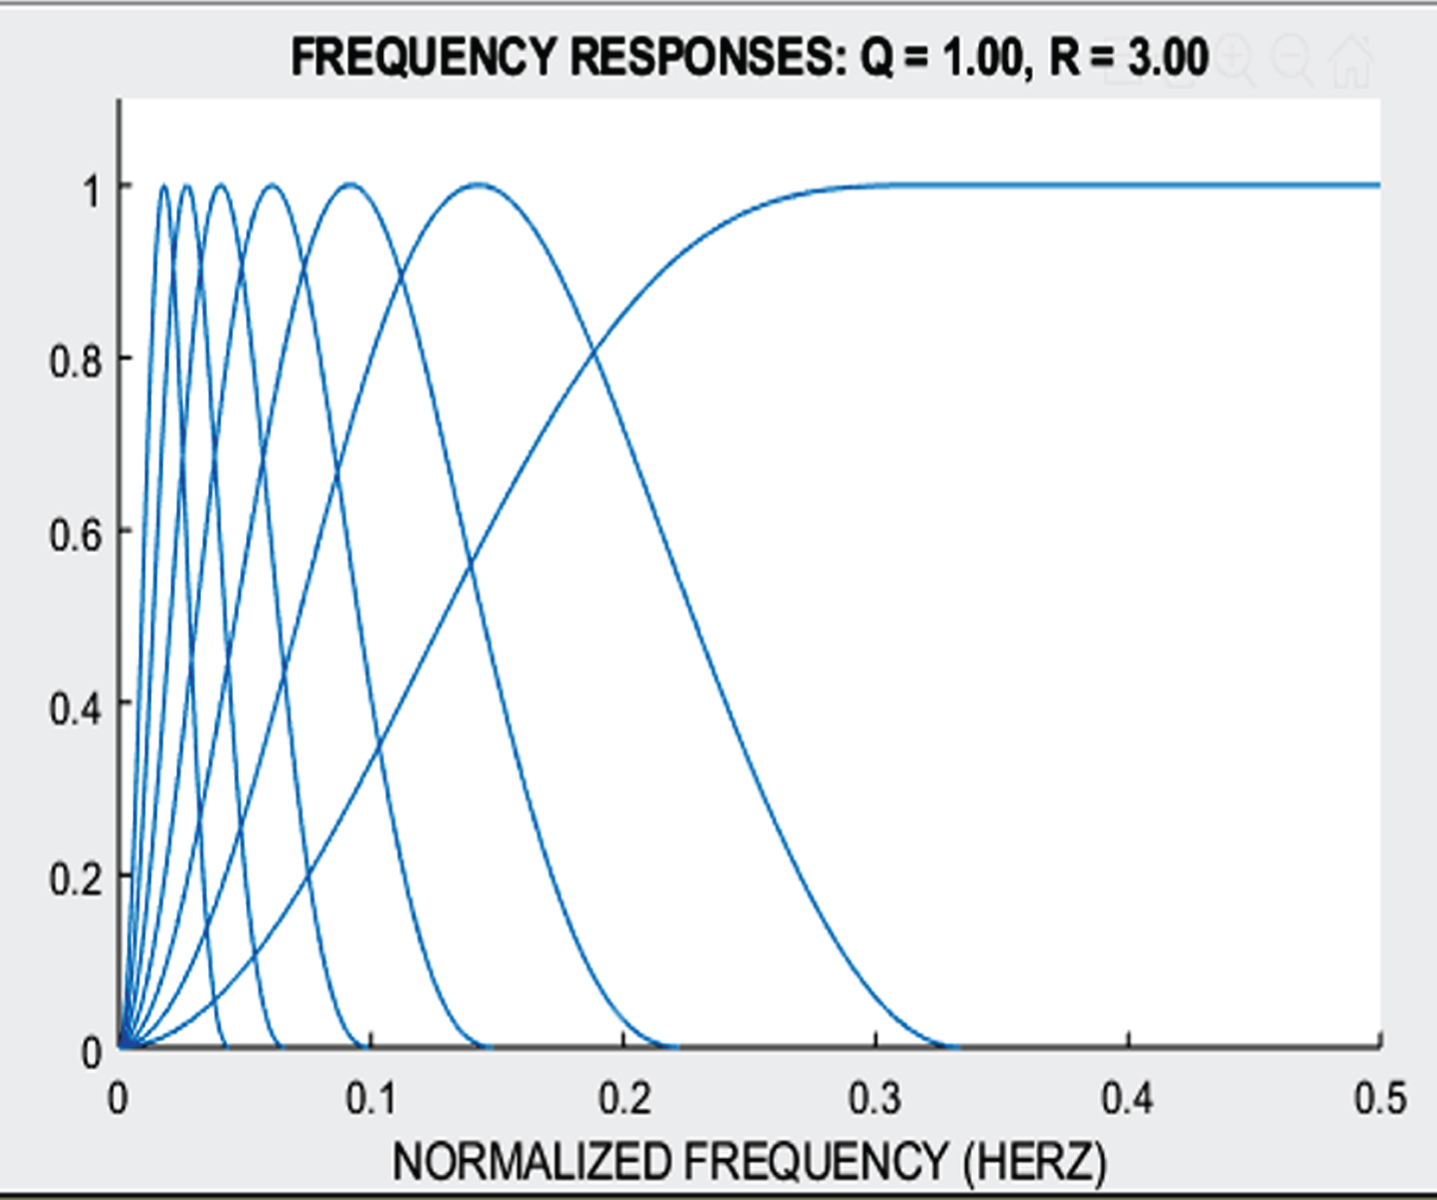
Frequency response of signal with k = 7, Q = 1, r = 3.
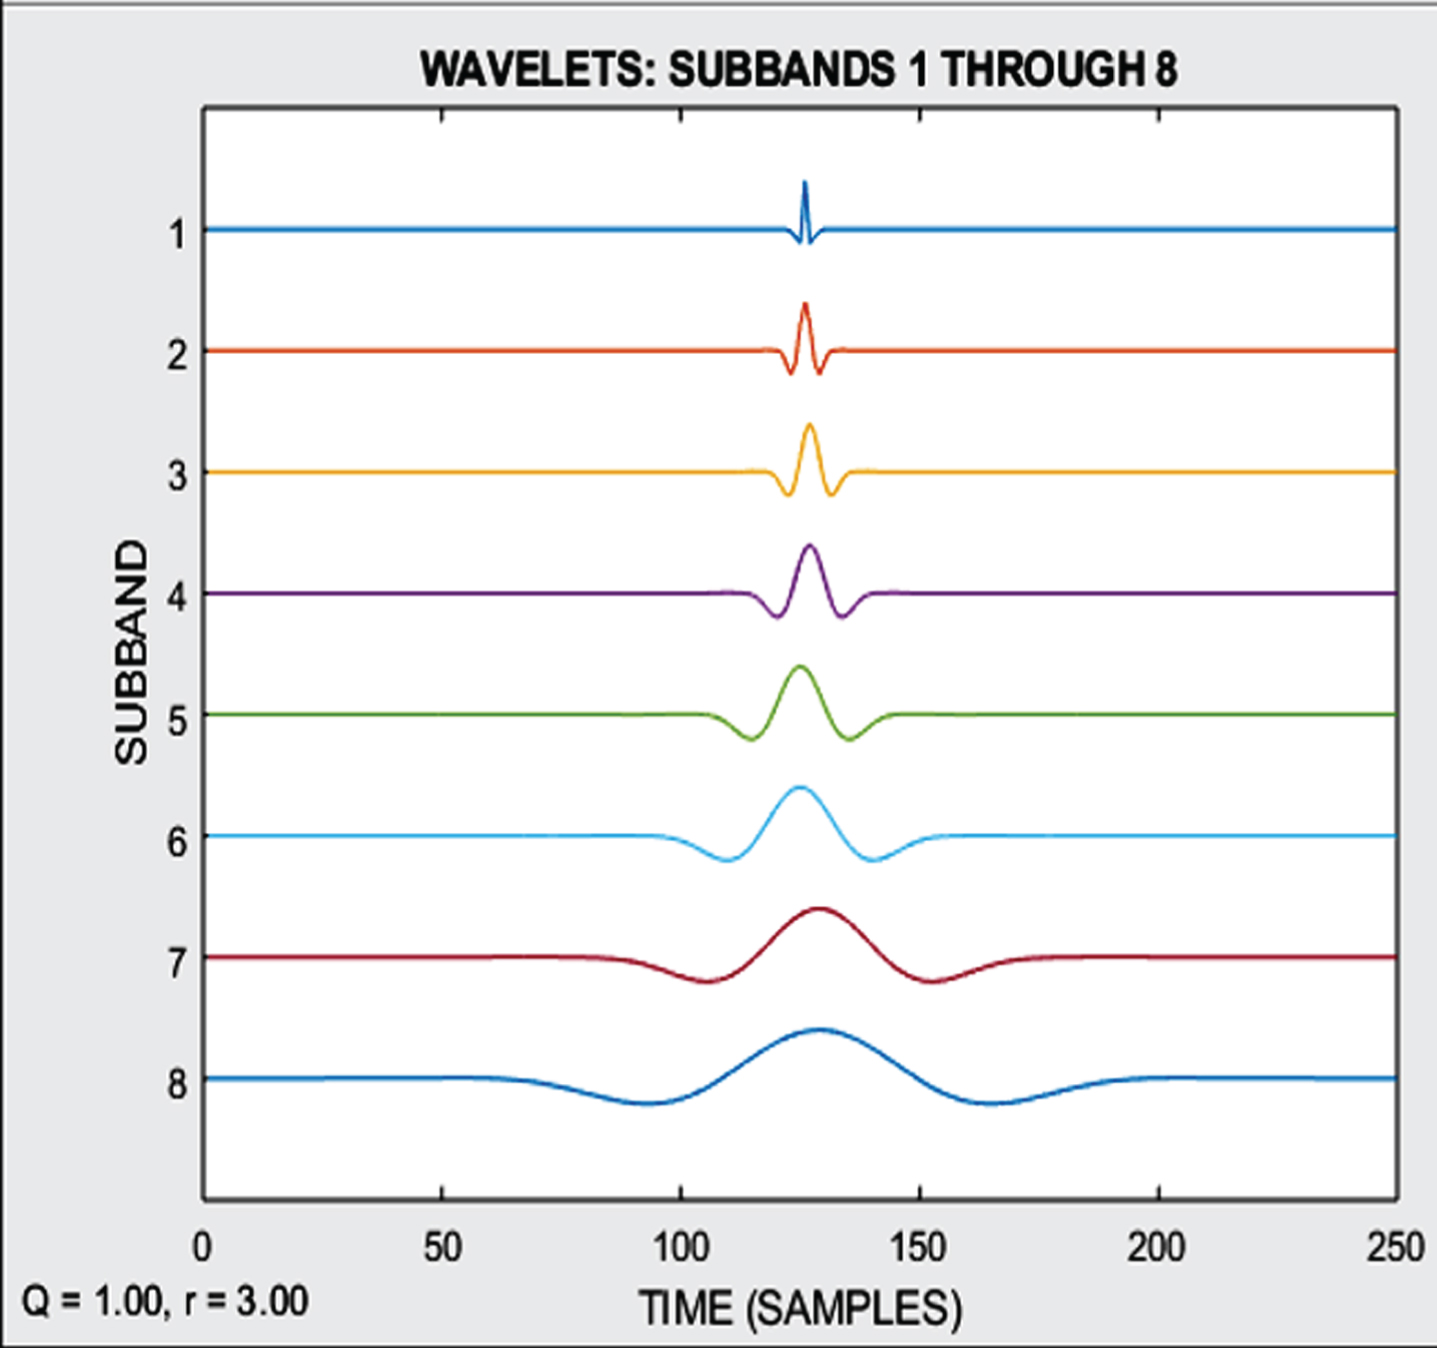
Wavelet of Sub band with k = 7, Q = 1, r = 3.
By using nine statistical measures in the feature extraction section, to get thorough information and value of EEG signal after 12 level decomposition of sub bands by TQWT. The features to be extracted are namely (ASS) absolute square root sum, (AS) absolute sum, (RMS) root mean square, (Clf) clearance factor, (AAC) average amplitude change, (Shf) Shape factor, (Crf) Crest factor, (Ac) Activity, (LD) log detector. Each one of the parameter are to be described one by one in next section.
Absolute square sum (ASS) is defined as addition of the square root of each sample in a given input signal. Absolute sum (AS) is well-defined as addition of all the input signals absolute values. Root mean square (RMS) is calculated as the square root of the addition of the squares of each input value of a sample. Average amplitude change (AAC) between two successive samples is mean value of the change. Crest factor (Crf) shows how extreme the crests are in a waveform showing the signal. Clearance factor (Clf) is the fraction of highest value of the signal to the square of the average of square root of the EEG signal absolute value. Activity (Ac) is the quantity of signal power. It characterizes liveliness of the signal. These statistical features equations are defined from following equations (07-15):
Support vector machine
Support vector machine (SVM) is a cutting edge technology receiving the attention from the researchers with various fields due to its use in variety of applications such as digital image analysis, text categorization, bioinformatics, character recognition & biomedical field, etc. A support vector machine is a classifier that uses supervised learning for regression analysis & classification of data in machine learning model. SVM was developed by Vladimir Naumovich Vapnik a Russian scientist in the year 1962 which was established on statistical learning theory.
SVM classifier basically uses the concept of hyper plane which is use to separate all the data points of one class from the other classes & it is nothing but an imaginary line. The best separation hyper plane is the plane which provides good functional margin & low generalization error. Between two nearest points of the classes it also provides the highest margin distance. The support vector is the closest position between each data classes. For classification of vectors in multi-dimensional space a non-linear problem kernel trick method is used in SVM to separate the data classes by non-linear field which is not able to split using hyper plane [15].
In SVM algorithms, various available kernel functions like non-linear, linear, radial basis function, sigmoid, polynomial, etc. can be used. The greatest advantage of using the RBF kernel function is it provides less computational cost in large dimension spaces. Non-linear SVM classifier are called so because of the use of non-linear surface of data in kernel trick approach. The equation for RBF Kernel used is given below by Equation (16).
In this SVM, N-fold cross validation is used for splitting the training & testing data. In the proposed work, 80% of the data is used for the training purpose while 20% of the data is used for the testing purpose by the dataset which was split into the three data sets using 3-fold cross validation. The evaluation parameters such as accuracy is calculated and comes out to be 99.59%. Figure 9 shows the multiclass SVM classification for 247 samples with Accuracy = 99.59%.
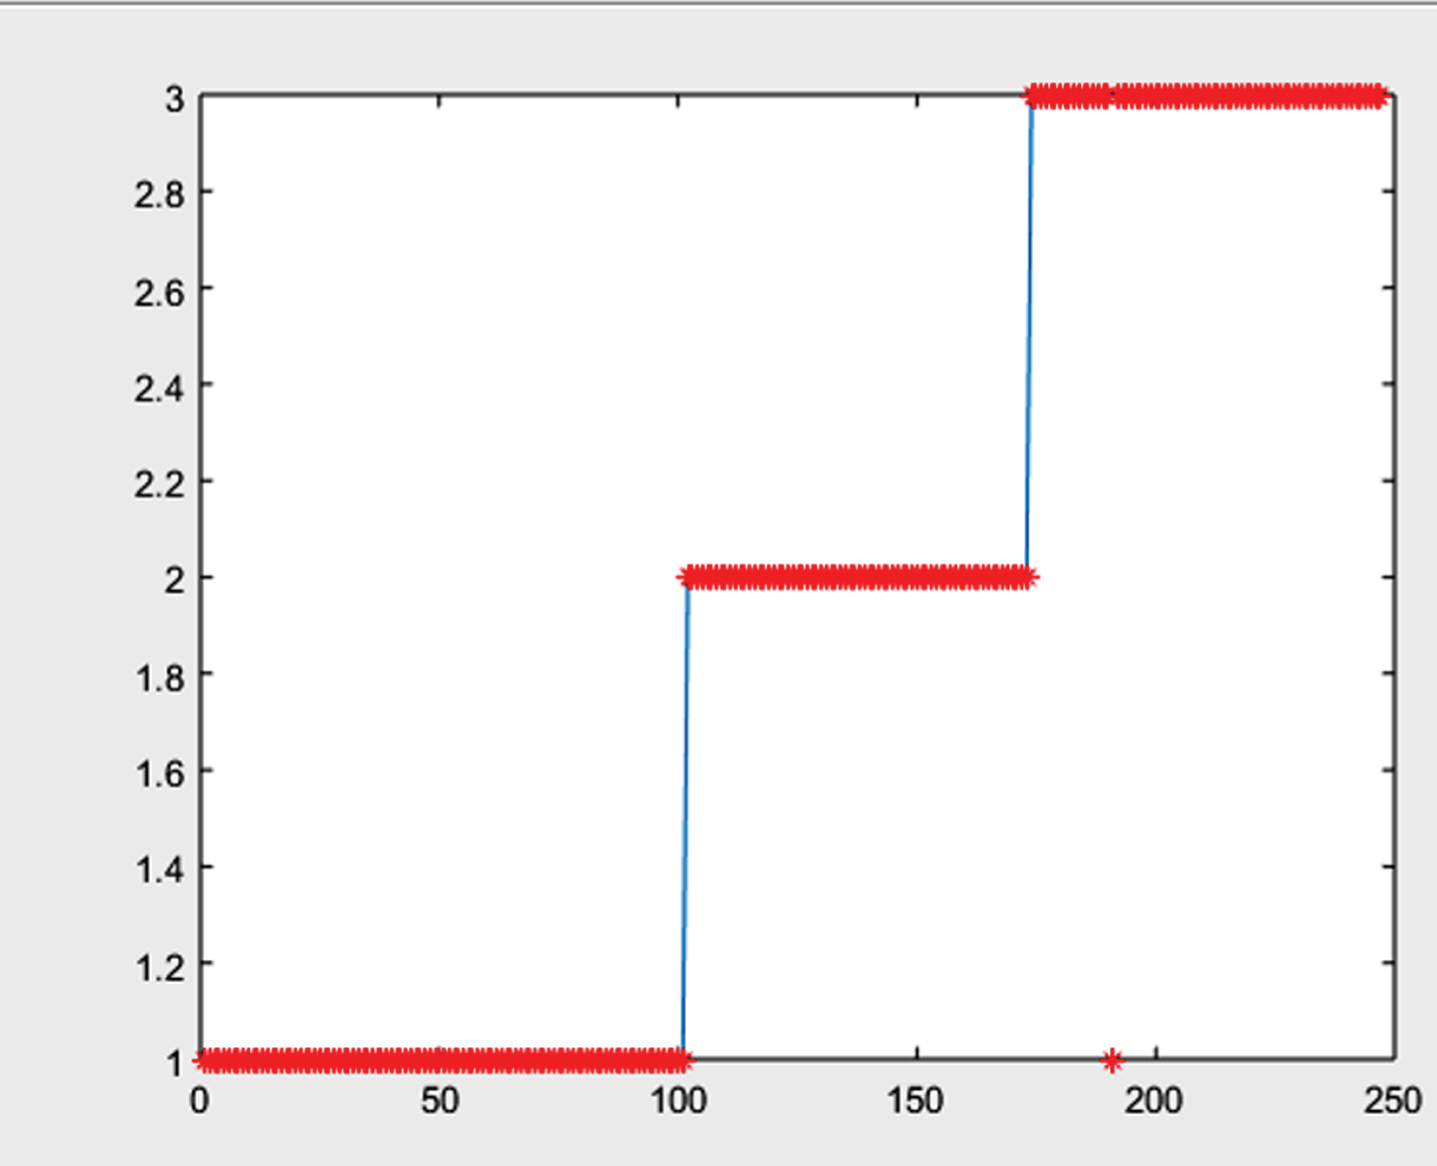
Multiclass SVM Classification for 247 samples with Accuracy = 99.59%.
Machine learning takes the ideas of artificial intelligence to solve many real world problems which is able to imitate the human decision making capabilities. Deep Neural Network is a sub field of machine learning inspired by biological system in which training of multiple layers are done for classification purpose in variety of fields like speech recognition, image recognition, natural language processing, etc.
The extracted features from the EEG signal are similar to time series data and it is given as an input for classification purpose to long short-term memory (LSTM) network.
The LSTM network basically consists of five layers in which first layer introduces the time series input data sequence into the network & called as sequence input layer. The second layer learns the long-term dependencies between sequences of data called as LSTM layer. The third layer is nothing but the fully connected layer which is use to predict the class labels after LSTM layer. The size of this layer is same as number of classes of data. The next layer is the soft max layer whose output gives positive number whose sum is equal to one, which can be used in probabilities of the next layer and to normalize the output it uses softmax activation function. The last and fifth layer is the output classification layer which assign the input to each classes and uses the probability values given by the former layer activation function. The diagram in Fig. 9 shows the deep neural network using LSTM Architecture. Figure 11 shows DNN Classification for 247 samples with Accuracy = 100%.
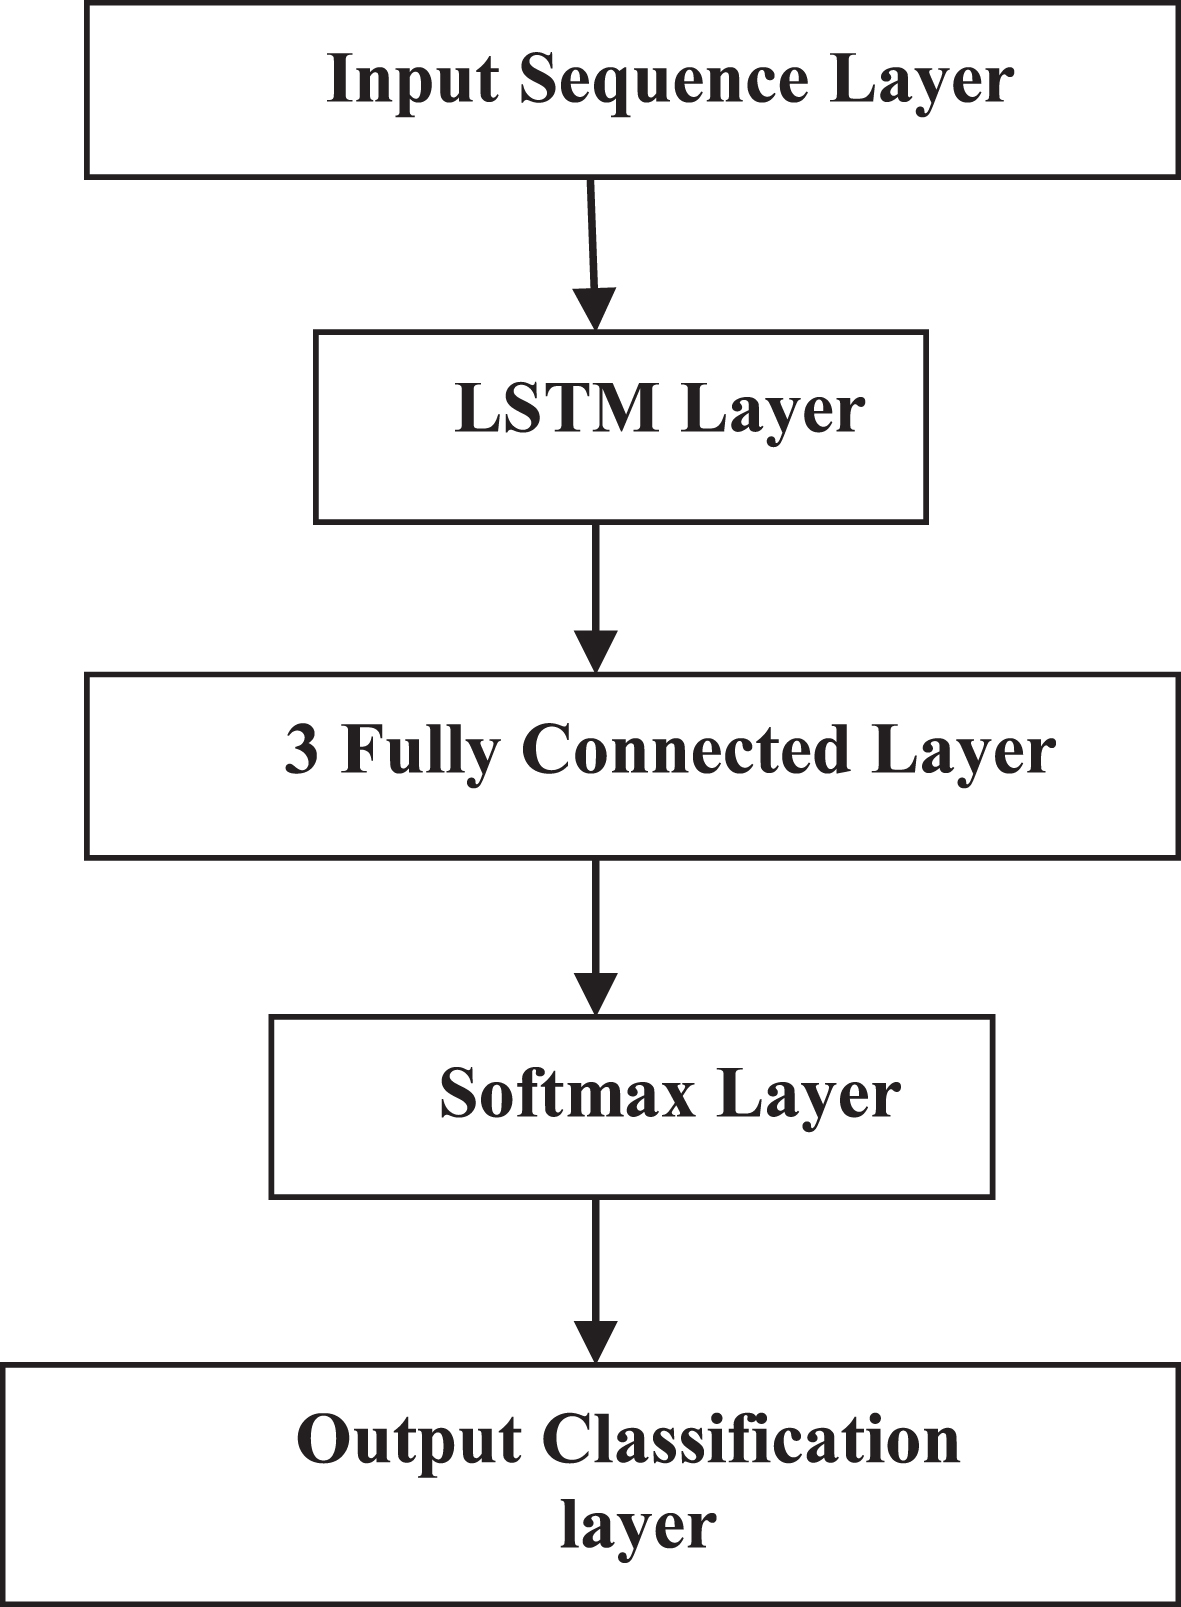
Deep NN using LSTM Architecture.
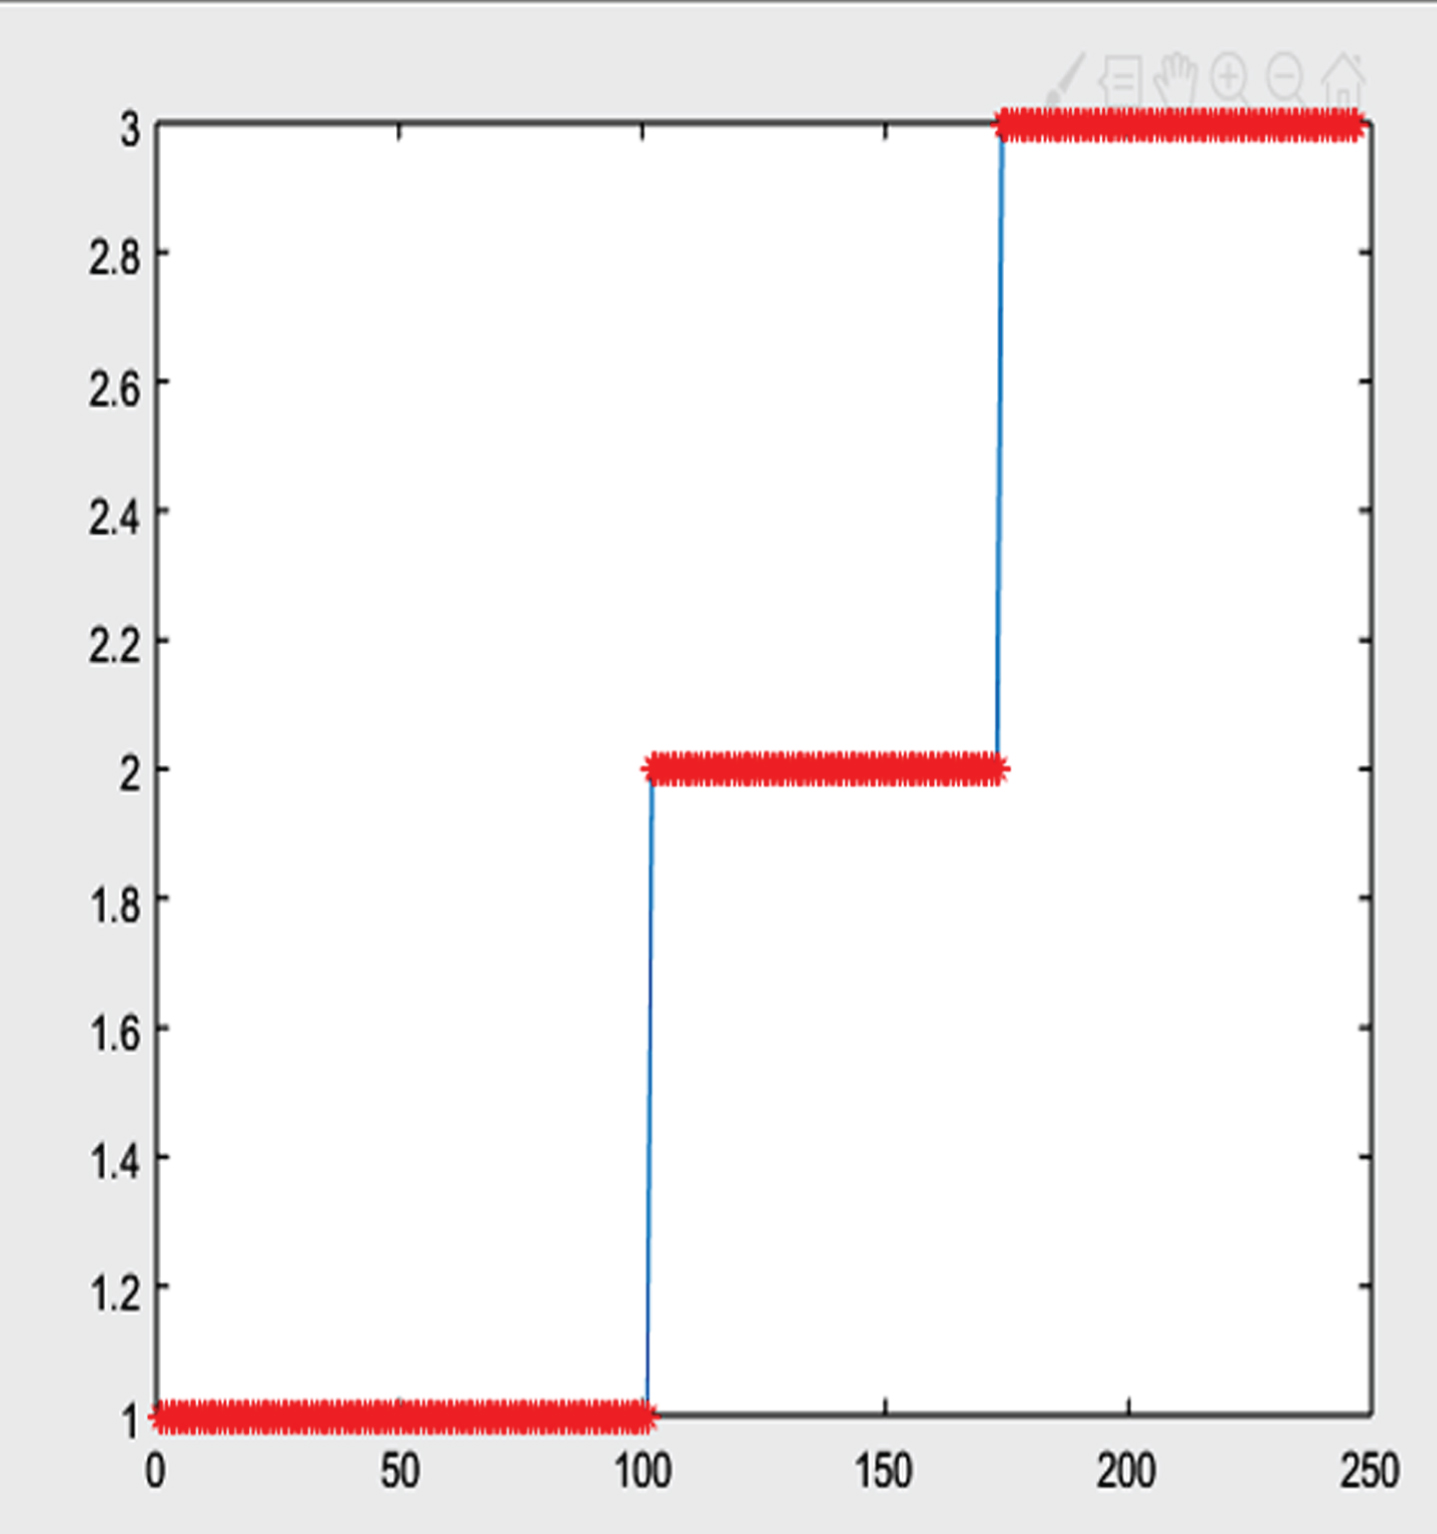
DNN Classification for 247 samples with Accuracy = 100%.
Evaluation metrics
Tables 1 and 2 shows the confusion matrices value in events of the sample. Based on the value of the events given in table calculations of evaluation metrics and its parameter like accuracy, precision, sensitivity, specificity, F1-score are done. Figures 12 and 13 shows the confusion matrix of predicted class versus true class SVM & DNN classifier respectively.
Confusion matrix of predicted class vs. true class for multi class SVM classifier
Confusion matrix of predicted class vs. true class for multi class SVM classifier
Confusion matrix of predicted class vs. true class for DNN classification
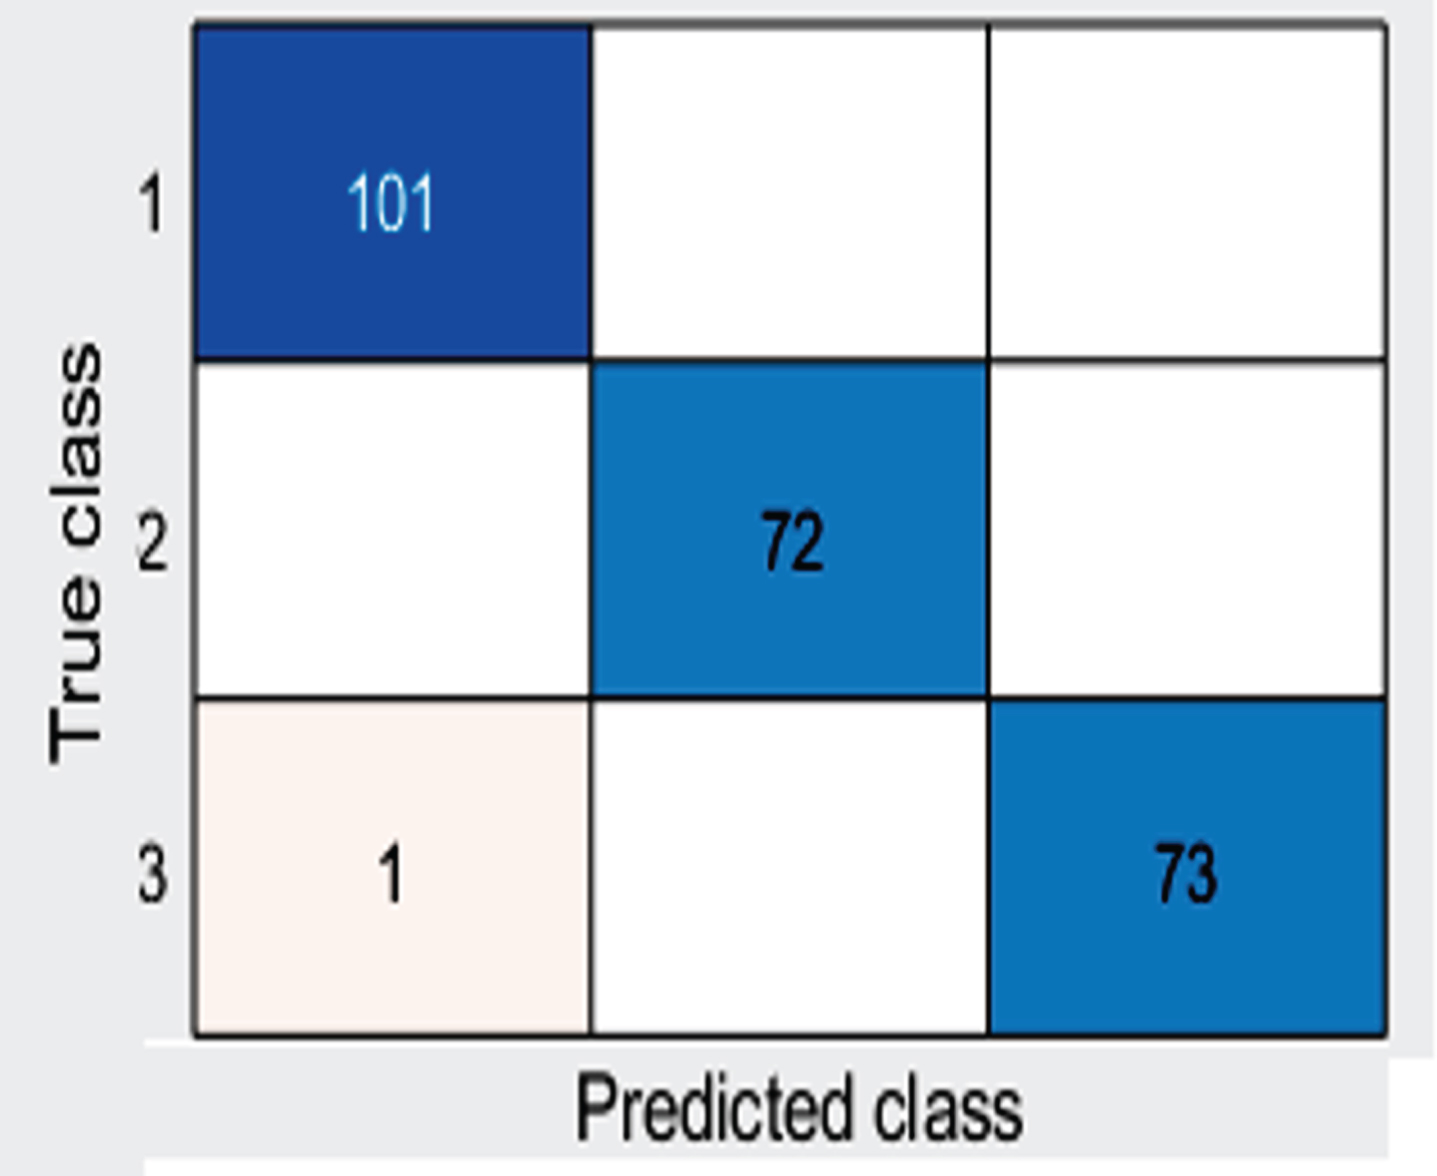
Confusion matrix of predicted class vs. true class for SVM classifier.
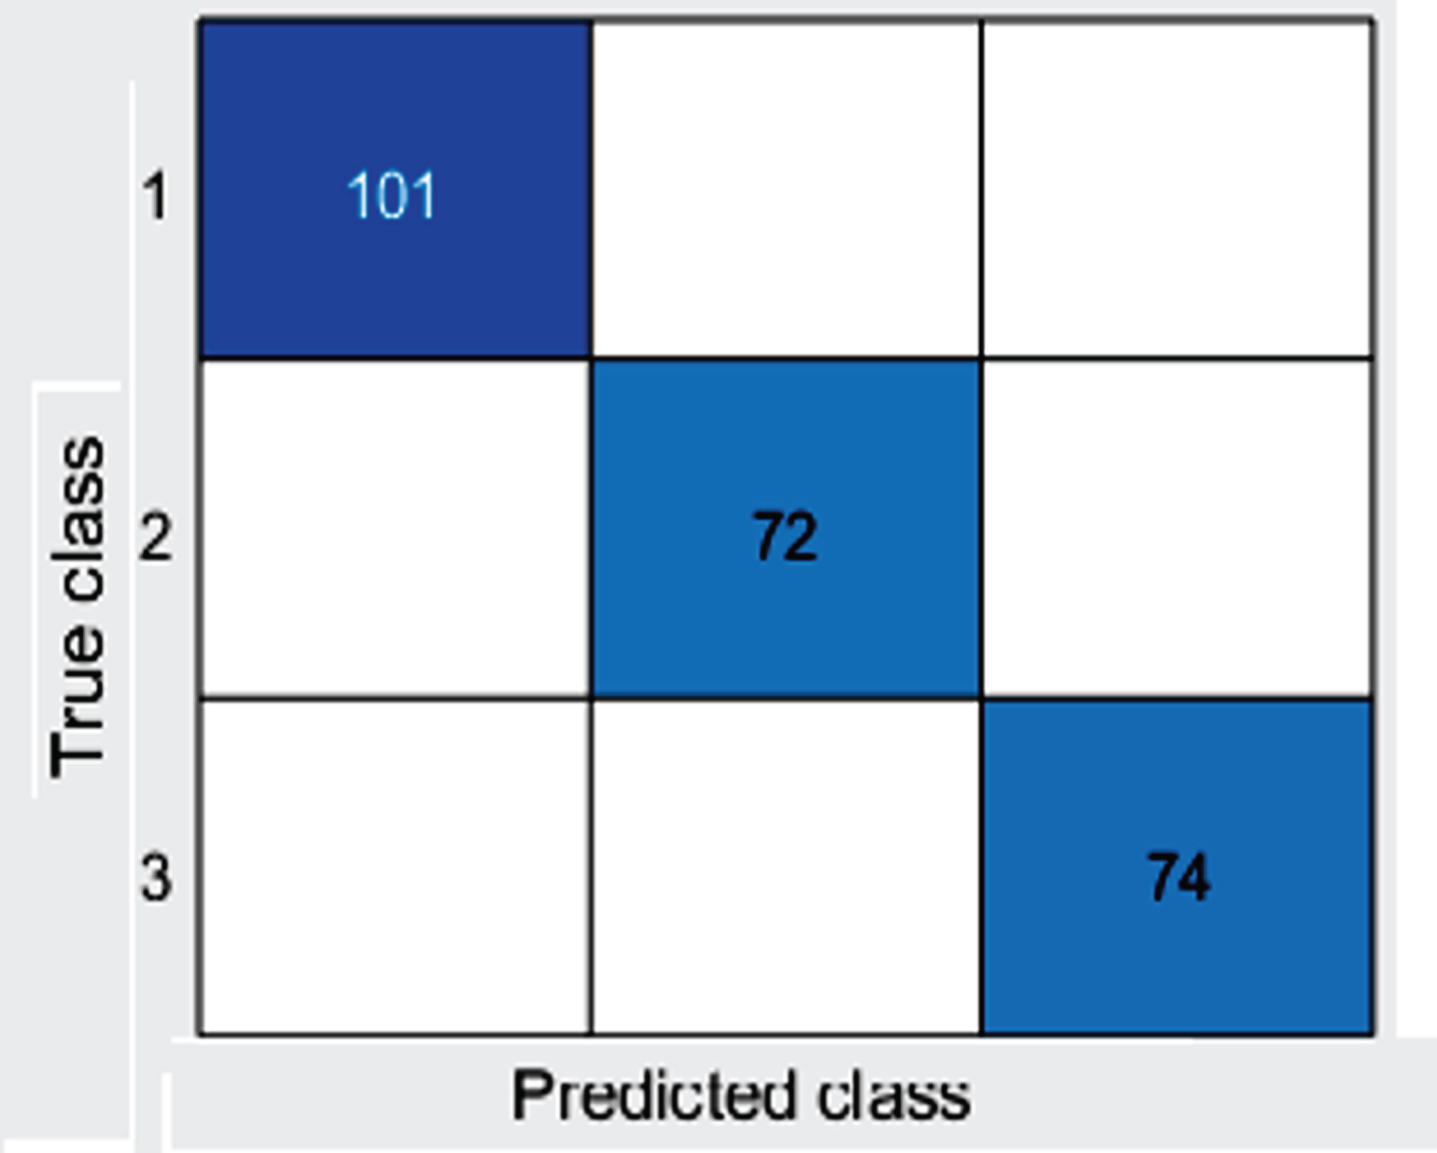
Confusion matrix of predicted class vs. true class for DNN classifier.
The performance parameters are defined as below.
Based on the above five equations via, (1, 2, 3, 4, 5) various performance parameters by using SVM are calculated as shown in the Table 3.
Performance parameters for three class of data by using SVM classifier
Performance parameters for three class of data by using SVM classifier
Based on the above five equations via, (1, 2, 3, 4, 5) various performance parameters by using DNN are calculated as shown in the Table 4.
Performance parameters for three class of data by using DNN classifier
Conclusion
In this paper, electroencephalogram signal is used to classify the data of brain states activity by using multiclass support vector machine and deep neural network classifier which will depicts the communication messages from the disabled person. For this purpose, features are extracted by using statistical measure along with low pass & high pass tunable Q- wavelet transform signal decomposition technique that results into classifying the data into three classes which are nothing but the three different messages depicting the thought of brain states. A comparative study of multiclass support vector machine and deep neural network classification is also done by evaluation of various performance parameters such as accuracy, precision, sensitivity, specificity, etc. As a result, the accuracy of the system using multiclass support vector machine is 99.59% and when the results are successfully validated using deep neural network the accuracy archived by the proposed system is 100%. The results are also compared with the previous work done as shown in the Table 5 which concludes that the deep neural network is most promising for the classification purpose. The advantage of the research work carried out in the paper is to solve the problem of communication of the disabled/paralyzed person effectively which ultimately benefits the society. In future, the study can be done by extracting the real time electroencephalogram signal of various person using the same decomposition method & algorithm used in the proposed work.
Comparative result with previous work and the result with SVM Classifier & DNN Classifier