
Abstract
The Shewart S-control chart is commonly used as one of the statistical tools for monitoring the process variability. The existing design of S-control is based on the assumption that inspected quality of the observed process is, an exact and clearly specified quantitative quantity. If however, measured data involve some vague and imprecise observations, the conventional approach of the S-control, cannot be practiced. Designing of a generalized neutrosophic S-control chart which could support the indeterminate values in the processing data is originally developed in this article. The associated properties of proposed design under neutrosophic environment have been established in this study. The proposed chart represents a general design of the existence structure of the S-chart. Using neutrosophic average run length (ARL n ) as a performance measure, a comparative study of the proposed chart with the conventional approach of S-control under vague parameter values is evaluated. Findings both from analytical and simulation studies indicate that proposed design of S-control leads to efficient and more flexible approach over the traditional S-control. A real data example has been provided for demonstrating the implementation procedure of the proposed design.
Introduction
The most of manufactured products are assumed to be come from a stable and capable process. Typically, stability and capability of a production process is monitored by control charts, as one of the most sophisticated statistical methods. The manufactured goods that meet the needs of marketplace are specifically defined as quality products [1]. Whereas, in statistical terms, quality is usually referred as degree of variation in what is being measured as a quality characteristic of the service or product. This variability always exists in any manufactured products, no matter how carefully and well-designed process is adopted in production [2]. The quality related characteristics of manufactured products are measured on some scales and provide based for implementation of control charts for quality monitoring. The control charts are implemented on observed quality characteristics with eventual goal of identifying the existence of assignable causes. Control charts are not only able to identify the different types of assignable causes but, also facilitate to find the process capability which is based on estimation results about parameters of the process [3]. If the observed quality characteristic remains within the specified control limits and essentially showing some random pattern, the process is assumed to be in statistical control [4]. According to different types of measurement scales, variety of control charts has been developed. Variable control charts are employed to deal with quality characteristics that can measure as numerical quantities whereas, attributes control charts are establish to handle with categorical data [5]. The manufacturing industries ensure the quality of their products by monitoring the quality of their products time by time in order to satisfy their customers and to survive in this competitive world [6].
The design of classical control charts is based on notion of accurate data values that is not always accessible [7]. The vagueness in control chart’s parameters or imprecision in observed quality characteristic may be resulted in imprecise data in many real situations. In such applications, dealing with classical control charts are not recommended however, it become necessary for SPC professionals to construct fuzzy structure for the control charts to accommodate vagueness in the processing data. The increased interest of numerous researchers has been reported in literature on profound designing of certain control charts that are based on vague parameter values. The major advantage of these fuzzified charts is their sensitivity over their conventional counterparts [8]. In fact, designs of these charts are enormously flexible and allow users to handle the vague data obtained during the measurement process. The merging concept of fuzzy theory in construction of control chart for products conformity to specified limits, was first time used by Bradshaw [9]. The suggested approach emphasizes that the graded criteria of a product in fuzzy concept is more realistic rather than its twofold classification. The amplification of fuzzy viewpoint in designing control charts for linguistic variables has further attempted in [10–12]. The idea of fuzzification in construction of traditional CUSUM and EWMA control charts is developed [12–14]. To handle with imprecise observations in data without using any defuzzification transformation method and developing the control charts for categorical variables are described by Murat et al. [15]. Designing of variable multivariate control charts in fuzzy mode is described in the work done by Moheb et al. [16]. Another approach by avoiding the defuzzification approach and constructing the variables control chart is explicitly portrayed in the work done by Alireza and Shapiro [17]. In addition, neural network schemes are also proposed by some researchers to identify the state of the process [18].
A fuzzy set does not deal with indeterminate situations and represents a special case of the neutrosophic set where, indeterminacy is taken as independent component [19]. Interested readers may see further details on Neutrosophic set in [20–22]. The idea of neutrosophic logic is further emerged to deal with indeterminacies in variety of fields. For example, Samandachi [23], first time develop literature on conventional statistical methods in order to model indeterminacies in real problems.In recent years, this grounding immensely helped many researchers to develop statistical methods for analyzing the broad class of data that may include imprecise and indeterminate observations. Chen et al. [24, 25], have proposed the neutrosophic extension of the classical statistical method in order to utilize the more information about key parameters in rock study. The designs for variable control charts such as X bar and chart, S2 using neutrosophic consideration have been developed by Aslam et al. [26, 27].
In this work, a new generalized design of the S-control chart has been developed. This newly proposed design can handle the indeterminate values in the processing data. Theoretical framework for S-control chart under neutrosophic environment has been originally derived in this study. The conventional design of conventional S-control is appropriate only to monitor the variability of the process when employed statistics are clearly specified and processing data do not on include imprecise information. To best of our literature search, such design is not developed by utilizing the neutrosophic logic in order to handle indeterminacies that might exist in the measurement process.
The rest of this study is deliberately established in sections as follows. Section 2, briefly describes the designing of neutrosophic S-control chart. The performance of proposed design with the existing counterpart is readily examined in Section 3. The implementation procedure of neutrosophic S-control is discussed in Section 4 by utilizing real data from a manufacturing industry. This work is eventually concluded in Section 5.
Typical structure of the S-control is based on notion of independent and identically distributed (iid) crisp observations on certain quality characteristic. Analogue to classical approach, it has been assumed that an iid sample of the neutrosophic values
The corresponding neutrosophic unbiased estimators of
The 3 sigma limits as given above are often employed at phase II stage for monitored quality characteristics. Such limits however, are avoided sometimes for observing the process variability and hence probability limits are essentially recommended [30].
It has been supposed throughout in this study that process variability is
According to classical defined of ARL [32],
Using the relevant fact of sampling distribution of
We have
Simplifying (3) implies:
Hence equation (1) becomes
Similarly, when the process is shifted to out of control with shift constant k > 1 or 0 < k < 1, then
Now
Simplifying (6) implies that
Similarly
Hence from (7) and (8) we have
Thus
Therefore, neutrosophic control limits for the
The overall procedure used to find the control limits of the proposed
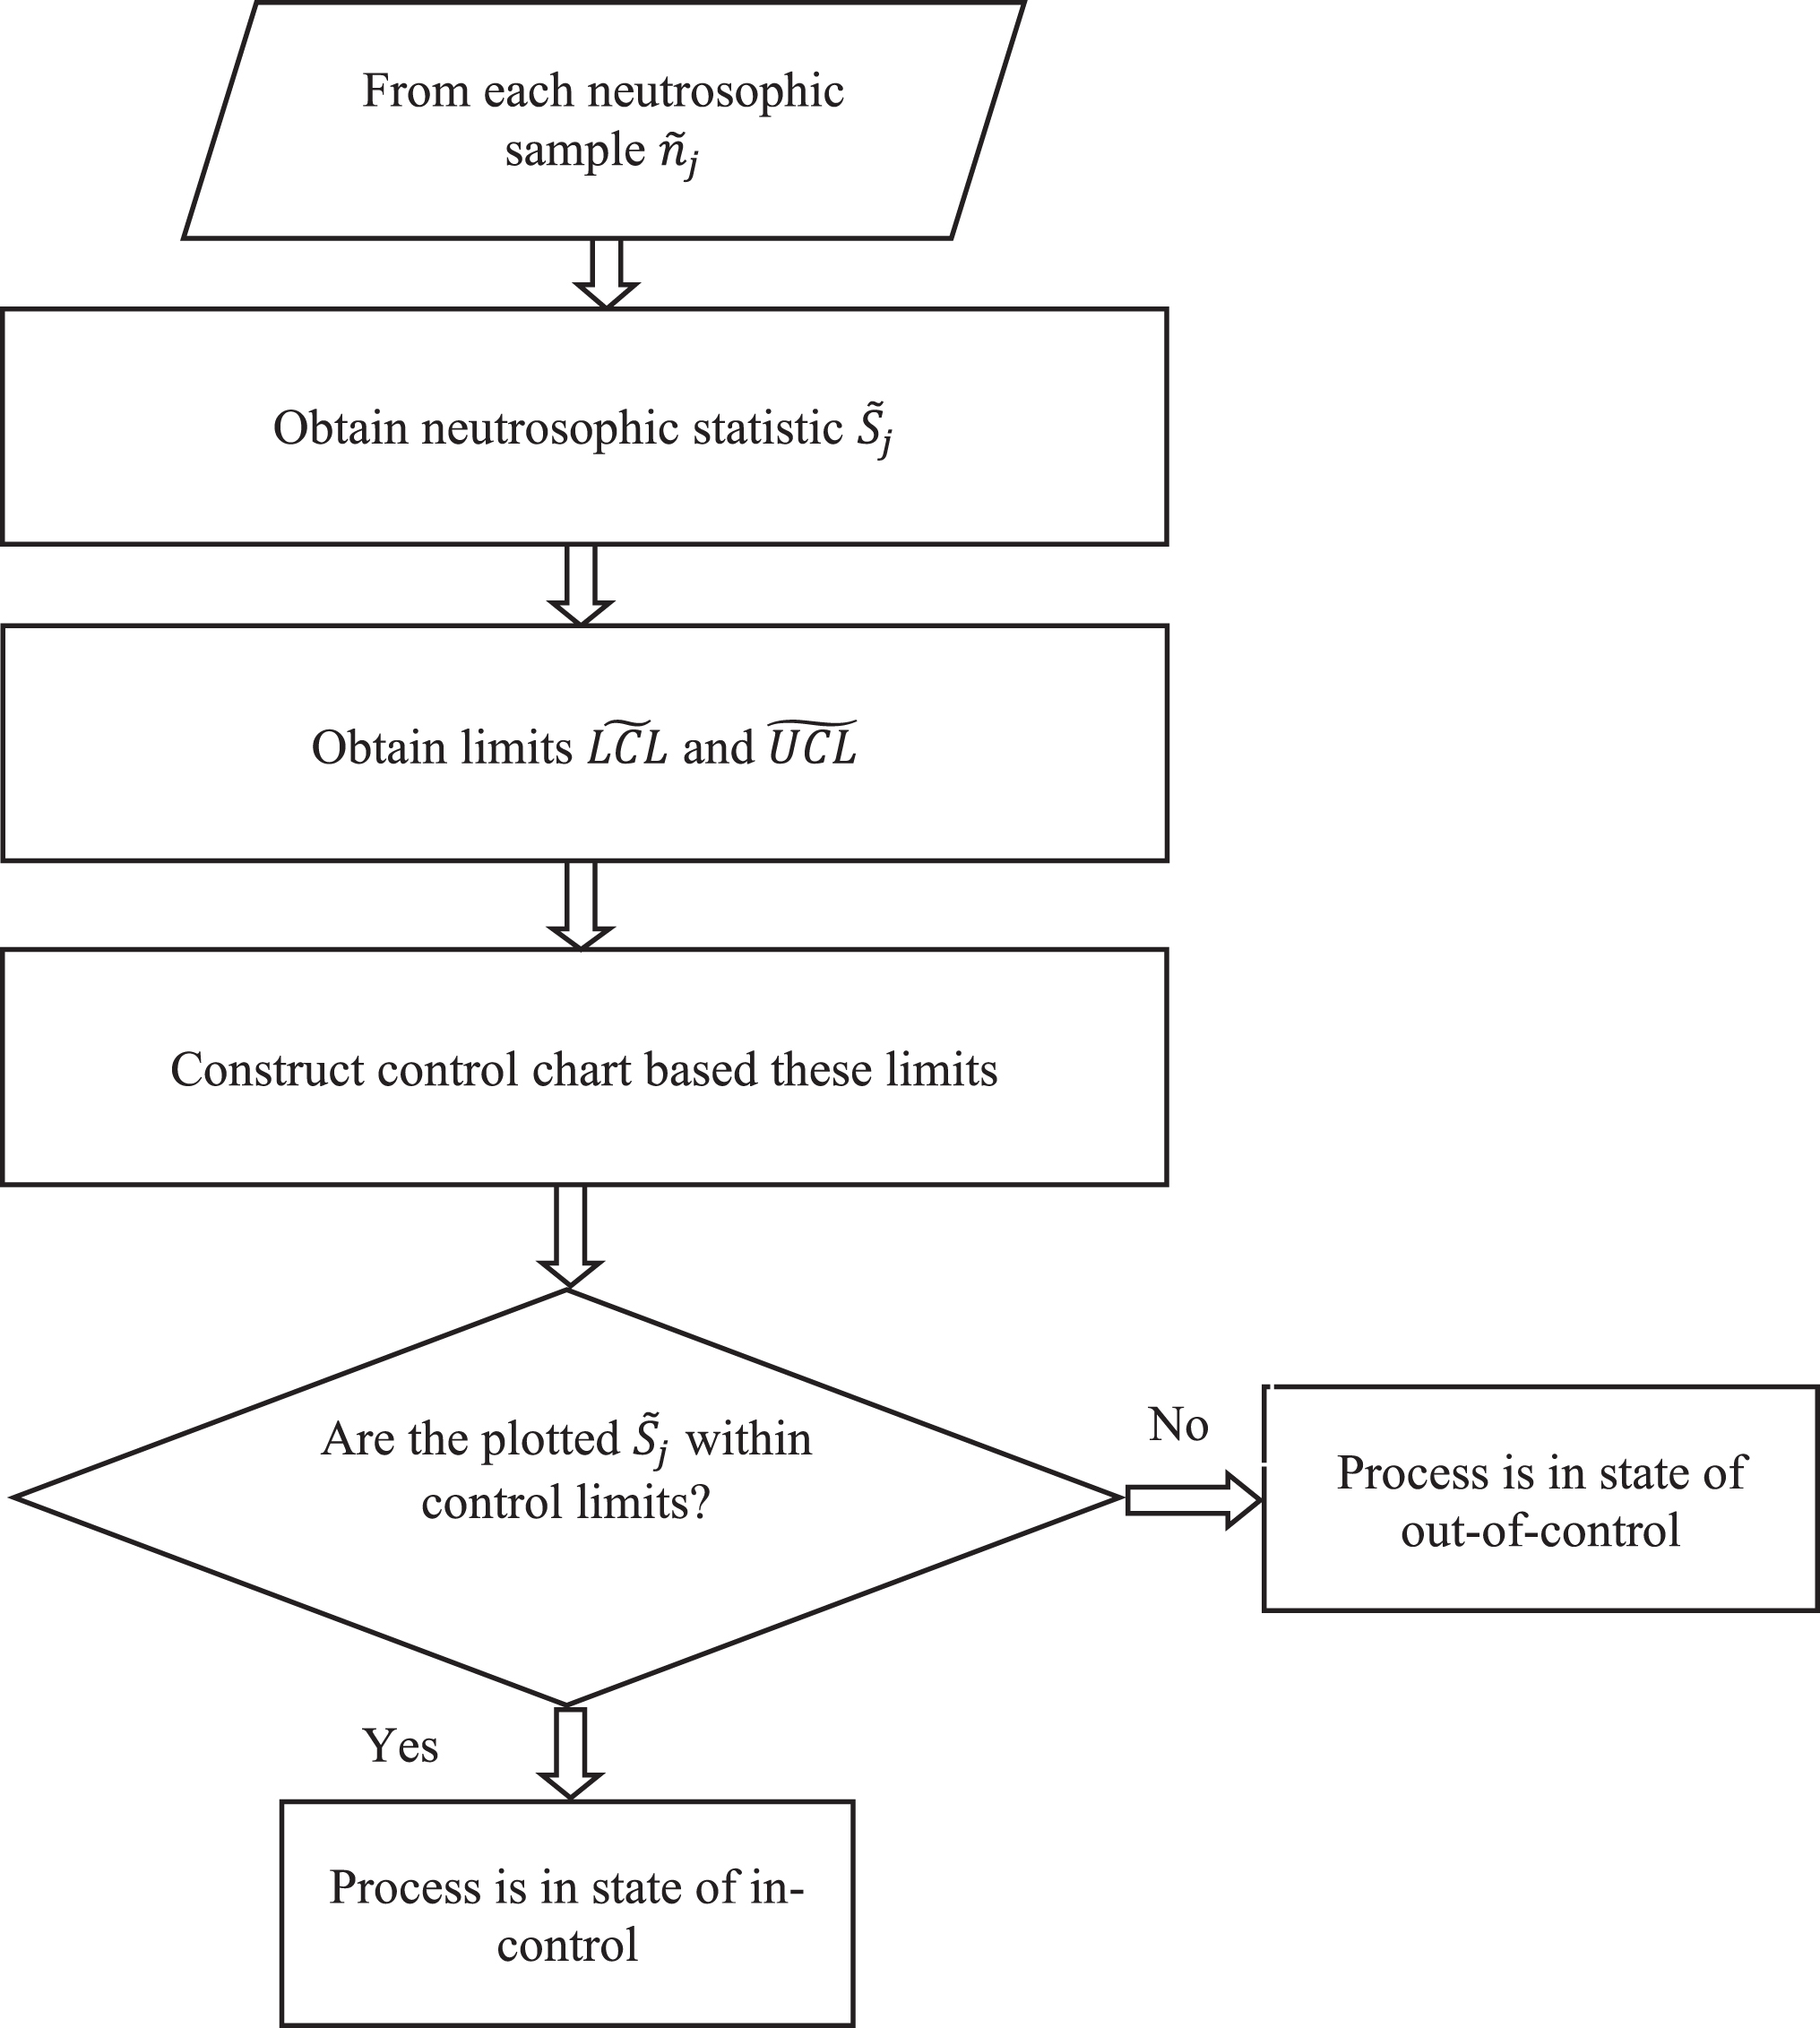
Flowchart of the proposed
Flowchart as given in Fig. 1 may also use to reveal the step-by-step procedure involved to check state of the observed process by using the proposed control chart.
Now, we define all parameters given in (1) in order to obtain the
The values of
The values of
The values of
The values of
Results in Table 1, 2, 3 and 4 show that if the process does not shift i.e., k = 1, the in control value of the average length never attend and it always remains less than 370. However, for larger neutrosophic sample say
In this section proposed
performance under the existing and proposed designs
We see from results reported in Table 5 and 6 that conventional S-control provides values within the indeterminacy intervals obtained from the proposed designed of
A simulation study has been conducted in this section in order to validate the analytical expressions derived for the
performance under the existing and proposed designs
Results given in Table 7 indicate that the simulated values of
An application of the proposed Neutrosophic S-control chart has been illustrated in this section. The proposed model has been implemented on manufactured parts obtained from an injection molding machine as mentioned in [34].
To assess the material behavior of the manufactured items, twenty samples each with five parts are collected and subjected to strength test. The compression strength for each part of all samples is recorded in a range and shown in Table 8. Thus, the compression strength for each manufactured part is assumed to be monitored in range instead of exact values. In order to monitor in control state of the manufacturing process, the Neutrosophic s-control chart has been established for strength crisp values. In this application size is taken as 5, i.e.,
Real Data and Neutrosophic measures
Real Data and Neutrosophic measures
The Neutrosophic control limits based on
The upper and lower values of
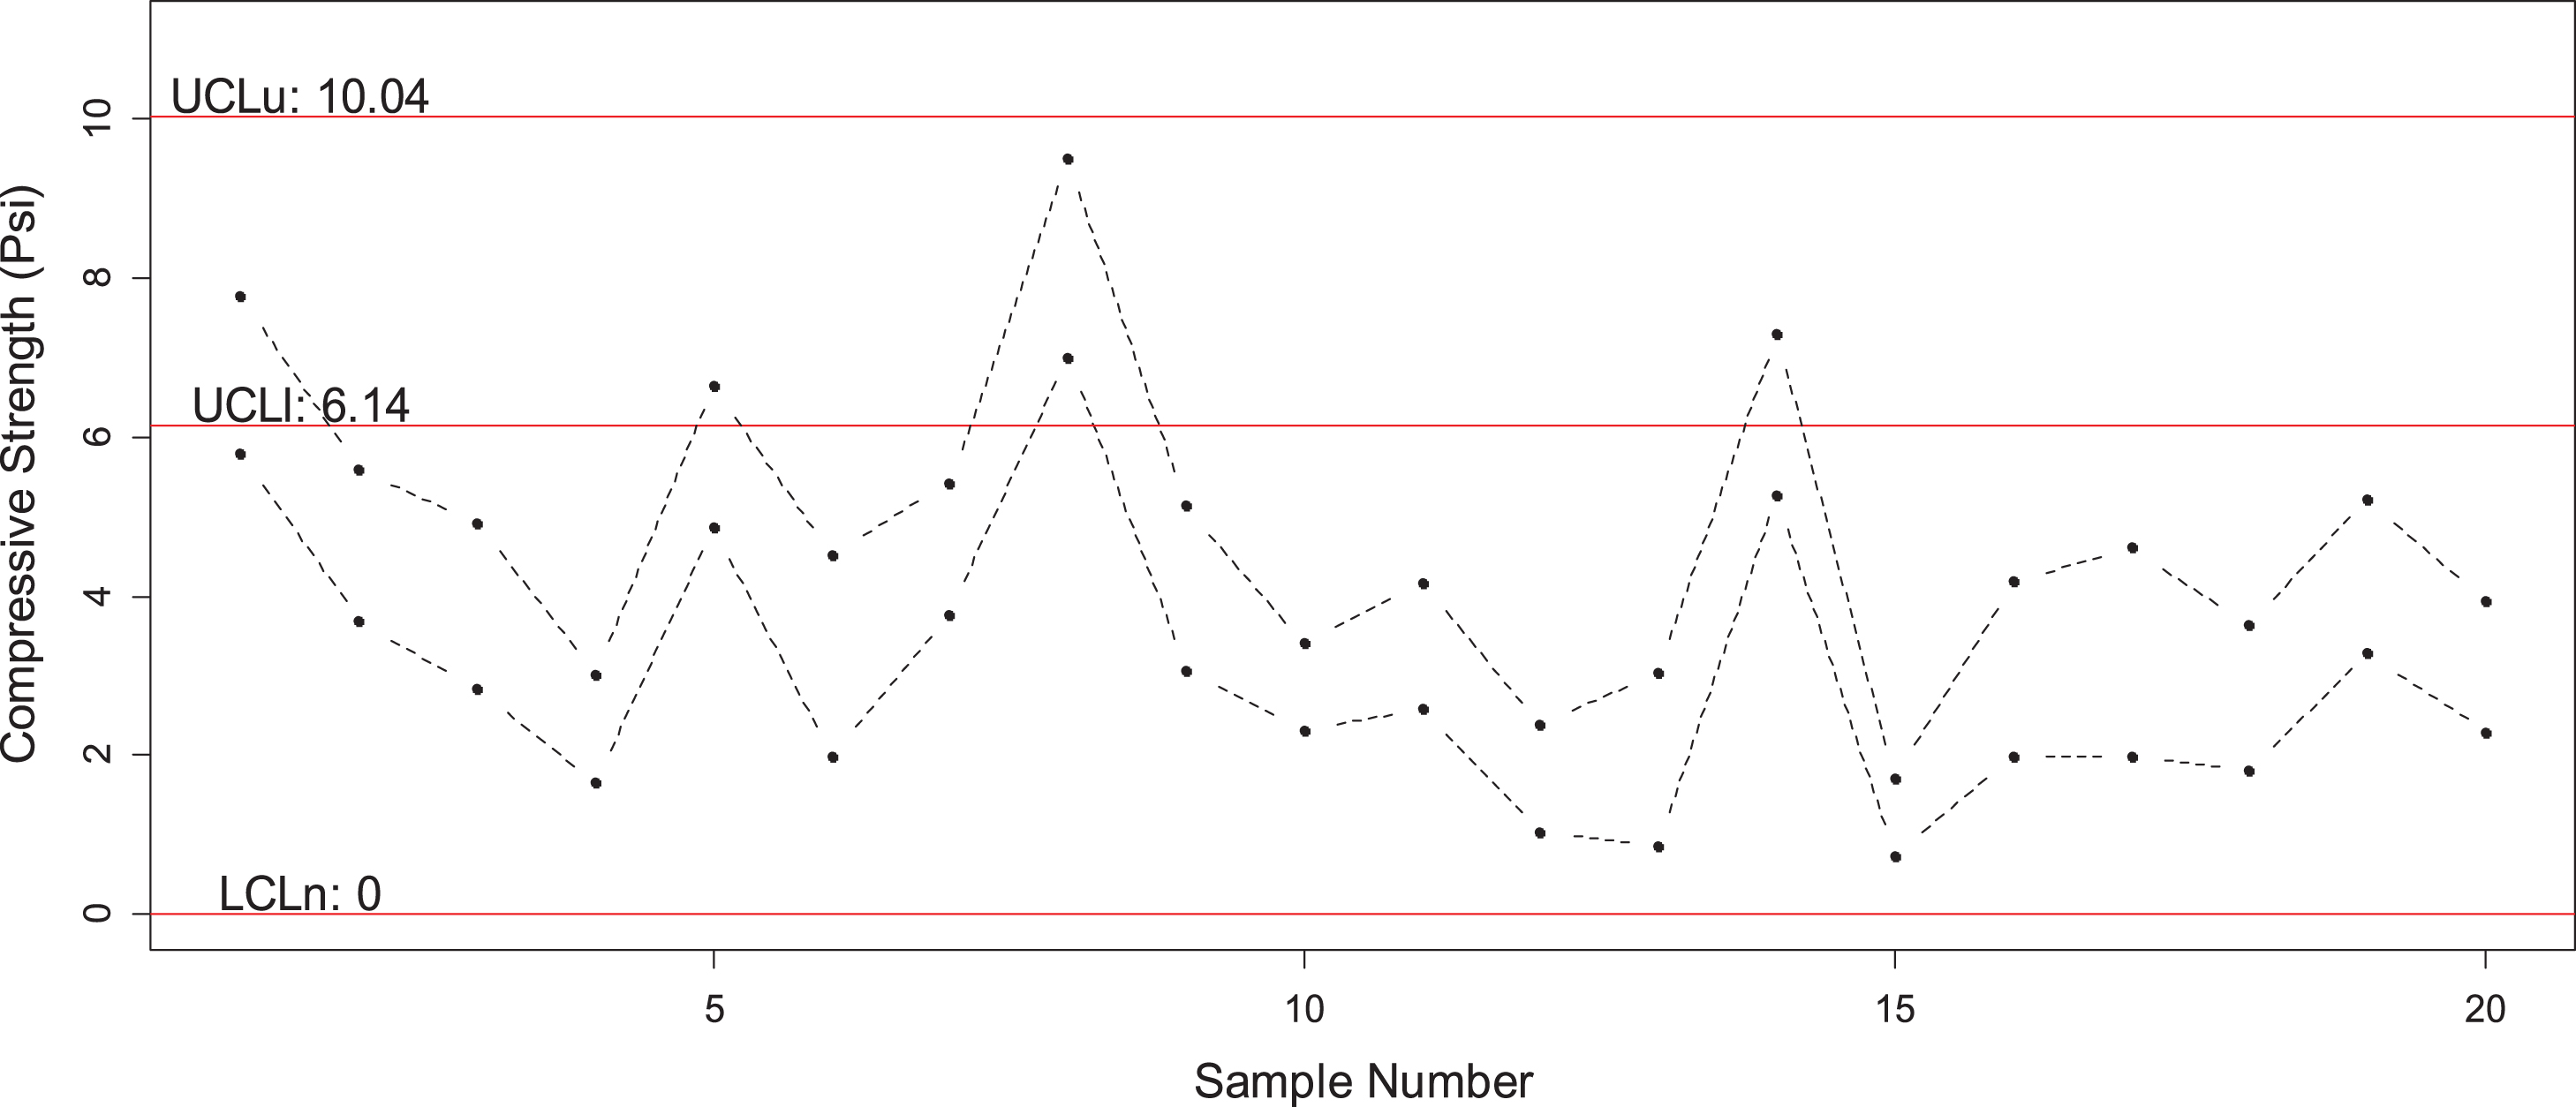
The
In Fig. 2, visual investigation indicates that all points are inside the control limits except value at the 7th sample is slightly over the lower
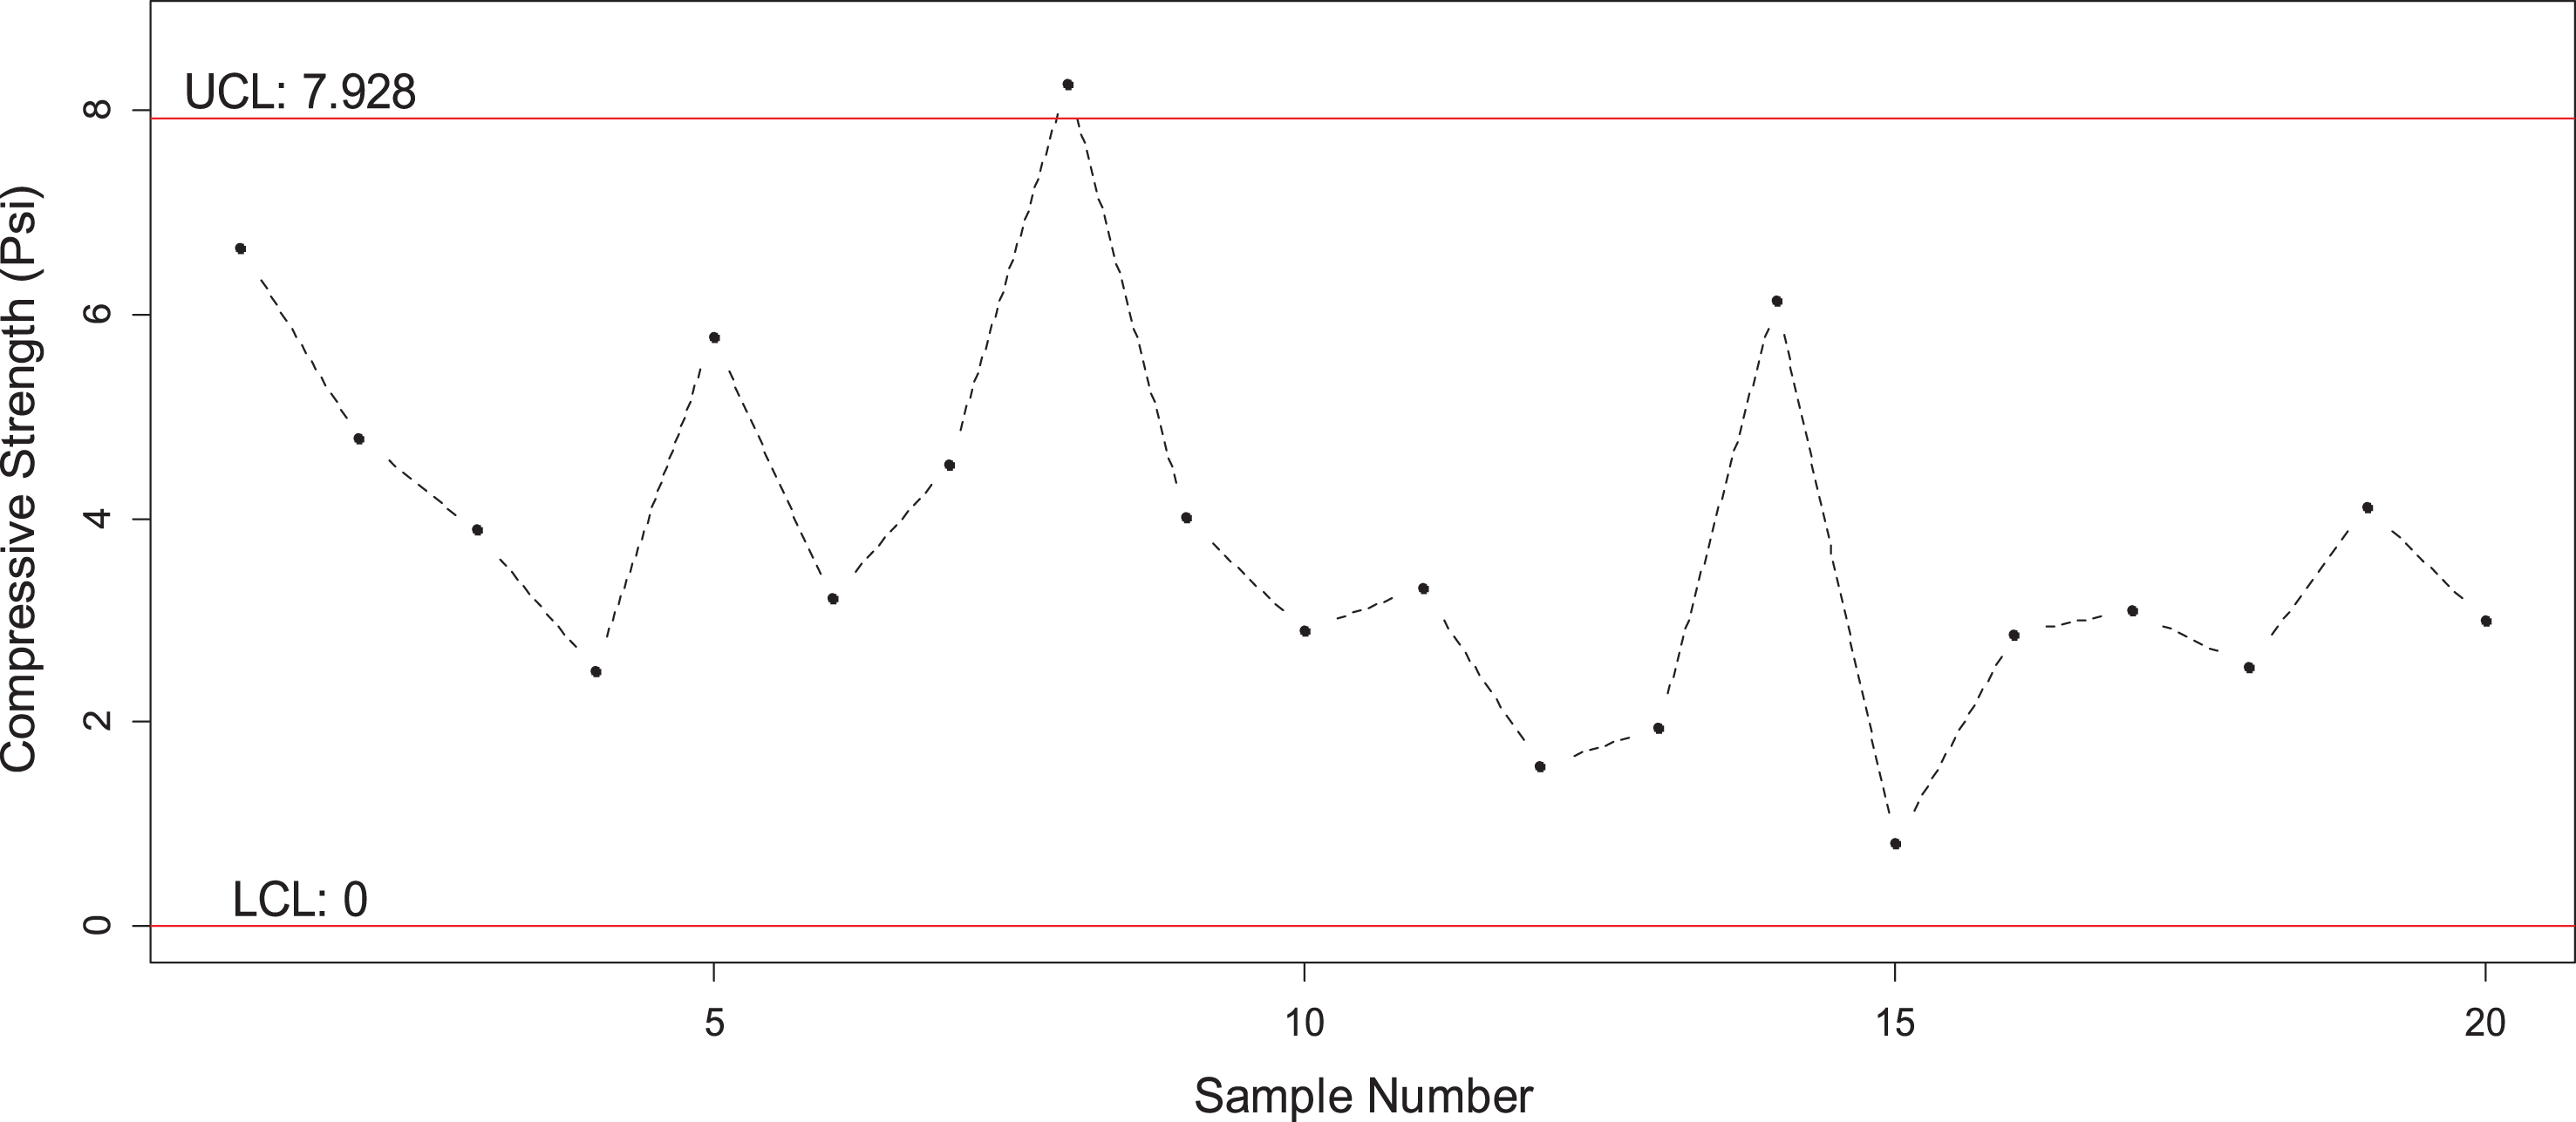
The existing S-control chart for real example data.
The designing of neutrosophic S-control chart has been presented in this study. The proposed chart represents a generalized extension of existing structure of S-control chart that could deal with data involving indeterminate measurements. The performance of proposed
Footnotes
Acknowledgments
The authors extend their appreciation to the Deanship of Scientific Research at Majmaah University for funding this work under project number (RGP-2019-5).