
Abstract
The effective detection of breast cancer is particularly essential for recovery and treatment in the initial phases. The existing methods are not successfully diagnosis breast cancer in the initial phases. Thus the initial recognition of breast cancer is expressively a great challenge for health professionals and scientists. To resolve the problem of initial stages recognition of breast cancer, we recommended a machine learning based diagnosis method which will excellently classify the malignant and benign persons. In the designing of our method machine learning model support vector machine has been applied to classify the malignant and benign persons. To increase the classification performances of the method, we used Minimal Redundancy Maximal Relevance and Chi-square algorithms to choose more appropriate features from the breast cancer dataset. The training/testing splitting technique is used for training and testing of the model. Additionally, the performance of the model has been evaluated by performance assessment metrics. The experimental results demonstrated that the classifier support vector machine obtained best classification performance on the selected subset of features as selected by Minimal Redundancy Maximal Relevance feature selection algorithm. The performances of support vector machine on selected features by Chi square feature selection algorithm are low as compared to Minimal Redundancy Maximal Relevance algorithm. From experimental results analysis, we determined that the integrated system based on Minimal Redundancy Maximal Relevance and support vector machine performances are high due to the selection of more suitable features and obtained 99.71% accuracy. According to McNemar’s statistical test the proposed method is more significant then existing methods. Thus, we recommend that the proposed diagnosis method for effective detection of breast cancer.
Keywords
Introduction
Breast cancer (BC) is a common sickness which affected females in the globe according to American Institute for Breast Cancer Research [1], and 2 million new people were suffered in 2018. BC is 5 th major reasons of ladies dying as compared to other types of cancers. The BC, really a malignant tumor that generate in breast cell. A collection of splitting cells that form a lump or mass of extra tissue which is called Tumors and these tumors can be either malignant or benign. In various countries with developed technology of science for health, the 5-year survival rate of early stage BC is 80-90% and dropping to 24% for BC detection at the early phase [2]. To diagnosis, the BC numerous invoice based methods are used. In biopsy method [3] breast tissues use for testing and the results are relatively correct. Though, to take a biopsy from the breast is hurting for the patient. Additional BC identification method is mammogram [4] which is applied for detection of BC. In this method 2 dimensional (2D) projection image of the breast is considered. But, the mammogram method not detect the benign cancer successfully. Another, invoice based method for analysis of the breast is magnetic reasoning imaging (MRI) [5] which is actual complicated test and provides outstanding results for 3 dimensional (3D) images and shows the dynamic functionality. These invoice based diagnosis methods are actual complicated to conducts and the results are not successfully diagnosis the BC. Furthermore, these methods need long time to produce the results [6]. To resolve these problems in invasive-based approaches for diagnosis of BC, a noninvasive based method such as machine learning(ML) methods are more effective and consistent. To classify breast tissues that either be malignant or benign ML methods have been used in the literature. The concerned literature of ML methods for the detection of BC has been stated in this paper concisely as bellow. Azar et al. in [4] suggested a method for detection of BC. They used three classifications methods such as Radial Basis Function (RBF), Probabilistic Neural Network (PNN) and Multi-layer Perceptron (MLP). These algorithms were trained and tested with BC dataset. The performance assessment metrics were used the model performance assessment. The MLP achieved 97.80% and 97.66% accuracy for training and testing individually. In additional study, Emina et al. [7]suggested a BC diagnosis method use two Wisconsin BC (WBC) datasets beside with genetic algorithm (GA) for feature selection procedure and rotation forest (RF) classifier for classification purposes. The RF achieved 99% classification accuracy on selected features as selected by GA. In [8] proposed a identification method GA-MOO-NN for BC identification. The GA algorithm was used for selecting important features. They split the dataset into three parts 50% for training, 25% for testing and 25% for validation. The proposed approach gained the accuracy of 98.85% and 98.10% individually in the best and average case. Hasan et al. [9] suggested a method for the identification of BC using symbolic regression of Multigene genetic programming.The 10-fold cross-validation was used and obtained 99% accuracy. In [10]designed a method to analysis BC and reached 98.8% accuracy. While in [11] suggested a classification system used fuzzy-GA method and obtained 97.36% accuracy. Akay in [12] designed a BC detection system utilized the F-score technique for features selection and support vector machine and gained high results. Zheng et al. [13] applied a k-means algorithm for variable selection and extraction and joint with SVM for detection of BC.The suggested system accomplished high accuracy and short processing time. Naga et al. [14] applied hybridized principal components analysis joint with diverse classifiers and used to dissimilar BC datasets and attained high results. In [15] developed a method based on Memetic Pareto artificial neural network for discovery of BC. The investigation results confirmed that the suggested method attained high accuracy and low execution time. Cede’s et al. [16] suggested a technique for BC identification applying artificial meta plasticity multi-layer perceptron and achieved accuracy 99%. In [17] developed a BC prediction method based on decision tree and used the under-sampling technique to balance the training data. The experimental results display that the suggested technique attained good accuracy. Zheng et al. [13] suggested a BC identification method based on k-means algorithm and SVM. The k-mean was used for feature mining and SVM was used for classification. Onan [18] considered an intelligent method for identification of BC.He applied fuzzy rough for selection of an instance, and feature selection by reliability. For BC diagnosis he used the fuzzy-rough nearest neighbor classifier. In [19] proposed a method based on particle swarm optimization integrated with non-parametric kernel density estimation for BC detection. Similarly in [20] developed a BC diagnosis method using mixture ensemble of convolutional neural networks and obtained 96.39% accuracy. Zaher et al. [21] proposed a breast cancer classification method using deep belief networks and achieved 99.68% classification accuracy.
Additionally to provide good services to BC patient home health care logistic services are very necessary which are started from a pharmacy are scheduled and routed to do different care services at patient ’s home [22]. Similarly in another study [23] proposed an efficient heuristic for a home health care issue.The home health care operations including a set of nurses and patients have been developed recently by both academia and health practitioners to consider elderlies preferences willing to receive their cares at their homes instead of hospitals or retirement homes. In [24] home health care services to provide nursing and general hygiene cares at patient home have been presented to assist the patients at home.
In the above literature the proposed breast cancer diagnosis techniques limitation and advantages have been summarized in Table 1 for better understanding the important of our proposed method. All these previous proposed methods used various techniques to diagnosis the breast cancer at early stages. However, all these methods have lack of prediction accuracy and high computation time for prediction of breast cancer. According to Table 1 the prediction accuracy of breast cancer diagnosis method need further improvement for efficient and accurate detection at early stages for better treatment and recovery. Thus, the major issues in these existing methods are low accuracy and high computation time and these might be due the use of irrelevant features in dataset. In order to tackle these problem new methods are needed to detect breast cancer correctly. The improvement in prediction accuracy is a big challenge and research gap.
Summary of the previous methods
Summary of the previous methods
Thus, the major objectives of this paper is to developed a predictive approach based on ML to effectively detect BC. Machine learning model SVM is used for classification of BC malignant and benign people, since the classification performance of SVM is high and numerous scholar in the literature used SVM. The Minimum Redundancy and Maximum Relevance (mRMR) and Chi-square algorithms are used for the selection of features that increases the performances. We adopted the mRMR and Chi square algorithms for suitable feature selection in this study since performance of mRMR and Chi-square FS algorithms based approaches are high as compare to other approaches of classification for BC and healthy people. These works used other feature selection and optimization algorithms such as LASSO, LLBFS [29], Relief with BFO [30], Relief [31]. Similarly adopted the brain storm optimization algorithm to tackle the stochastic multi objective energy conscious distribution permutation flow shop scheduling problem with the total tardiness constraint [32], fuzzy multi-objective model [33], and MSEO [34]. Furthermore Training/Testing splits validation technique is used to select the best hyper Parameters for best model assessment. Performance assessment metrics are used to check the performances of the proposed method. The proposed method has been evaluated on BC datasets. Additionally, the proposed approach fills in a gap on feature selection and classification using Wisconsin Diagnostic Breast Cancer data by properly matching the experimental design.
The important contributions of this research study are the following: Firstly, the mRMR and Chi-square algorithms are used to select more related features from BC dataset. Secondly, SVM performances have been checked on selected features subsets as selected by mRMR and Chi-square algorithms. Similarly, the performance of SVM also checked on full features set and compared with performances on best-selected features subset at which the model gained optimal accuracy. Furthermore, the classification performances of classifier are higher with features selected by mRMR FS algorithm. Lastly, we summarized that the integrated method based on mRMR and SVM effectively diagnosis BC. Furthermore, according to McNemar’s statistical method the proposed method is more significant then existing methods.
This article remaining sections are organized into 3 sections. In Section 2 describe the BC datasets, preprocessing methods, features selection algorithms mRMR, Chi-square, and classification algorithm SVM in detail. Additionally, the validation methods, performance assessment metrics and statistical tests are also explained. In Section 3 experimental results are reported. The conclusion and future work are given in Section 4.
BC datasets
The Wisconsin Breast Cancer Database (January 8, 1991) (WBC) [35] and WDBC dataset [36] are used in this work for testing the proposed technique.
Feature selection Algorithms
In this study mRMR and Chi-square feature selection algorithms have been used for related features selection for classification of BC and healthy subjects. Before providing the further detail, some common symbols, notation used in the paper are presented in Table 2.
Mathematical symbols and notations used in the paper
Mathematical symbols and notations used in the paper
The mRMR feature selection algorithm selects those features that are related to the target output label. These selected features might be redundant variables which must be handled. Heuristic search method used in mRMR and select optimum features that have maximum relevance and minimum redundancy. It checks one feature at a cycle and computes pairwise redundancy. The mRMR does not take care of the joint association of features [37]. The pseudo-code mRMR algorithm is described in algorithm 1. In algorithm, main computation of mutual information (MI) between two features is computed. This function is calculated between each pair of features instead of many pairs of features being irrelevant for the last result, mRMR not suitable for large domain feature selection problems. The following is the pseudo-code of mRMR algorithm.
initial feature is the number of features in original features set and reduced feature is the required number of features
1:
2: Relevance = mutual info (f i , class);
3: Redundancy = 0;
4:
5: Redundancy +=mutual info;
6:
7: mrmrValue[ ]= relevance-redundancy;
8:
9: Selected features=sort (mrmrValues).take (reduced feature);
Chi-squared (X2 statistic) feature selection algorithm
Chi-squared is feature selection algorithm and in different research works used it for feature selection [38], and [25]. This algorithm calculates X2 between each feature and target variable and choose the required number of features with the best X2 scores. The institution is that if a feature is independent to the target variable it is uninformative for classifying observations. The chi-square is expressed mathematically in Eq. 1
In this paper, SVM is used for BC and healthy people classification. The support vector machine (SVM) is a machine learning algorithm which has been mostly used for classification problems [30, 39–41] and [26]. SVM used a maximum margin strategy that transformed into solving a complex quadratic programming Problem. The high performance of SVM in classification, various applications widely applied [6], and [42]. In a binary classification problem, the instances are separated with a hyper plane w T x + b = 0, where w is a d-dimensional coefficient vector, which is normal to the hyperplane of the surface and b, is offset value from the origin, x is data set values. The SVM get results of w and b. The W can solve by introducing Lagrangian multipliers in the linear case. The data points on borders are called support vectors. The solution of w can be expressed in Eq. 2:
The +ve semi definite functions that obey the Mercer condition as kernel functions [43] Such as the polynomial kernel as expressed in Eq. 5:
In these experiments 70% and 30% of data used for training and testing model.
Performance assessment metrics
In this work, performance evaluation metrics are used. Table 3 shows the confusion matrix(CM) of the binary classification problem.
According to Table 3 we compute the following metrics and mathematically expressed in Eq. 7-12.
TP (True Positive) if the subject is classified as BC
TN (True Negative) if a healthy subject is classified as healthy
FP (False positive) if a healthy subject is classified as BC
FN (False Negative) if a BC is classified as healthy.
Classification Accuracy(Ac): The accuracy shows the overall performance of the classification system.
Sensitivity (Sn) /Recall:
MCC: MCC show model predictive capability and generate a value in range of -1, +1.
In oder to compare the performance of machine learning supervised Models, statistical tests are necessary. In this study we used MCNemar’s test [47] to compare the predictive performance/accuracy of proposed method and others methods for breast cancer detection. The description of McNemar’s test is describe below. To use McNemar’s test, the instances of data set S split into a training set R and test set T. We train our method and others methods with training data and evaluating on test data set. For each instance x ∈ T of the test set we determine how classified by two models. The test is applied to a 2 × 2 contingency table, that report the results of two tests on a instance of n subjects as shown in Table 4.
Contingency Table
Contingency Table
Where the total number of instances in the test set are n and mathematically written as n = n00 + n01 + n10 + n11. Two tails hypothesis, under the null hypothesis, the two models should have same accuracy or error rate, which can be written mathematically H0 : n01 = n10 The alternate hypothesis, the two model should have different accuracy or error rate which can be expressed mathematically as H1 : n01 ≠ n10. The McNemar’s test statistic is computed in equation 13:
The selection of significance level, the test statistic or p-value interpreted as below: As we know that the test statistic is chi-square distribution with 1 degree of freedom. Additionally the confidence level and α are complement of each other. The alpha is the level of significant and if the value of alpha is low then confidence level will be high and the model will be more significant. Similarly, if the alpha value is high then confidence level will be low and the model is less significant. If P > α : then H0 is fail to reject, the models have no difference, If p < = α: then H0 is rejected and alternate H1 is accepted the models have difference performance when trained on the particular training set R.
The following is the procedure of the proposed predictive system for BC detection in algorithm 1 and graphically shown in Figure 1.
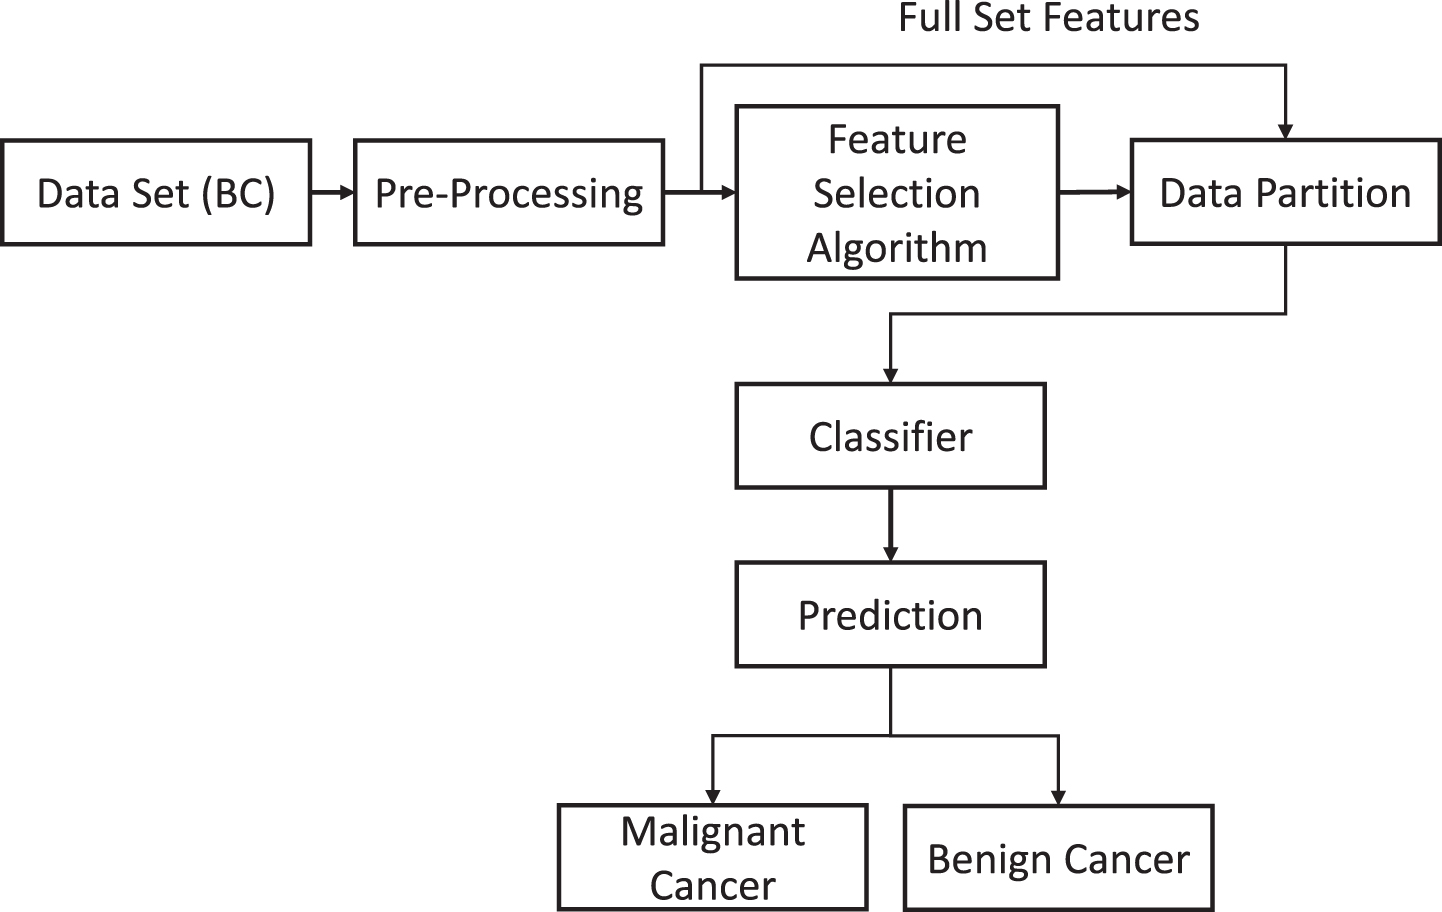
The proposed predictive system for breast cancer.
1: Begin
2: Pre-processing of dataset;
3: Best Feature selection set by mRMR and Chisquared algorithms;
4: Training and testing splits approach;
5: Train the SVM on the Training data;
6: test model SVM using testing data;
7: Computes the model performance evaluation metrics;
8: End
We conduct different experiments for BC. The WBC dataset [35] and WDBC data set [36] are used in this work. The data set divided into 70% and 30% for training testing in these experiments. In order to check the model performances, various evaluation measures are used. Additionally McNemar’s statistical test has been used for comparison of proposed method with existing methods. Preprocessing techniques are deployed on a dataset for the normalization of the dataset. All experiments are conducted in python on an Intel(R) Core TM i5-2400CPU @3.10 GH, RAM 4 GB and Windows 10 Pro.
preprocessing results
The database has instances size of 699 with 11 attributes and one is sample code number, 9 are real values features. The target label has two classes in order to denote the malignant (4) or benign (2) people. The class distribution is 458 benign and 241 malignant subjects. During the preprocessing 16 missing values, attributes of instances are removed thus leftover instances for two classes such as 444 benign cancers and 239 malignant cancers and 9 actual features. The other preprocessing methods [44], standard-scalar(SS) and Min-Max-Scalar are used to the dataset preprocessing. SS ensures that every feature has the mean 0 and variance 1, thus all features have the equal coefficient. Min-Max Scalar shifts the data in such a way that all features are ranged between 0 and 1. The information and description of 683 instances with 9 features of the dataset is given in Table 5 along with some statistical measures which computed automatically. All the features are visually demonstrated in Figure 2 for a better understanding. The heat map is a graphical representation of data. The individual values contained in a matrix are demonstrated as colors. It is a bit like looking a data table from above. It is good to display a general view of numerical data and not to extract specific data point. Figure 3 shows the heat map of the dataset used in this study.
Features information and description with some statistical measures of WBC (January 8, 1991)
Features information and description with some statistical measures of WBC (January 8, 1991)
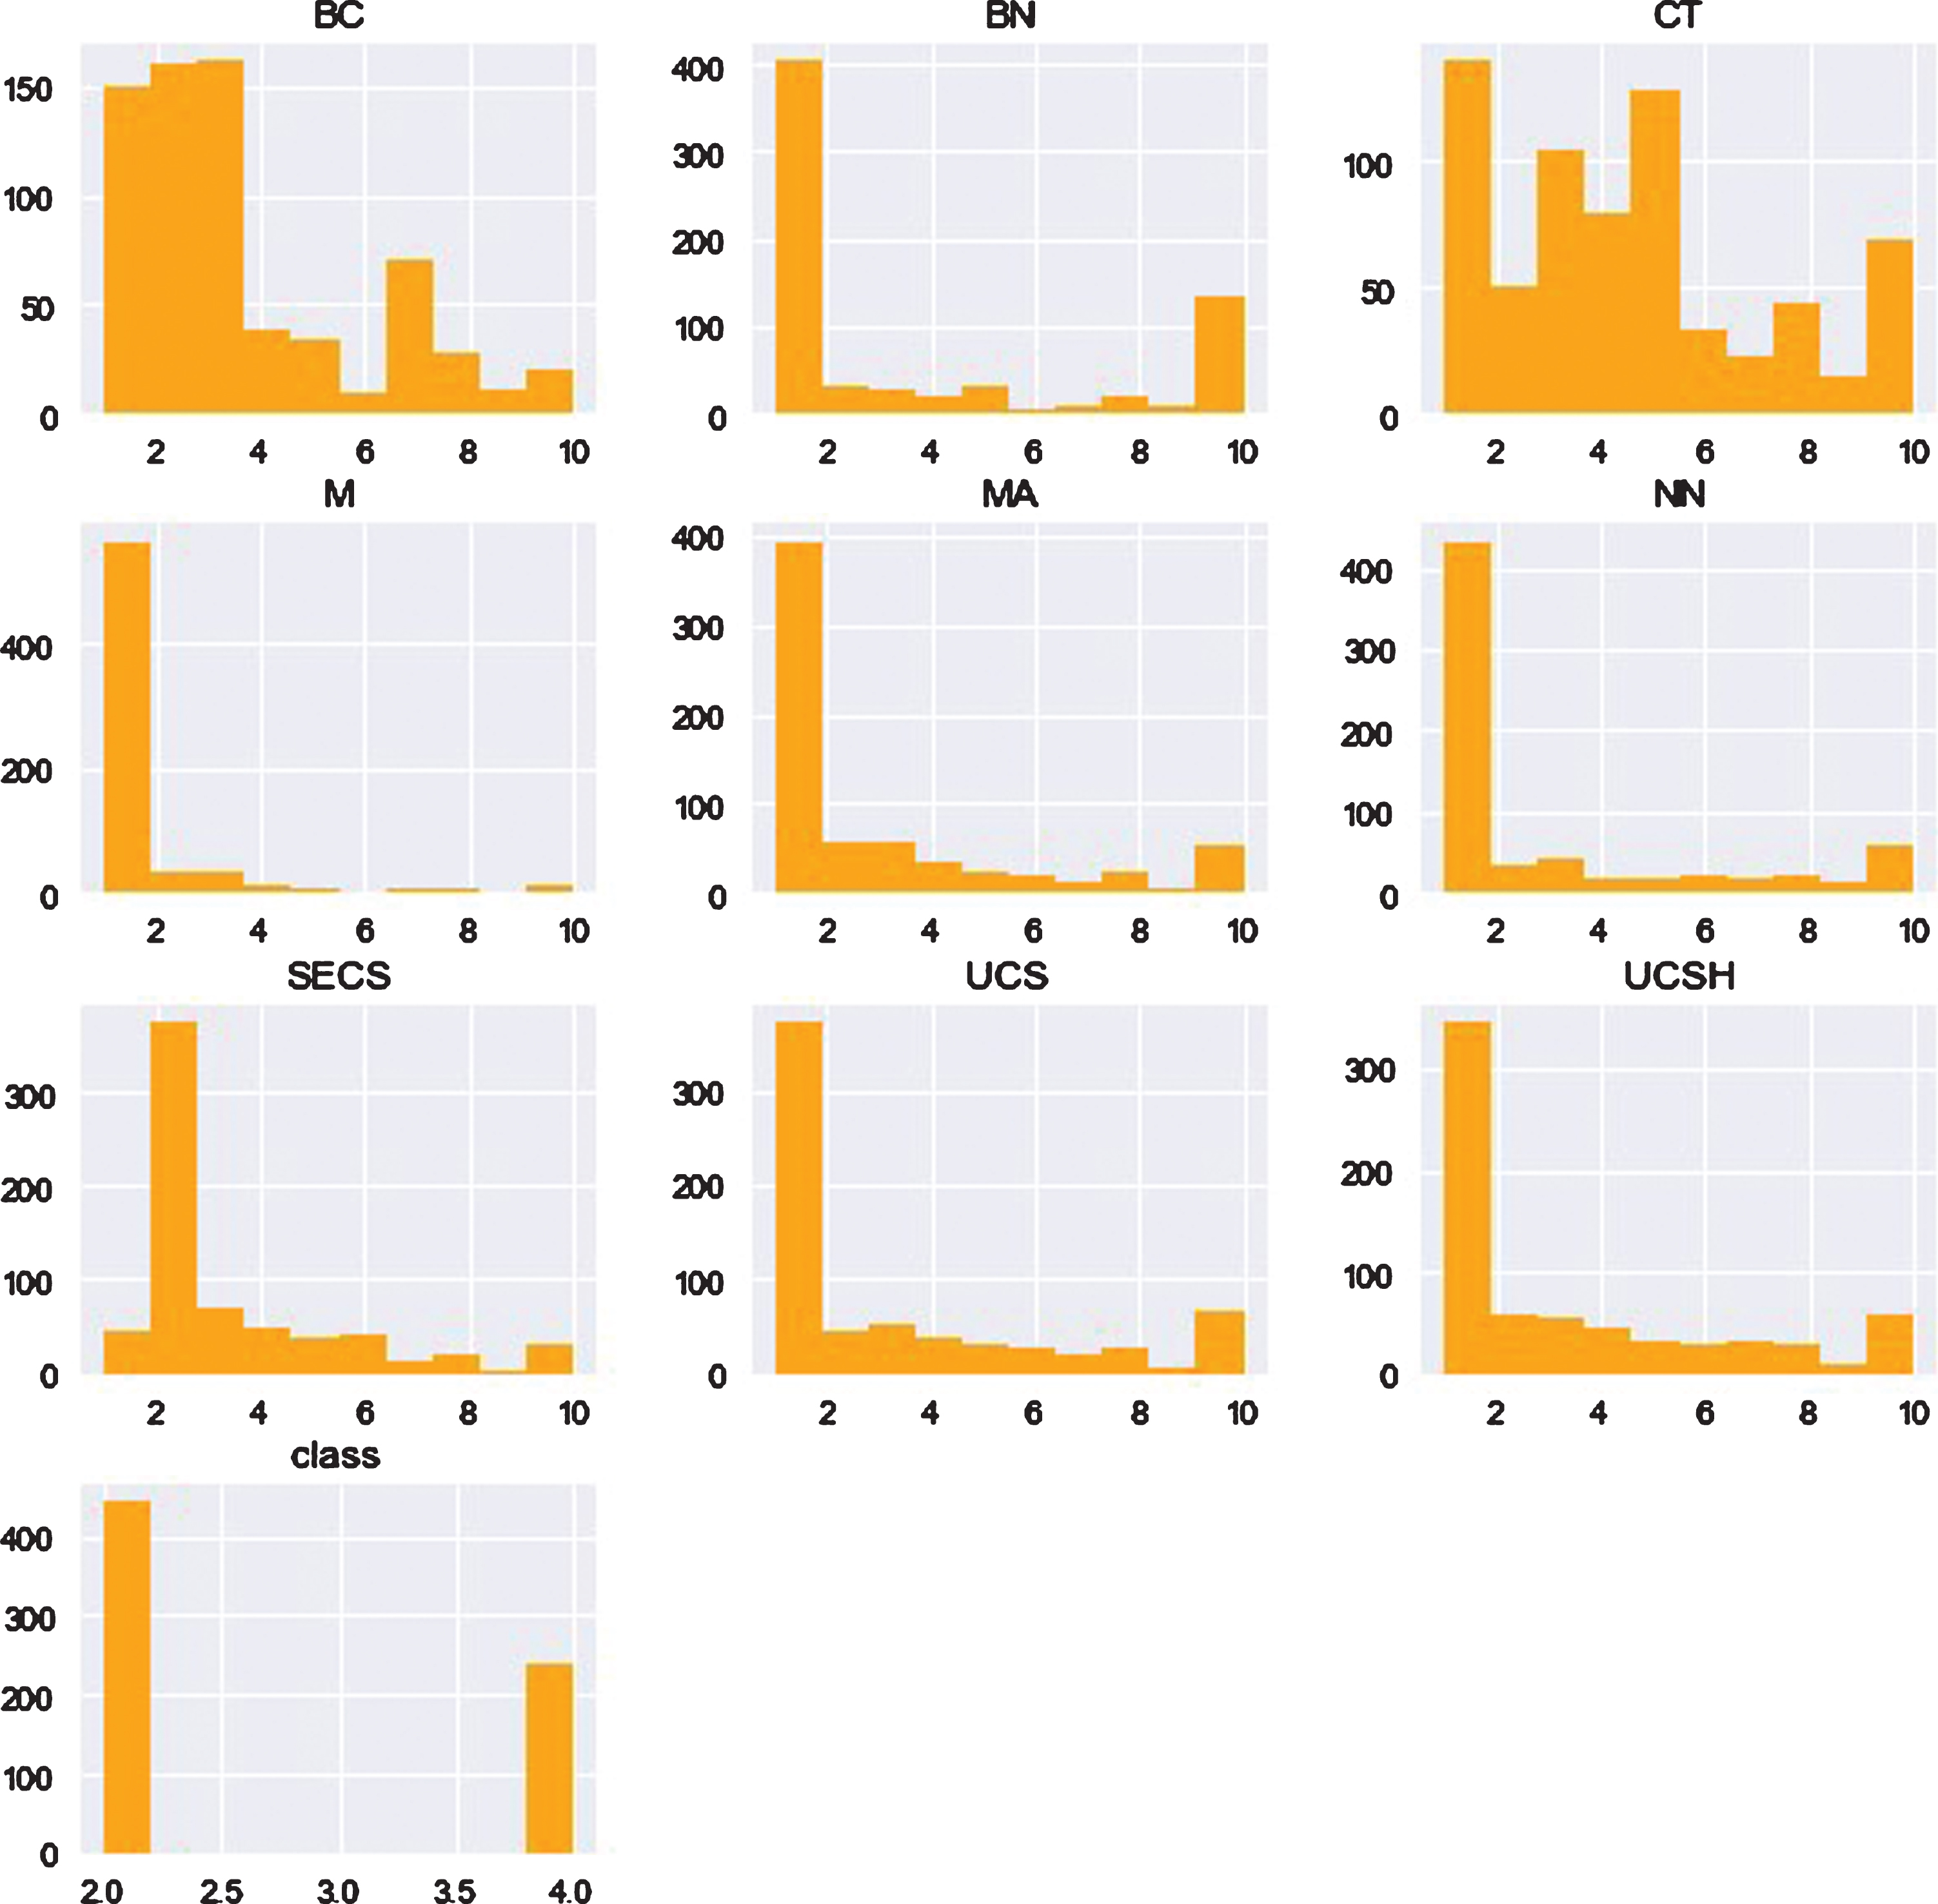
Visual representation of the features.
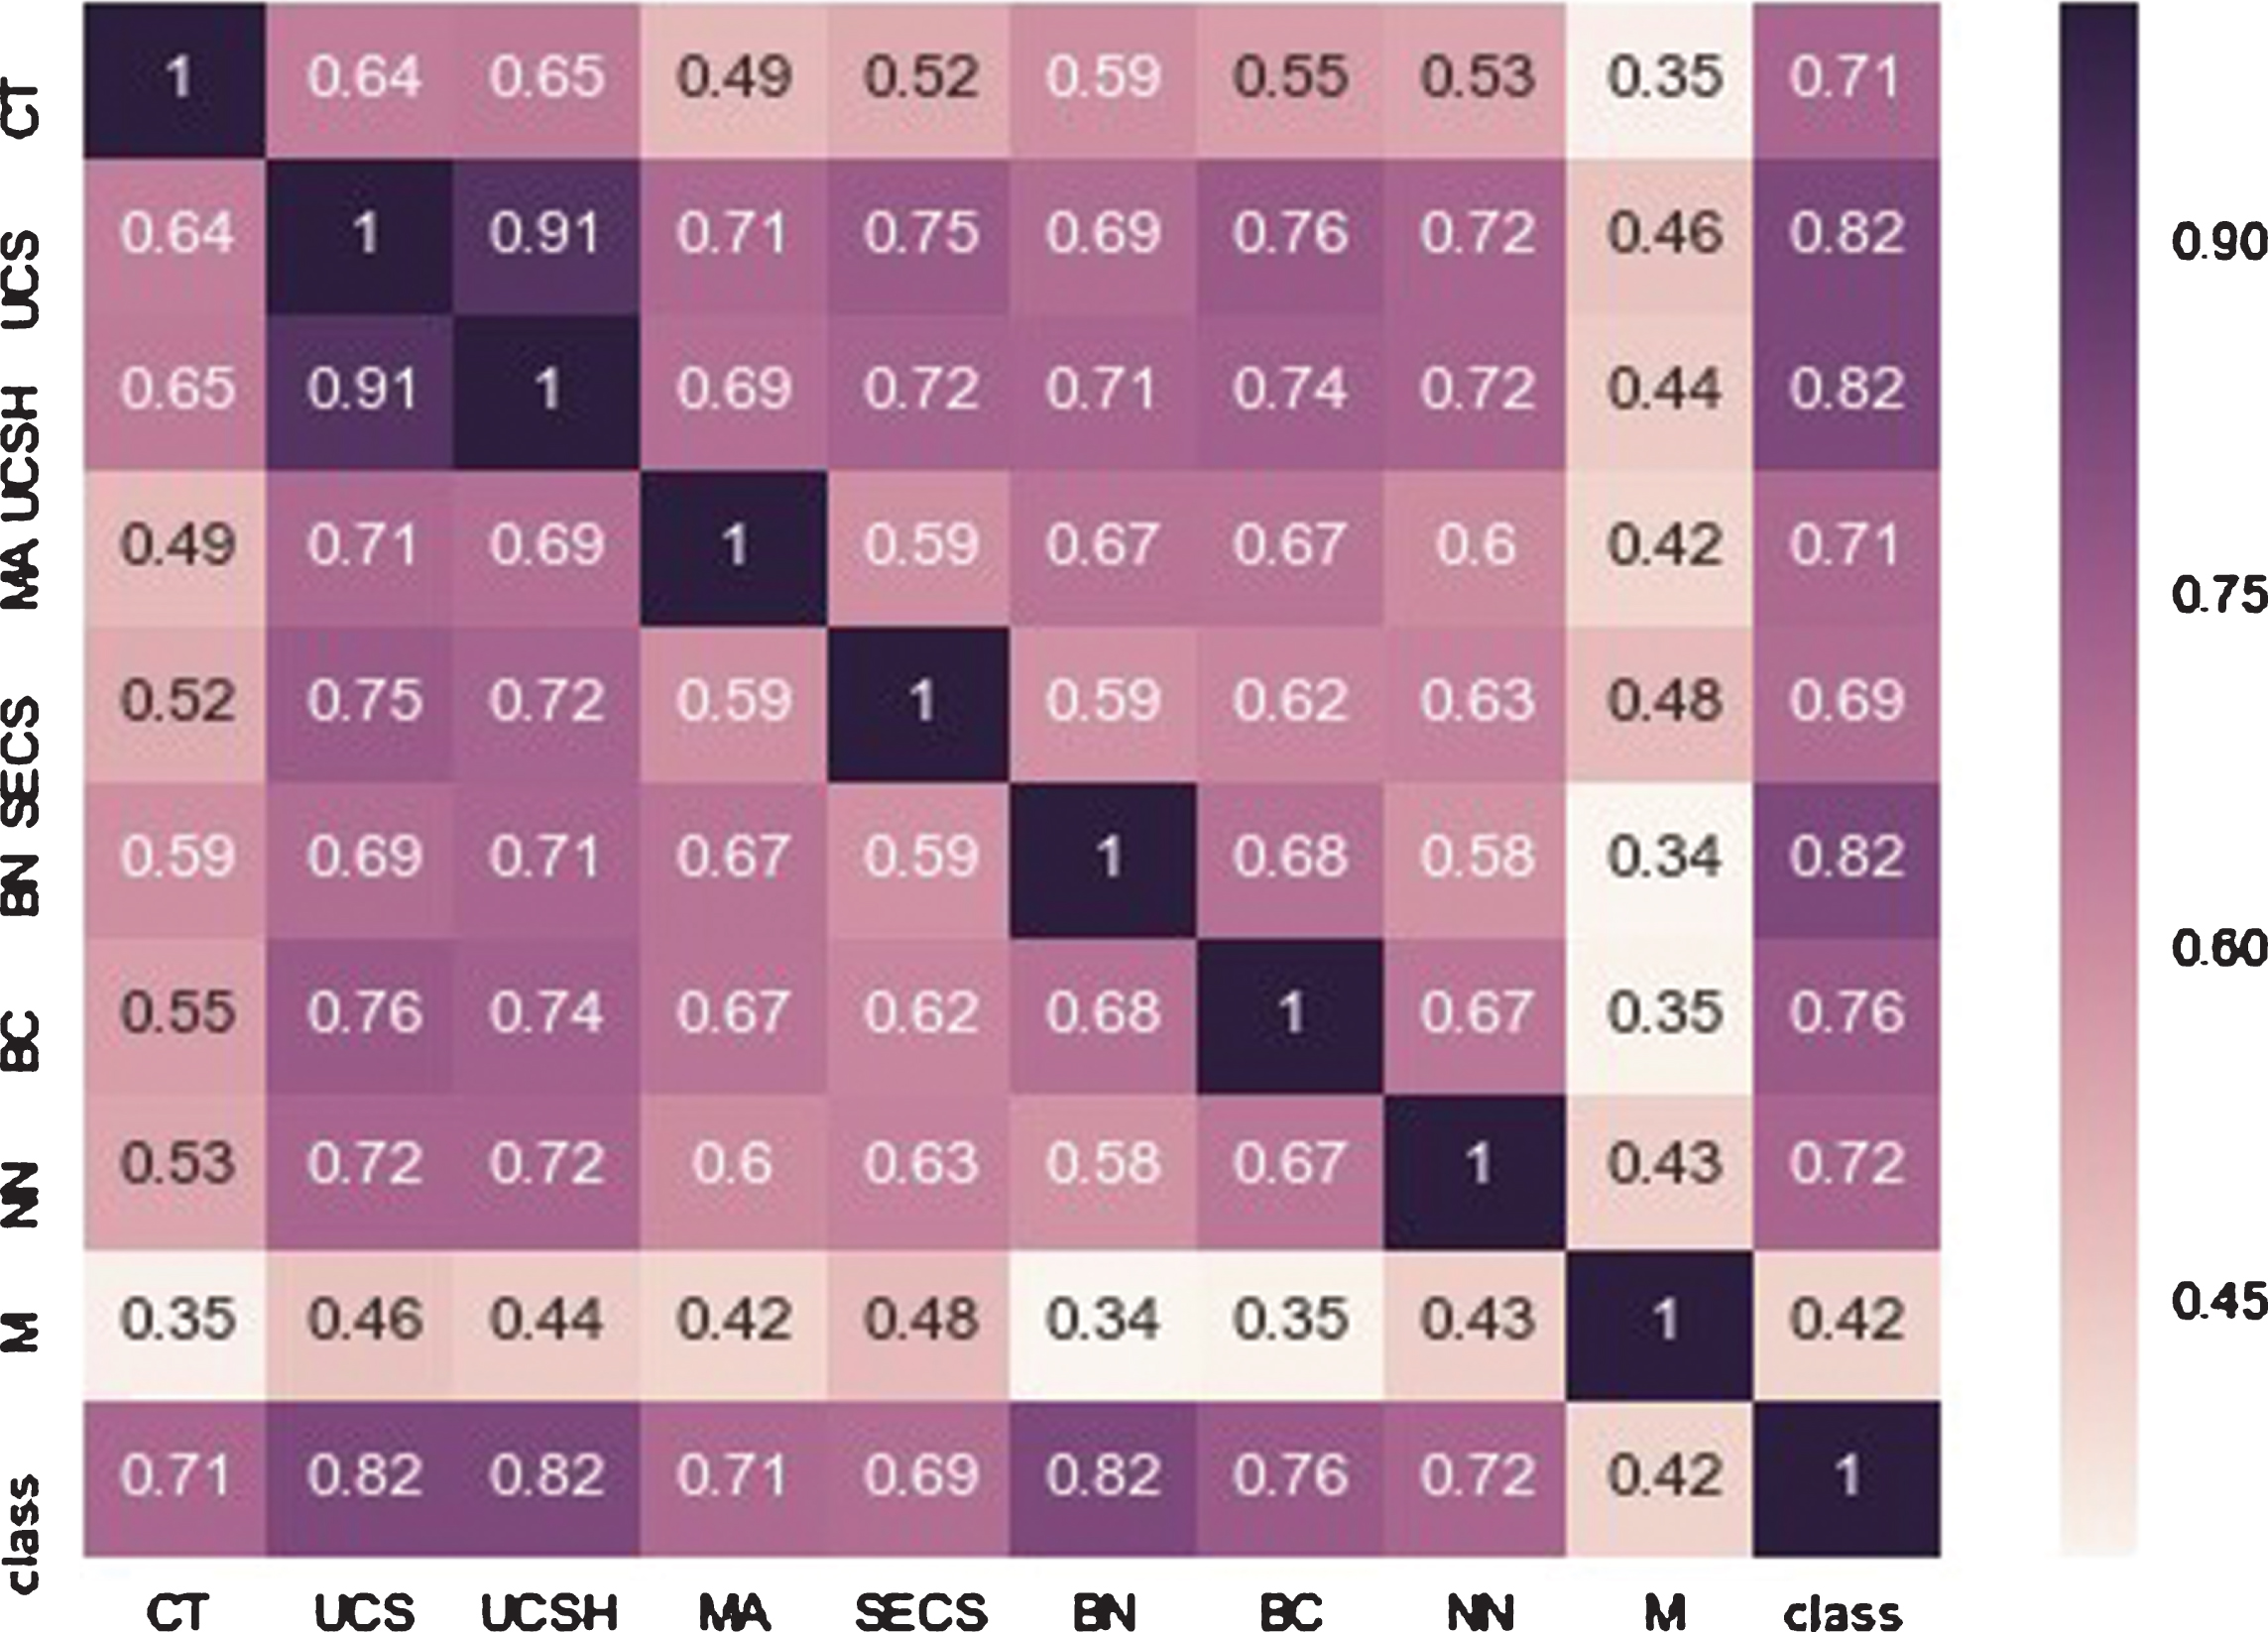
Heat map of features of the dataset.
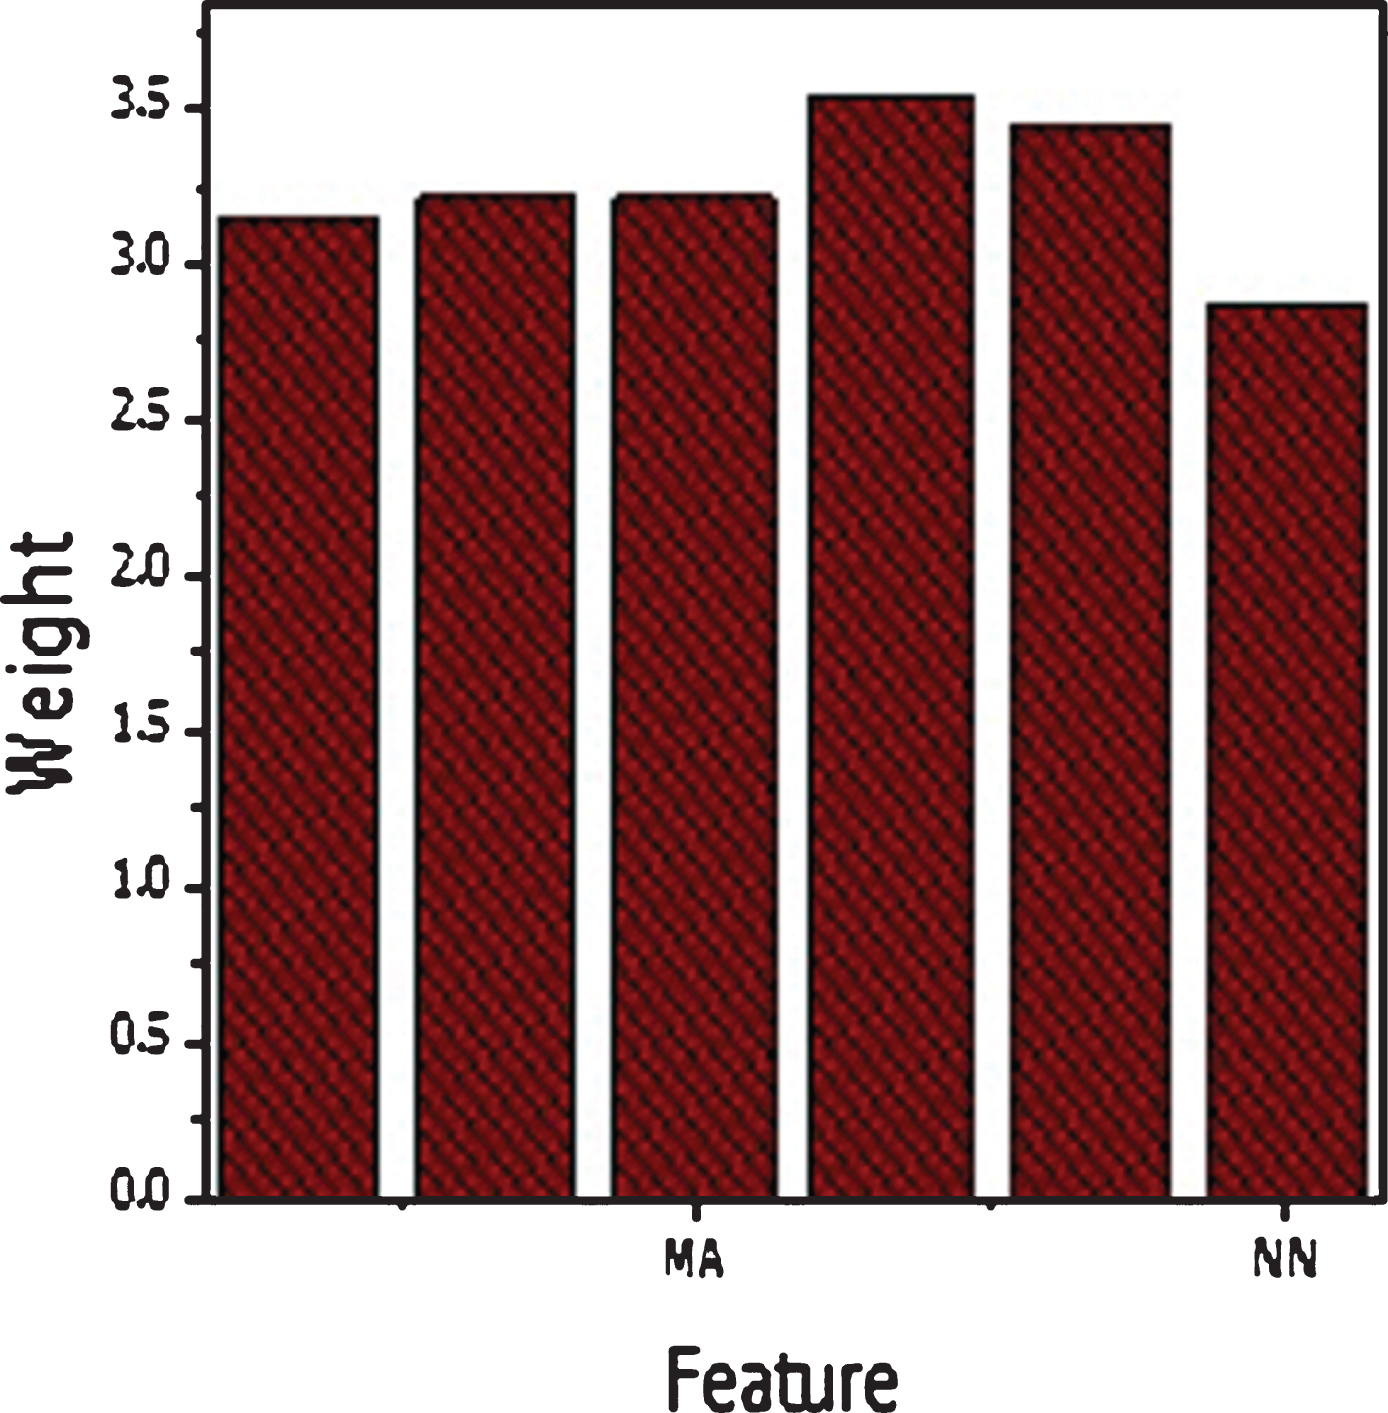
The mRMR feature selection (FS) algorithm is more suitable for appropriate features. The weights of all features are shown in Table 6. The mRMR algorithm selects six important features and the classifier performances are excellent on these six features. These features are reported in Table 7 and graphically shown in Figure 4. According to Figure 4, the most appropriate features are clump thickness, bare nuclei, bland chromatin, single epithelial cell, Uniformity of cell shape and Uniformity of cell size. These features are critically important for the identification of breast cancer. The mRMR FS algorithm is more suitable for the small data set.
Feature weight of the data set WBC
Feature weight of the data set WBC
The rank and weight of features selected by mRMR and Chi-square algorithm.
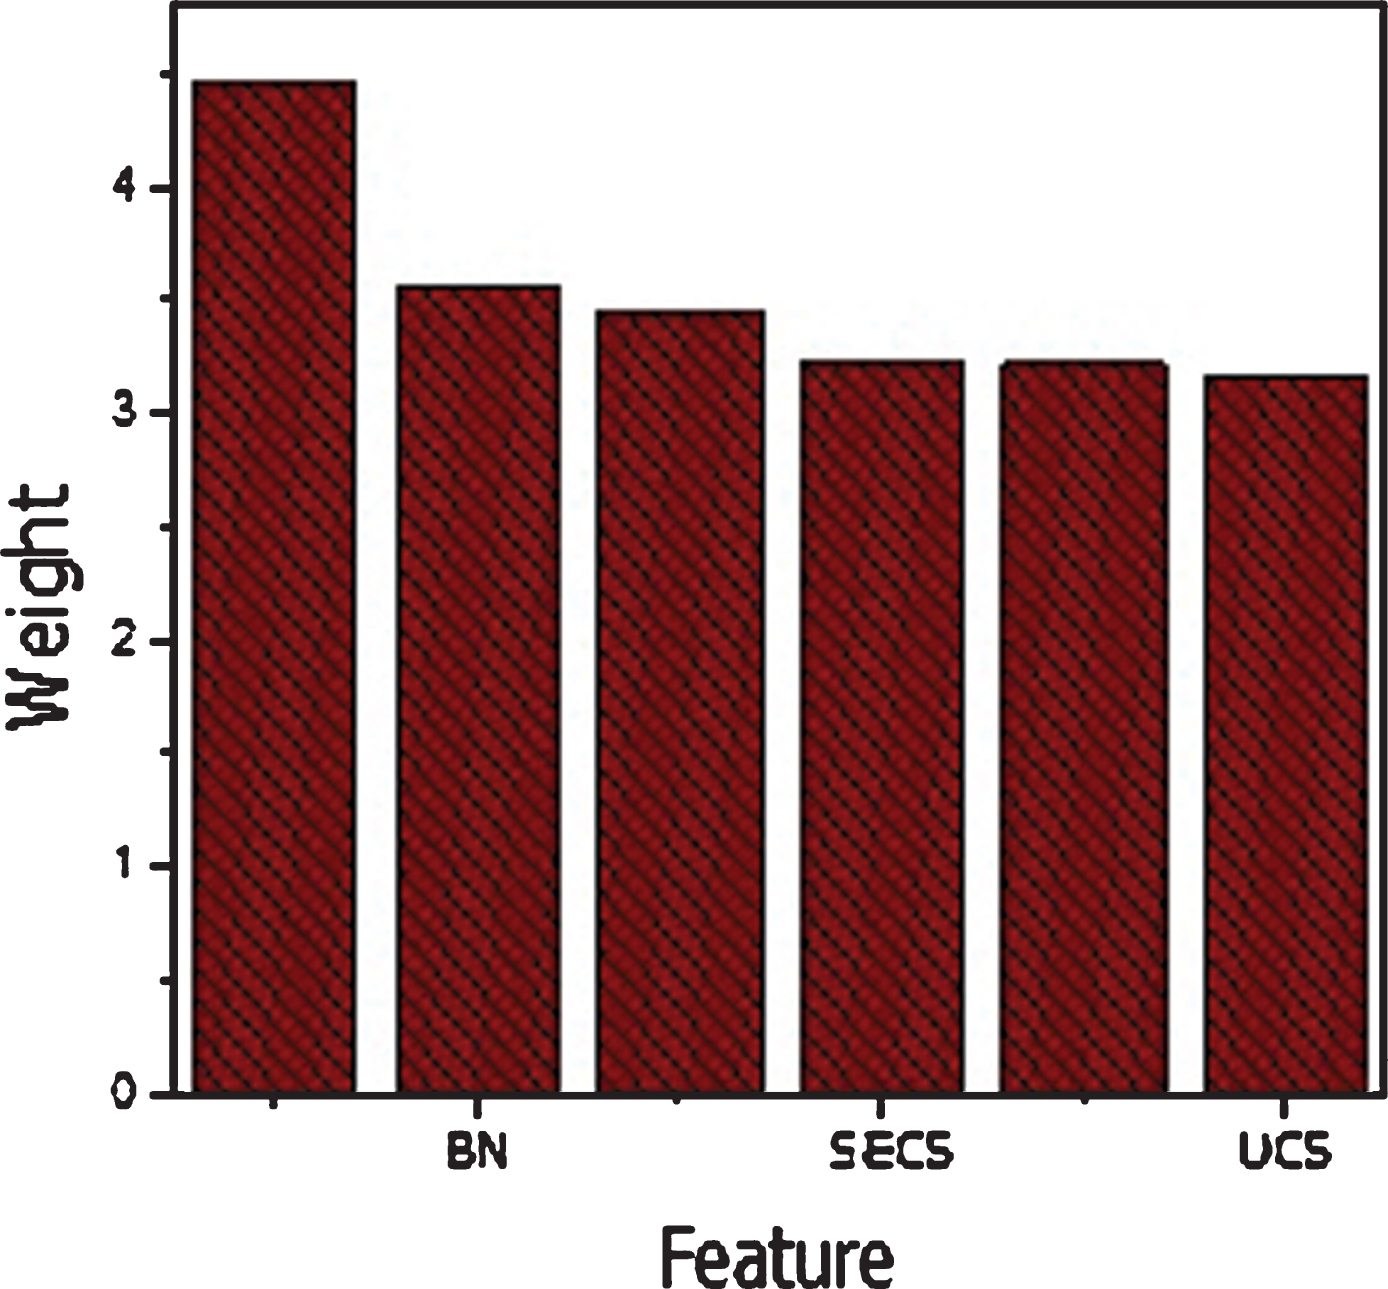
Features selected by mRMR Alogrithm.
The chi-squared feature selection algorithm selected features are reported in Table 7. These features are more relevant to the target output class. These features are shown in Figure 5.
Features selected by Chi- squared algorithm.
In order to diagnose breast cancer, we performed various experiments using SVM classifier with different SVM kernels includes linear, RBF and polynomial. The SVM parameters C=1 and γ = 0.0001 values are used in these experiments. The classifier performance has been checked on selected features set and on full features set. During these experiments, the performance of the SVM kernels is high on 6 reduce features set. Therefore, we only reported the experimental results of classifier on the six important selected features in Table 8. According to Table 8, the SVM(kernel=linear) on 6 selected feature set obtained 99.71% accuracy, 99% specificity, 98% sensitivity, 98% precision, 99% F1-score, 98% MCC, and model processing time is 0.002 seconds. While on full features set the SVM (linear) achieved 97% accuracy, 96% specificity, 95% sensitivity, and 96% precision, 98% F1-score, 94% MCC, and model computation time is 0.047 seconds. The SVM(kernel=RBF) on 6 selected feature set obtained 99.01% accuracy, 99% specificity, 98% sensitivity, 96% precision, 97% F1-score, 96% MCC, and model computation time is 0.030 seconds. While on full features set the SVM (RBF) achieved 97% accuracy, 98% specificity, 98% sensitivity, 97% precision, 98% F1-score, 97% MCC, and model processing time is 0.089 seconds. Similarly, SVM(kernel =polynomial) on 6 selected feature set obtained 97.11% accuracy, 97% specificity, 96% sensitivity, 97% precision, 97% F1-score, 96% MCC, and model computation time was 0.013 seconds. While on full features set the SVM (polynomial) achieved 97% accuracy, 97% specificity, 97% sensitivity, 96% precision, 97% F1-score, 96% MCC, and model computation time is 0.097 seconds.
Classification results of SVM on different features Selected by mMRMR algorithm.
Classification results of SVM on different features Selected by mMRMR algorithm.
The classification performances of SVM linear kernel is high as compared to other SVM kernels on selected features set. The SVM linear obtained 99% accuracy on reduced feature set which shows the overall performance of the proposed method. The 99% specificity of SVM linear kernel is high for diagnosis of a healthy person. Similarly, 98% sensitivity is more effective for the detection of breast cancer people. The computation time of the classifier SVM linear on reduced feature set is low as compared on full features set. The accuracy, specificity, and sensitivity of the SVM on full feature set and on selected features set are graphically demonstrated in Figure 6 for better understanding. The F1-score performances of SVM on full and on selected feature set is shown in Figure 7. The MCC results on the full and on selected features shown in Figure 8 Similarly, the computation time of SVM on full features and on the selected features sets is shown in Figure 9. Thus, through these experimental results analyses, we reached on the conclusion that feature and data preprocessing are necessary for improving the performance of the classifier and reduced the computation time of the classifier.
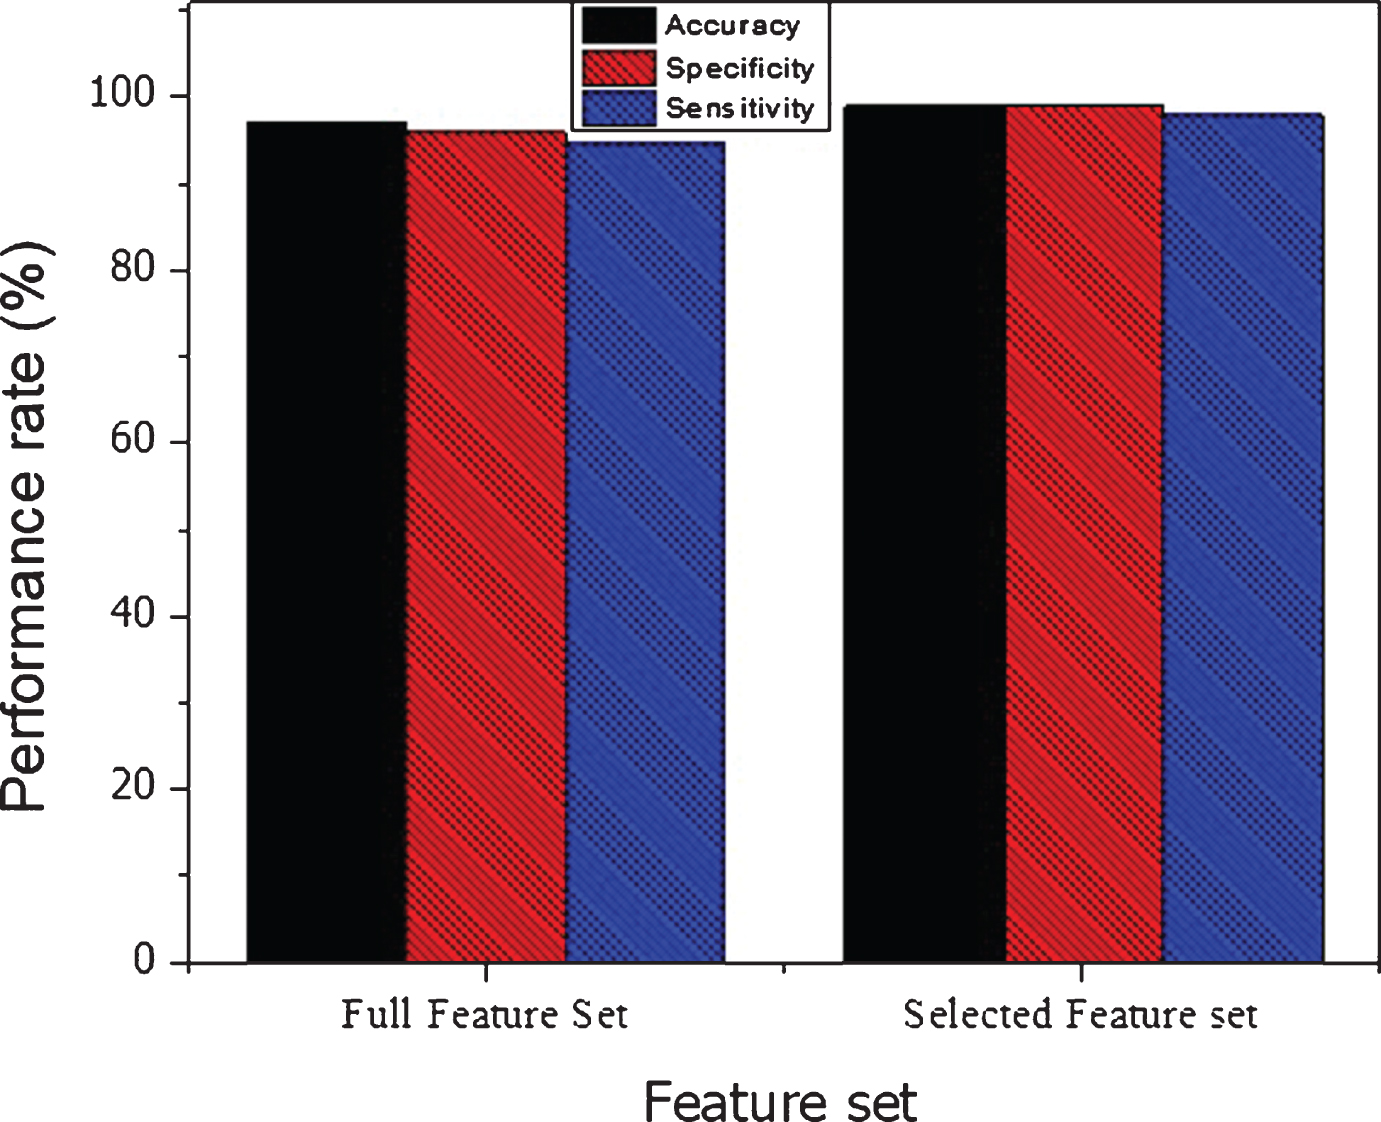
SVM performance on full and on the selected feature set
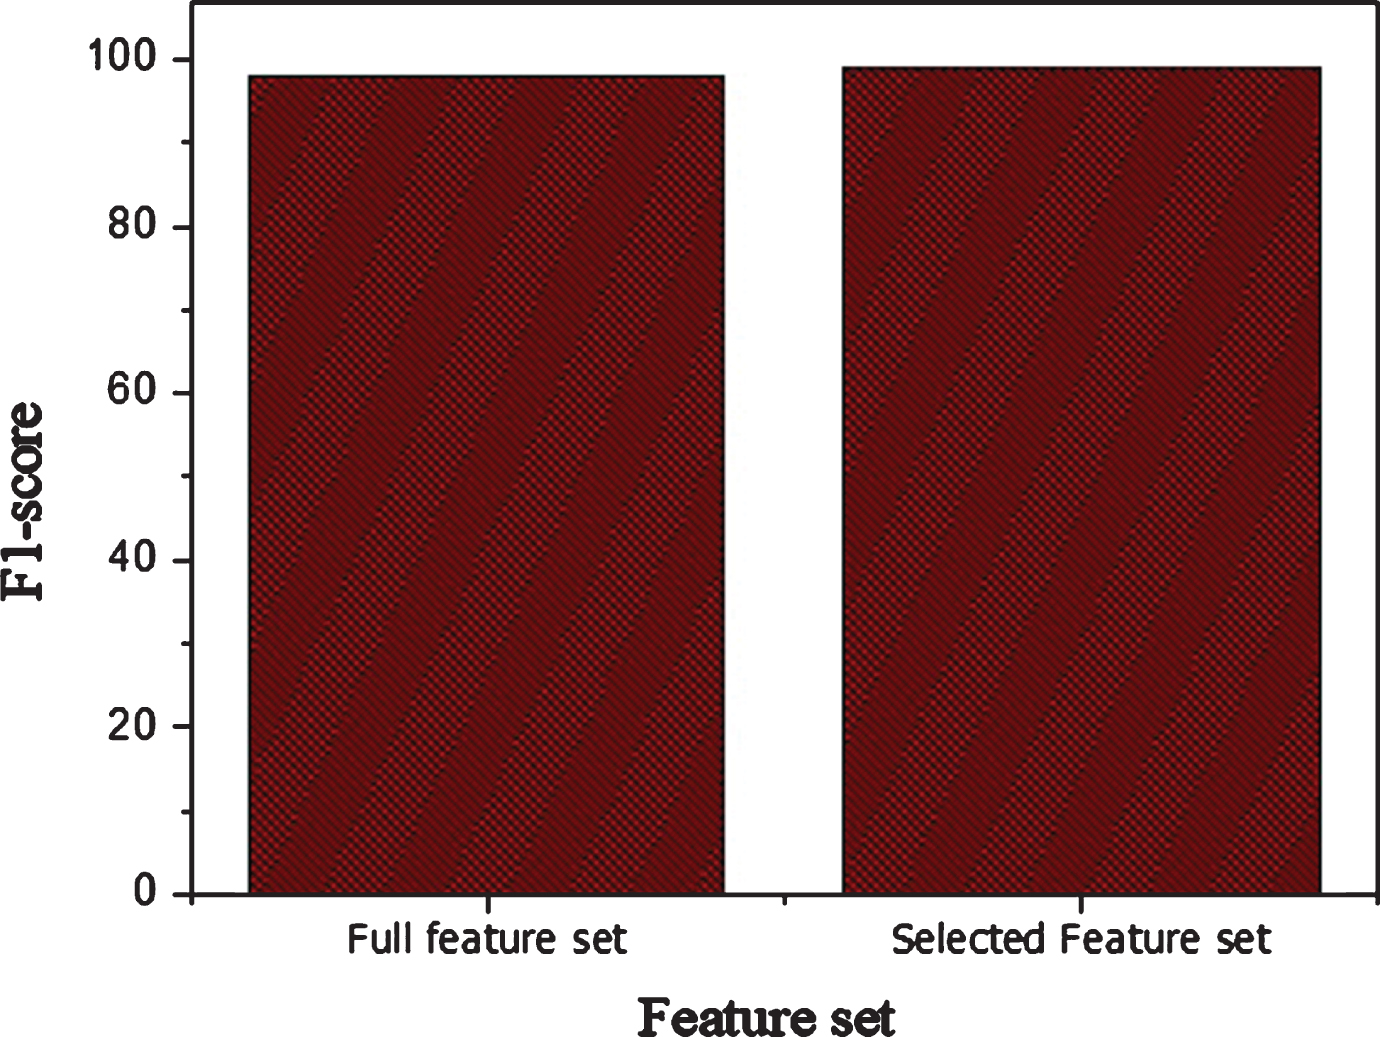
F1- score performance of SVM on full and on selected features set
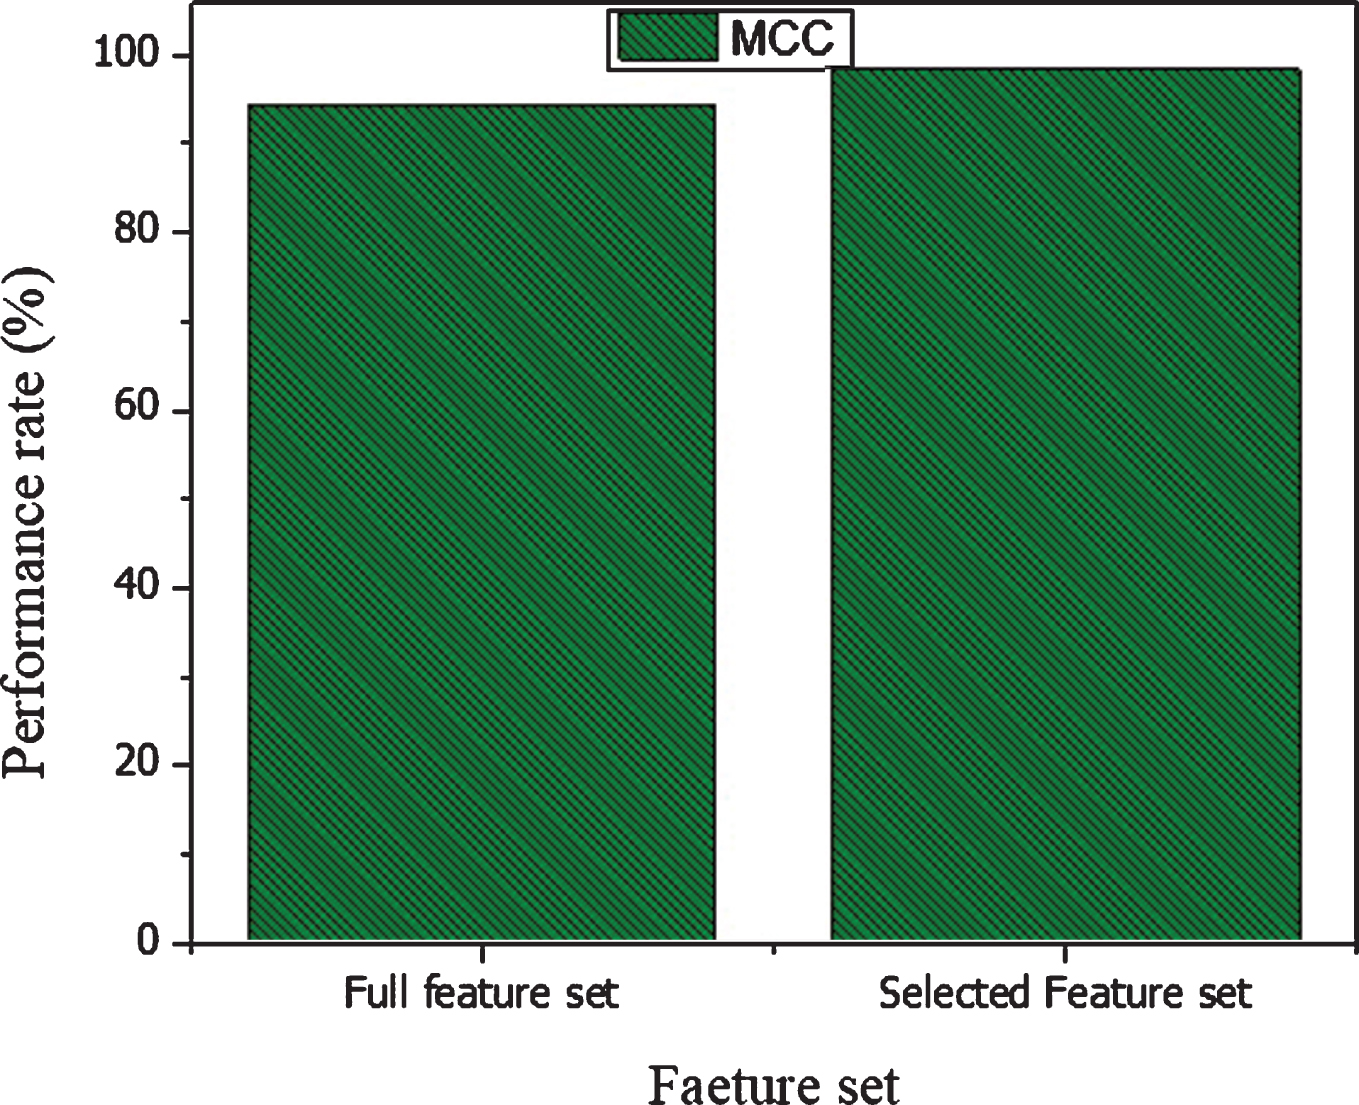
MCC of SVM on full and on selected features sets
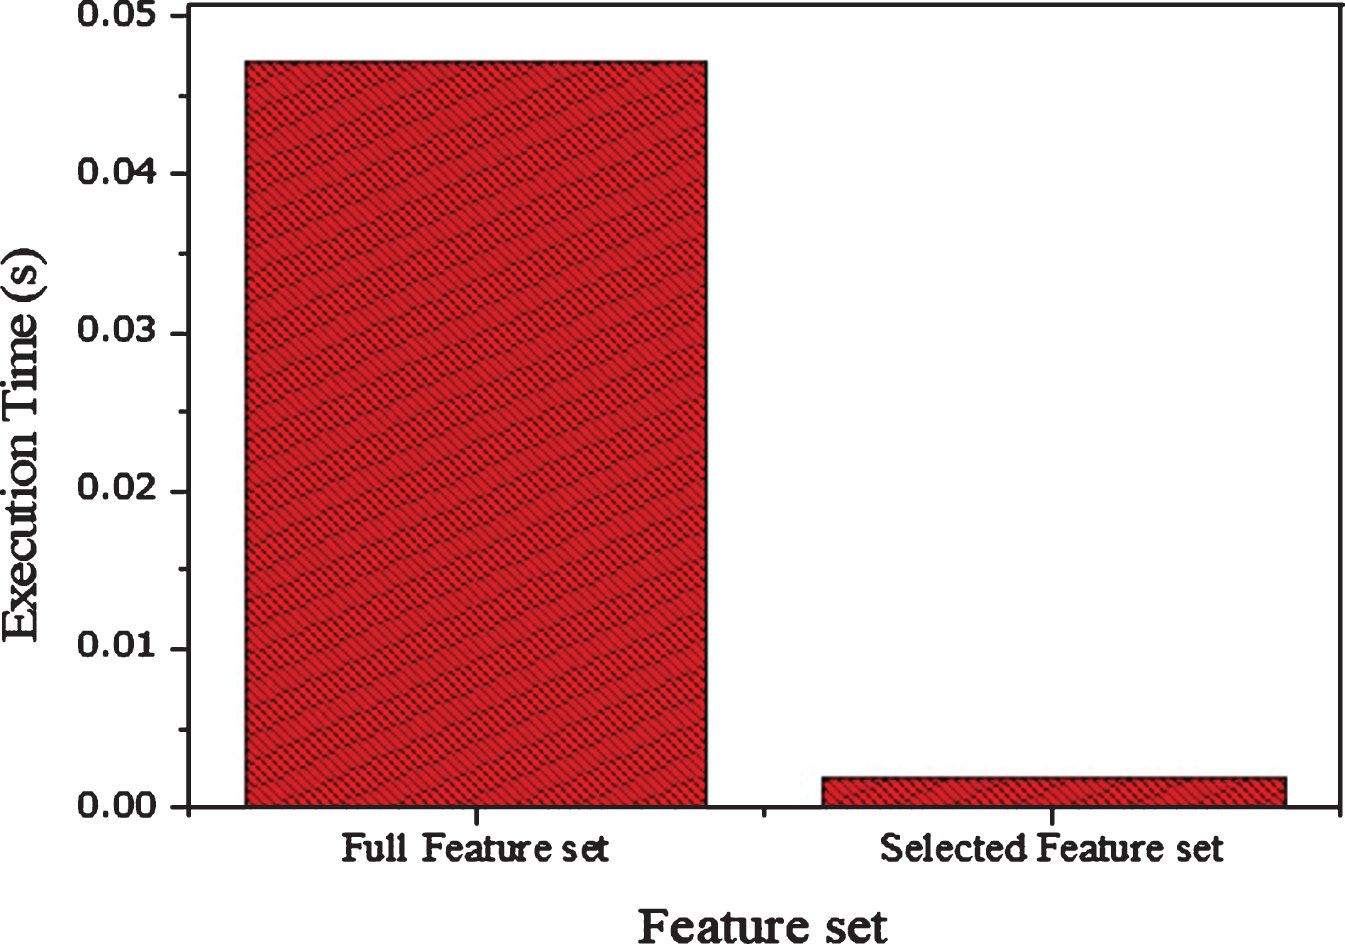
Execution of SVM on full and selected features sets.
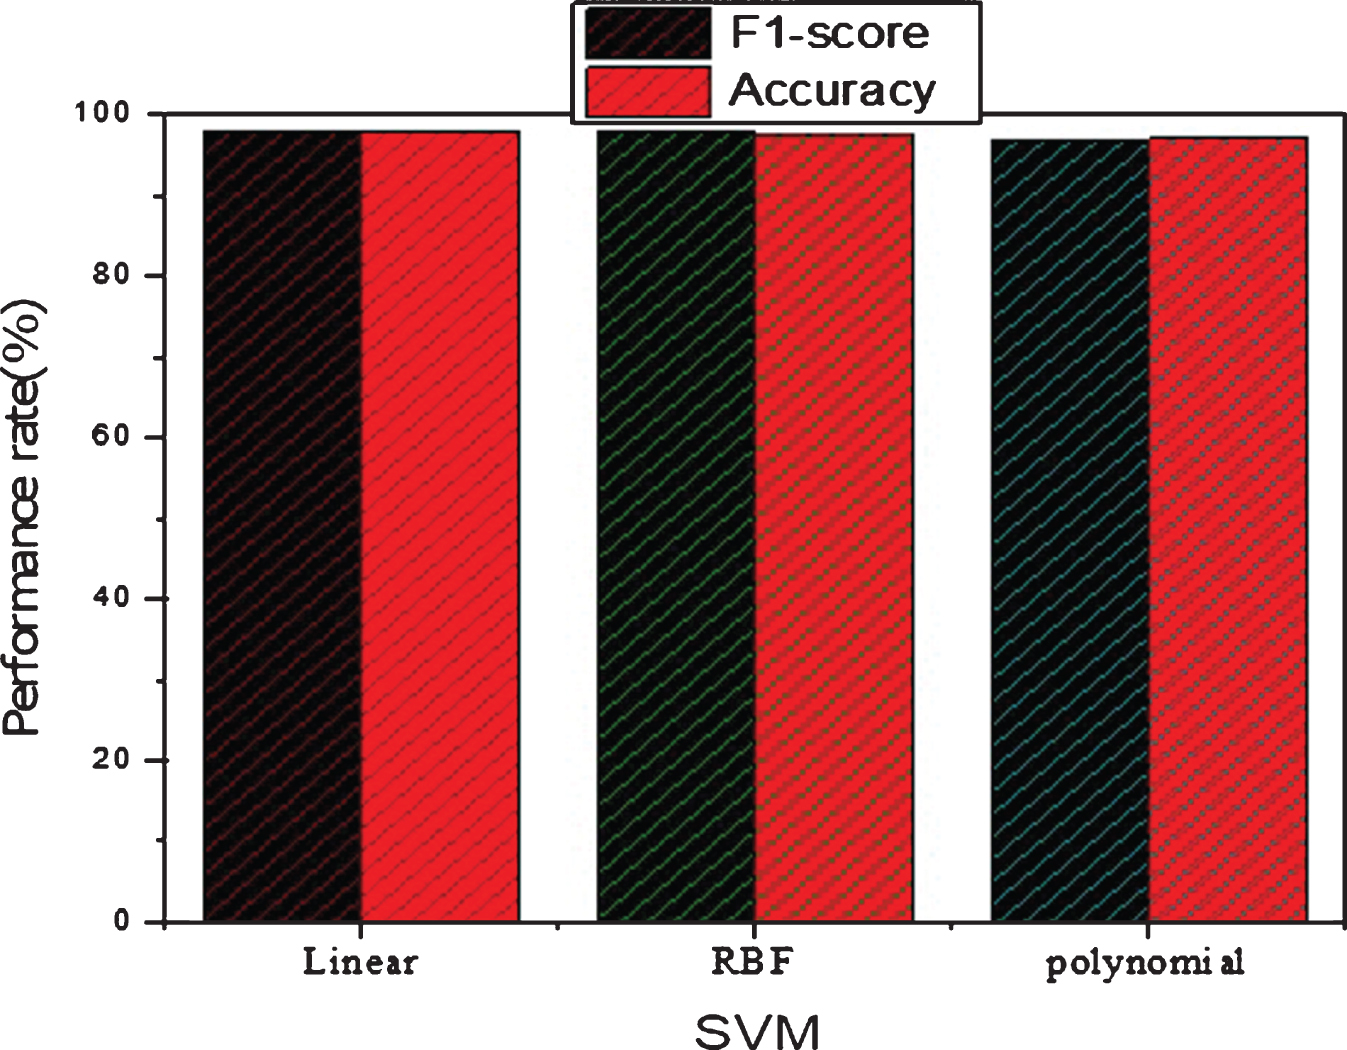
In order to diagnosis breast cancer, we performed various experiments using SVM classifier with SVM kernels includes linear, RBF and polynomial. The SVM parameters C=1 and γ = 0.0001 values are used. The classifier performance has been checked on selected features set and on full features set. During these experiments, the performance of the SVM kernels is high on 6 reduce features set. Therefore, we only reported the experimental results of the classifier on six important selected features in Table 9. In Table 9 the SVM linear achieved 98.07% classification accuracy on selected feature set while SVM kernel RBF and polynomial achieved 97.45% and 97.18% accuracy on the selected feature set respectively. The F1-score on the selected feature set SVM linear achieved 98%, RBF 98% and SVM polynomial achieved 97%. The accuracy and F1-score on the selected feature set of SVM different kernels are shown in Figure 10. Thus, according to Table 8 and 9 the classification performances of SVM is high on the selected feature set as selected by mRMR FS algorithm as compared to Chi-squared FS algorithm. The integration of mRMR with SVM is reliable for effective detection of breast cancer. The mRMR+SVM achieved 99.71% accuracy while Chi-squared+SVM achieved 98.07% accuracy.Thus we suggest that an integrated system based on the mRMR+SVM for breast cancer detection.
Classification results of SVM on different features Selected by Chi-square algorithm.
Classification results of SVM on different features Selected by Chi-square algorithm.
Performances of SVM on the selected feature set selected by Chi-square algorithm
Another dataset WDBC [569 instances, 32 attributes] [36] has been used to checked the performance of proposed method. This data set have 32 features and 569 instances are given in Table10. The MRMR algorithm selected 18 features set F1, F2, F3, F5, F7, F8, F9, F12, F14, F17, F21, F22, F23, F25, F27, F28, F29, and F30 from the data set. The experimental results of SVM different kernels on full and on selected features sets have been reported in Table 11. According to Table 8 and 11 the proposed method mRMR-SVM performance are good on the dataset (Wisconsin Breast Cancer) Database (WBC)(January 8, 1991) [699 instances,11 attributes] [35] instead of data set WDBC [569 instances, 32 attributes] [36].
Feature information and description of WDBC
Feature information and description of WDBC
Classification results of SVM on full and on Selected features selected by mRMR algorithm from WDBC data set
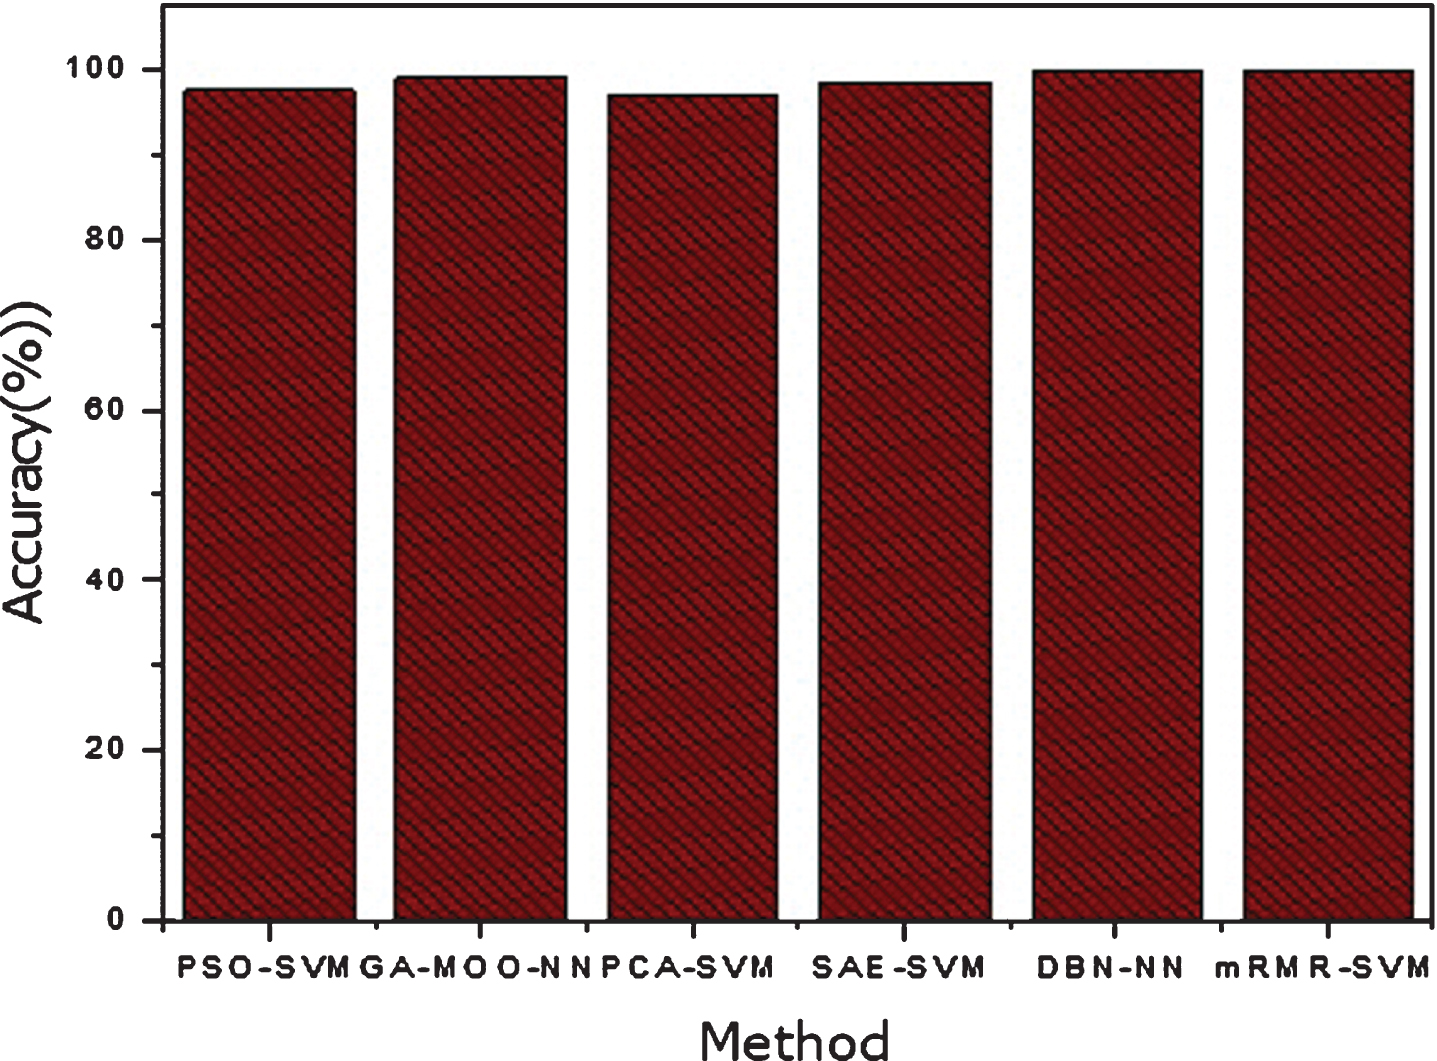
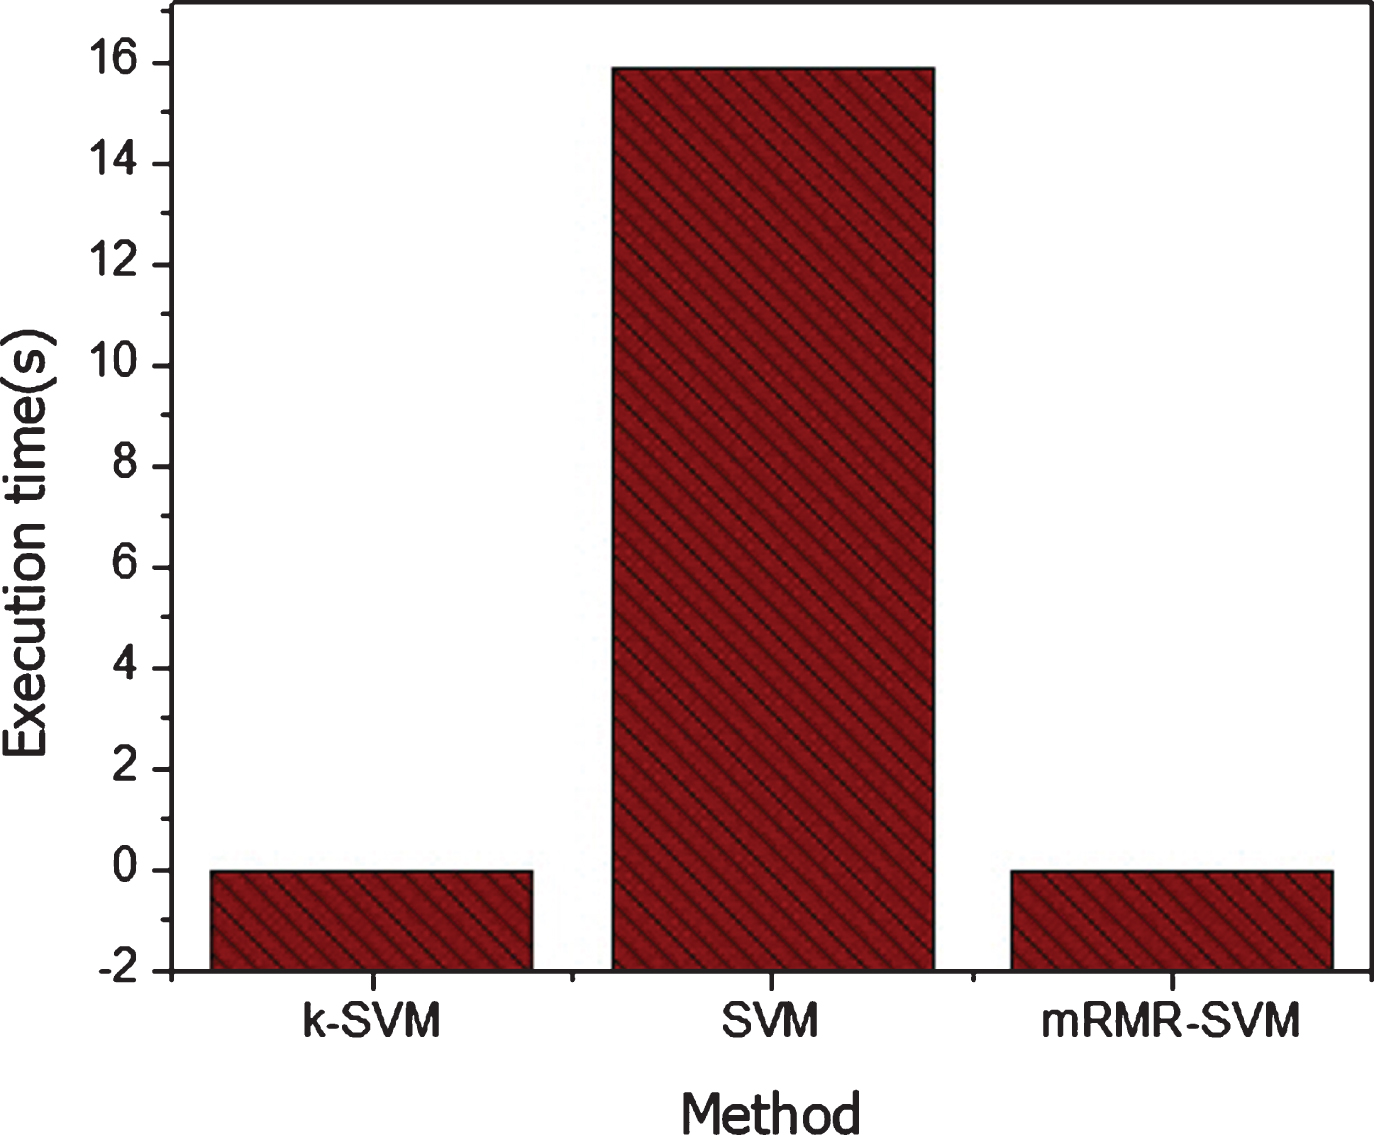
The performances of the proposed method have been compared with previous methods for breast cancer classification in term of accuracy and CPU execution time in Table 12, 13 and graphically shown in Figure 11 and 12. According to Table 12 and Figure 11, the performance of the proposed method for diagnosis of breast cancer in term of accuracy is good as compared to other previously proposed methods. The high performance of the proposed method might be due to the selection of important features selected by mRMR feature selection algorithm. in addition, the proposed method will be effectively diagnosis the breast cancer peoples, and we suggest that the method will be easily incorporated in health care for diagnosis of breast cancer. Similarly, according to Table 13 and Figure 12, the proposed method execution time is low as compared to previous methods. Thus, in term of CPU time, the proposed method is low as compared to other methods. As we compared the performance of proposed method with state of the art methods in term of accuracy and computation time using machine learning evaluation techniques. The proposed method is more accurately and efficiently diagnosis the breast cancer at early states.
Methods comparison.
Methods comparison.
CPU time for classification
Performance comparison with existing methods.
CPU time for classification.
Statistically, we used McNemar’s test in order to compare the performance of our approach and state of the art approaches. In our experiments the hypothesis setting in such a way that H0 : n01 = n10, if the performance of proposed model and with other existing method is the same accuracy or error rate. And H1 : n01 ≠ n10, the alternate hypothesis, the two model have different accuracy or error. To validate the null and alternate hypothesis we compute the test statistic or p-value for proposed method and existing methods using McNemar’s test. The value of alpha for all experiments is 0.05, and confidence level 95%. Thus on the basis of p-value and alpha we accept or reject the null hypothesis on the following conditions If P > α : then H0 is fail to reject, the models have no difference. If p < = α: then H0 is rejected and alternate H1 is accepted the models have difference performance when trained on the particular training set R. The experimental results of test-statistic or p-value are computed for each method and reported in Table 12 and level of significant is 0.05. The p-value of mRMR-SVM is 0.03 and DBN-NN p-value is 0.05 which is less 0.05 its mean that the null hypothesis is rejected and two method have significant different in term of accuracy.The SAE-SVM and mRMR-SVM p-values are 0.08 and 0.03 with is less then 0.05, thus two models are significantly different from each other and null hypothesis is rejected, Similarly the McNemar’s test statistic p value of model proposed models and ACO-SVM is 0.04 and less then 0.05 which is value of alpha. Therefore, p=0.04 <0.05 so null H0 is rejected it means that methods are not significantly similarly and different exist in term of accuracy between the two methods.Lastly PSOWNN p-value is 0.45 which is near to 0.05 and we will reject the null hypothesis and will accept alternate hypothesis H1, Its mean that the two models are significantly different in term of accuracy.
According to these statistical results we reached on the conclusion that proposed method significantly different from others state of the art methods in term of accuracy. Thus its might be due the selection more appropriate features selected by MRMR algorithm and classifier SVM effectively diagnosis breast cancer on the features.
In this article a BC detection method has been proposed for BC detection. In the system machine learning model, SVM is used for BC diagnosis. mRMR and Chi- squared FS algorithms are used for appropriate features. The dataset has been split into 70% and 30% for training and testing. Additionally, the methods of performance assessment metrics are used for model performance assessment. The our results analysis show that the proposed method effectively diagnosis BC. The reduced features by mRMR FS algorithm show that these are necessary features that detect BC accurately as comparatively to whole features space. The performances of mRMR FS algorithm with SVM are high as compared to Chi-squared FS algorithm with SVM. The classification performances of SVM with different kernels such as linear, RBF, and polynomial has been tested on reduce number features subset 6 is high as compared full features set. According to Table8 SVM kernel, linear performance is good as compares to other SVM kernels. SVM classifier gained accuracy 99.71%, 99% specificity, and 98% sensitivity on the selected feature set of mRMR FS algorithm. The 99% specificity value demonstrated that it is high for the diagnosis of healthy people. Similarly, 98% sensitivity show that classifier effectively detected BC people.The performance of proposed method on data set WBC[699, 11] are good as compared to dataset WDBC [599, 32] according to Table 8 and 11.
The novelty of the paper is proposed a method of diagnosis BC. The method used FS algorithm mRMR, Chi-squared, SVM, and Training/testing split technique, and performance measuring metrics for BC diagnosis. As we think that decision support system development using machine learning techniques it will be better for prediction of BC. Furthermore, we know that irrelevant features are also degrade the performance of the diagnosis system and computational time increase. Hence, another innovative part of the proposed study is to used features selection algorithm to select the relevant subset of features which improve the classification performance diagnosis system. The proposed method based on mRMR and SVM performance is high as compared to other methods that have been previously proposed as shown in Table 12 and Figure 11. Similarity the computation time of proposed method is low as compared other methods in Table 13 and shown in Figure 12. Furthermore, according to McNemar’s statistical test, the p-value of propose method is low as compared to existing methods which shows that the proposed method is more significant then existing methods.
In the near future, we will perform more experiments by using other machine learning, feature selection, optimization, and deep neural networks algorithms to improve the detection capability of diagnosis system of breast cancer. Furthermore, the proposed method will exercised on other diseases such Parkinson disease,heart diseases. We used McNemar’s statistical test in order to compared the proposed method with existing methods and we will use others statistical tests for further analysis of the proposed method in future.
Availability of data materials
The dataset used in this research work available on UC Irvine machine learning repository.
Competing interests
The authors declare that they have no competing interests.
Footnotes
Acknowledgment
This work was supported by the National Natural Science Foundation of China (Grant No. 61370073), the project of Science and Technology Department of Sichuan Province.