
Abstract
Deep learning has been widely used in medical image segmentation, such as breast tumor segmentation, prostate MR image segmentation, and so on. However, the labeling of the data set takes a lot of time. Although the emergence of unsupervised domain adaptation fills the technical gap, the existing domain adaptation methods for breast segmentation do not consider the alignment of the source domain and target domain breast mass structure. This paper proposes a hyperbolic graph convolutional network architecture. First, a hyperbolic graph convolutional network is used to make the source and target domains structurally aligned. Secondly, we adopt a hyperbolic space mapping model that has better expressive ability than Euclidean space in a graph structure. In particular, when constructing the graph structure, we added the completion adjacency matrix, so that the graph structure can be changed after each feature mapping, which can better improve the segmentation accuracy. Extensive comparative and ablation experiments were performed on two common breast datasets(CBIS-DDSM and INbreast). Experiments show that the method in this paper is better than the most advanced model. When CBIS-DDSM and INbreast are used as the source domain, the segmentation accuracy reaches 89.1% and 80.7%.
Introduction
Breast cancer is the most common type of malignant tumor that appears in the global female population. According to statistics in 2019, in the United States, breast cancer accounted for 30% of women with cancer [1]. For breast cancer detection, mammography is one of the most preferred and direct methods. In clinical practice, doctors can observe whether the breast is abnormal by observing the X-ray iamge. However, the structure of the breast is complex, and the early structure of breast cancer is not obvious, which may cause doctors to misdiagnose. The emergence of computer-aided diagnosis (CAD) can help doctors segment breast lumps and improve the accuracy of medical diagnosis. Its main purpose is to divide the breast image into multiple regions with similar attributes. In recent years, with the rise of deep learning, especially after the introduction of fully convolutional neural networks [2], traditional image segmentation methods have been gradually replaced by deep learning methods. B. Kayalibay segmentation of MR images of hands and brains by using convolutional neural networks(CNN) [3]. Brosch et al. designed a 3D convolutional encoder network [4]. Experiments show that both can achieve good medical segmentation results.
Although, the use of convolutional networks to assist the segmentation of medical images has achieved good results. In the first few years, the progress of medical imaging is still not as expected. A large part of the reason is that the use of deep learning for image segmentation requires a sufficient amount of labeled data set to achieve high accuracy results. But medical images lack a lot of ground truth labels. Calling doctors to manually label the data set consumes a lot of manpower and time. So how to solve this problem has become an important obstacle to medical image segmentation.
Although unsupervised deep learning can be used to perform semantic segmentation on unlabeled images, the results of this method are not satisfactory. Mammograms are common medical images. In the hospital, women do many types of breast examinations, such as x-photography, MRI, etc., and most of the images of the examination result require human observation of the image to determine the condition. How to perform unsupervised breast mass detection is a challenge. Domain adaptation is an important method to solve the shortage of medical image labeling samples. Domain adaptation refers to transfer learning when two domains have the same task, but the domain samples have different distributions. The key to unsupervised domain adaptation is how to reduce the feature difference between the source domain and the target domain. In Ref. [5], the author proposes a medical image segmentation framework that aligns system images with features, which can effectively adapt the segmentation network to unlabeled targets domain. Perone C S et al. proposed an unsupervised domain adaptation network for medical image segmentation [6]. In extensive experiments, using a small amount of unlabeled data, the model still has a good learning ability.
The method of domain adaptive segmentation is to map the data of two domains with different distributions to a unified feature space, then reduce the difference between the two domains, and find the contact information [7], such as: domain label information, class label information, and Structure information, etc. Most methods only consider domain label information and class label information, and rarely consider the structural information between the two domains. To a large extent, it is because structural information is difficult to model with CNN. To solve this limitation, this paper uses graph convolutional networks(GCN) to model the structural information between the two domains when designing the architecture. The reason for adding the GCN module is that the traditional CNN network can only process European spatial data, while GCN can process non-European spatial data. For example, map classification and protein classification, etc. Especially, GCN has a powerful modeling function, which can train the structural properties of features and find the relationship between feature nodes, which is exactly the model we need. Bruna [8] proposed graph convolutional neural networks in 2013. They are based on the convolution theorem of graph theory and define graph convolution in the spectral space, and later developed into a spectral method in the field of graph convolution. Various variants of graph convolutional networks are proposed later. For example: CayleyNets: Graph Convolutional Neural Networks with Complex Rational Spectral Filters [9], adaptive graph convolutional neural network [10] and so on. In terms of application, graph convolution has shown great advantages in 3D point cloud segmentation and image classification [11–14]. Besides, in Ref. [15], the author creatively combined super voxel and graph convolution to segment brain MRI and achieved good results.
Over the past few years, graph convolutional networks have been applied to the field of medical image segmentation, but some image features may be lost in the process of constructing a medical image adjacency matrix, which we do not want to see. Besides, constructing the extracted feature data into a graph structure, and then mapping the points in the graph to Euclidean space, which will cause greater distortion. To reduce distortion, this paper proposes an unsupervised domain adaptive hyperbolic graph convolutional network. Although the graph convolutional neural network can handle non-Euclidean data, it embeds the nodes in the graph into the Euclidean space. This is the cause of distortion, and it is natural to think of embedding graph nodes in non-Euclidean space to solve this problem. Therefore, hyperbolic space has become our choice. The volume of graphs in Euclidean space grows polynomially, but some multi-layer and multi-relational data grow exponentially. The expansion of hyperbolic space happens to grow exponentially, which is exactly what we need. Besides, the hyperbolic space also has good performance in capturing basic level data. On the other hand, the hyperbolic graph convolutional network is also used to ensure the perceptual alignment of the source domain and target domain structure. In order to be able to train the graph structure, we also designed the completion matrix module, after each training, the adjacency matrix can be updated.
The main contributions of this paper are summarized as follows: (1) We propose an end-to-end hyperbolic graph convolution unsupervised domain adaptation network for breast mass segmentation. On the one hand, the use of a hyperbolic graph convolutional network can reduce the training loss of feature data and on the other hand, can make the source domain and target domain structurally aligned in the feature space. (2) The completion matrix we designed allows the graph structure to be trained in the network iteration, which not only improves the efficiency of feature mapping, but also increases the network’s ability to discriminate negative samples. (3) We conducted domain adaptation segmentation experiments on the INbreast and CBIS-DDSM datasets respectively, and explored bidirectional domain adaptation. The experimental results proved the effectiveness of our model.
The rest of this paper is organized as follows. Section 2 shows related work about Graph neural network, mediacal image segmentation and domain adaptation. We describe our frame thoroughly in Section 3. Section 4 shows the experiment results and Results of ablation experiments. Finally, Section 5 presents the conclusion.
Related work
In this section, we mainly introduce the related methods of domain adaptive medical image segmentation and graph convolutional networks.
Graph neural network
Graph neural network is proposed to solve data such as graph structure. This type of data belongs to non-Euclidean spatial data and does not have the characteristics of European spatial data, such as translation invariance. The graph convolutional neural network was first proposed by Bruna et al. In 2013, the author defined the graph convolution formula based on the analogy of the graph theory to CNN convolution [8]. The convolution formula proposed by Bruna has high computational complexity and the filter cannot be well localized. Because of the above shortcomings, Defferrard [16] et al. made improvements. Use polynomial filters with parameters to improve calculation efficiency. Besides, the author defines a strict convolution formula to achieve strict localization, and the filter perception field of the proposed filter can be understood as a ball with half a catty K. Later, Kipf and Welling [17] proposed a scalable semi-supervised method based on graph data structure, which can directly manipulate graphs. The author uses a first-order approximation to simplify the calculation and proposes a simple and effective layered propagation method. Experiments show that the method proposed by the author is comparable to existing advanced semi-supervised methods on public data sets.
With the introduction of graph neural network and the perfection of the theory, the application of graph neural network has gradually increased. For example: connected edge prediction and vertex classification etc [18–22]. In addition, because the graph has the feature of connectivity, the use of graph convolutional networks can better capture the contextual information of the image. For example: H You obtains deeper image features through graph convolutional network [23]; W Cai uses graph convolution algorithm to generate the directional relationship between features [24], both of which have achieved good results in the field of remote sensing segmentation. However, since the picture belongs to non-European space, there may be some distortion in constructing the features of European space into European space. How to better map the features extracted from CNN to GNN is a problem that needs to be ended.Ganea gave the answer in his paper [25]. Ganea proposed the hyperbolic network neural layer, and introduced logistic regression, feed-forward, and other important tools needed for deep learning in the Poincaré model of hyperbolic space. Besides, the author also proposed algebraic operations under the Poincaré model. On this basis, Ref. [26] used a more stable model to derive the core operation of the hyperbolic neural network, updated the set aggregation operation, and proposed the hyperbolic graph convolutional network. At the same time, Ref. [27] also proposed a new hyperbolic space graph neural network. Both experiments have proved that the use of the hyperbolic space graph neural network model has a substantial improvement over the Euclidean space graph neural network in some downstream tasks.
Medical image segmentation and domain adaptation
Medical images and other natural images have a very big distinction. There are many image models, such as MR, CT, and ultrasound imaging. For mammography image segmentation, the traditional main methods include target region segmentation algorithm [28] and edge detection segmentation algorithm [29]. These traditional segmentation methods lack accurate extraction of breast mass images, but only segment the underlying feature information of the image. Different from traditional segmentation methods, deep learning can well extract high-level feature information of images. Z Wang et al. [30] used CNN to conduct large-scale detection of the mammary gland. With the introduction of FCN, researchers have achieved great success in the field of image segmentation by using FCN architecture. In 2015, Ref. [31] proposed the U-net network structure, which performed better in the field of medical segmentation [32–35].
The number of annotations in medical images falls far short of the need for deep learning. Human annotation goals are unrealistic. The main technical problem to be solved is how to transfer the learned features in the source domain to the target domain to solve the same task. To reduce the difference between the source domain and the target domain, Long et al. [36] mapped the source domain and the target domain to Hilbert space and reduce the difference between the two in this space. Later, the researchers mainly work on reducing the difference between the characteristics of the source domain and the target domain [37]. These methods only use feature alignment or sample weighted approximation methods to reduce the difference. However, for breast images, different examination equipment has different imaging rules, and such multi-modal medical images will have serious sample differences. In addition, breast lumps are relatively small compared to the entire breast, which makes it more difficult to reduce differences only by distance measurement. Ref. [38] combines domain adaptation and adversarial learning to propose a gradient reversal layer, which is different from the previous alignment method. The paper proposes to align the source domain and the target domain through backpropagation training, which creates a precedent for unsupervised domain adaptation to adversarial networks. Because the method has strong scalability and robustness, later based on this framework, a variety of domain adaptive confrontation network variants [7, 39–41] are proposed, and the domain adaptive confrontation network has become the main method of unsupervised learning. At the same time, domain adaptation has also achieved good results in medical image segmentation [42–45]. But these works are only aimed at reducing the differences in pixel feature points of multi-modal images and are not enough for breast lumps with irregular structures. Based on previous work, we introduce the graph neural network that can train the structural characteristics of the object into the segmentation network, use HGCN to share the training of the source domain and the target domain, reduce the structural differences between the two, and perform unsupervised segmentation of breast masses.
Method
In this section, we introduce the adaptive hyperbolic graph convolutional network and unsupervised domain adaptation to the segmentation of x-ray breast mass in detail.
Symbol definition
For the convenience of writing, we give some meanings of the symbols used later. Given a graph G = (V, A), where V represents the vertices of the graph, the adjacency matrix of the graph is denoted as A. We also give the matrix D of the vertex degree of the graph. In unsupervised domain adaptation, given X S and Y S represent the source domain sample space and label space. Besides, X T represents the target domain source space.
Overall architecture
The overall network architecture proposed in this paper is shown in Fig. 1. First, the source domain and target domain obtain the breast x-ray image features through the u-net compression path. Then according to the graph construction method we proposed, the feature difference score and the distance under the hyperbolic map are calculated to construct a tightly connected graph. The constructed graph is sent to the hyperbolic convolutional network for training. After each layer of mapping is completed, a complement matrix is added to enable the graph structure to be trained. To ensure the structural alignment of the source domain and the target domain, the feature tensors obtained by the convolution of the segmentation network and the hyperbolic graph are finally averaged. On the expansion path, the obtained low-level features are subjected to an up-sampling process. In the process adopted above, each time the features of the compression process are spliced onto the expansion path of the corresponding size. The final result:On the one hand, source domain prediction is compared with ground truth to calculate segmentation loss. On the other hand, to make the target domain prediction close to the source domain prediction, it is sent to the domain discriminator together with the target prediction to distinguish the input from the source domain or the target domain. By calculating the counter loss, the reverse effect is applied to the segmentation network. During training, the two domains maintain parameter sharing.
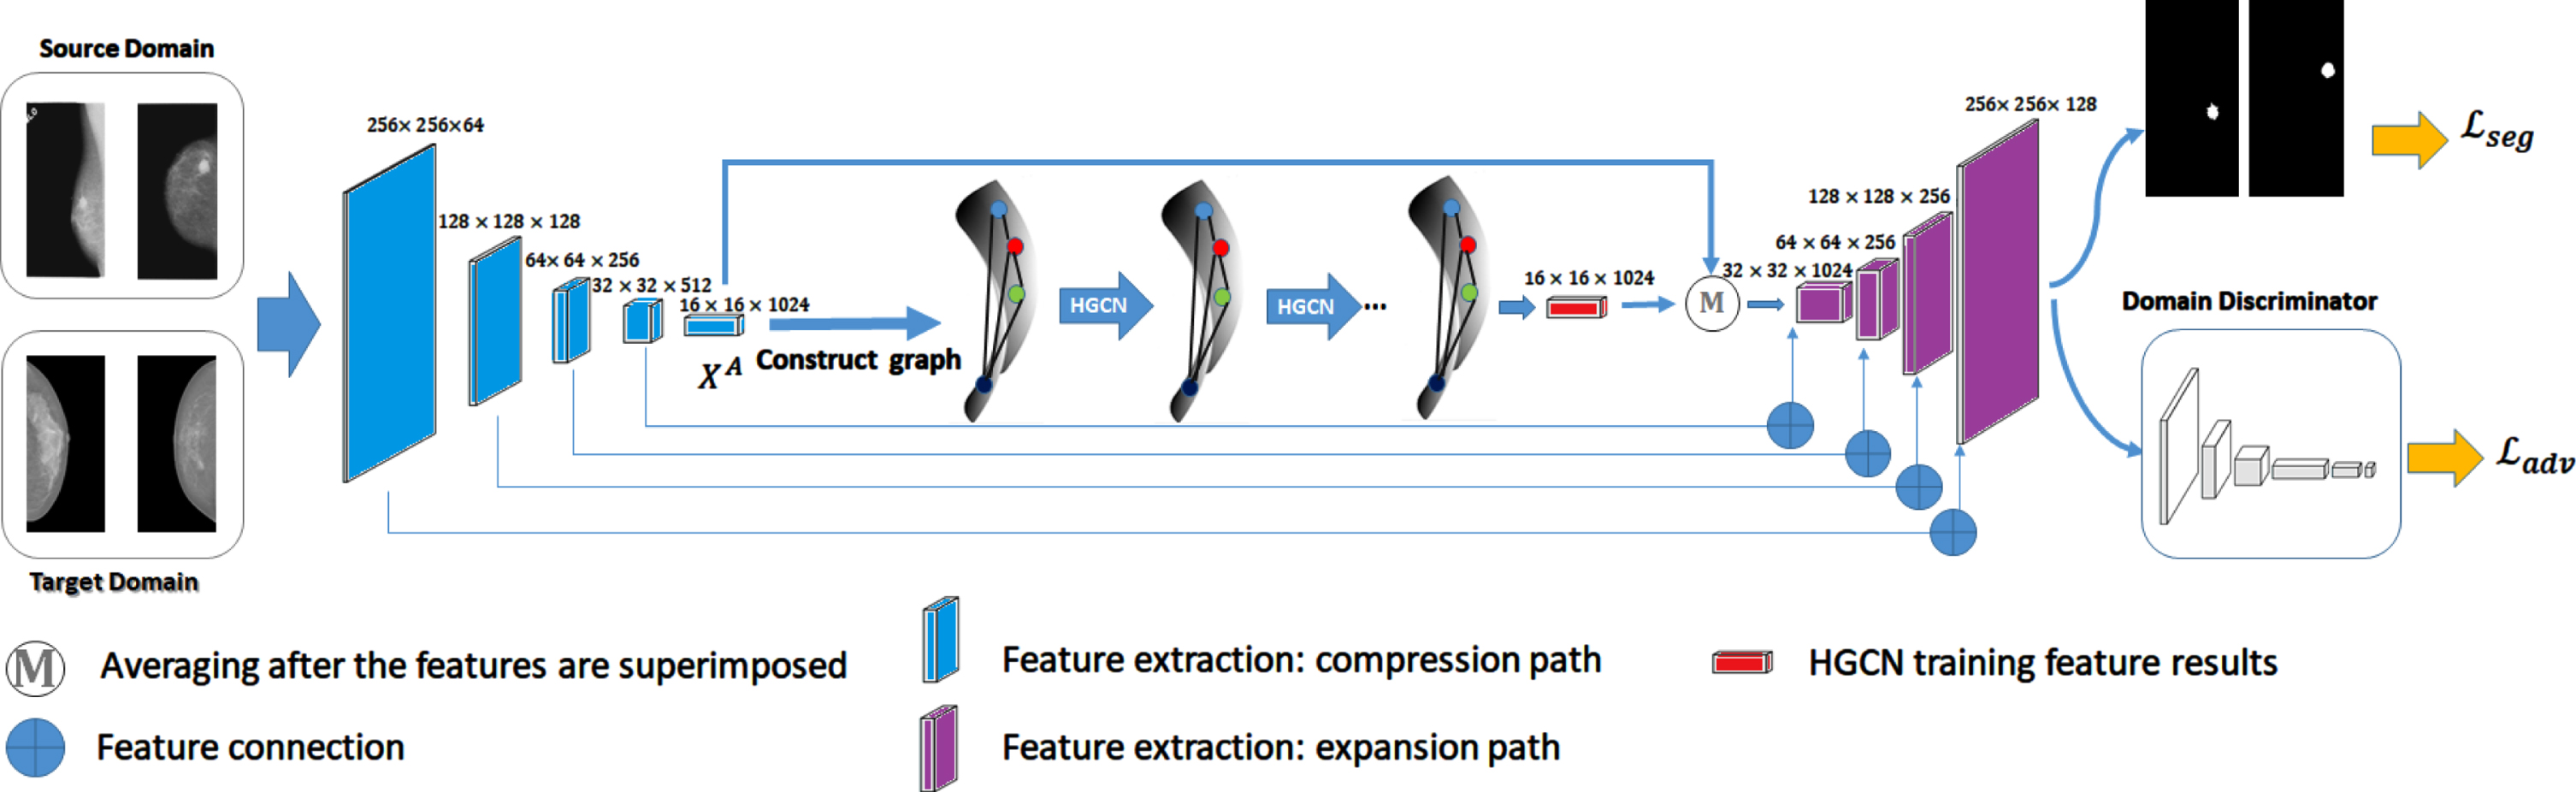
The overview of our proposed framework. The model consists of a improved U-net, a hyperbolic graph convolution network, and a discriminator network (D). Among them, the U-net and the hyperbolic graph convolutional network constitute the feature generator G. Please refer to the text for details.
Feature extraction networks mainly include a U-net and our hyperbolic graph convolutional network (section 3.3). First, we use an improved U-net network to extract the feature values of the source and target domains and use graph neural networks to reduce the structural characteristics of the source and target domains. U-net itself is composed of compression path strength and expansion path. The U-net compression path mainly learns image features and context information. Therefore, the purpose of generating features we use U-net is to extract the features of mammography to construct the map structure. The expansion path, we will use in the subsequent positioning of the segmented area.
The compression process is a series of downsampling operations consisting of a convolutional layer and a pooling layer. Each feature extraction process is composed of 2 convolutional layers, a normalization layer, and 1 pooling layer. Specifically, we use a convolutional layer with a size of 3×3, a step size of 1, and a padding value of 1. For the pooling layer, we set the padding value to 0, the step size to 2, and the size to 2×2. In this way, after a down-sampling operation, the feature channel will be doubled and the size will be doubled. After each convolution operation, a normalization layer is immediately followed to prevent gradient explosion and gradient disappearance during the training process.
The expansion process is even the so-called up-sampling process. We add the features trained by the graph neural network to the final extracted features of the U-net network and then take the average to preserve the contextual features while training the structural features to reduce the structural differences between the source domain and the target domain. Then use the same convolutional layer as the compression process, the difference is that we discard the pooling layer and use the inverse convolution operation to expand the picture. On the other hand, each time the up-sampling process is performed, the features of the corresponding size are extracted and stitched, so that the low-level features of the image can be fully utilized.
Adversarial learning domain adaptation
The domain adaptation framework adopts an adversarial learning model. Its components are composed of a generator, domain discriminator, and segmentation predictor.
The role of the generator is feature extraction. It mainly completes the extraction of the required features from the source domain and the target domain, making it impossible for the discriminator to distinguish whether the extracted features are from the source domain or the target domain. The domain discriminator will discriminate which domain the features extracted from the generator belong to. The result of this is: the generator minimizes the feature difference between the two domains, making the domain discriminator unable to distinguish. The domain discriminator hopes to accurately distinguish whether the features generated by the generator belong to the source domain or the target domain. Through the game between the two, in the training process, the generator and the discriminator are continuously optimized. Finally: the generator makes the source domain and the target domain very close, and the domain discriminator will not be able to accurately distinguish which domain the feature belongs to. During training, the generator and the discriminator are optimized by fighting the loss function and passing the reverse gradient.
The generator consists of two parts: U-net and graph neural network. On the one hand, U-net is used to extract the contextual feature information of the source domain and the target domain for compression. On the other hand, the graph neural network further reduces the difference between the two in terms of structural characteristics of the extracted features. This makes it more difficult for the domain discriminator to distinguish the source of the feature. The structure of the domain discriminator is specifically composed of 4 convolutional layers with a size of 3*3, a step size of 1, and a padding of 1 and 2 fully connected layers. The output channels are {128, 256, 512, 1024, 512, 1}.
Hyperbolic graph convolutional network
Here we introduce HGCN, which is a detailed introduction to the network. Including graph construction and hyperbolic graph convolution feature mapping method [25–27]. Before applying hyperbolic network graph convolution, we need to use the CNN to extract the similarity of the image to construct the adjacency matrix of the graph. After extraction, the complete adjacency matrix needs to be added to assist in composition. Then, the features of Euclidean space are mapped to hyperbolic space for hyperbolic space graph convolution feature mapping.
Graph construction method
Usually, a fixed graph G structure is obtained by CNN or artificially constructed adjacency matrix. The constructed graph may not be able to express all meaningful topological structures. Some vertices may be related to each other, but they may not be considered in the construction process. In the subsequent training process, the structure of the graph is fixed and training cannot be repeated. To solve this limitation, we adopt a complete adjacency matrix method here, so that each feature aggregation can take the result of the previous aggregation into account.
Before introducing our method, we first give a method to start building an adjacency matrix. First, the structural structure score X
A
extracted from the U-net compression path is used as the input of the graph vertices. Besides, we calculate the distance D between the pixels of each structure as an aid to construct the adjacency matrix. The advantage of this is: for example, two blocks feature difference scores obtained by the feature generate network is similar, but the distance on the picture is very big, and they belong to different parts. If two blocks are simply treated as semantically identical parts, segmentation deviation is likely to occur. On the contrary, if the feature block belongs to the target region, according to the connectivity of the graph, there will be another similar feature module close to it when establishing the adjacency matrix. In the subsequent convolution mapping training process, the weight between the two will gradually occupy the dominant position, and the influence of the long-distance similar feature block will be weakened. Therefore, when constructing the adjacency relationship, the distance between features is taken into consideration. For the location, we can establish a coordinate system on the original image, and then find the corresponding region of the feature points in the original image according to the convolution feature map [46], and define it in the center of the corresponding region. As described, the distances of x
i
and x
j
can be defined using the generalized Mahalanobis distance:
Where If M = 1, the above formula is the Euclidean distance. To cater to the later embedding from Euclidean space to hyperbolic space, here the distance formula we use a hyperbolic space distance metric [26]:
Where k represents the curvature of the hyperboloid and the calculation method of <x, y > ℓ is expressed as: -x0y0+ x1y1 +...+x
m
y
m
. Arcosh() function means inverse hyperbolic function. According to the above analysis, the adjacency matrix of the graph can be expressed as:
If in the subsequent training, the adjacency matrix constructed by CNN will lose some topological information and the graph structure cannot be repeatedly trained. Here, we propose to construct a new complement matrix to solve the above problems. First, give the feature similarity index between nodes V after each training:
Conclusively, we get a new adjacency matrix that can be updated:
The graph neural network can perform recursive message transfer. To combine the data structure information of the source domain and the target domain, our model uses graph convolution operations. Before introducing the hyperbolic graph convolutional network, we first briefly introduce the graph convolutional network [9]. The feature mapping formula of graph convolution is expressed as:
Where
The above is the linear propagation of the graph neural network in European space. According to Ref. [26] and Ref. [27], to perform feature mapping in the hyperbolic space, we need to map the Euclidean space feature to the hyperbolic space model for convolution operation. First, we use the exponential model to map the features extracted from the Euclidean space to the non-Euclidean space:
Where V ∈ T
x
Hd,K tangent space centered and ∥V ∥ ℓ is calculated by formula:
So far we can use exp and log function mapping to convert between Euclidean space and hyperbolic space. After the mapping model is given, the hyperbolic space graph convolution feature mapping formula is obtained according to the graph convolution rule of Euclidean space:
In this section, we mainly introduce the objective function of our model. We give a domain adaptation model task that mainly contains three-module loss functions: segmentation loss, confrontation alignment loss, domain discriminator loss, and structure alignment loss. We will introduce the specific content in detail below.
Segmentation loss
Since the target area that needs to be segmented takes up the effect, the loss function will fall into a local minimum during the training process. For this, we also need to increase the weight of the foreground area.We directly optimize the evaluation index,using DICE loss (equation:14). Besides, the label images we input into the network are binary image, and the range of breast lumps is small, and the use of DICE loss alone may lead to unguaranteed training stability. Combining various factors,we use Dice + Focal as our segmentation loss function for reference [47]:
Here the first term represents Focal cross-entropy loss, and the second term is Dice loss.G stands for generator.λ is the balance parameter. C is the number of segmentation target regions plus 1 [48].
Train the domain discriminator D to fool the generator G, so that the two people reach a balance during the training process. After the domain discriminator D receives the data generated by the generator G, it adjusts the parameters through the alignment confrontation loss:
After extracting the features of the source domain and target domain through the CNN network, they are sent to the hyperbolic graph convolutional network for training, so that the two are aligned in the structural space. The training loss function is defined as follows:
Dataset
We ran our method on two publicly available datasets INbreast and CBIS-DDSM. The INbreast database is a mammographic database, with images acquired at a Breast Centre, located in a University Hospital (Hospital de São João, Breast Centre, Porto, Portugal) [49]. There are 107 mammographic images in the INbreast dataset, and it also provides accurate image contours. The mammogram data of CBIS-DDSM comes from Massachusetts General Hospital, Wake Forest University School of Medicine, Sacred Heart Hospital, and Washington University of St Louis School of Medicine [50]. The data set contains 1231 mammograms with precise annotations. We randomly select 704 of them.
To verify the performance of the model, we conducted two experiments: one was to use CBIS-DDSM as the source domain and INbreast as the target domain, and the other was to convert the two. Since the INbreast data set is too small, during the experiment, we expanded INbreast through operations such as rotation and translation.
Domain difference
The largest part of CBIS-DDSM photography is a mammogram at Massachusetts General Hospital. The photographic races include Asians, black races, American Indians and white races. Inbreast photography comes from a university hospital in Porto, Portugal. Although both are X-ray breast images, they have different ages and different equipment. Inbreast uses Siemens full-field digital mammography, using amorphous selenium solid-state detectors. Due to the different equipment, the two will have different imaging parameters such as light intensity and gray value. On the other hand, CBIS-DDSM contains more comprehensive races than Inbreast. In addition to size, there are also many differences between different races in breast shape. In order to further explore the domain differences between the two. We use the FCN network to do pre-training in CBIS-DDSM, and then to test Inbreast. The result obtained (on the accuracy index) only reached 0.627, which is a certain gap between the comparison model and our method. This fully shows that there is a large domain drift between the two.
Evaluation metrics
We use the Dice similarity coefficient, Recall, Specificity, Pixel-accuracy evaluation indicators to evaluate our experimental results. Below we give the calculation formula of specific indicators:
Before training, we randomly crop CBIS-DDSM and INbreast to 572*572. Our code uses the PyTorch deep learning framework. The experiment was run on NVIDIA GTX 1080TI GPU with a memory of 11GB. During training, the learning rate was set to 1e-4 the optimizer used Adam Optimizer, and the update momentum β1 and β2 were set to 0.9 and 0.999 respectively. The batch size is set to 8, a total of 2000 iterations.
Comparison of results
In this section, we introduce our experimental results. In the first experiment, we used three mainstream and advanced methods in the industry: CycaDa [51], CycleGan [52], and ADVENT [37] to compare with the model proposed in this article. Secondly, we conducted ablation experiments with CBIS-DDSM as the source domain and INbreast as the target domain.
CBIS-DDSM→INbreast
The experimental results are shown in Table. 1: When we use the CycaDa model and the CycleGan model for segmentation, the results show that the dice index reaches 0.624 and 0.647, respectively. This figure has a certain gap with the ADVENT method proposed by Tuan-Hung. This is due to the latter’s full consideration of contextual information in the network used by the generator. Although, the method proposed by Tuan-Hung modifies the stride length and expansion rate to generate a larger field of view and obtain more contextual information. But on the dice indicator, our indicator is even better, reaching 0.732. This is because we use U-net as the feature extraction network architecture and also retain the low-level information of the image.
When the CBIS-DDSM dataset is used as the source domain and the INbreast dataset is used as the target domain, the comparison of the indicators between our method and the advanced method. We use the U-Net network to extract the eigenvalues of the source and target domains
When the CBIS-DDSM dataset is used as the source domain and the INbreast dataset is used as the target domain, the comparison of the indicators between our method and the advanced method. We use the U-Net network to extract the eigenvalues of the source and target domains
On the other hand, it is worth noting that our model is 1.8% and 1.1% higher in specificity indicators than CycaDa and CycleGan, respectively, indicating that our sample has a stronger ability to recognize negative features. We infer that this is due to the addition of a complete matrix to our model, which can also predict well for negative samples with similar semantics at long distances. In addition, we added a graph convolutional network to the generator to make the structural features extracted from the source domain and the target domain further reduce the difference between the two, so that the generator can generate more similar features, making the domain discriminator indistinguishable. Maximize the final game effect. This can be reflected from the fact that our model is ahead of the above three models in terms of pixel segmentation accuracy. In addition to quantitative measurement, we visualized the results of segmentation with the INbreast dataset.
Fig. 2 presents the visualization of our model and other models. It can be seen from the image that compared with CycaDa and CycleGan, the model proposed in this paper performs better in segmentation accuracy, and the segmented image is more realistic and has less noise. This shows that the hyperbolic graph convolution module we added can take into account the structural connection between the two data sets, and the segmentation results of the domain adaptation model have been further improved.
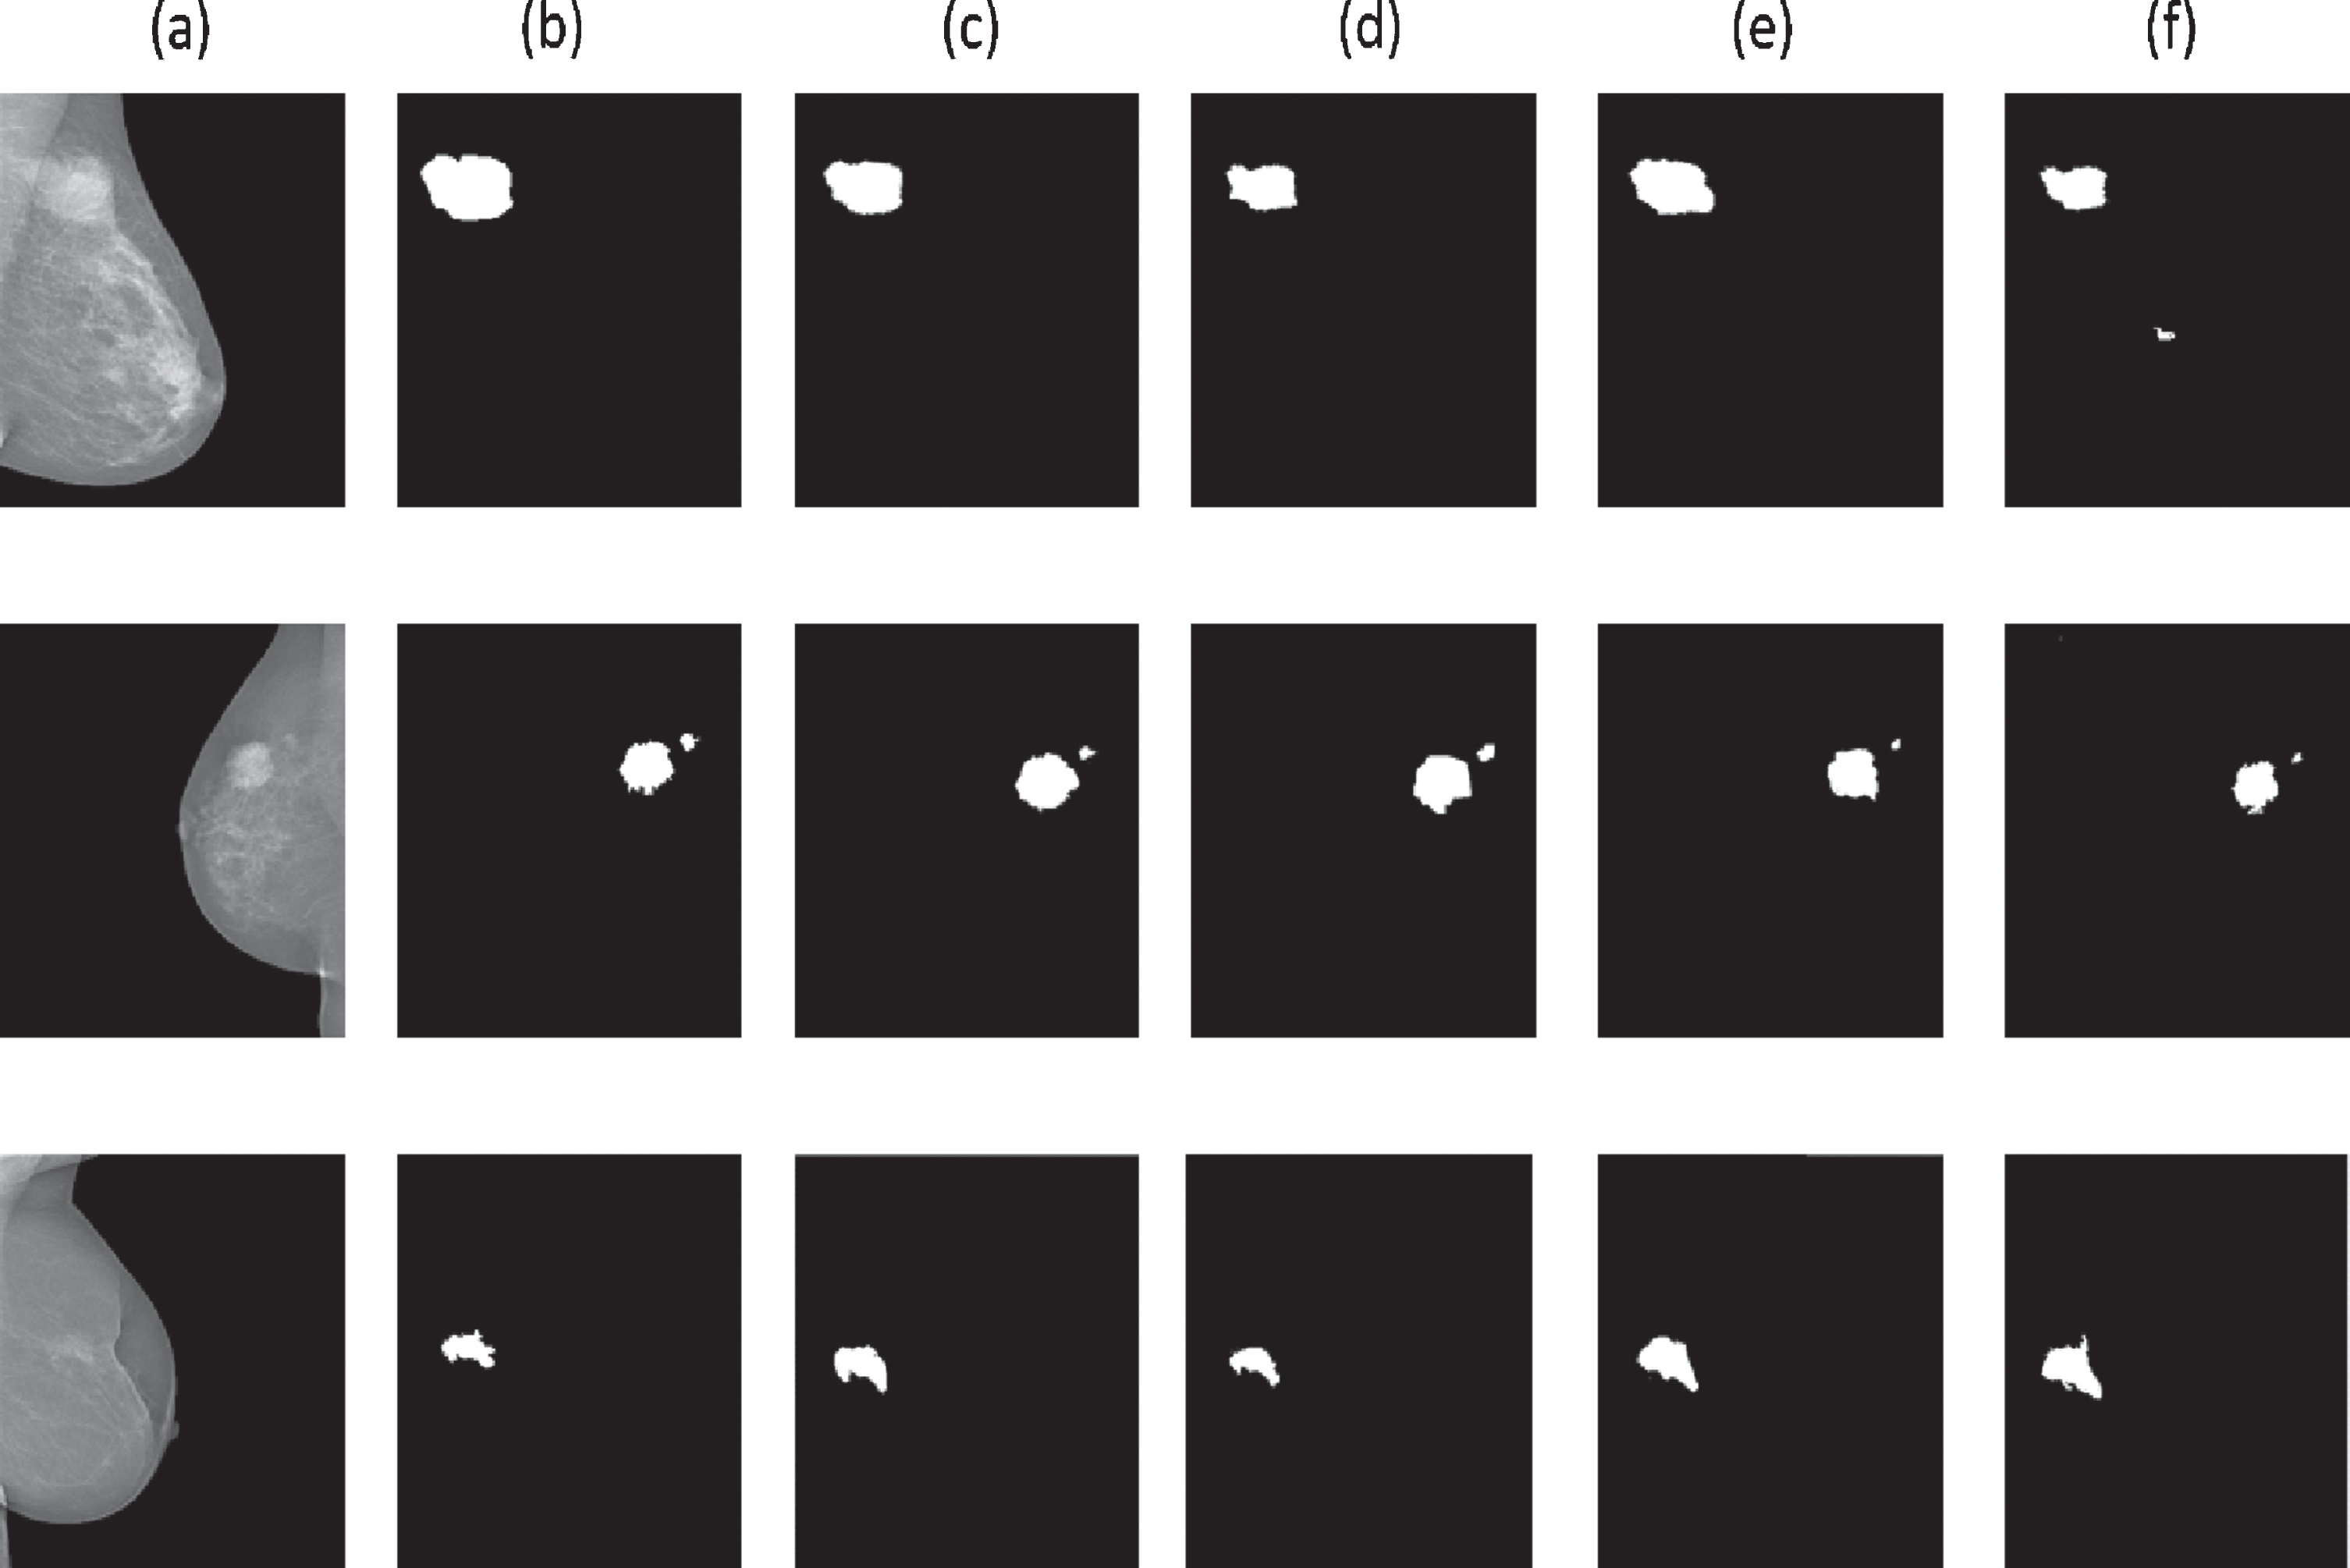
Comparison of segmentation results on the Inbreast dataset. From left to right: picture input (a), real label (b), the segmentation result of our model (c),ADVENT(d), CycaDa (e), CycleGan (f)
Since the INbreast data set has too few samples, in order to prevent the problem of insufficient fitting, we have performed operations such as rotation and translation on INbreast to expand the source domain. Similarly, we conducted quantitative tests with different methods, as shown in Table. 2. It can be clearly seen from the table that compared with the CBIS-DDSM data set as the source domain, the results this time are not satisfactory. Under our framework, the DICE indicator only reaches 0.661, which is a bigger gap than the previous experiment. The reason we speculate is that when INbreast is used as the source domain, the domain difference between the two is very large. Although the INbreast data set has been expanded, it is still not enough compared with the CBIS-DDSM data set. However, it is worth noting that despite the decline in various indicators, our model and ADEVENT model is still higher than the other two models and are in the lead. ADBVENT leads by reducing the entropy value of the target domain picture prediction result. Reduce the feature difference between the source domain and the target domain. Although ADBVENT further optimizes the feature differences, there is still a gap between the results and this article. This is because the graph convolutional network used in this paper can make the generator generate features with smaller differences. On the other hand, due to the characteristics of the graph, the structural characteristics between the two domains are also optimized during training.
When the INbreasts data set is used as the source domain and the CBIS-DDSM data set is used as the target domain, the comparison between our method and the advanced methods in terms of indicators. We use the U-Net network to extract the eigenvalues of the source and target domains
When the INbreasts data set is used as the source domain and the CBIS-DDSM data set is used as the target domain, the comparison between our method and the advanced methods in terms of indicators. We use the U-Net network to extract the eigenvalues of the source and target domains
Also for visual analysis, we randomly selected some segmentation results to visualize the CBIS-DDSM data set. It can be seen from the visualization Fig. 3 that the segmentation results of several domain adaptation methods are very different. Although INbreast is used as the source domain, the experimental results are not satisfactory. However, the visualization results still show the advanced nature of our method. For example: in the second row of samples in Figure 2, CycaDa and CycaGan have large noises, and the segmentation results have large deviations. Our method can still extract the outline of the mass. From this perspective alone, compared with other methods, our method still makes sense.
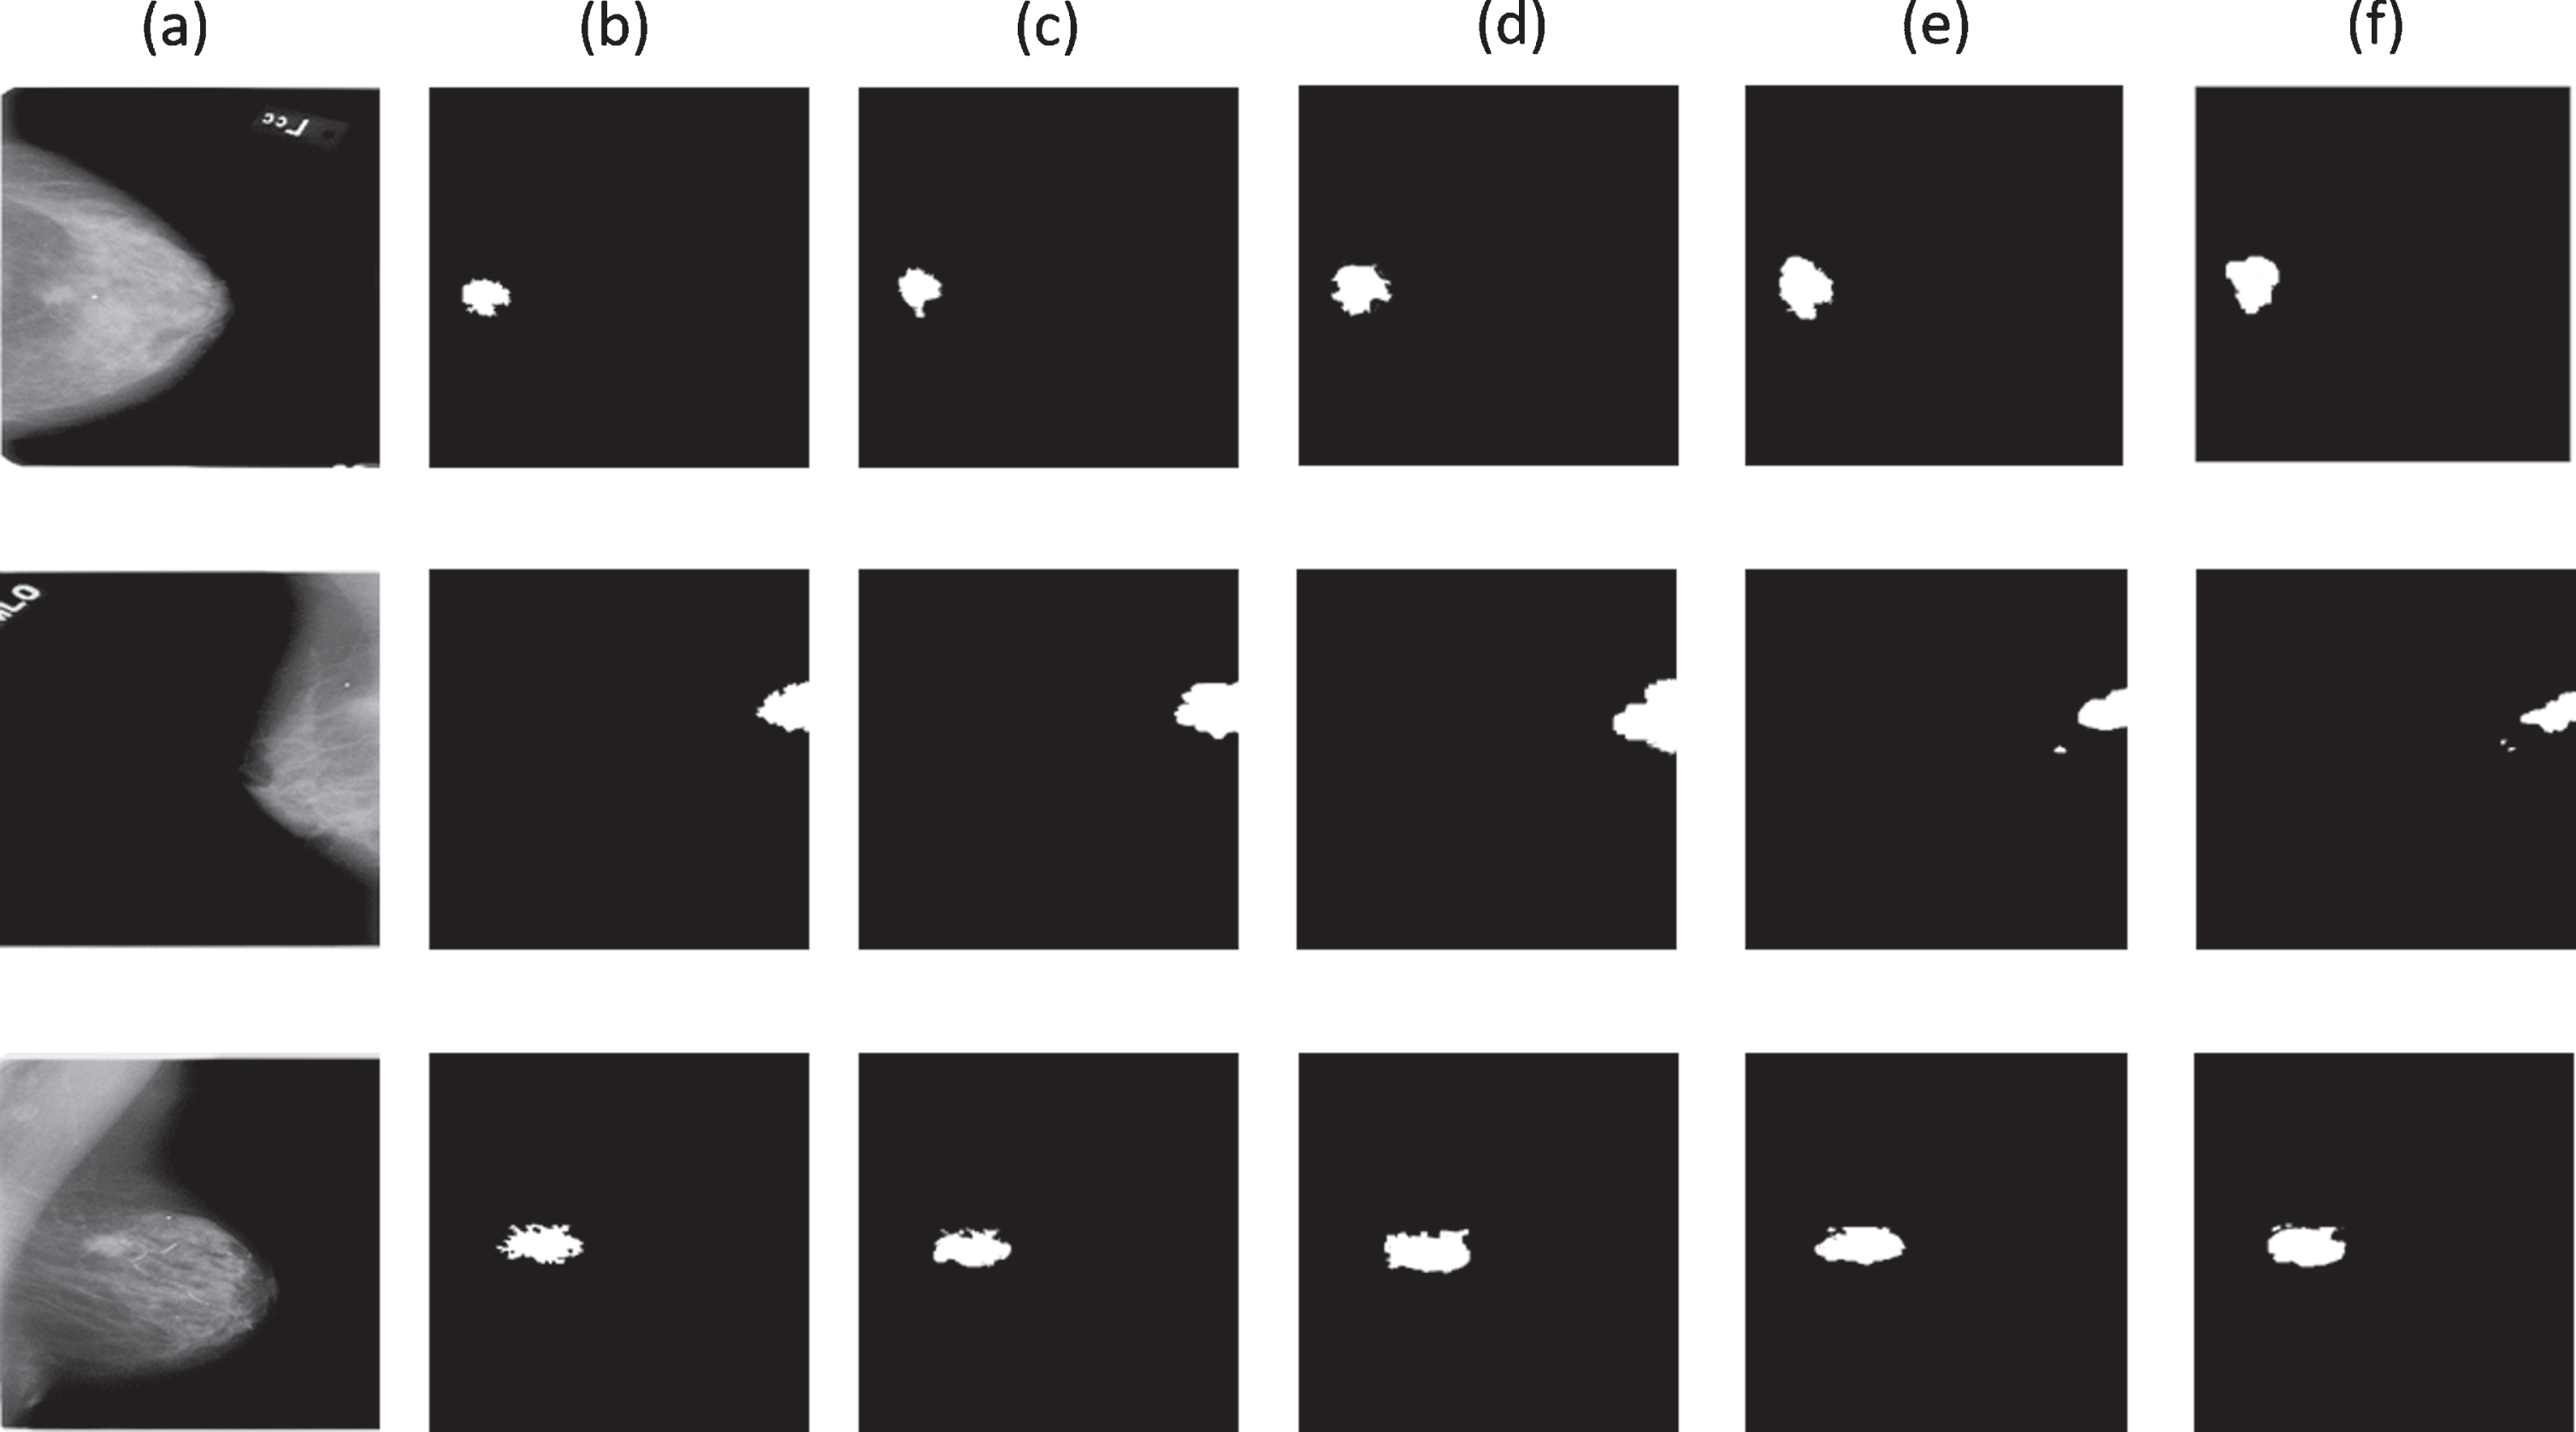
Comparison of segmentation results on the CBIS-DDSM dataset. From left to right: picture input (a), real label (b), the segmentation result of our model (c),ADVENT(d), CycaDa (e), CycleGan (f).
This section analyzes our model ablation experiments. In order to evaluate the impact of the hyperbolic graph convolutional network and the completion matrix on the segmentation experiment, we analyzed the two indicators of Dice and specificity.
We conducted ablation experiments on the CBIS-DDSM data set as the source domain to prove the influence of hyperbolic graph convolution and completion matrix on the new capabilities of breast mass segmentation. We plotted the boxPlot result as shown in Fig. 4. On the DICE Metrics, when using the GCN model, the addition of the complement matrix and the non-addition of the complement matrix reached 0.619 and 0.633, respectively. However, when using the HGCN model, adding the complement matrix and not adding the matrix reached 0.732 and 0.708. From the perspective of the Dice gap in the two cases, it can be seen that the use of a hyperbolic convolutional network can better find the similarity between the two domains, reduce the distortion and improve the segmentation accuracy.
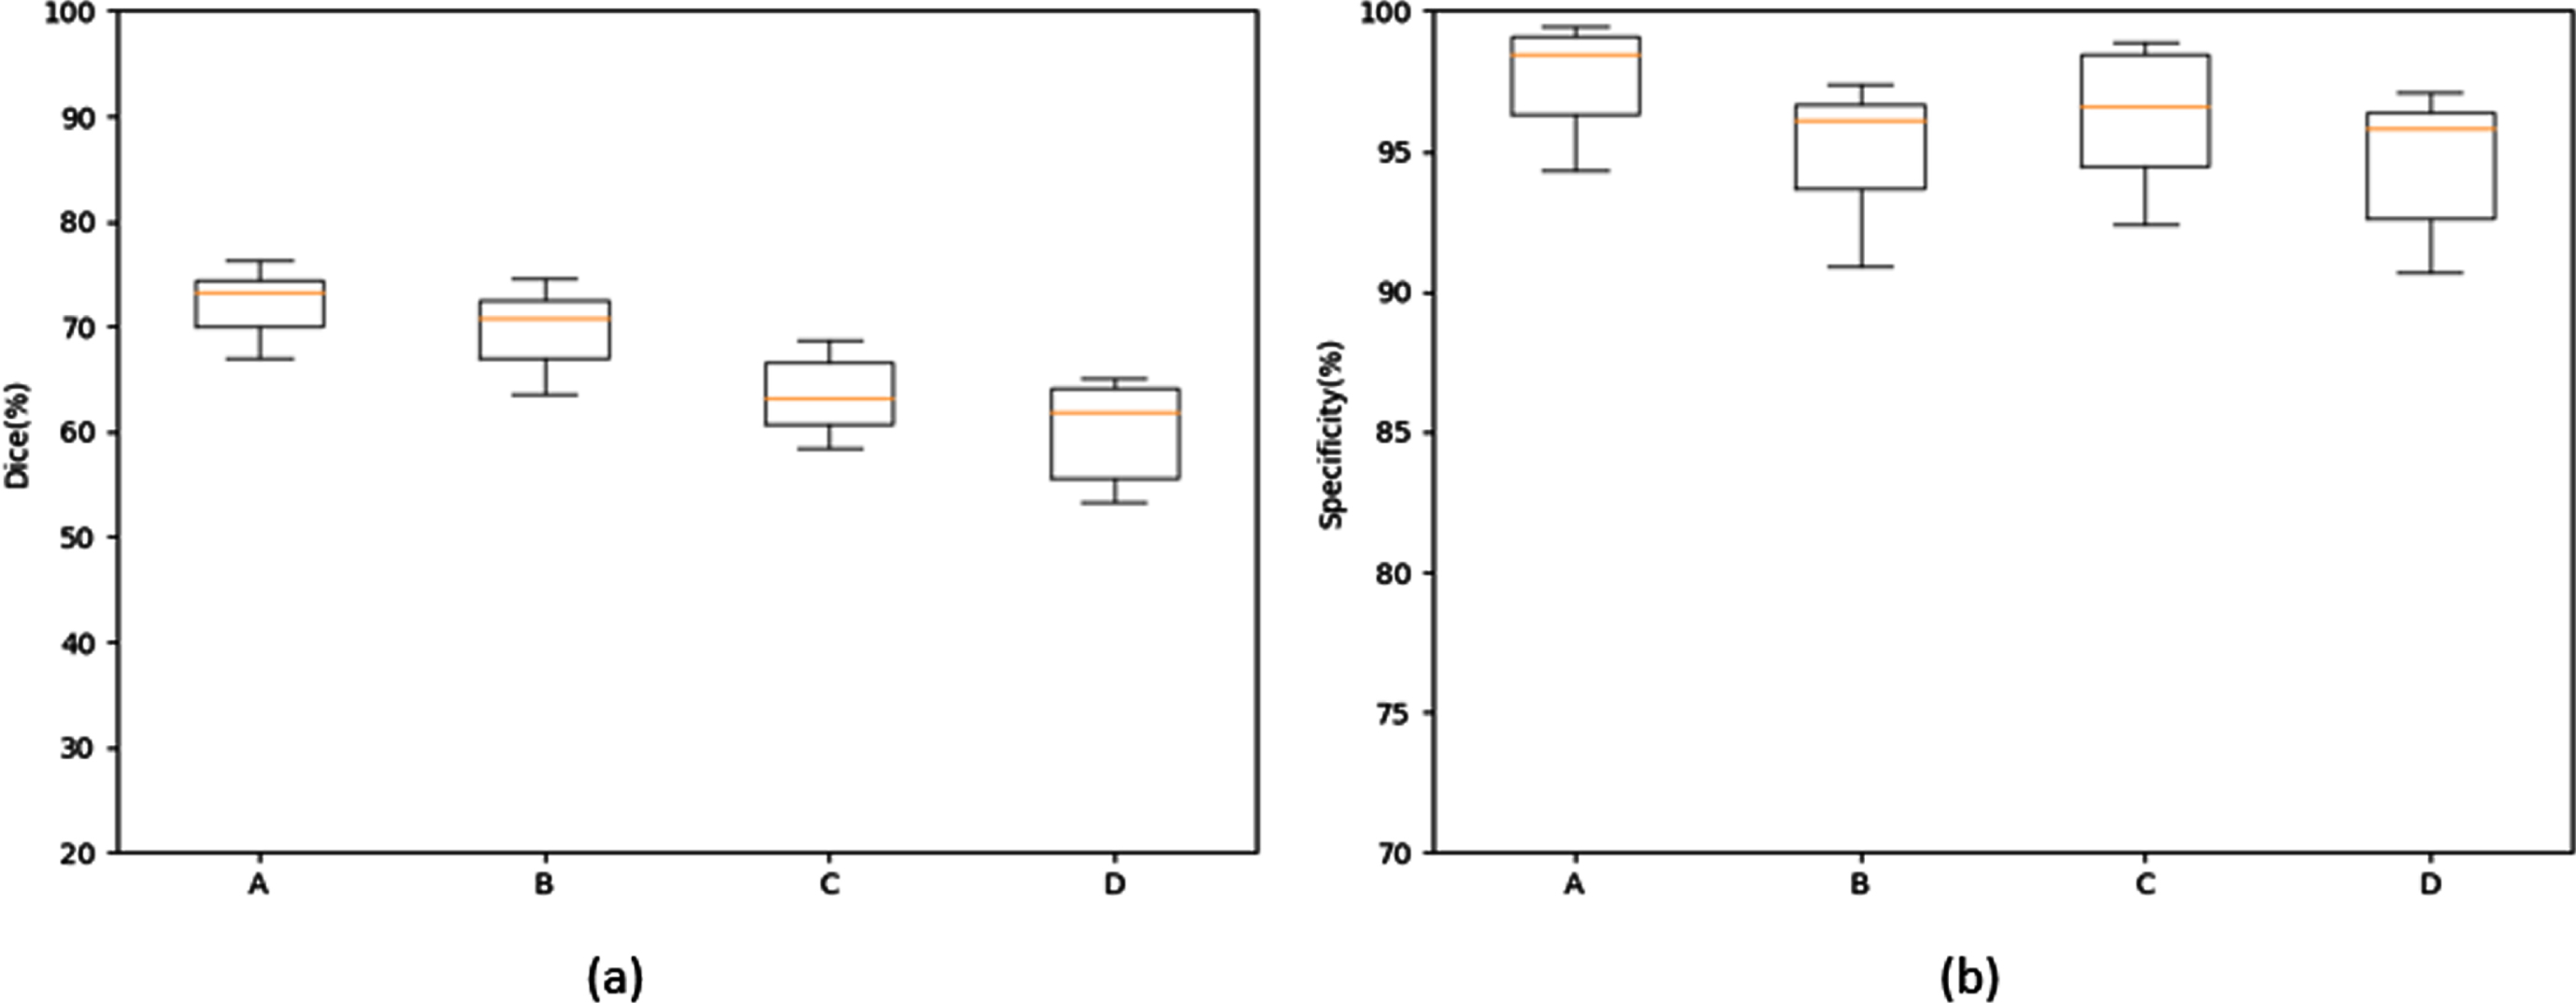
Box plots of (a) dice and (b) specificity metrics. Hyperbolic graph convolutional network with incomplete matrix(A), Hyperbolic graph convolutional network(B), Graph convolutional network with incomplete matrix(C), and Graph convolutional network(D).
The effect of the completion matrix can be reflected in Fig. 4(b). For the Specificity metrics, the GCN model using the completion matrix is 0.012 higher than not using the completion matrix. Similarly, there is a certain gap in the hgcn model. Moreover, it is interesting that the use of the complement matrix in the GCN model is higher than that of the hgcn model. As we all know, the Specificity metrics can measure the predictive ability of the model for negative samples, so the specificity data difference shows that the model of adding the completion matrix can improve the model’s prediction of the negative sample of the image, which verifies our previous speculation.
On the Inbreast and CBIS-DDSM datasets, our method achieves state-of-the-art performance. The excellent results produced by our model can be attributed to the following reasons: 1: The graph convolutional network is introduced in our model, and the parameters are shared during the training process to train the structural characteristics of the source and target domains, and further reduce the generation Differences in characteristics. 2: We propose a completion matrix to assist in the construction of graphs. The graph structure constructed in this way can change with the change of the characteristic parameters. In other words, the graph structure can be trained. In the past, the graph structure is generally a fixed structure obtained through the CNN network.
We have added a comparison with our peers in the experiment. From the experimental data, we can see that when CBIS-DDSM is used as the source domain because the model in this paper takes into account the low-level information of the image and the addition of the graph convolution network to promote the generator to generate features with smaller differences, the experimental results are obtained. It is more advanced than the other three models. But when using INbreast as the source domain, the gap between the two is obvious. Considering one of the reasons: Inbreast has insufficient training samples, and when Inbreast is used as the source domain, a sufficient amount of features is not sufficiently obtained. In this case, there is an unavoidable error in the distinction of pseudo-labels by the graph neural network. This also shows that the adaptability of the network model we proposed is not very good in the absence of sample size. This is also a problem that we need to solve in the next step. But our proposed method is still better than the advanced methods of the same industry. On the other hand, although embedded GNN has advantages over traditional neural networks, it is for different variants of GNN aggregation functions, The effect may be different. How to find an excellent aggregation function suitable for medical image segmentation is a research direction. In this paper, the classic message passing aggregation function is used. Information can be summarized, but this aggregate function may degenerate as the number of network layers deepens. So, we only used a 3-layer graph network. Whether the idea of a residual network can be introduced into a graph neural network, so as to be able to distinguish positive and negative samples more accurately, is also a question that needs to be explored.
Conclusion
This paper proposes an unsupervised hyperbolic graph convolutional domain adaptive breast segmentation model. We use hyperbolic graph convolutional networks to share parameters in the source domain and target domain during the training process to promote structural alignment between the two. Because the graph structure remains unchanged during the hyperbolic graph convolution training process, resulting in missing or false close associations, we have added a trainable completion matrix to the hyperbolic graph convolution layer. Our experiments were carried out on the Inbreast and CBIS-DDSM datasets respectively, and the results show that the network framework we proposed is effective in breast mass segmentation performance.
Footnotes
Acknowledgments
This work is supported by the Innovation Capacity Construction Project of Jilin Province Development and Reform Commission (2021FGWCXNLJSSZ10), the National Key Research and Development Program of China (No. 2020YFA0714103) and the Science & Technology Development Project of Jilin Province, China (20190302117GX).