
Abstract
Imbalanced dataset classification is challenging because of the severely skewed class distribution. The traditional machine learning algorithms show degraded performance for these skewed datasets. However, there are additional characteristics of a classification dataset that are not only challenging for the traditional machine learning algorithms but also increase the difficulty when constructing a model for imbalanced datasets. Data complexity metrics identify these intrinsic characteristics, which cause substantial deterioration of the learning algorithms’ performance. Though many research efforts have been made to deal with class noise, none of them focused on imbalanced datasets coupled with other intrinsic factors. This paper presents a novel hybrid pre-processing algorithm focusing on treating the class-label noise in the imbalanced dataset, which suffers from other intrinsic factors such as class overlapping, non-linear class boundaries, small disjuncts, and borderline examples. This algorithm uses the wCM complexity metric (proposed for imbalanced dataset) to identify noisy, borderline, and other difficult instances of the dataset and then intelligently handles these instances. Experiments on synthetic datasets and real-world datasets with different levels of imbalance, noise, small disjuncts, class overlapping, and borderline examples are conducted to check the effectiveness of the proposed algorithm. The experimental results show that the proposed algorithm offers an interesting alternative to popular state-of-the-art pre-processing algorithms for effectively handling imbalanced datasets along with noise and other difficulties.
Keywords
Introduction
A dataset is considered imbalanced in the classification task when the distribution of data points per class is not equal. Traditional machine learning classifiers tend to predict the data points from the majority class (i.e., the class with a large number of data points) correctly, but the data points of the minority class (i.e., the class with less number data points) are treated as noise and are usually ignored. Hence, the probability of misclassification of the minority class is high compared to the majority class [1]. This imbalanced dataset problem is mainly found in classification tasks such as predicting frauds in bank transactions, identifying cancer diseases, predicting software defects, etc.
Over the past years, several imbalance handling methods have been proposed [2–5]. Their goal is to improve the classifiers’ performance on the minority class without heavily sacrificing the performance of the majority class. A complete review of the imbalance handling methods can be found in [6, 7]. However, it is observed that an imbalanced dataset does not always impose problems; for example, when the classes are linearly separable in the input feature space, or the imbalance ratio is not very high, it is not difficult to build a proper classification model [8, 9]. The problem arises when the imbalanced dataset suffers from other intrinsic factors such as class overlap [10–12], presence of noise [13], small disjuncts [9], etc. There is a common understanding of the researchers [9, 14] that the classification model accuracy for minority class degrades when the class imbalance occurs together with the above intrinsic factors, though the accuracy of the classifier for the majority class remains high.
Many researchers have proposed algorithms to deal with the dataset intrinsic factors in an imbalanced dataset, but they considered these factors independently. In 2004, Jo and Jopkiwikz [9] proposed an approach to handle small disjuncts in imbalanced datasets. A hybrid method for handling class overlapping and class imbalance problems was proposed in 2013 by Alejo et al. [15]. J. A. Saez et al., [16] in 2013 proposed a noise filter which was an extension of SMOTE to handle noisy and borderline examples in imbalanced datasets. In [17], the authors developed a new argument-based rule induction algorithm, ABMODLEM, with the help of expert knowledge from class-imbalanced data to the learning process. A method based on feature selection and instance selection to overcome class overlap and the class imbalance was suggested by Fernandez et al. [18]. In [19], the authors designed RIFUS to handle imbalanced dataset problem and noisy points. In 2019, Koziarskia et al. [20] proposed a radial-based oversampling algorithm to deal with imbalanced datasets along with the class label and feature noise. Recently, in 2020 an undersampling technique, DBMIST-US, was proposed [21] to handle the class imbalance problem with class overlapping. Another method for improving the performance of the classification in the imbalance dataset was proposed in [22]. This method used the local Mahalanobis distance learning (LMDL) method in the nearest neighbor.
In the literature, the researchers proposed the data complexity metrics to analyze the intrinsic factors of datasets. These data complexity metrics help extract knowledge about dataset factors that support selecting the proper learning algorithm. Ho and Basu [23] proposed data complexity metrics to measure the complexity of classification tasks. Most of the data complexity metrics proposed by various researchers [9, 23–25] are for balanced data sets. In [26], we presented a systematic study to analyze the behavior of the existing complexity metrics when used with imbalanced datasets. We divided the imbalanced datasets into two categories: harmful and unharmful, using the complexity metrics. After that, we applied oversampling techniques to these datasets. The results revealed that these complexity metrics do not perform well for imbalanced datasets, which also suffer from other intrinsic factors such as class overlapping, noise, small disjuncts, etc. In [27], we proposed the weighted complexity metric (wCM) to access the difficulty level of an imbalanced dataset. This metric calculates the dataset complexity by computing the weighted nearest neighbors.
The hybrid approach proposed in this paper is a pre-processing technique that uses the wCM metric along with oversampling data points of minority classes and undersampling majority class points. We apply our proposed hybrid pre-processing algorithm to balance the dataset intelligently by treating noisy and difficult regions’ data points. Our algorithm is greatly inspired by the SPIDER method of strong amplification, presented in [14]. SPIDER method based on strong amplification simply calculates the k-nearest neighbor based on which it labels the data points as: ‘safe’ or ‘noisy.’ It amplifies all ‘noisy’ and ‘safe’ points from the minority class and removes all ‘noisy’ points from the majority class.
Comparative analysis of the proposed technique with existing techniques
Comparative analysis of the proposed technique with existing techniques
We have conducted an experimental evaluation of our hybrid pre-processing algorithm on three artificial benchmarked datasets and five real-world datasets with different noise levels. Moreover, we used four classifiers as Decision tree (DT), k-nn, Logistic regressor (LR), SVM with Linear kernel, and Gaussian kernel. All the experiments are conducted in MATLAB software and the “Classification Learner Toolbox of MATLAB” for classifiers. To prove the usefulness of our proposed algorithm, we compared it with the existing pre-processing methods like SMOTE-ENN (SMENN), SMOTE-Tk (SMTk), SPIDER, SMOTE (SM), BSMOTE (BSM), and ADASYN.
The organization of the rest paper is as follows. Section 2 presents the background, describing the state-of-art for the class imbalance problem, review of the data complexity metrics. Section 3 discusses the data complexity metric, wCM. In Section 4, we have presented our approach based on wCM for pre-processing the imbalanced datasets. Section 5 shows the experimental study performed and the analysis of the results. Finally, we conclude the paper with Section 6.
The data complexity metrics measure the complexity of a dataset which helps in selecting the appropriate classification algorithm. Ho and Basu [28] proposed the complexity metrics for binary classification problems. Further, extending the work of Ho and Basu, Singh [29] proposed two new complexity metrics for pattern recognition based on feature space partitioning. Various researchers have used these metrics to analyze classification problems, including understanding the effect of class overlapping, data dimensionality, and class density [30, 31]; selecting an evolutionary prototyping algorithm [31]. J.A. Saez et al. and Macia et al. [16, 32] used data complexity metrics: to predict the noise filtering efficacy in the nearest neighbor classifier [16] and to characterize the datasets for the selection of appropriate classifier [32]. Luengo and Herrera [33] proposed an automatic extraction method to differentiate the problem space using data complexity measures for classification. Moreover, Zubek and Plewczynski [34] described a data complexity metric based on probability distribution and Hellinger distance. Brun et al. [35], using Ho and Basu metrics as a reference, analyzed dynamic classifiers selection techniques and proposed the selection method based on these complexity metrics for dynamic selection of classifier.
Conversely, the researchers [8, 35–39] proved that the existing data complexity metrics do not work well on imbalanced datasets. In the literature, few researchers have proposed complexity metrics, see [8, 38], which help measure the complexity of imbalanced datasets. A complexity metric using scatter matrix-based class separability method for imbalanced datasets was proposed by Yu et al. [38]. Anwar et al. [36] proposed a data complexity metric, based on the k- nearest neighbor approach, for imbalanced datasets. Diez-Pastor et al. [39] used them to predict data complexity intervals for which some diversity-enhancing techniques may improve the results of an ensemble method. Fernandez et al. [40] conducted studies on microarray data, an example of highly imbalanced gene expression data, for analyzing the usefulness of data complexity metrics to evaluate the behavior of SMOTE algorithm with respect to the feature selection method. Victor et al. [8] presented three complexity metrics, adapted from the famous complexity metrics, for imbalanced datasets by regarding each class individually. In [41] authors proposed the Bayes Impact Index Index (BI3) metric to measure the impact of imbalance.
Weight calculation using wCM
In this paper, we used wCM to calculate the weights of the instances in the dataset based on the distances to the k-nearest neighbors for a data point. In this metric, (k + 1) neighbors are calculated, wherein the last neighbor (i.e. (k + 1)th neighbor) is used to calculate the first k neighbors weights to avoid the condition of assigning the kth neighbor weight as 0. This complexity metric involves the following steps.
i). Find (k + 1)-nearest neighbors (k is odd) of each data point in a class.
ii). Assign a weight to each of the (k + 1)-nearest neighbors.
w i = weight for i-th neighbor for the data point x0.
d (xi, xj) = Euclidean distance between the data point x i and x j .
It can be seen that according to equation (1) the nearest neighbor is assigned the weight as one and the farthest neighbor (i.e. (k + 1)th neighbor) is assigned the weight as 0.
iii) Normalize the weights as:
iv) The weights of the nearest neighbours are summed based on their class label.
We have used Euclidean distance to compute the nearest neighbors, which can be defined between two points a and b with p dimension, as:
The number of nearest neighbours (k) is considered as an odd value. For the datasets used in the paper, the values of the features have been standardized to put equal weight on each feature in computing the distances.
This section provides an overview of the proposed hybrid pre-processing algorithm that deals intelligently to overcome the difficulties in the given datasets: class imbalance, class label noise, non-linear class boundaries, and class overlapping. Our approach identifies the noisy data points and then flips the class labels of these data points. After that, it regenerates those data points of minority class that lie in the difficult areas (such as borderline examples, small disjuncts) and expands the decision borders in favor of the minority class by removing the data points from the majority class. It expands decision boundaries in such a way so as the original class distribution is not altered.
This algorithm consists of three phases:
i) First Phase (Labeling the data points): In the first phase, the algorithm calculates the complexity of each data point using the wCM metric (explained in section 3). After that, it labels data points as either ‘safe,’ ‘noise,’ or ‘difficult.’ Safe data points should be correctly classified by the base classifier, while noise and difficult data points are likely to be misclassified and thus need special attention in the second phase. Here, noise refers to those data points of majority (or minority class), which are located deep inside the region of the minority class (or majority class) and thus tend to be misclassified by the classifier as of other class. Moreover, difficult data points refer to the borderline data points, whose majority neighbors are of opposite class and thus likely to be misclassified by the classifier.
ii) Second Phase (Flipping the noise): The second phase treats the noisy data points by flipping the class label of majority class noisy points to minority class and vice-versa. After that, it oversamples the minority class data points by replicating all difficult data points from the minority class, and the number of copies generated for these minority class points is equal to the number of the examples in their neighborhood from the majority class.
iii) Third Phase (Undersampling the majority class): In its third phase, the algorithm re-calculates the complexity of the majority class data points using the new dataset, which consists of the old data points and the newly generated copies of the minority class. Thereafter, it undersamples ‘difficult’ data points from the majority class.
This algorithm is presented below.
Here, D = denotes the dataset,
D’=denotes a new dataset, where D’={D
P-safe, P-noise, P-difficult=safe, noisy, and difficult points from the minority class, respectively.
N-safe, N-noise, N-difficult=safe, noisy, and difficult points from the majority class, respectively.
The algorithm calculates the complexity of data points in D using the wCM metric. Here, label(q) returns the label of the data point q, nearest_neighbor(q, k) finds k nearest neighbors for data point q, and no_of_neighbors(q, k, C) gives the count of neighbors of q which belong to the class C using its k nearest neighbors. For flipping the noisy points, we have used a threshold value, ⌜. For the minority class, we set the threshold value as ⌜=0.6, whereas for the majority class, the threshold value is set to ⌜=0.7. Figure 1 shows the flowchart for the proposed algorithm.
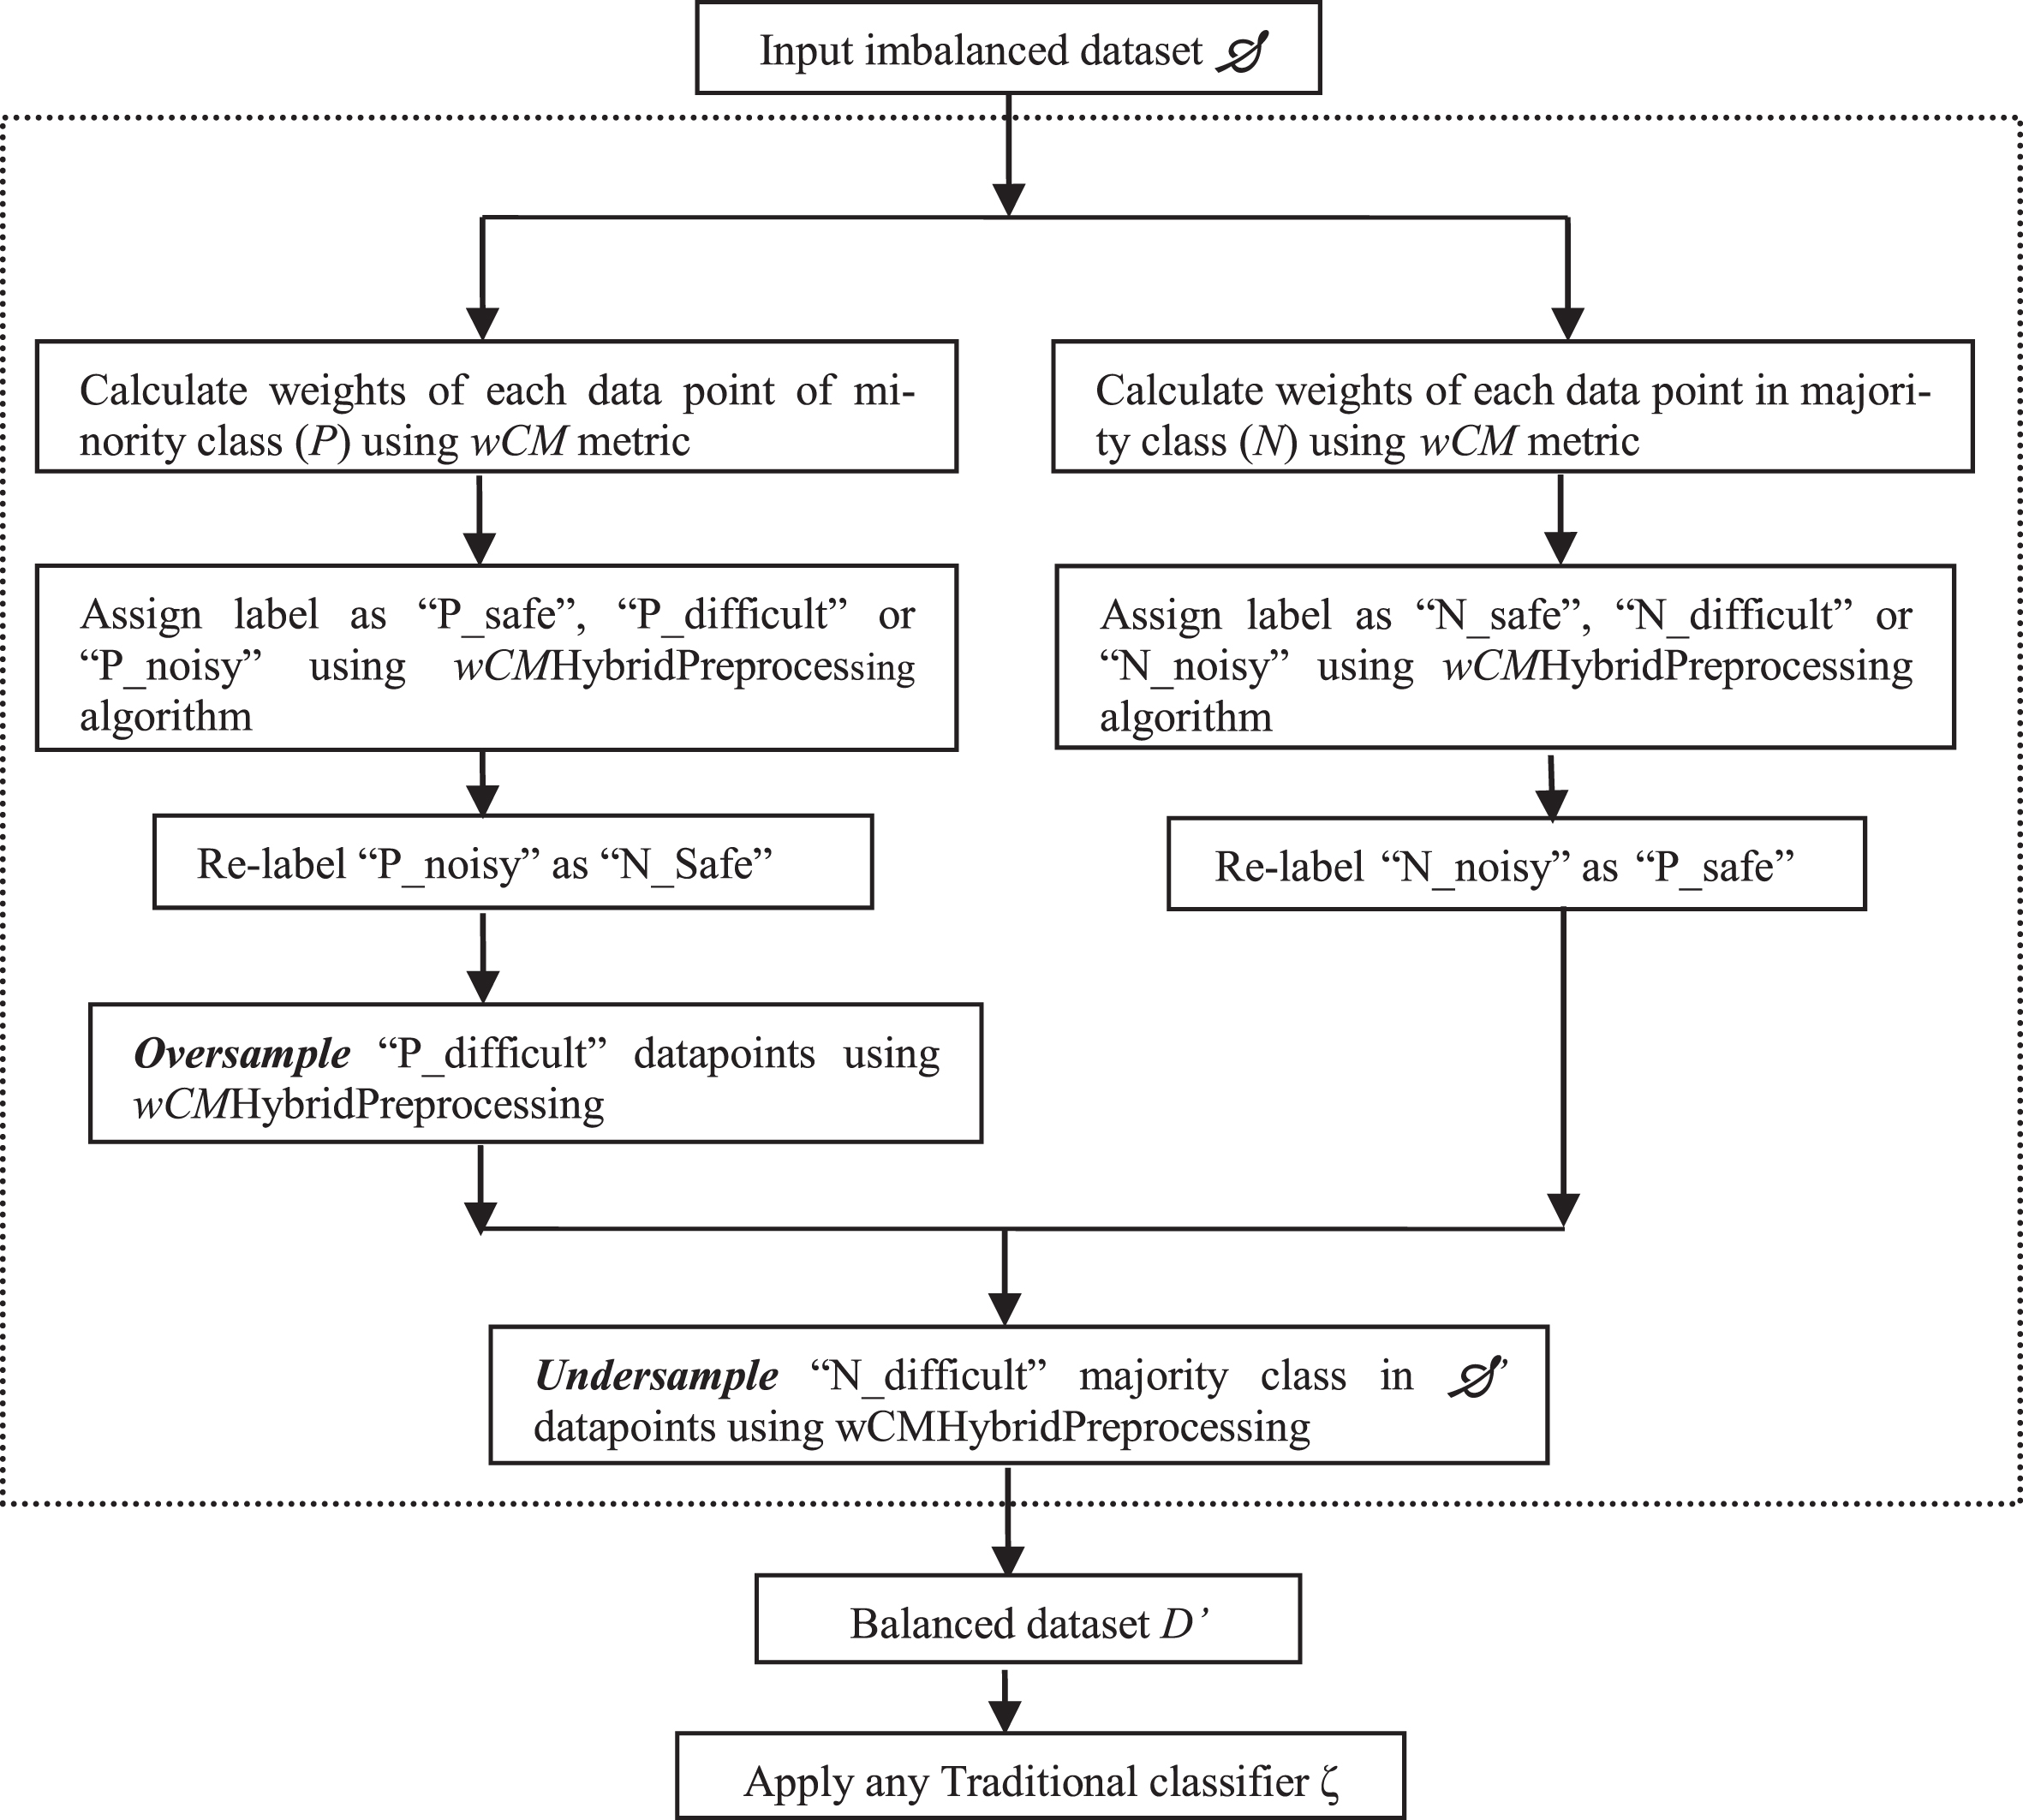
Flowchart showing the steps involved in the Proposed Algorithm.
Algorithm 1: wCMHybridPre-Processing (D, k)
For each q ∈ N; do Calculate the nearest neighbors (k + 1) of q in D and assign weights to the neighbors of q using wCM weight formula (refer to steps 1 to 4 of wCM metric, Section 3). if W(q, N)>W(q,P), then Label the point q as “N_safe” else if W(q)>, then label q as “N_noise” else label q as “N_difficult” End for loop For each q ∈ P; do Calculate the nearest neighbors (k + 1) of q in D and assign weights to the neighbors of q using wCM weight formula (refer to steps 1 to 4 of wCM metric, Section 3). if W(q, P)>W(q, N), then label the point q as “P_safe” else if W(q)> ’I, then label q as “P_noise” else label q as “P_difficult” End for loop Change the labels of “N_noise” data points as “P_safe” and the labels of “P_noise” as “N_safe” For each point q ∈ P; do If (label(q)=”P_difficult”); then find nearest_neighbors(q, k + 2) If (no_of_neighbors(q, k + 2, N)>no_of_neighbours(q, k + 2, P)); then Create copies of q = no_of_neighbors (q, k + 2, N), with label as “N_safe” or “N_difficult” Else create copies of q= no_of_neighbors(q, k, N), with label as “N_safe” or “N_difficult” End if End for loop D’=D U {new data points generated for minority class} Re-calculate the complexity for data points of majority class using D’ data set and re-label the majority class points as “N_safe” or “N_difficult” For each q ∈ N; do If (label(q)=”N_difficult”); then Remove q from N End for loop
Apply any traditional classifier on D’
Time Complexity Analysis:
On simplification:
where,
d, d’, p and n represents the size of the dataset D, new dataset D’, minority class P and majority class N, respectively. C1234 = C1 x C2 + C3 + C4, C56789101112131415 = C5 x C6 + C7 + C8 + C9 + C10 x C11 x C12 + C13 + C14 + C15, C1617181920= C16 + C17 + C18 x C19 x C20.
Here, C1, C2, ... , C20 are integer constants that in asymptotic notation representing the time taken by the machine for the respective operation execution. Each step is performing different operation so different integer constants C1, C2, ... ., C20 are taken as multiplication factor for time complexity analysis for respective step. O(1) is the asymptotic notation representing a constant time taken for the respective operation. As Step 3, Step 4, Step 7, Step 8, Step 11, Step 13, Step 14, Step15, Step 16, Step 19 and Step 20 takes constant time for execution, so their time complexity is O(1). Thus, the time complexity for the first four steps is T(C1. O(n)+C2.O(d)+C3.O(1)+C4.O(1)), which is simplified as C1234.O(n x d). Here, O(n) is the for loop complexity. O(d) is the complexity of finding the k nearest neighbors in data set D and assigning weights to the neighbors. Similarly, the time complexity analysis for steps 5, 6, 7, 8 and 9 is T(C5.O(p) x C6.O(d)+C7.O(1)+C8.O(1)+C9.O(d)), which simplifies to T(C56789.O(p x d)). Similarly, the simplified time complexity for oversampling steps from Step 10 to Step 16 is T(C10111213141516.O(p x d)) and the simplified time complexity for the under-sampling steps from Step 17 to Step 20 can be written as T(C17181920.O(p x d’), where d’ is the size of the new data set and d’ can be written in terms of d, because the size of D’ will be in fractions of original dataset D. Also, p can be written in terms of n because minority class points will be less or equal to the majority class points. Thereafter, n can be written as d because majority class points will be the subset of the dataset D. Hence, on simplification the time complexity of wCMHybridPre-Processing algorithm is written as O||D2||.
Experiments are implemented on synthetic datasets and real-world datasets downloaded from the KEEL Machine Learning repository. In sub-section 5.1 and 5.2 descriptions of synthetic and real-world datasets are given.
Synthetic datasets
We have used synthetic datasets of three different shapes (with different imbalance ratios, noise levels, and sizes), downloaded from the KEEL repository [42]. These different shapes imbalanced datasets are used to show that our proposed method can handle small disjunsts, borderline examples, and non-linear boundaries. Also, we have introduced noise in these datasets so that we can also show that our proposed algorithm can handle the class-label noise.
i)
ii)
iii)
These synthetic datasets are shown in Fig. 2, where red dots denote the minority class instances, and blue dots denote the majority class instances. For better understanding, we have marked the boundaries for the minority class in Fig. 2. The sizes of these three datasets considered in this paper are 600 and 800 data points with two dimensions and imbalance ratios –1 : 7, 1 : 5.
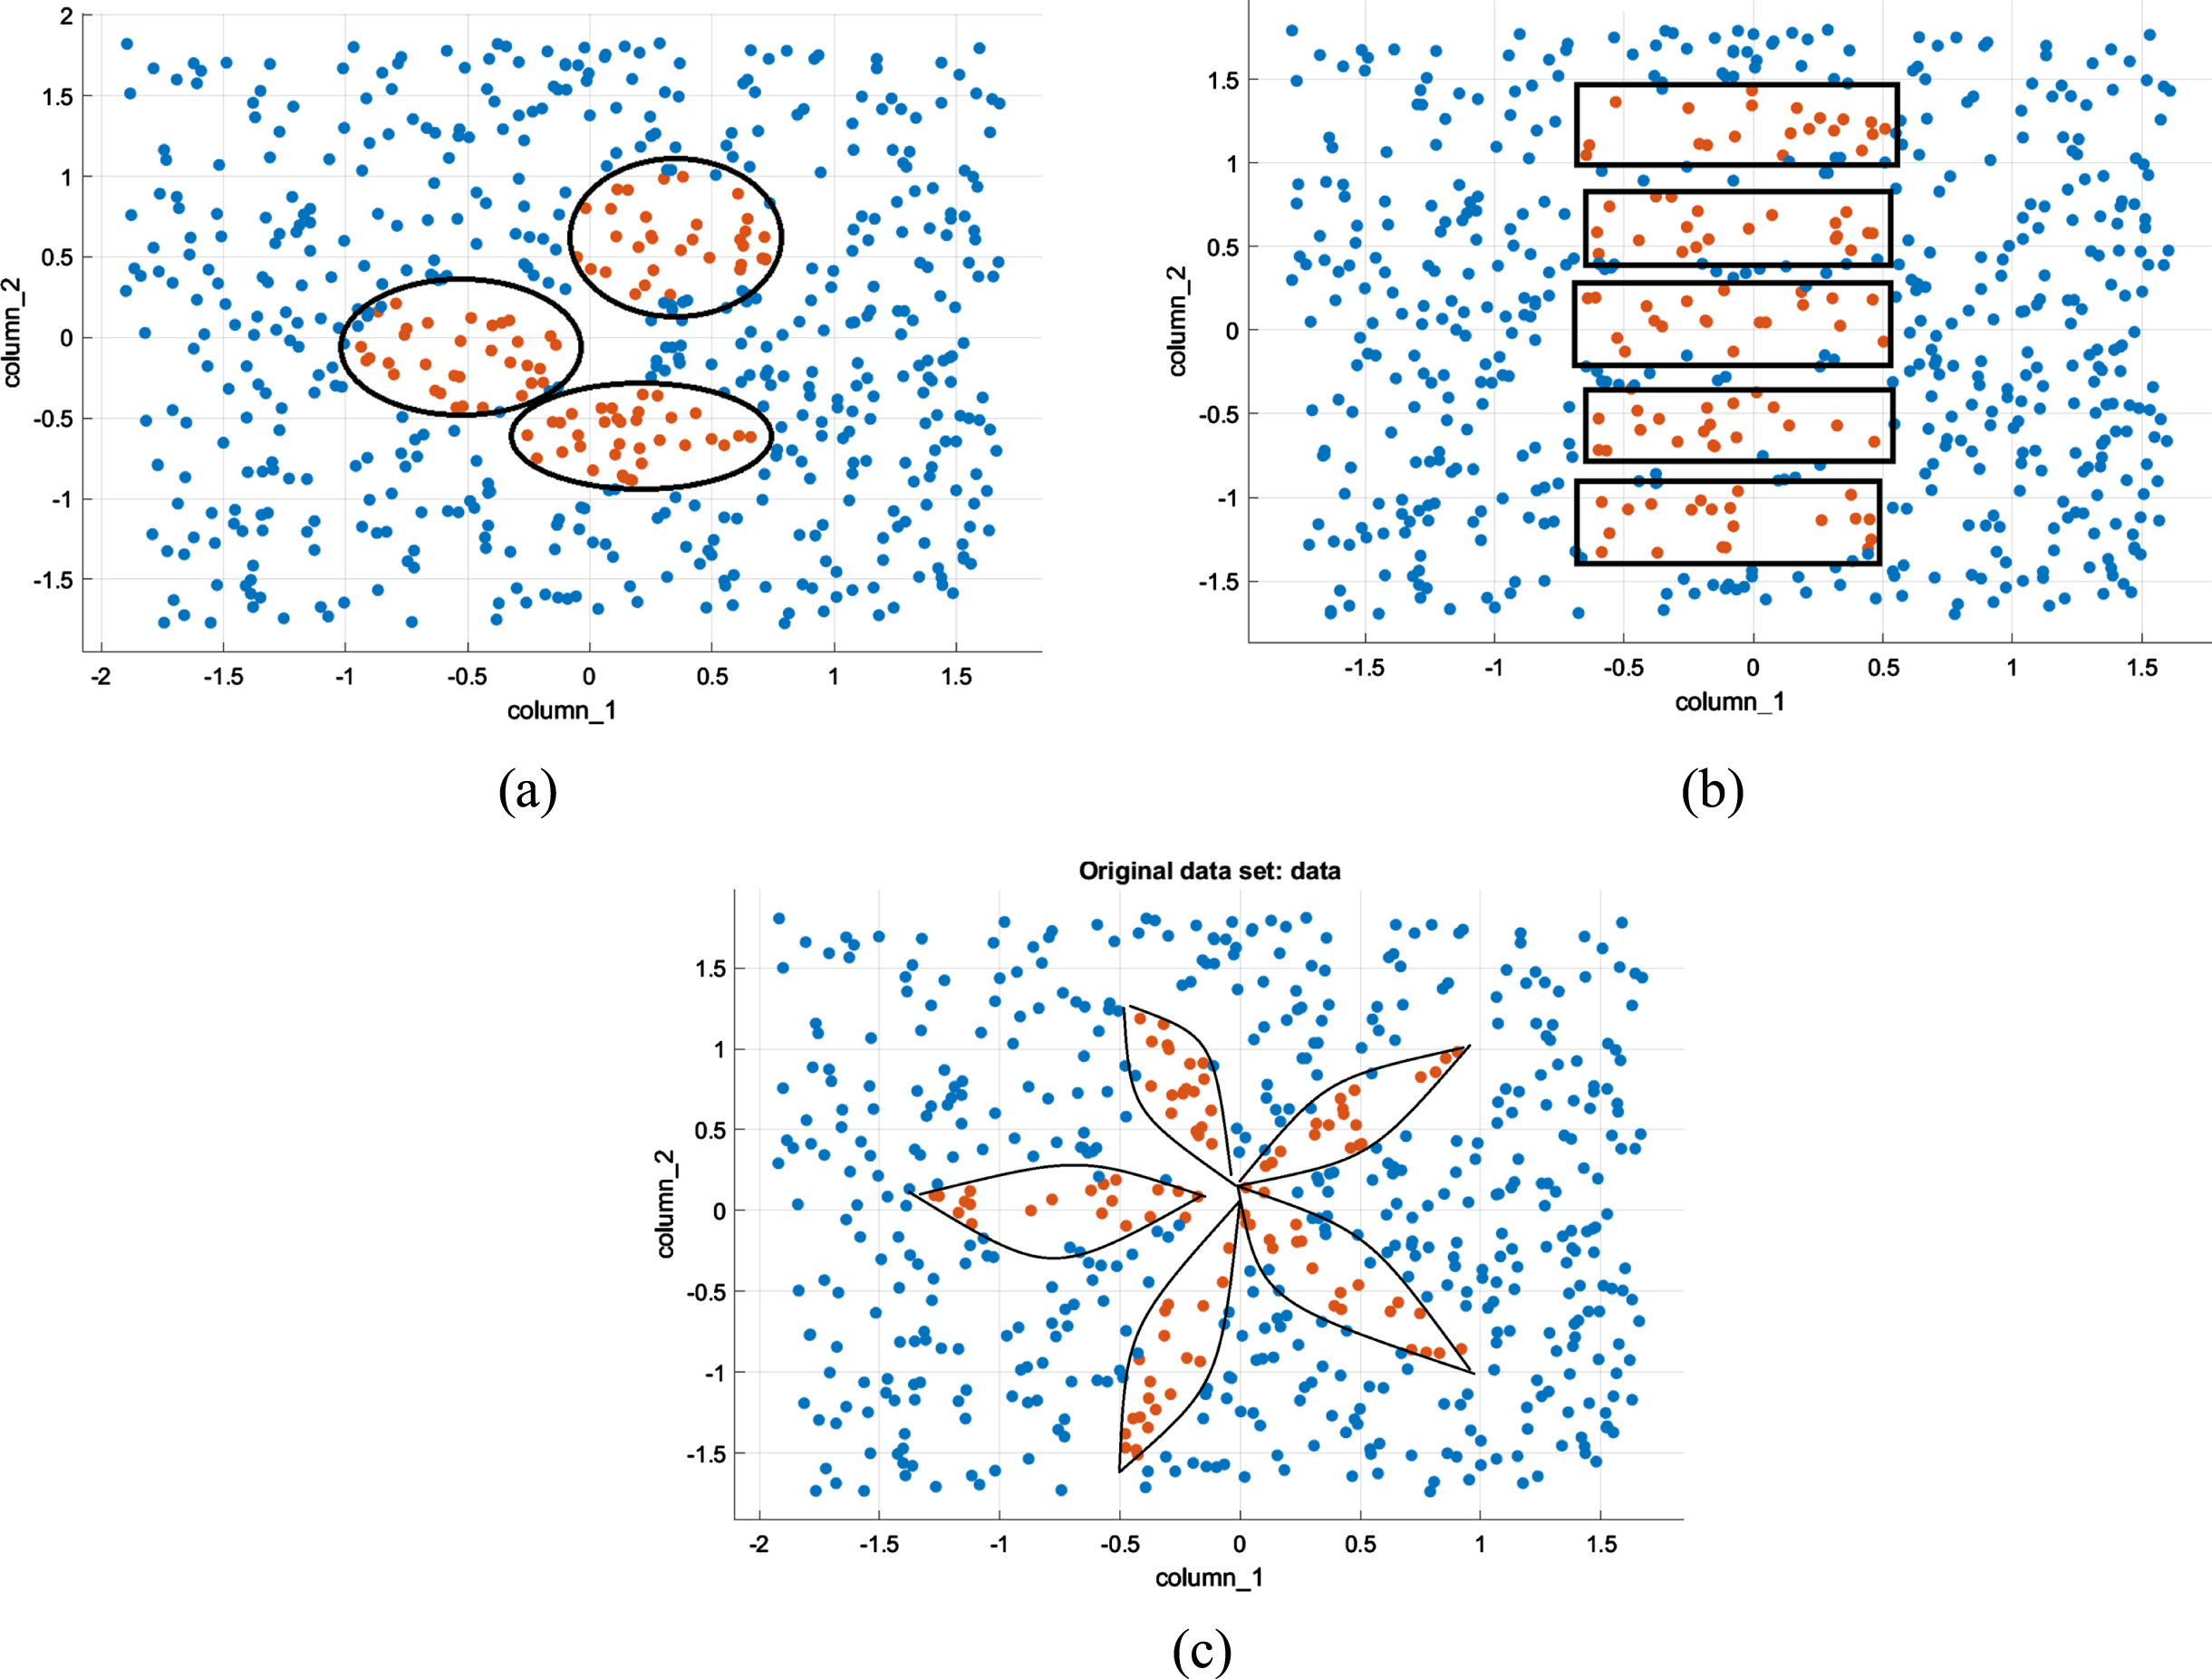
Synthetic datasets considered in this paper.
We have used 5 real-world imbalanced datasets with different imbalance ratios, sizes, and noise levels, such as 0%, 5%, 10%, 15% and 20%, downloaded from the KEEL data repository [43], thus resulting in a total of 25 different datasets. Table 2 summarizes the characteristics of the datasets used in our experiments. The datasets such as iris, yeast, and wine, consist of multiple classes so we modified these datasets following suggestions in literature to make them into two-class datasets. Table 3 show the modifications that we have used in this paper to create the minority and majority classes.
Summary of characteristics of real-world datasets
Summary of characteristics of real-world datasets
Description of minority and majority classes in real-world imbalanced datasets
We have used four different classifiers –decision tree (DT) classifier with 50 numbers of splits, k-nn classifier parameterized with k = 3 and distance calculated using Euclidean distance formula, logistic regression (LR) classifier, and support vector machine (SVM) classifier with linear and Gaussian kernels. These classifiers are implemented using the Classification Learner Toolbox of MATLAB. We have used 5- fold cross-validation to train and test the model built by different classifiers. We mainly focus on the evaluation metrics such as sensitivity and specificity to study the recognition of the minority class and also to put a check on the recognition ability of a classifier for the majority class.
Results and discussion
In this research study, we have proposed a wCM hybrid pre-processing algorithm. To assure the performance of the proposed algorithm, we have conducted a series of experiments to evaluate and compare the proposed algorithm behavior with the other well-known pre-processing algorithms. Although we have calculated sensitivity, specificity, precision, recall, and accuracy values for accessing the classifiers, but in this paper, we have shown only sensitivity and specificity values due to space limit. The situation worsens when with noise, the imbalance ratio is high and the decision boundary is non-linear (as in the clover dataset). One can notice that in Table 3 for the clover dataset, the sensitivity values for the minority class are less for imbalance ratio 1 : 7 than for 1 : 5 and the sensitivity values decrease on increasing the noise level. Also, for paw and subclus datasets, the sensitivity values for the OD column Table 4 are more than the clover dataset because the shape of the paw dataset with three elliptical sub-clusters and subclus dataset with rectangular boundaries is less complicated than the clover shape.
Synthetic datasets sensitivity measure values for Decision Tree (DT) classifier
Synthetic datasets sensitivity measure values for Decision Tree (DT) classifier
Tables 4 and 5 show the sensitivity and specificity measure values, respectively, for DT classifier on the original datasets (OD) and after applying our proposed algorithm and the existing pre-processing algorithms, such as SMENN (SMOTE-ENN), SMTK (SMOTE-Tomek Links), SPIDER, SM (SMOTE), BSM (Borderline SMOTE), ADASYN. Due to space limitations, we have not shown the results of the other classifiers.
Synthetic datasets specificity measure values for Decision Tree (DT) classifier
Synthetic datasets specificity measure values for Decision Tree (DT) classifier
In this sub-section, we compare the performance of the proposed algorithm with the state-of-art pre-processing algorithms such as –SMENN, SMTK, SPIDER, SM, BSM, and ADASYN. We have used sensitivity and specificity values for the performance comparison.
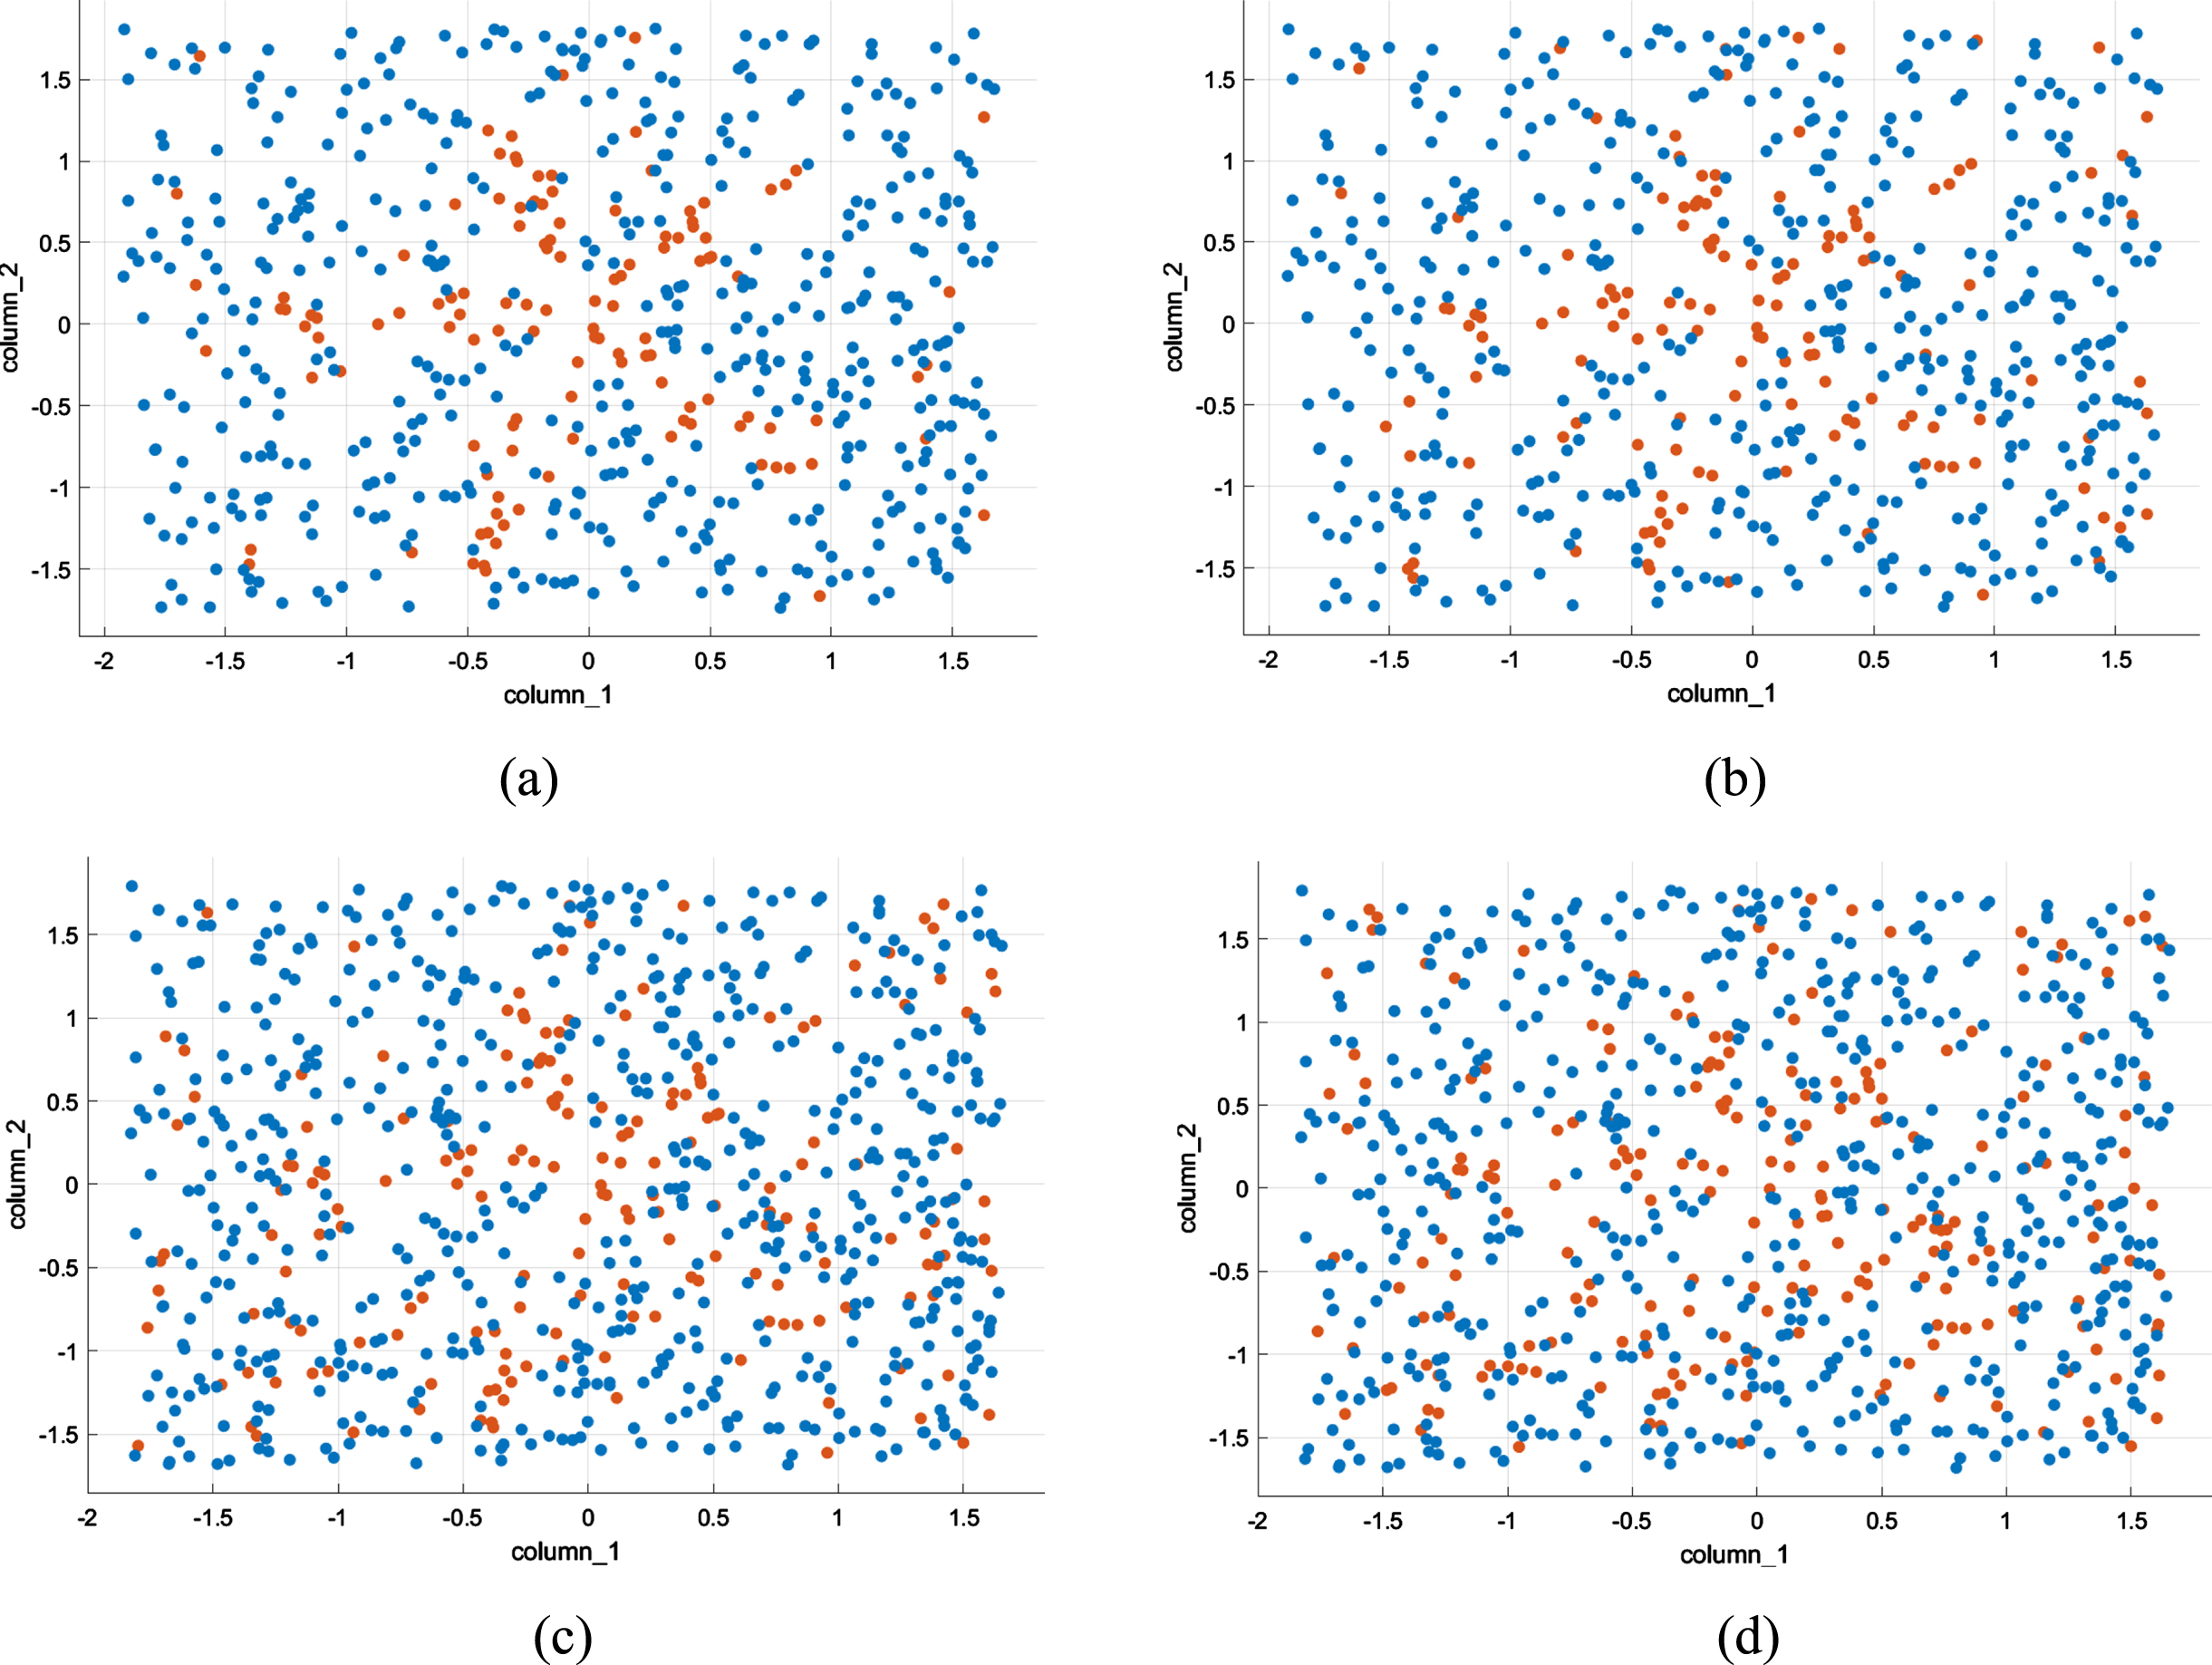
As observed in Table 4, the improvement in the sensitivity values for the minority class is highest for SPIDER in most of the cases. On the other hand, the SPIDER algorithm substantially decreases the specificity values (refer to Table 5) for all the datasets consisting of noise. Also, the same observation has been found for sensitivity and specificity values for SMENN, SMTK, SM, BSM, and ADASYN. However, on applying our proposed wCM hybrid pre-processing algorithm, the sensitivity values (refer to Table 4) are improved for all the datasets with different noise levels. The proposed algorithm have alsoshown the improved values for specificity (refer to Table 5) compared to the other pre-processing algorithms. In order to understand better the process of regeneration of minority class instances and removal of noise and other difficult points from the clover dataset, we have presented the figures (refer to Fig. 4 (a) –(g)) after applying various pre-processing algorithms. We have only presented the results for the clover dataset with size = 800 and noise = 30 %, due to space limitation. Here, the red dots represent the minority class and the blue dots represent the majority class. Figure 4(a) shows the result of pre-processing by the proposed algorithm. The proposed algorithm works well on the noisy imbalanced datasets. It effectively regenerates the minority class instances and under-samples majority class instances without much affecting the class boundaries. However, the other pre-processing algorithms are not able to identify the noise correctly, thus leading to regenerate even the noisy points of the minority class, which in turn distorted the original clover shape of minority class data points (refer to Fig. 4 (b) –(g)). For challenging datasets (i.e., with high imbalance ratio, small dataset size, small disjuncts, high noise level, non-linear boundaries and high number of borderline examples), k-nn, SVM with Gaussian kernel and DT, give good results. SVM with Linear kernel and Logistic regression classifiers failed to generalize well for these datasets due to non-linear boundaries and difficult shapes.
(a) clover shape with 10% noise; (b) clover shape, with 20% noise; (c) clover shape with 30% noise; (d) clover shape with 40% noise.
Clover dataset with imbalance ratio = 1 : 7, dataset size = 800, noise = 30% after applying: (a) proposed algorithm; (b) SMENN; (c) ADASYN; (d) BSM; (e) SPIDER; (f) SM; (g) SMTK.
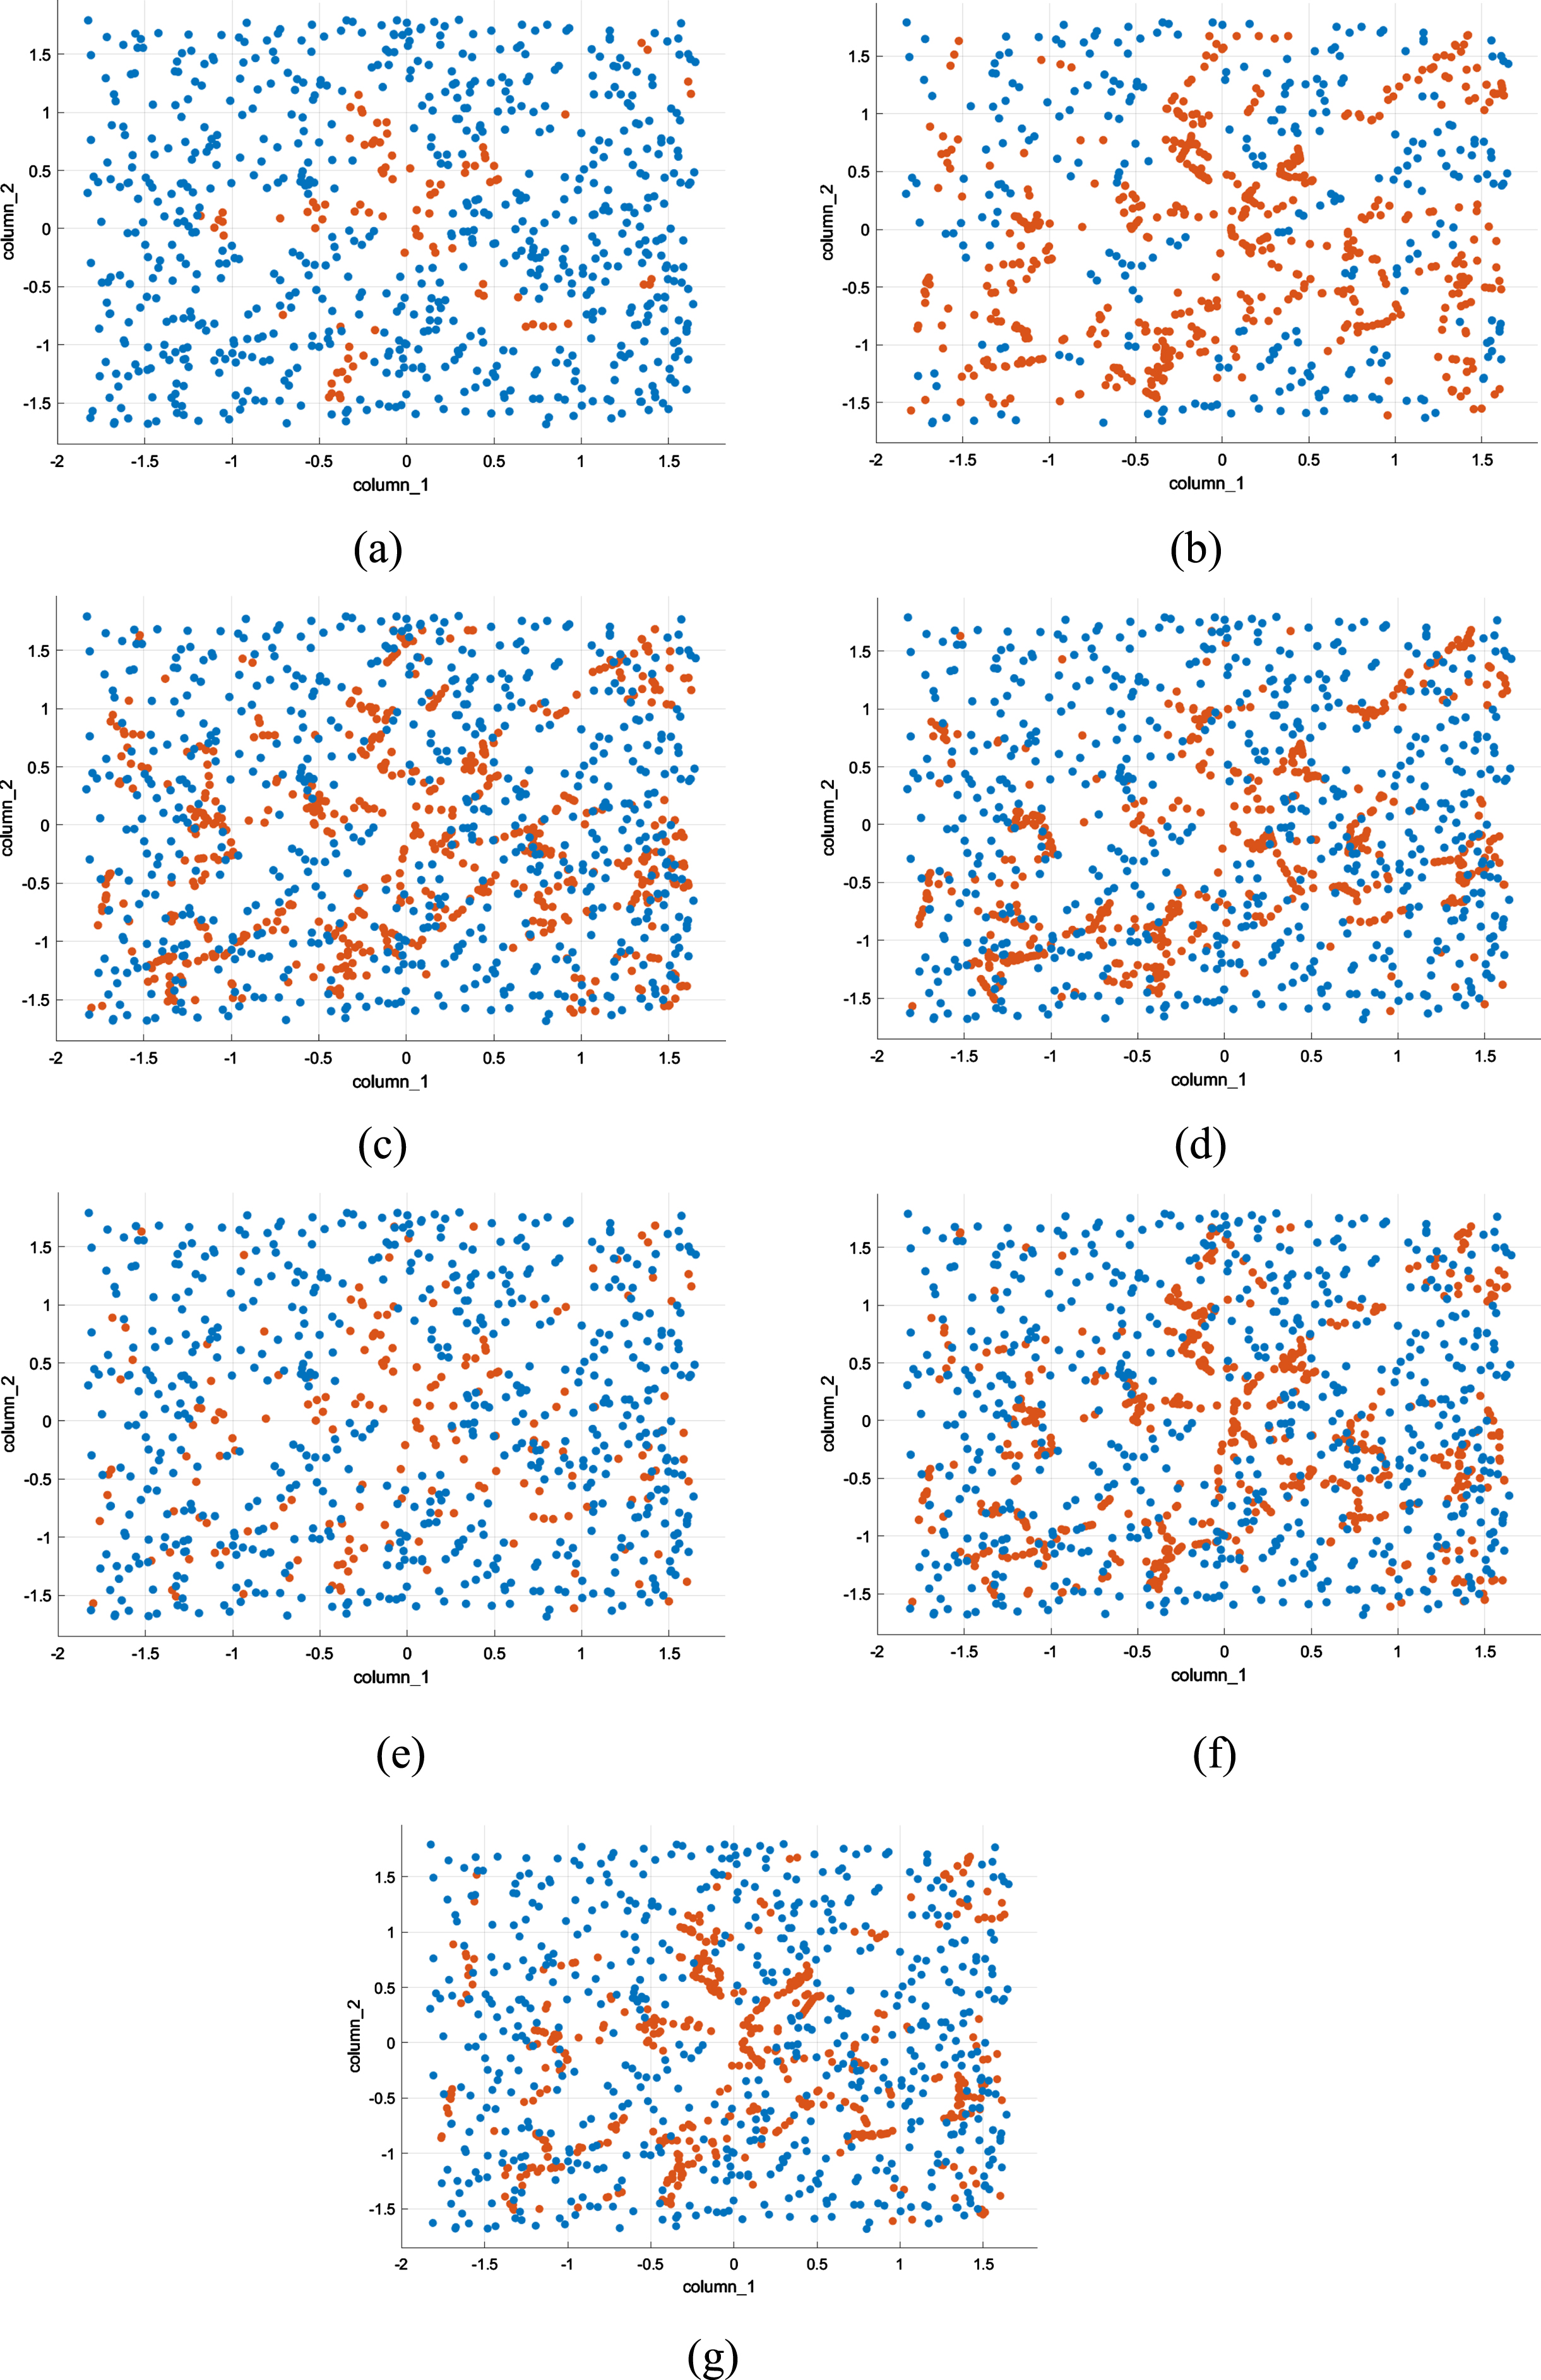
To compare the data-generation and class-label noise treatment by the proposed algorithm, we provide the figures for the iris dataset with 20% class-label noise. Figure 5 (a) shows the original imbalanced dataset, where x-marks, circle, and square shapes represent the noise, majority data points, and minority data points, respectively. Figure 5. (b) –(h) shows the post- proposed algorithm data distribution, post-SMENN, post-SMTK, post-SM, post- BSM, post- ADASYN and post-SPIDER data distribution, where the circle and square shapes represent the majority and minority data points, respectively. One can observe from Fig. 5 that SM, BSM, ADASYN, and SMTK cannot handle class label noise. Although from Fig. 5 it is evident that SMENN, SPIDER and Proposed algorithm handles the noise, but the SMENN does more in-depth cleaning, therefore removes a large number of instances from majority class resulting in the shifting of boundaries of the dataset in favor of minority class. Also, the SPIDER algorithm removes more instances of majority class and cannot handle the class-label noise instances located deep inside the other class region. Our proposed algorithm is good at handling the class-label noise along with regenerating the minority class points and deleting the majority class points without much affecting the actual class boundaries. Also, it can be seen in Tables 6 and 7 that the evaluation measures such as specificity and sensitivity values are highest mostly for SMENN, SPIDER and our proposed algorithm. However, SMENN and SPIDER are not good at handling noise. In Tables 6 and 7, for the sonar dataset with noise levels: 0%, 5%, 10%, the ADASYN algorithm is not able to do the undersampling since the imbalance ratio between minority and majority classes is not high. Therefore the corresponding cell values are shown with “no us” i.e. no undersampling.
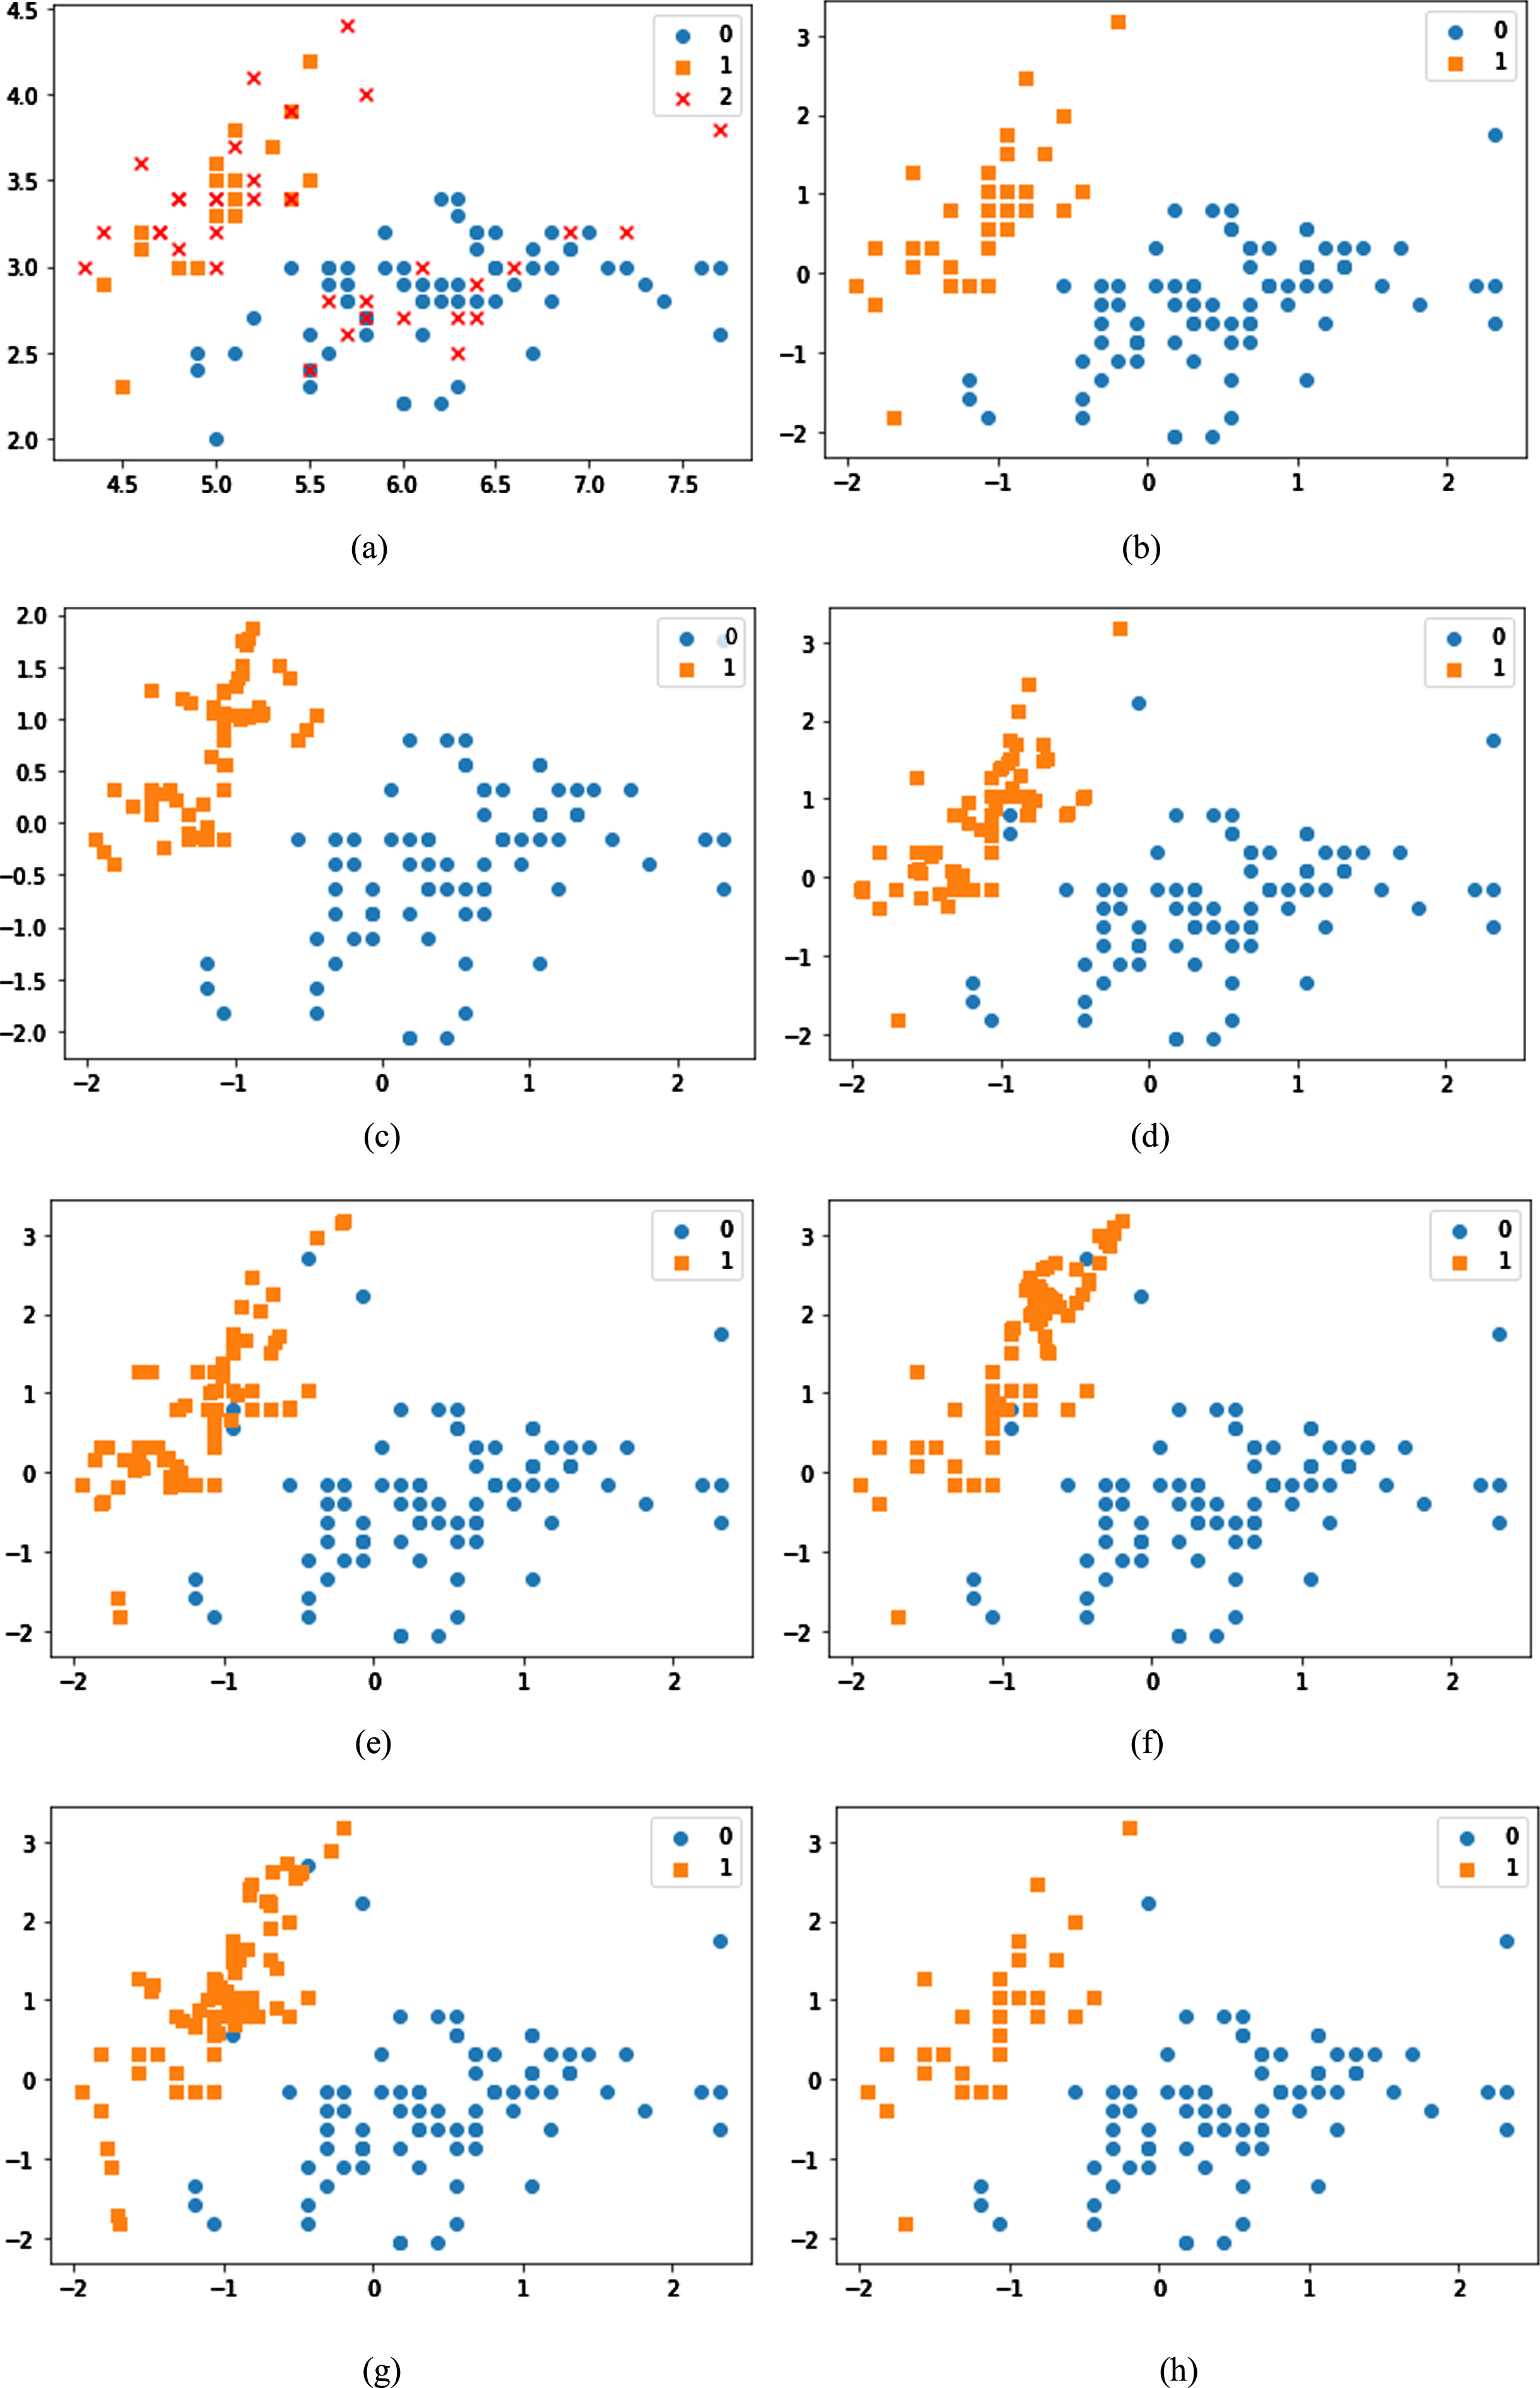
Iris dataset a) with 20% noise; and after applying b) proposed algorithm; c) SMENN; d) SMTK; e) SM; f) BSM; g) ADASYN; h) SPIDER.
Real-world dataset specificity measure values for the performance comparison
Real-world datasets sensitivity values for the performance comparison
In this paper, we consider the problem of learning the classification model from an imbalanced data set. We have used the challenging imbalanced synthetic datasets and real-world datasets, with noise. The following are the observations made through the experimental analysis:
The traditional classifiers are able to generalize well for the minority class if the imbalanced dataset does not suffer from the other intrinsic problems such as noise, small disjuncts, non-linear boundaries, small dataset size and overlapping classes. For the imbalanced datasets, the sensitivity value for the minority class decreases sharply on increasing the noise, borderline examples and small disjuncts. Learning for the minority class in the imbalanced datasets with non-linear boundaries is more difficult as compared to the learning from imbalanced datasets with the linear boundaries. The learning task for the minority class becomes worse when the imbalanced dataset with non-linear boundaries suffer from noise. So summarizing our findings based on the experiments conducted, we can say that the proposed algorithm works well for the dataset suffering from class imbalance ratio, non-linear decision boundaries, borderline examples, small disjuncts, and class label noise. It improves the performance of the minority class and improves the performance of the majority class, without affecting the original class boundaries. The images of the dataset after applying the proposed algorithm also confirm that it intelligently treats the noisy and borderline data points and re-balances the division of data points from minority and majority class in the dataset.
Conclusion and future scope
In this paper, we considered the problem of learning from an imbalanced dataset suffering from other intrinsic factors such as class imbalance ratio, non-linear decision boundaries, borderline examples, small disjuncts, and noise. In this paper, we carried out an experimental study to show the usefulness of our proposed algorithm based on the wCM metric. A wide range of experiments on synthetic datasets and real-world datasets are conducted. These experiments show that the proposed algorithm can handle the class label noise along with the imbalance ratio, non-linear decision boundaries, borderline points, and small disjuncts, occurring altogether in a dataset. We hope that the proposed algorithm could give the researchers more insights to understand better the conditions for applying a particular pre-processing algorithm to enhance the classifier performance on challenging datasets. This algorithm can further be improved to work effectively for the multi-class classification problem. Moreover, we will propose a framework based on data complexity to handle the class imbalance problem and other dataset intrinsic factors.