
Abstract
Uncertain time series analysis has been developed for studying the imprecise observations. In this paper, we propose a nonlinear model called uncertain max-autoregressive (UMAR) model. The unknown parameters in model are estimated by the least squares estimation. Then the residual analysis is presented. In many cases, there are some outliers in the time series due to short-term change in the underlying process. The UMAR model offers an alternative for detecting outliers in the imprecise observations. Based on the previous theoretical results, the UMAR model is used to forecast the future. Finally, an example suggests that the new proposed time series model works well compared to the uncertain autoregressive (UAR) model.
Keywords
Introduction
Real decisions are usually made in the uncertain state (e.g., war, flood, and even rumor), which makes raw data unavailable. In this case, there is no way to estimate probability distribution. Nevertheless, we can invite some experts in the field to assess belief degree of each event. Belief degree means that you believe the possibility of the event. For example, we can obtain some imprecisely observed values by estimating the methane emissions. In order to deal with belief degree, Liu [7] established uncertainty theory in 2007. Based on uncertainty theory, the study of uncertain statistics began with Liu [8] in 2010 for estimating uncertainty distribution. Uncertain statistics contains two important tools in describing the imprecise observations: uncertain regression analysis and uncertain time series analysis.
Uncertain regression analysis is a statistical analysis method to determine the quantitative relationship between explanatory variables and response variables. The problem of parameter estimation is especially important in practice. There are many excellent methods such as least squares estimation ([19]), least absolute deviations estimation ([11]), Tukey’s biweight estimation ([1]), and maximum likelihood estimation ([6]). Moreover, Lio and Liu [5] gave a method for estimating the expected value and variance of uncertain disturbance term. Later on, Liu and Jia [9] applied cross validation to obtaining a reliable model.
Conventional time series analysis has attractive properties, but fails to deal with the imprecise observations. Uncertain time series analysis gets around that difficulty by describing imprecisely observed values with uncertain variables. Yang and Liu [16] have offered an elegant framework. An analytical result of the UAR model can be found in Zhao et al. [23]. Other methods of estimation include least absolute deviations estimation ([18]), Huber estimation ([12]), Lasso procedure ([22]), ridge estimation ([3]), and maximum likelihood estimation ([2]). In addition, Liu and Yang [10] used cross validation to determine the order of the UAR model. Practically, Ye and Yang [20] used the UAR model to analyze the cumulative confirmed cases of COVID-19 in China. Actual time series frequently contains outliers, for example, extremal events occur at certain time. In the framework of probability theory, the max-autoregressive model was explored by Davis and Resnick [4], and has been applied to the analysis of time series with outliers. Similarly, we fit the UMAR model to the imprecise observations with outliers. In many applications, other uncertain time series models are proposed, such as uncertain moving average model ([17]), uncertain vector autoregressive model ([14]), and uncertain threshold autoregressive model ([15]).
The remainder of the paper is structured as follows. Section 2 presents some foundational issues, such as the definition of the UMAR model. Section 3 provides the details of parameter estimation for the UMAR model. Residual analysis is shown in Section 4. Section 5 detects outliers via the residual analysis. Section 6 discuss the forecasting based on the UMAR model. In Section 7, the UMAR model is fit to China’s methane emissions data. Section 8 offers some concluding remarks.
Uncertain max-autoregressive model
In order to obtain a feel for the sample paths of the max-autoregressive model, Davis and Resnick [4] simulated a large number of observations. The result showed that the max-autoregressive graph is slightly smoother than the autoregressive graph. Accordingly, this section gives a brief description of the UMAR model. A formulation of the k-order UMAR model is given by
The UMAR model exists simpler analytical structure than the UAR model [16], because the predicted value is only related to the maximum value in previous periods.
Given a set of imprecisely observed values X1, X2, ⋯, X
n
, then we obtain the estimate of a0, a1, ⋯, a
k
in model (1) by utilizing the least squares estimation in Yang and Liu [16],
Showing the optimal solution of (2) with
Top grid treatment in order to choose an appropriate order k, we utilize the fixed origin cross validation presented by Liu and Yang [10],
Top grid treatment according to Liu and Yang [10], ATE
T
(k) can be calculated by the following formula,
In this section, we focus on the estimation of the expected value and variance of disturbance term. Let X1, X2, ⋯, X
n
be imprecisely observed values. According to Yang and Liu [16],
For model (1), εk+1, εk+2, ⋯, ε
n
are assumed to be iid uncertain variables. Then the expected value of disturbance term can be estimated by the average of the expected values of residuals, i.e.,
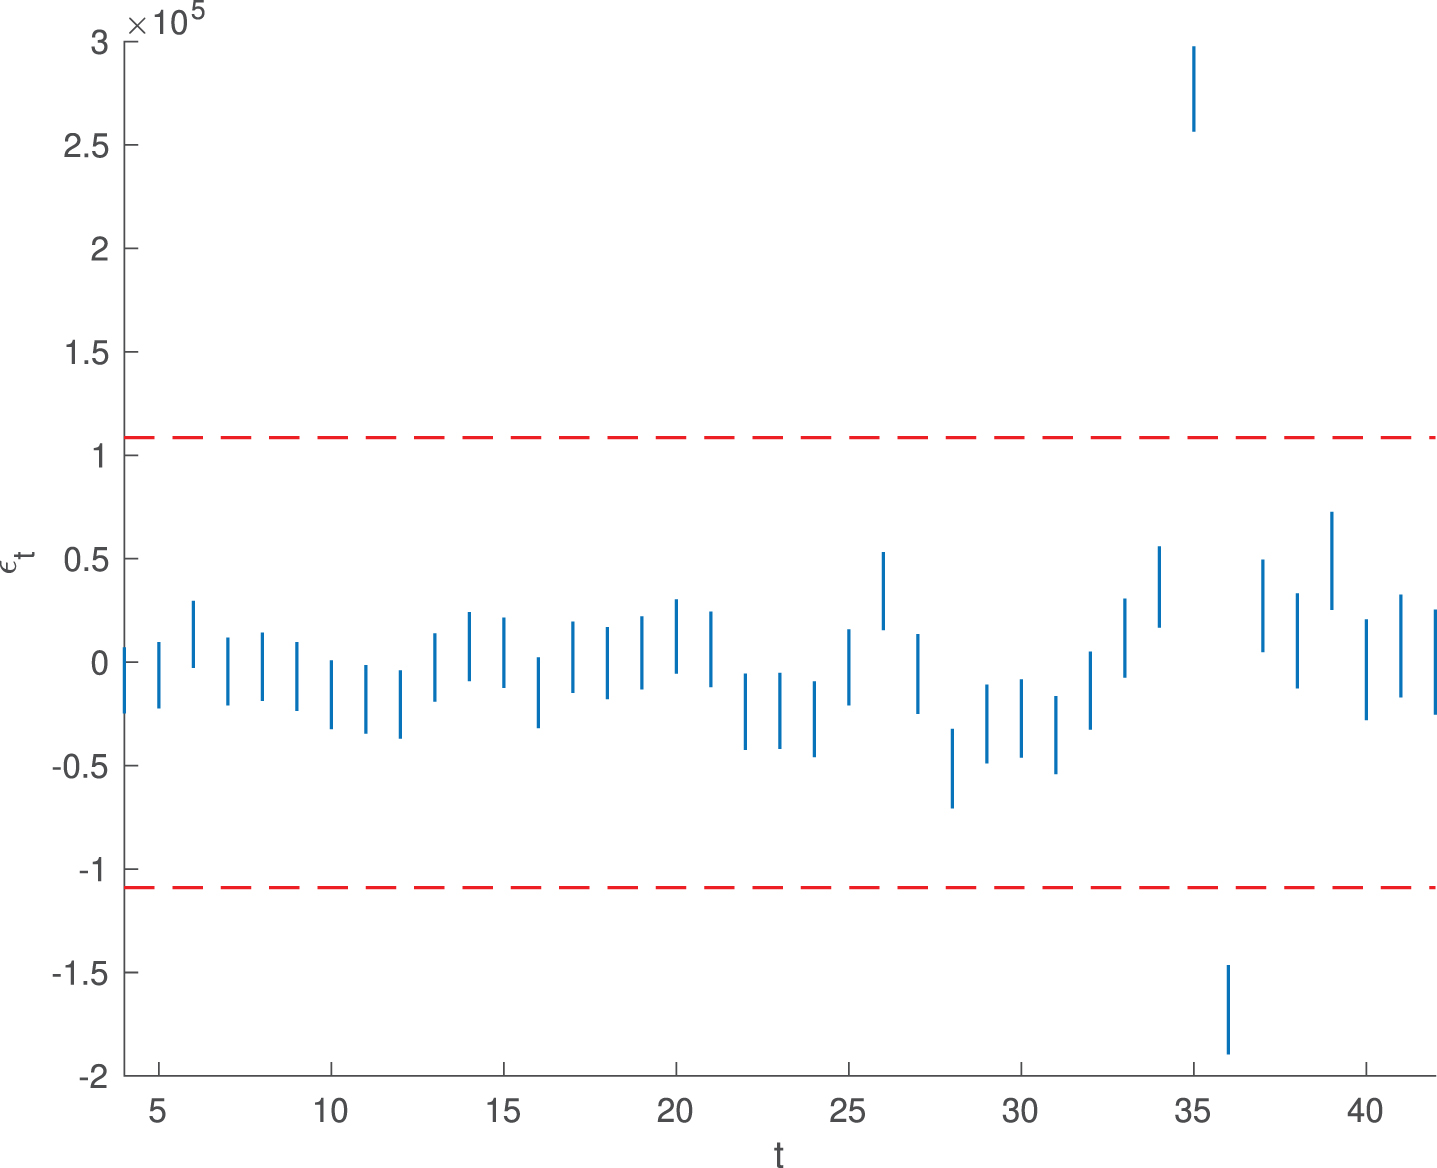
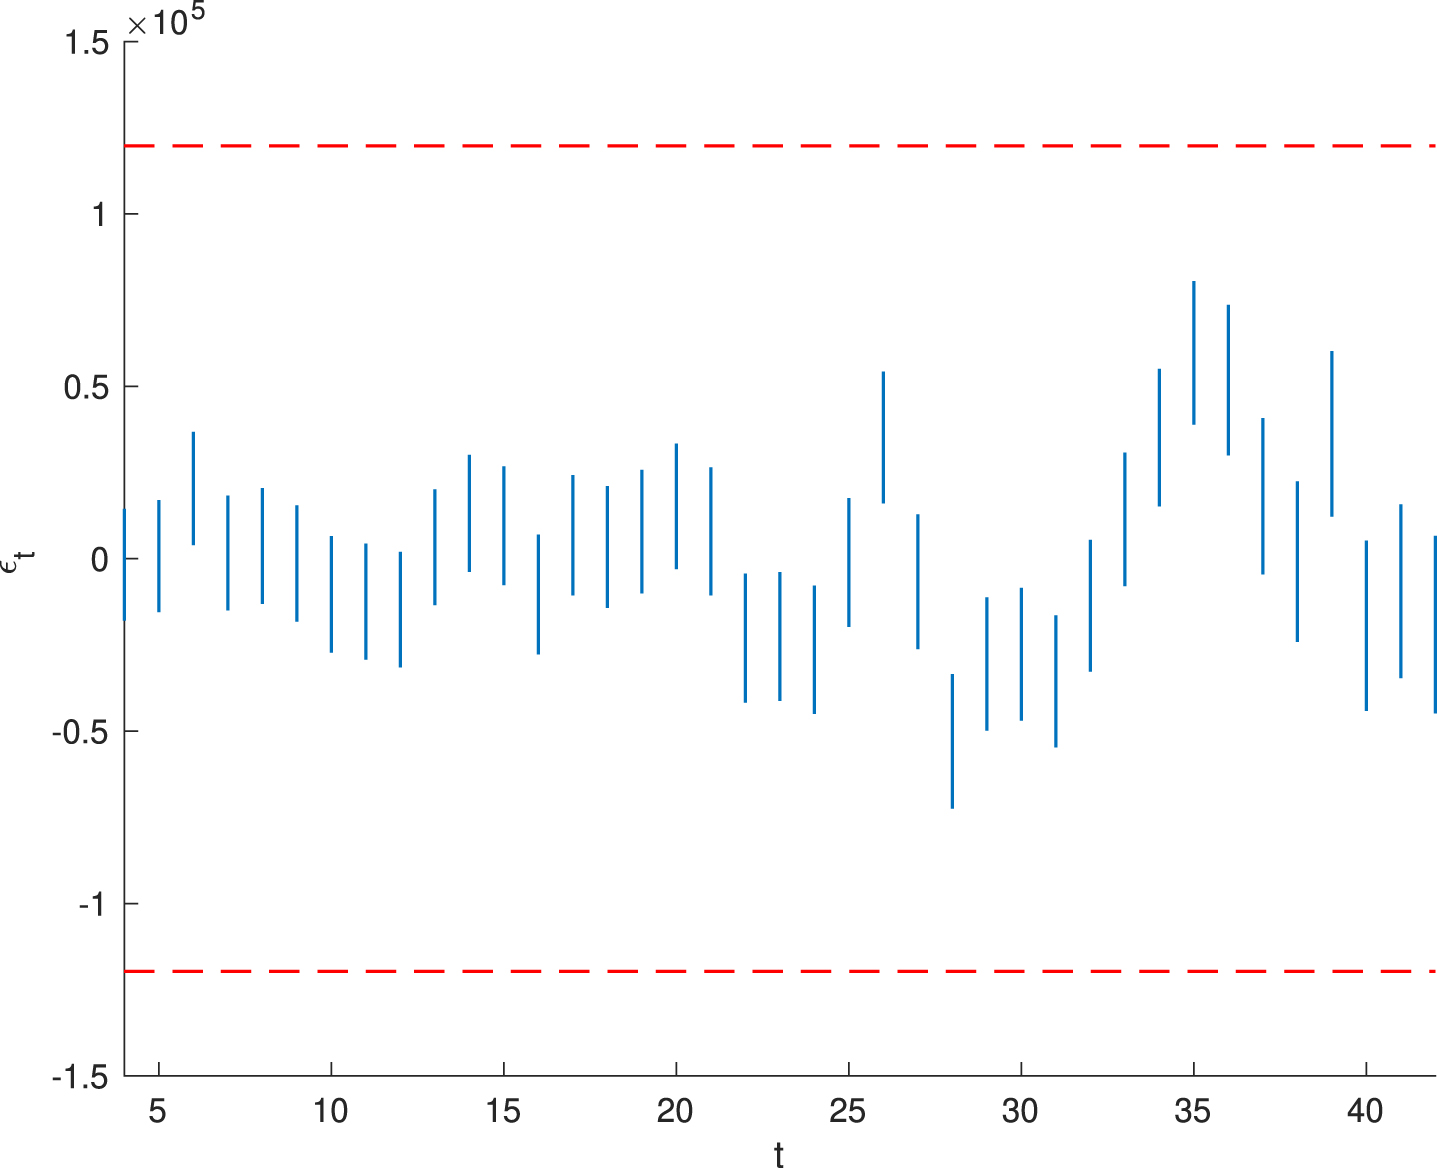
Outlier detection
The term outlier refers to an observation which in some sense is inconsistent with the rest of the observations in the data set [13]. Outliers are produced in the process of observation or experiment due to unexpected events, which disturb the original statistical laws. They can be detected by the residuals. In Section 4, we obtain the residuals
According to Ye and Liu [21], we present the following outlier-detection procedure. Take a significance level α, (e.g., 0.05). If
In some situations, the forecast is heavily influenced by outliers. Thus these outliers should be revised. If the observation X
i
is an outlier, then one may try a transformation of data, such as
Forecast value and confidence interval
This section presents a confidence interval to predict the value at the next time point. Based on Sections 3 and 4, we define a forecast uncertain variable
Real data application
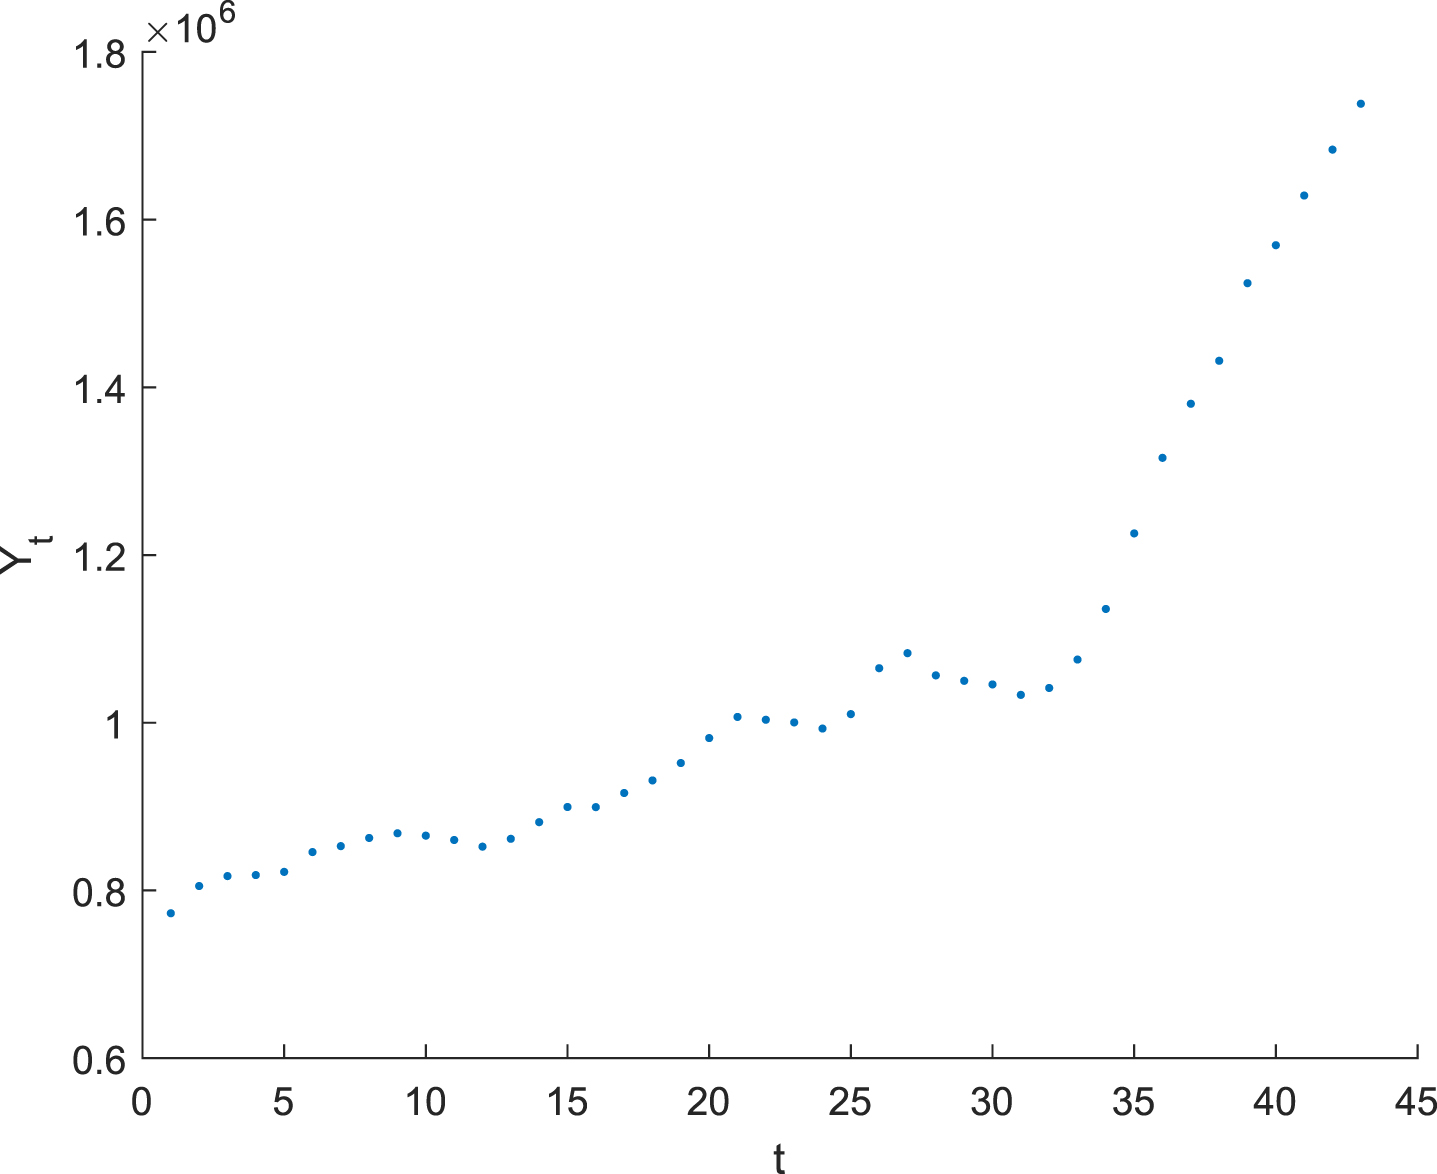
In this section, we use China’s methane emissions data (unit: thousand tons of carbondioxide equivalence) to demonstrate the application of the UMAR model. The original set of data, denoted by y1, y2, ⋯, y42, can be shown in Table 1 and Fig. 1. In fact, methane emissions cannot be imprecisely observed. Hence, it is better to describe methane emissions with imprecisely observed values. Next, we suggest transformations on y1, y2, ⋯, y42, and obtain the imprecisely observed values X1, X2, ⋯, X42 described by independent linear uncertain variables with regular uncertainty distributions Φ1 (x) , Φ2 (x) , ⋯ , Φ42 (x), respectively, as shown in Table 2 and Fig. 2, t = 1, 2, ⋯ , 42. Notice, X35 (2004) is set to an outlier.
Raw precise observations
Raw precise observations
Source: World Bank Website.
Raw imprecise observations
Raw precise observations.
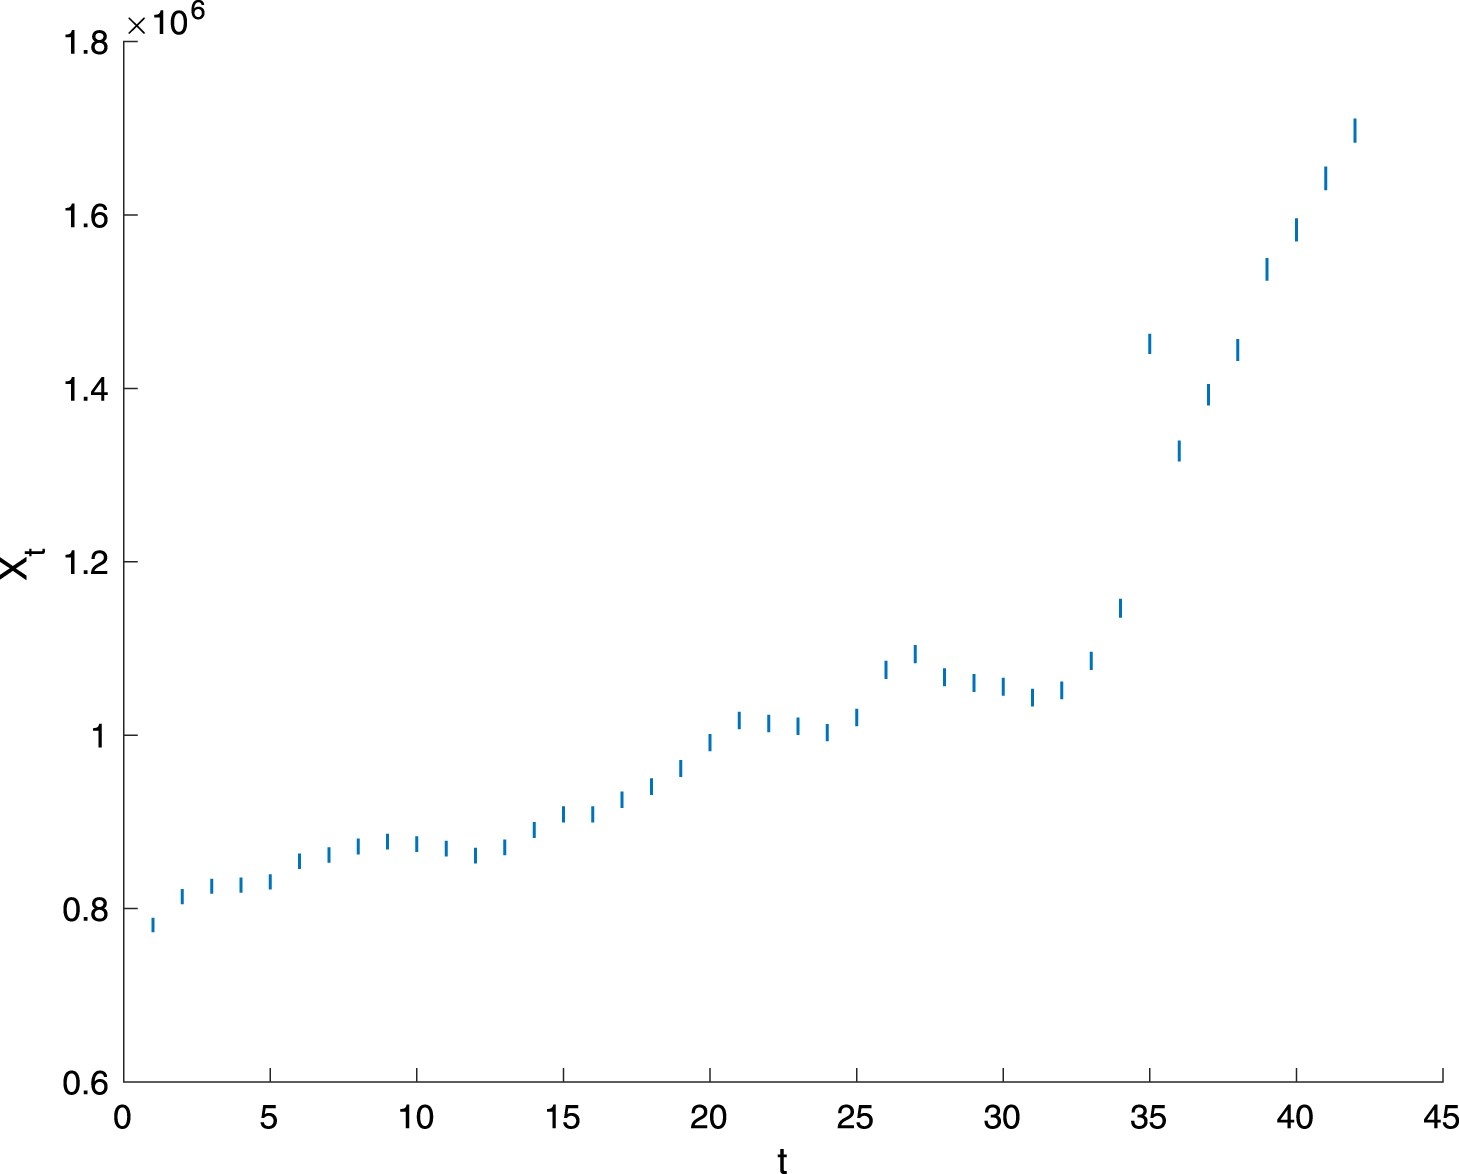
Raw imprecise observations.
Considering the data of size n = 42, we choose T = 30 as the training set size. Based on Theorem 3 and the outlier-detection procedure in Section 5, the values of ATE30 (2), ATE30 (3) and ATE30 (4) are calculated and listed in Table 3. The result is to choose k = 3, and the fitted UMAR model is
Average testing errors for cross validation
Denoting the inverse uncertainty distribution of
Fig. 3 displays a time series plot of Φ-1 (0.95) and Φ-1 (0.05), denoted by parallel red medium dashed lines,
The relationships between
The relationships between
Similarly, using the UAR model to fit the raw imprecisely observed values X1, X2, ⋯ , X42, we can obtain a forecast uncertain variable
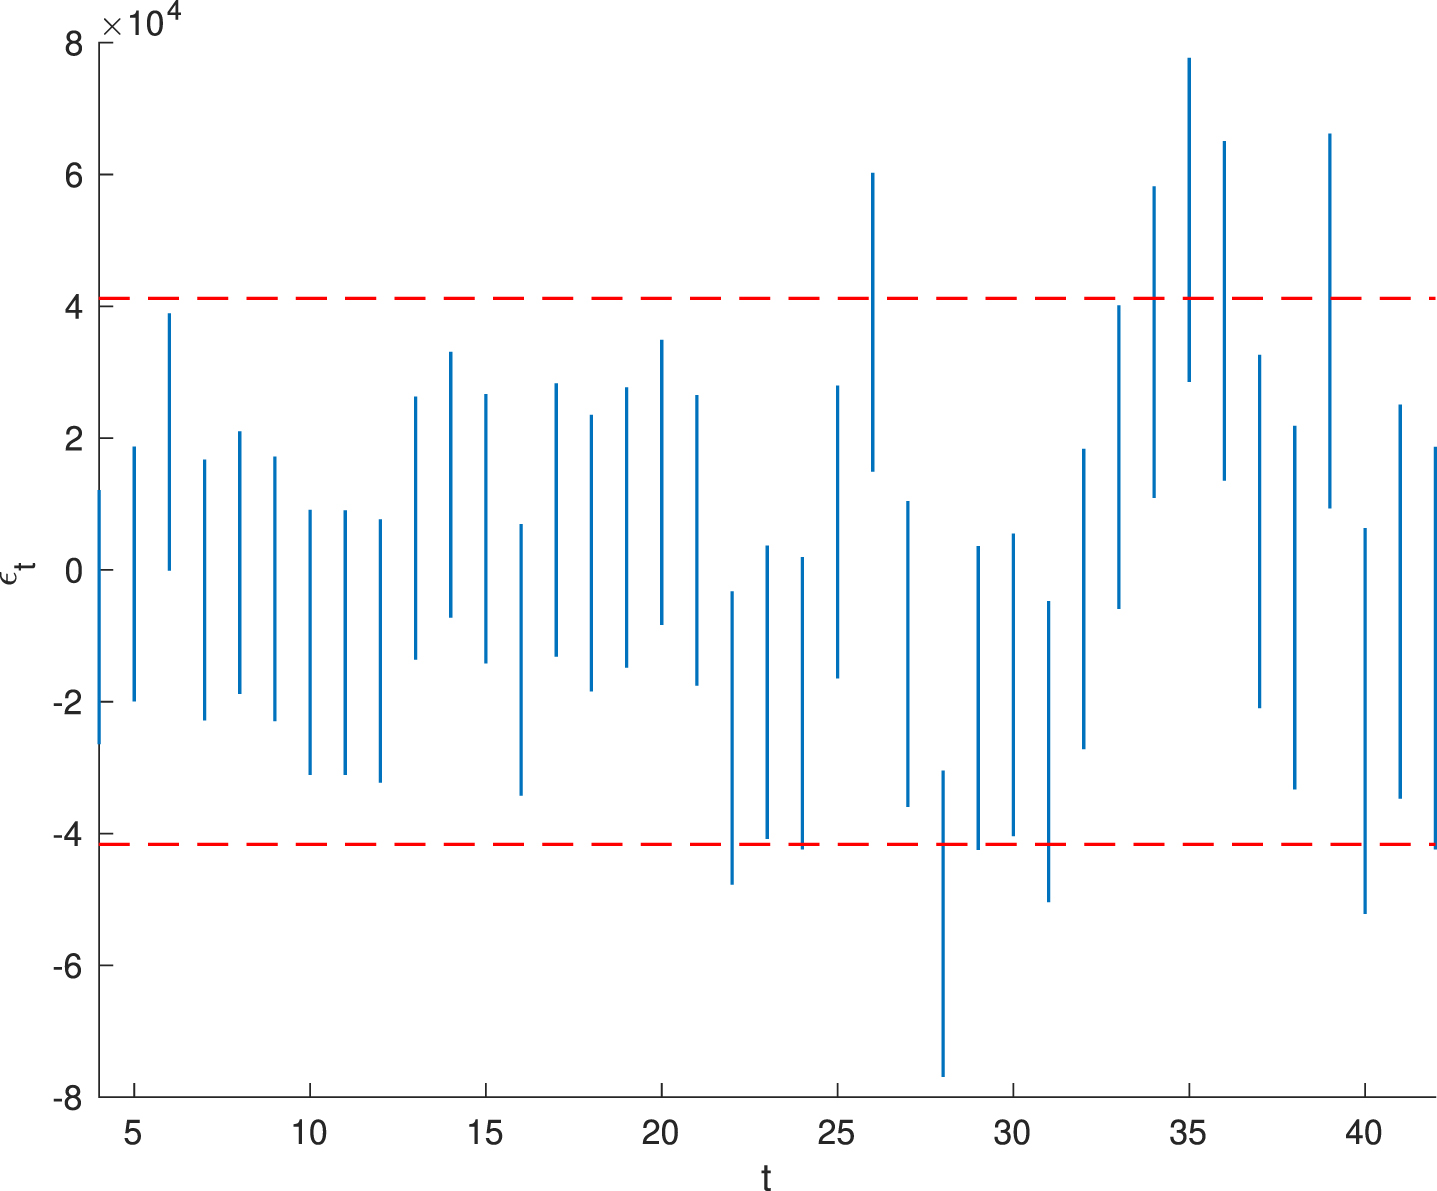
The relationships between
This paper mainly gave a description of the UMAR model. Based on the principle of least squares, we obtained the estimates of unknown parameters in the UMAR model. The expected value and variance of disturbance term are estimated by the residuals. Furthermore, the residuals are used to discover outliers. The developed methods allowed us to consider the prediction problem as well. The application of the UMAR model was presented in an example. As for future research, more nonlinear uncertain time series models can be considered.
Footnotes
Acknowledgments
This work was supported by the National Natural Science Foundation of China (No. 61873329).