
Abstract
The silicon dioxide is the hardest part to melt among the iron tailing components, the melting behavior of iron tailing can be represented by the melting behavior of silicon dioxide. Estimating the real-time melting rate of silicon dioxide in the time sequence provide guidance for the tailing addition and heat compensation in the process of slag cotton preparation, also indirectly improved the direct fiber forming technology of blast furnace slag. The position of silicon dioxide particles in the high-temperature molten pool during the melting process is changing constantly, using a strong weighted distance centroid algorithm to rack the centroid position of silicon dioxide particles during the melting process, and present the motion trail of centroid of silicon dioxide. In the paper, extracting indexes which represent the edge outline characteristics of silicon dioxide during the melting process of silicon dioxide using Snake active contour algorithm combined with Sobel operator, include shape, perimeter and area. Using the extracted skeleton characteristics, a three-dimensional skeleton generation model is created. From the skeleton data, estimating the volume of silicon dioxide and determine the parameter formula for the actual melting rate of silicon dioxide. The silicon dioxide melting rate at each moment is calculated by numerical simulation. The results of the Hough test circle and the silicon dioxide melting rate are verified. The rationality of the model is further determined.
Introduction
Iron tailings are the waste after beneficiation and the main component of industrial solid waste. It belongs to one of the largest industrial solid wastes [1–3]. As of 2019, China has accumulated more than 60 billion tons of tailings[4–7], and is expected to generate an additional 1.6 billion tons per year, and the overall utilization rate is less than 20%.
The direct fiber forming process of the quenched and tempered blast furnace slag is used to prepare high value-added thermal insulation materials, which can not only efficiently utilize the sensible heat of the slag that is not currently used [8], but also greatly increase the added value of blast furnace slag utilization.
The main component of iron tailings is silicon dioxide, while the silicon dioxide is the hardest part to melt among the iron tailing components. Therefore, the melting behavior of iron tailing can be represented by the melting behavior of silicon dioxide. However, the temperature of high-temperature molten tank is over 1500°C, in which the service life of routine detection equipment under the environment is very short. To solve the problem, relevant research group firstly adopted a kind of rifted CCD video shooting system with amplification effect for the first time at home and abroad. In the non-contact way, the group has obtained the dynamic visual data of silicon dioxide in the high-temperature molten pool (114 sequence images under time sequence), and has observed the real-time melting rate of silicon dioxide in the time sequence through video analysis, which provided guidance for the tailing addition and heat compensation in the process of slag cotton preparation, thus indirectly improved the direct fiber forming technology of blast furnace slag.
For solving the motion trajectory and edge feature detection in timing images, scholars at home and abroad have done related research. The background difference algorithm [9, 10] combined with the morphological open / close operation is used to estimate the center of mass of the target, and realized the extraction of the motion trajectory by superposition of the center of mass. M.D Cui [11] and M. Saadia [12] used the improved Mean-Shift algorithm to track the trajectory of the object and realize the reconstruction of the centroid trajectory. B. Ye and W.D. Ma [13] proposed a method based on variable operator for image edge complex target feature recognition. The median filtering method was used instead of Gaussian filtering to filter the image and perform iterative calculation. Y.D. Shi [14] proposed a development technology and image edge feature detection principle based on SOPC, and based on the completion of FPGA modular design, adopted Verilog HDL programming language to detect and extract edge features. A. Mithlesh [15] used First-order histogram, GLCM, LBP, Laws and DWT for texture feature extraction. These methods help to recognise the contour of the nucleus and cytoplasm. ANN and SVM are used to classify the single-cell images either normal or cancerous based on the trained features. N. Amita [16] proposed a new edge detection technique using Riemann-Liouville fractional differential operator, by theoretical and experimental results, it is observed that the proposed feature and contrast enhancement outperforms the existing methods under comparison. G.B. Zhang [17] proposed a new image edge feature extraction algorithm, that is, using the multi-scale characteristics inherent in wavelet transform, to suppress the noise of the detailed image at each scale of the wavelet transform using the method of cross-energy crossover and perform feature Identify.
To reveal the dissolution behavior of iron tailings in blast furnace slag, the main component silicon dioxide of iron tailings is adopted for research, researching the melting process of silicon dioxide particles at high temperature, so as to represent the melting of iron tailings. In this paper, the analysis of the time sequential images (114 images in total) of silicon dioxide are performed. The main work has been done by ourselves which is mentioned below:
1. Establish a mathematical model to track the centroid position of silicon dioxide particles during the melting process, and present the motion trail of centroid of silicon dioxide.
2. Establish indexes which represent the edge outline characteristics of silicon dioxide during the melting process of silicon dioxide (include shape, perimeter, area).
3. Estimate the actual melting rate of silicon dioxide based on edge outline characteristic indexes of silicon dioxide in the No. 2 question.
In the first question, the data is denoised and gray processing to remove the impurity information in the image. According to the Hough transform theory, the circles inside and outside the crucible are detected by combining the contour data of the image. Secondly, the histogram equalization processing and Wiener filtering to optimize the output entropy value are used to optimize the detailed information of the target image, and then the maximum inter-class variance segmentatiion weighted method is used to extract the area of interest in the image. Finally, a strong distance centroid algorithm is used to obtain the centroids of 114 images of silicon dioxide and visualize the motion trajectories of the centroids. Regarding the second question, set the continuity energy, curvature energy, gradient energy, gray energy, and constraint energy. The contour extraction of silicon dioxide is performed using Snake active contour algorithm combined with Sobel operator. Next, the shape of the silicon dioxide is extracted by using corrosion and swelling operations, and further set a four-domain search algorithm to determine the perimeter and area of the silicon dioxide. Then based on the grass burning model and the maximum ball model as the theoretical basis, the contour was further obtained with smooth boundaries, and the star skeleton was finally extracted. Finally, the functional relationship between the area of silicon dioxide and time through function fitting is determined, and the fitting effect was evaluated. Regarding the last question, a three-dimensional skeleton generation model is created base on the extracted skeleton characteristics. First, determine the skeleton width threshold and set the skeleton point judgment strategy. Then determine the skeleton growth algorithm, estimate the depth information, and extend the two-dimensional skeleton information to three dimensions. From the skeleton data, estimate the volume of silicon dioxide and determine the actual melting rate parameter formula, through numerical simulation to obtain the silicon dioxide melting rate at each moment. In order to verify the accuracy of the results, reduce the size of the particles to two dimensions, and give the functional relationship between the area change of silicon dioxide and time. The same rate verifies the rationality of the results. The error analysis of the model was performed. The results of the hough test circle and the silicon dioxide melting rate are verified. The rationality of the model is further determined. The advantages and disadvantages of the model are objectively evaluated. Finally, the model is generalized horizontally and vertically.
Assumptions
Assume that the active contour can find the minimum value of its energy function under the action of internal and external forces. Assume that the skeleton is not sensitive to boundary noise, and the generalized potential field generated by all boundary points in space has little effect on skeleton extraction. Assume that the image accuracy is high enough, using histogram equalization and Wiener filtering to optimize the entropy value of the target image, the image still retains a lot of valid data. Assume that the CCD camera will not make mistakes such as too long and too short exposure time during shooting. Assume that all the crystals are aggregated, the most suitable three-dimensional skeleton structure is satisfied, and the volume average is the most suitable three-dimensional skeleton structure.
Related work
Preprocessing the data is a necessary step before processing the image. the data is denoised and gray processing to remove the impurity information in the image. In this section, 114 images obtained by the CCD video acquisition system are gray processed and noise suppressed. Details are as follows.
Gray processing
A color image is composed of three different components. Therefore, when processing a color image, it is needed to process the three channels in sequence, which has a large time overhead and processing efficiency. Therefore, in order to achieve the purpose of improving the processing speed of the entire application system, it is necessary to reduce the amount of data to be processed.
An image gray processing is to change the color image of the data of the three channels of RGB into the grayscale image of the data of a single channel. In the above RGB model, if the values of R, G, and B are equal, even if it is three-channel data, it is also a kind of gray color in the performance, and the gray value is the value of R, G, and B. The gray range of each pixel position in the gray image is 0-255. It can be found that when R, G and B are equal, only one byte is needed to store the gray values.
Wavelet denoising
The basic idea of wavelet denoising [18] is that after the signal is wavelet transformed [19–21](using the Mallat algorithm), the wavelet coefficients generated by the signal contain important information of the signal. After wavelet decomposition of the signal, the wavelet coefficient is larger, the wavelet coefficient of the noise is smaller, and the noise of the wavelet coefficient must be smaller than the wavelet coefficient of the signal. By selecting an appropriate threshold, the wavelet coefficients larger than the threshold are considered to be generated by the signal and should be retained. Those smaller than the threshold are considered to be generated by noise. Set to zero to achieve the purpose of denoising.
A noisy model can be expressed as follows:
Among them, f (k) is the useful signal, s (k) is the signal with noise, e (k) is the noise, and ∈ is the standard deviation of the noise figure. Assume that e (k)is white Gaussian noise. Generally, the useful signal appears as a low-frequency part or some relatively stable signals, while the noise signal appears as a high-frequency signal. When performing a wavelet decomposition of the s (k) signal. At this time, the noise part is usually included in HL, LH, HH.
As shown in Fig. 1, as long as the corresponding wavelet coefficient processing is performed on HL, LH, HH, and then the signal is reconstructed, the purpose of noise reduction can be achieved. The results in following Fig. 2 are shown using the “0497.bmp”žimage as an example:
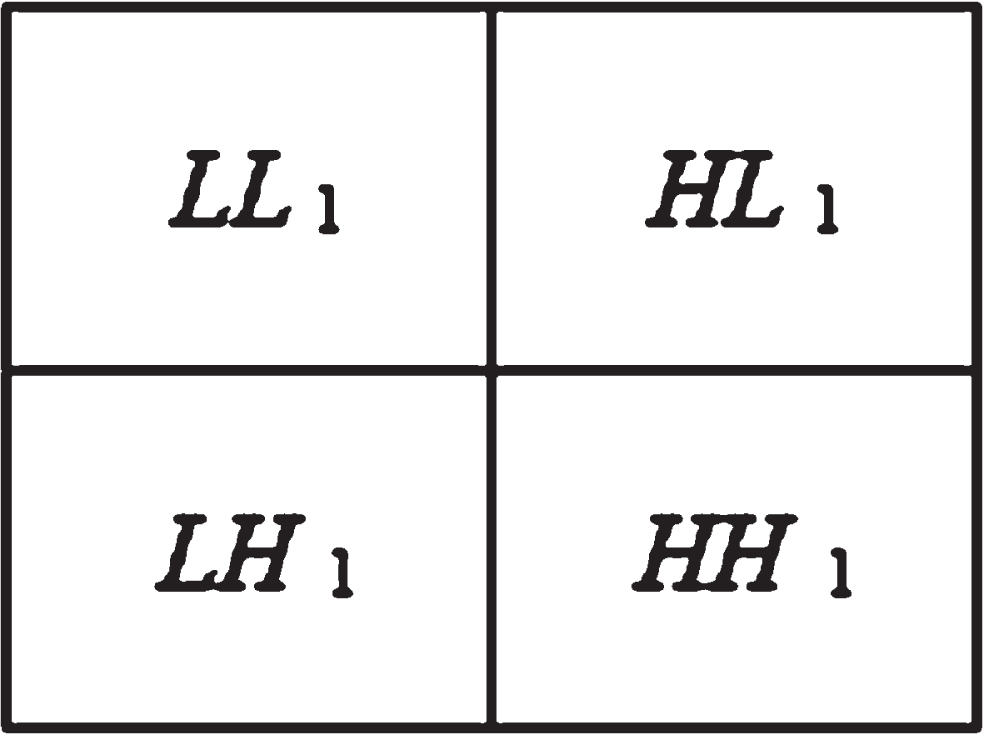
Wave let decomposition.
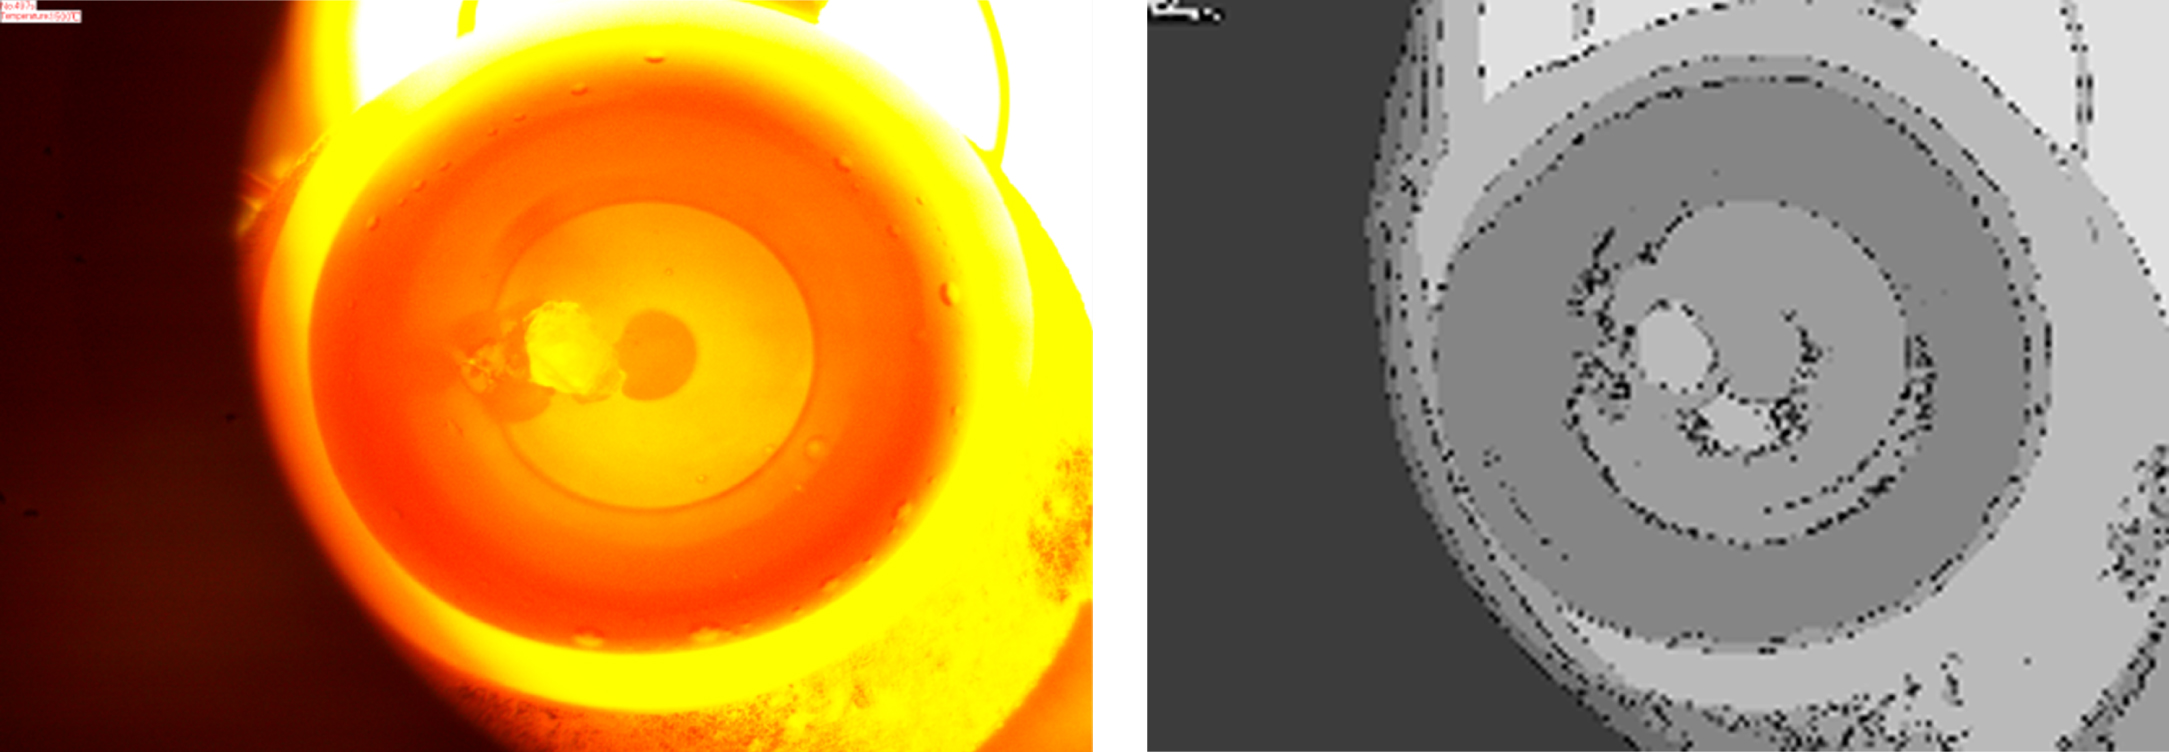
The original image and the image after data preprocessing.
In this section, in order to eliminate useless areas, circles in the area inside and outside the crucible are detected and only images within the crucible area are analyzed. Secondly, the areas of interest are extracted within the restricted areas.
Acquisition of Crucible Position Based on Hough Transform Circle Detection
In the field of image processing and computer vision, how to extract the required feature information from the current image is the key to image recognition. For many applications where a straight line or circle needs to be detected quickly and accurately, the Hough transform [22, 23] is a very effective method to solve the problem. For example, in this problem the Hough transform will be used to detect the image in the attachment to obtain the position of the crucible.
The Hough transform is a feature detection method widely used in image analysis, computer vision, and digital image processing. It identifies lines that are best at identifying features in objects, so in this paper automated analysis of digital images detects circles.
As shown in Fig. 3, two coordinate systems are set up in this paper, the left coordinate system represents the value of (x,y), and the right coordinate system represents the value of (m, b), which is the parameter value of the straight line. Then a (x,y) point on the right corresponds to a line, and a straight line in the left coordinate system is a point in the right coordinate system. In this way, the intersection point in the right-left system indicates that there are multiple points passing through the line defined by (m, b). However, this method has a problem that the value range of is too large.
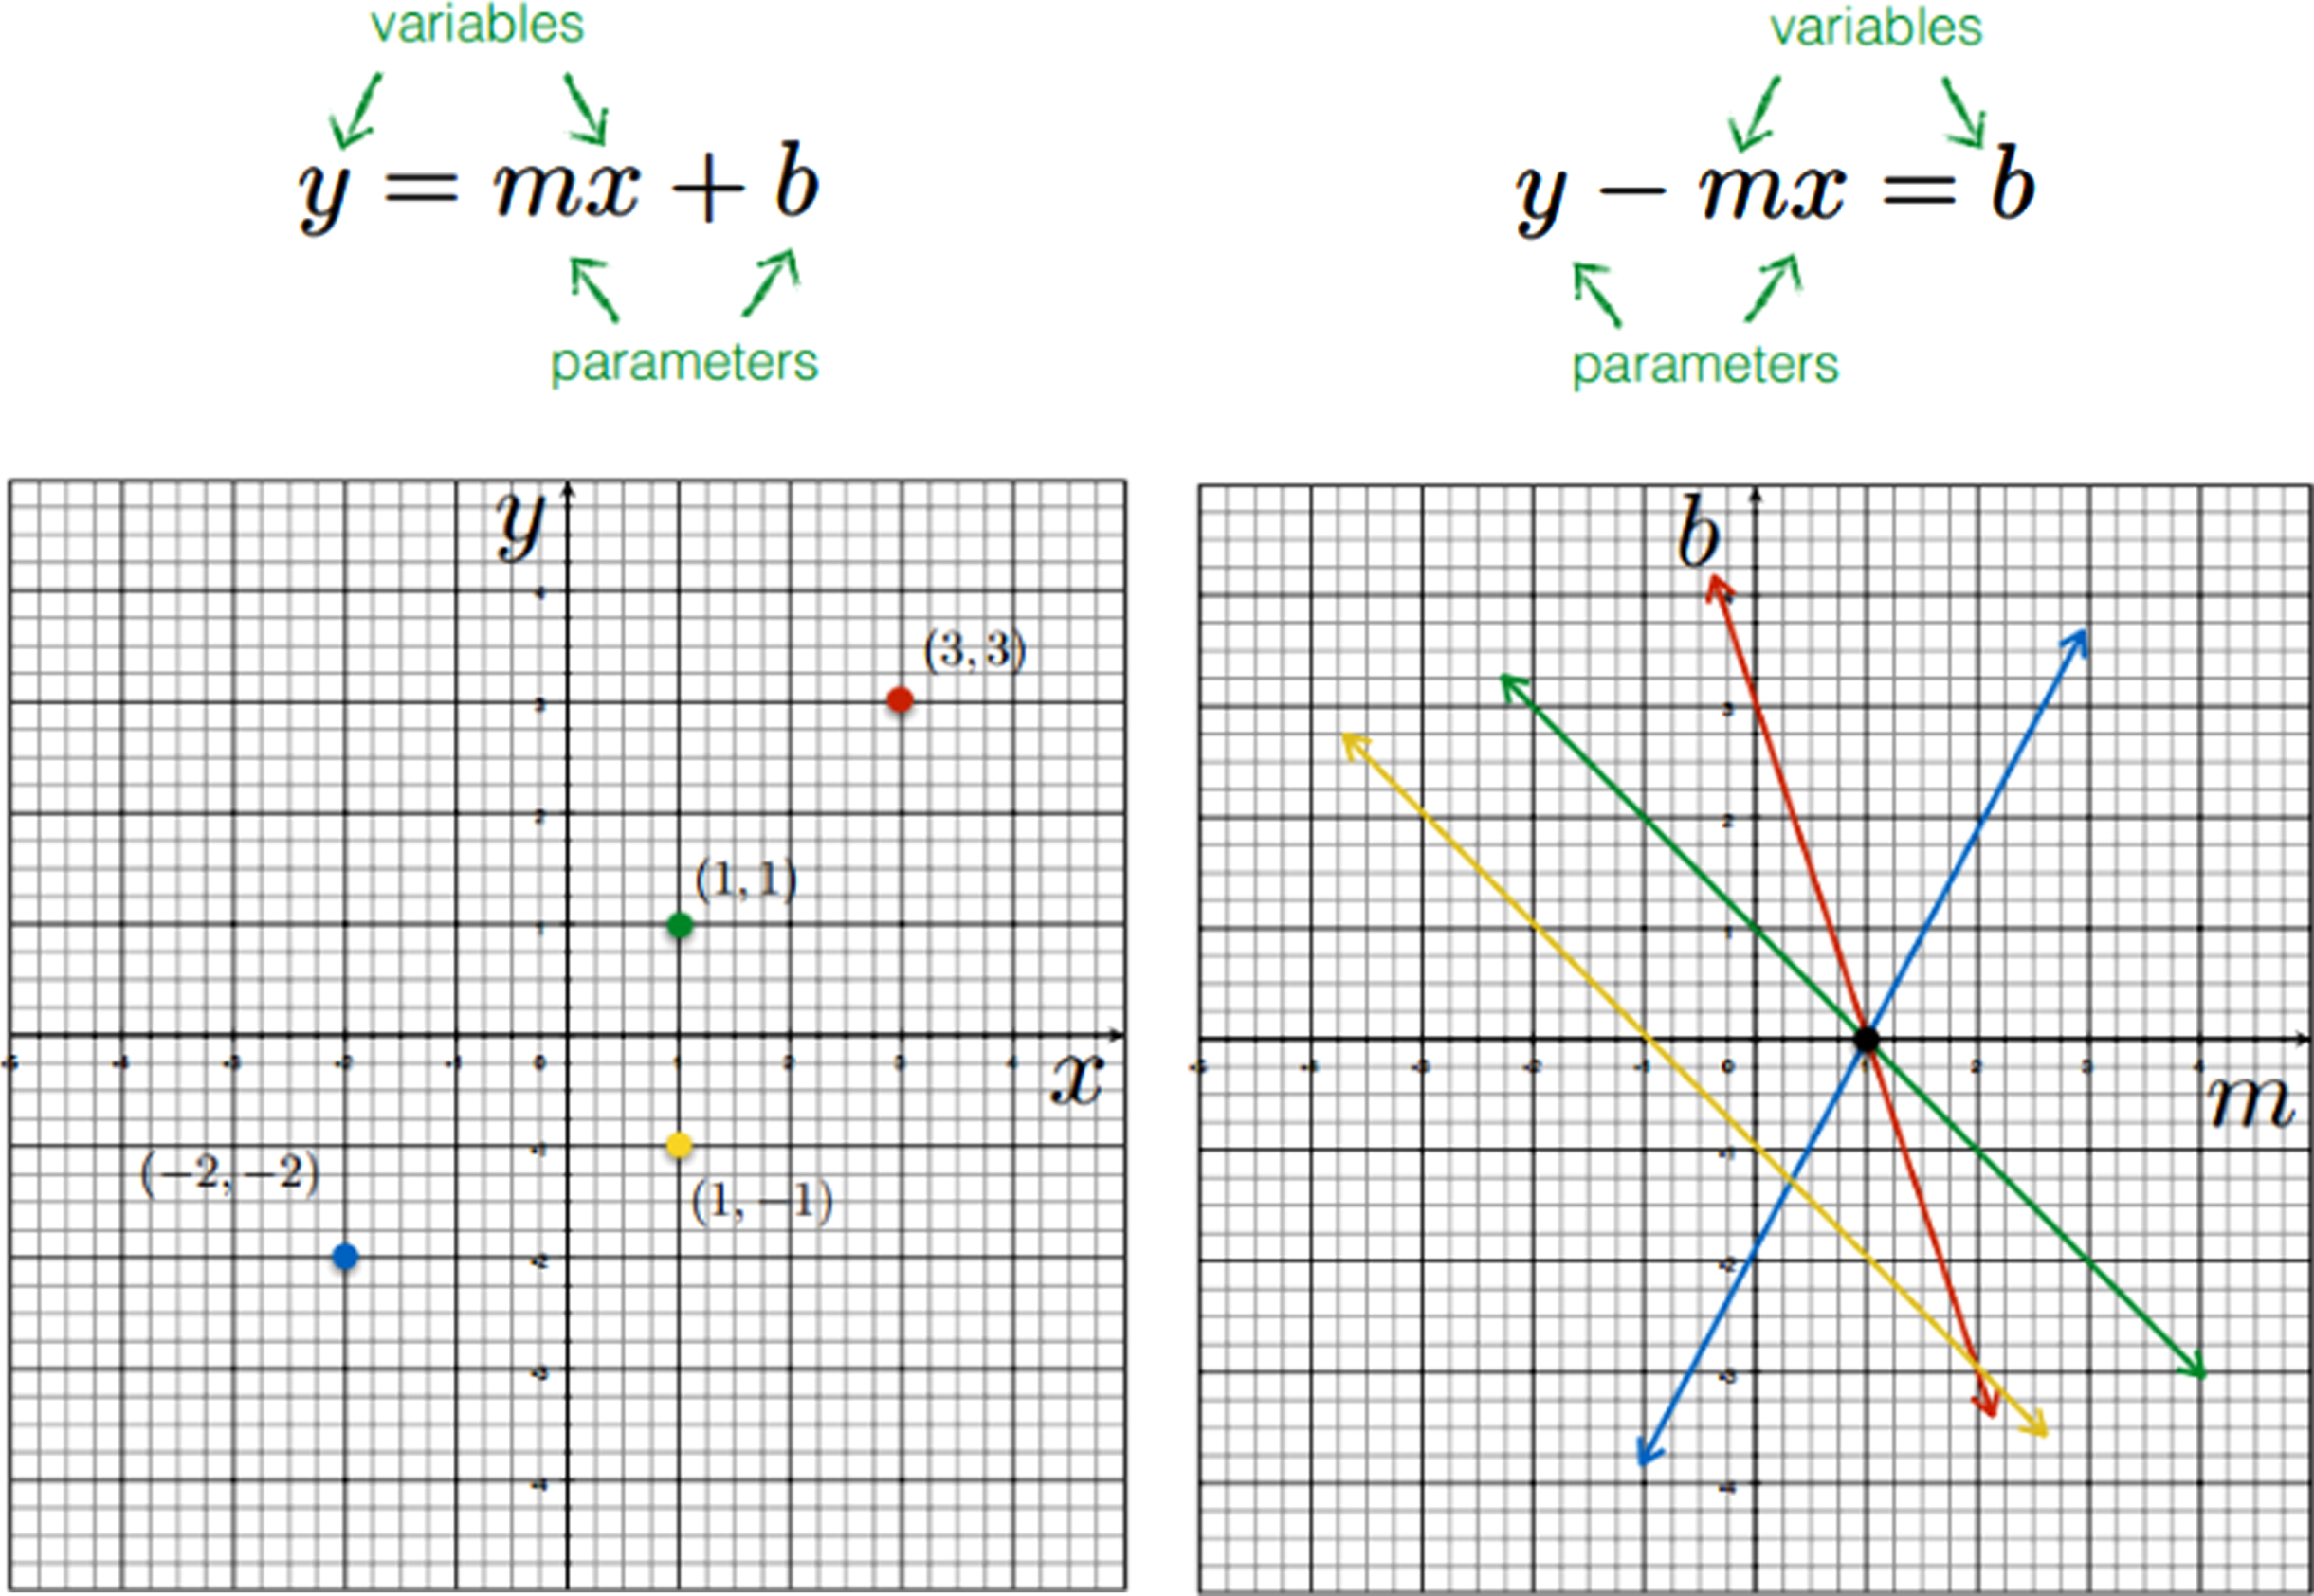
Image space and parameter space.
In order to solve the problem that the value range of (m, n) is too large, the normal expression is replaced by the normal expression of x cos(θ) + y sin(θ) = p in the representation of the straight line. The parameter space becomes (θ, p) (0≤θ ≤ 2π). In this way, a pixel in the image space is a curve (triangular function curve) in the parameter space.
The principle of the Hough transform detecting circles is similar to the principle of detecting straight lines, so the problem needs to be converted into a pair of parameters that are solved with the most pixels passed through (a, b, r). In this paper, the "0497.bmp" image is used as an example for Hough transform circle detection.
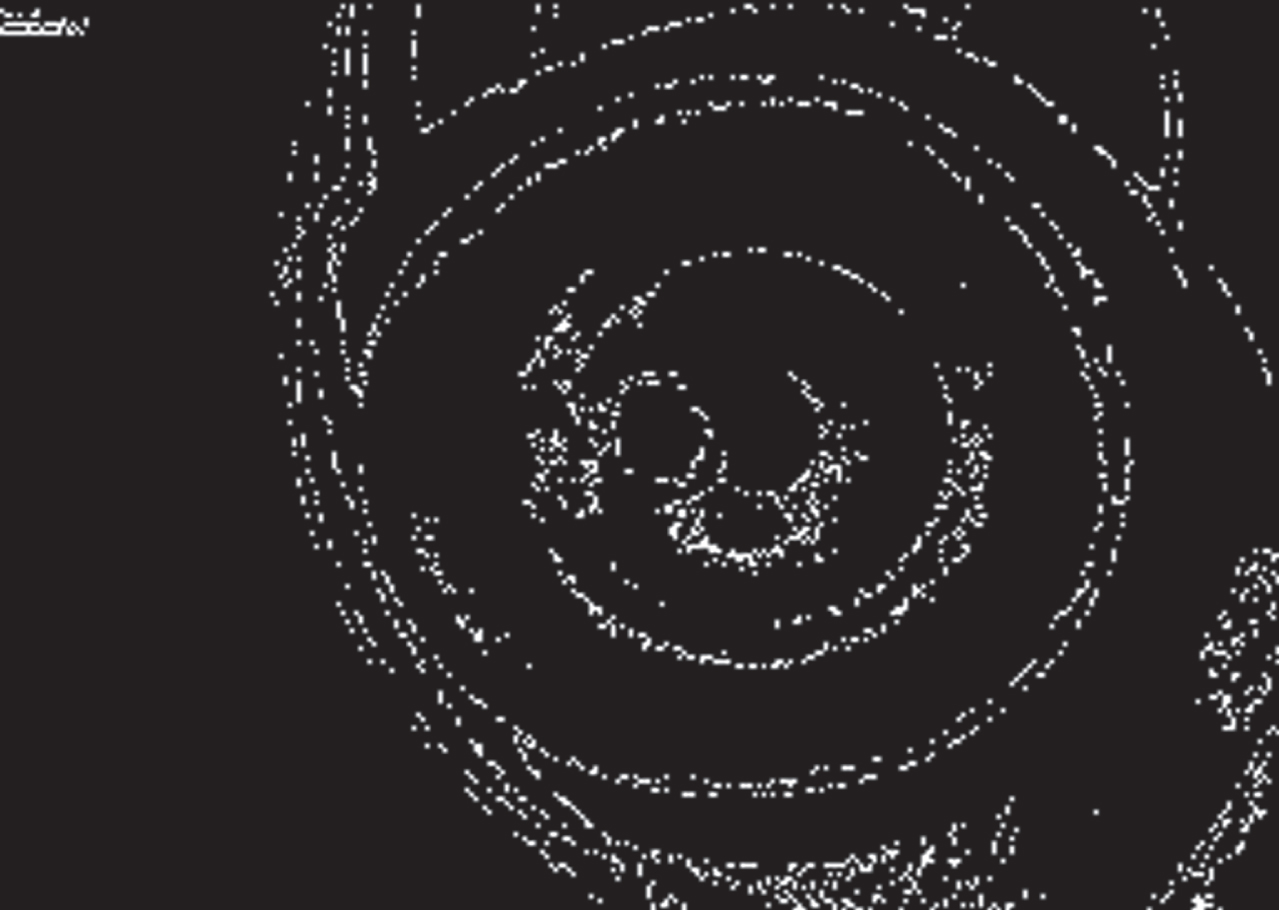
As shown in Fig. 4, the Hough circle transfor-mation is used for detection, using the special shape (circle) of the image, the parameter space points are accumulated according to the specified function, and the voting accumulation is performed for each point taken on the function shape. Finally, the points that need to be counted are obtained through parameter restrictions and the set of points is composed, at which point the final boundary point, that is, the edge plot, can be obtained.
Edge detection map.
In this paper, the edge detection operator is used to extract the edge of the image, and the parts of the feature that are not obvious are removed by setting the limit value, in which the two recognition results of the outer circle and the inner circle of the crucible are obtained by changing the parameters, and the results in following Fig. 5 are still shown with the "0497.bmp" image as an example.
Inside and outside circle test results of crucible.
If the points on a circle are all drawn along its gradient direction, the corners of all the lines are the center of the circle. So it is needed to calculate the possible centers first, and then calculate the possible radii. The Soebl operator is used to calculate the local one-bit derivative, the boundary of the circle is detected, and after the larger value is obtained, the gradient value calculated by Sobel is used to approximate the angle. The specific algorithm is as follows:
1. Estimate the center of the circle
(1) Make the original image a Canny edge detection once, and get the binary image of edge detection.
(2) Perform a Sobel operator on the original image and calculate the neighborhood gradient values of all pixels.
(3) Initialize the circle center space N(a, b) so that all N(a, b) = 0.
(4) Iterate over all non-zero pixels in the Canny edge binary map, draw a line along the gradient direction, and N(a, b) + = 1 of point (a, b) in all accumulators that the line segment passes through.
(5) Statistically sort N(a, b) to get the possible center of circle.
2. Estimated radius (for a circle center a, b)
(1) Calculate the distance from the center of the circle to all non-zero points in the Canny diagram.
(2) Sort the distance from small to large, and select the appropriate possible radius according to the threshold.
(3) Initialize the radius space r,N(r) = 0.
(4) Traverse the non-zero points in the Canny graph, and for the radius r satisfied by the points, N(r) + = 1.
(5) Statistics to get the possible radius value.
According to the above algorithm, the edge points of the images are extracted by the Hough transform and represented as a set. The MATLAB cell array is used to save the coordinates of the points to form a set of points, and the number of points on the equation is accumulated by the voting method. When extracting the edges, the set with a small number of points on the equation in the voting method can be ignored through the threshold, eliminating The set of points that clearly reflect the image feature equations, the results are as follows:
As shown in Fig. 6, the extracted edges are marked in red on the image, which are the inside and outside circles of the crucible, respectively. In order to verify the accuracy of the results of the Hough transform circle detection, this paper is extracted here, and a three-dimensional image of the gray value of the inside and outside areas of the crucible is obtained as follows:
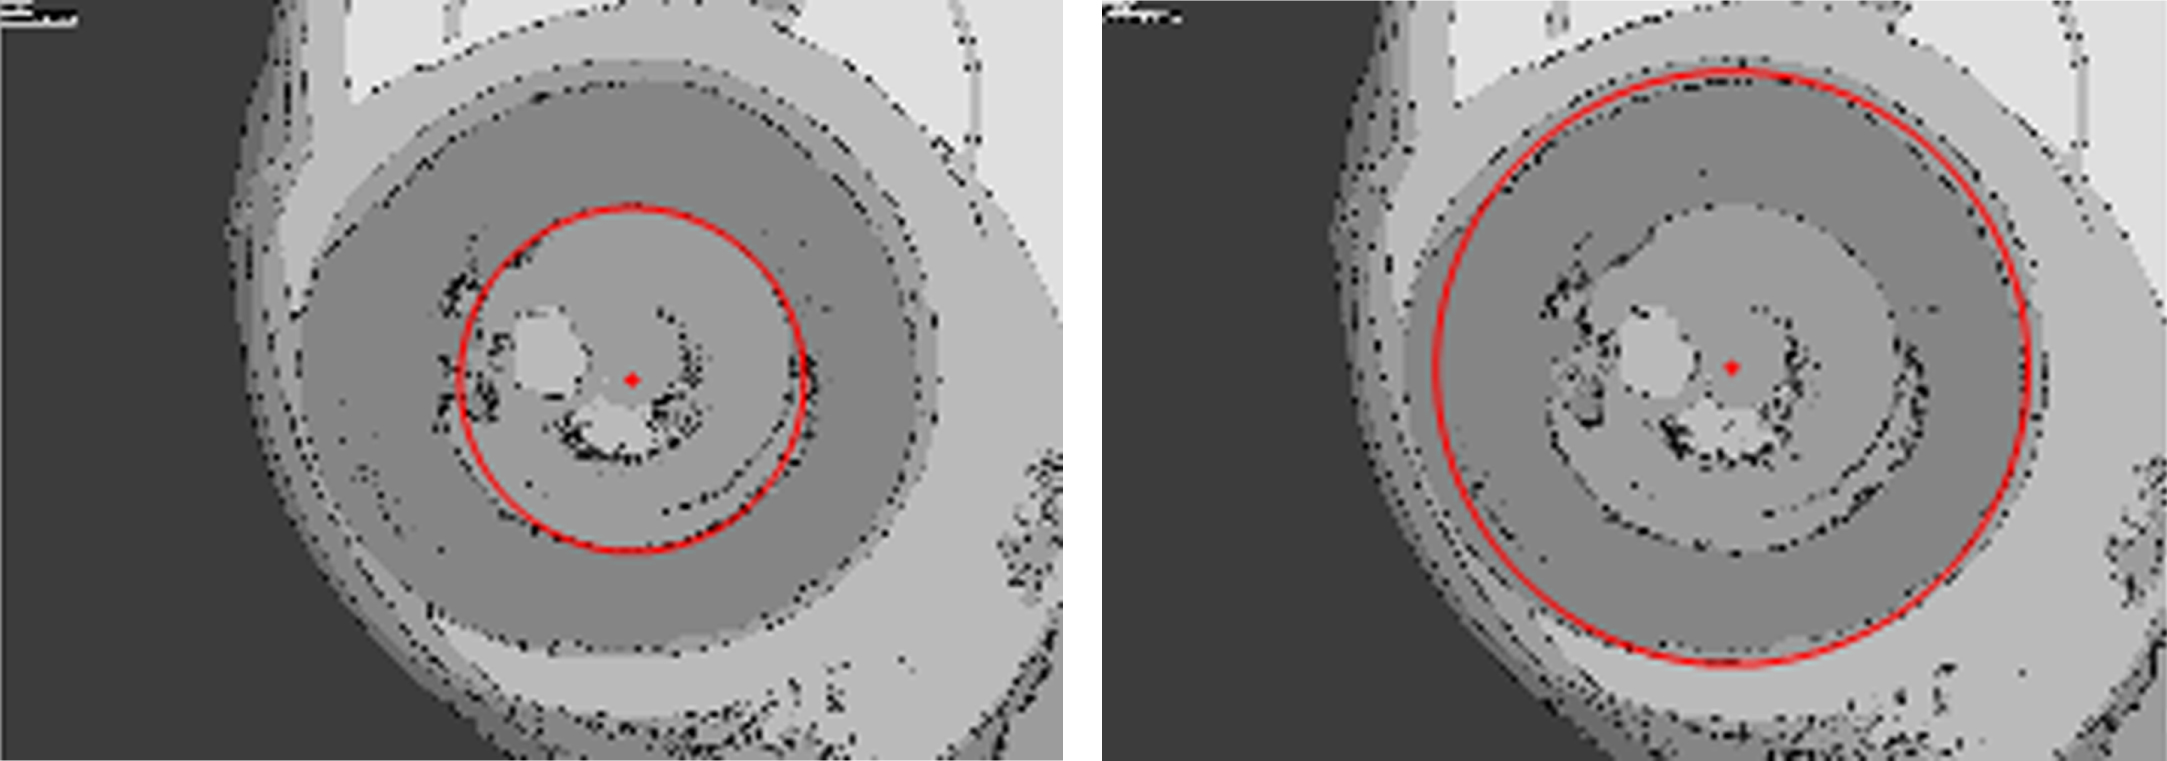
Extraction of crucible position.
As shown in Fig. 7, it is a three-dimensional image of the gray values of the inside and outside areas of the crucible, respectively. The figure on the left has a bump and a depression, which are the fused silicon dioxide and its shadow in the experiment. Large brightness shows convex, low shadow brightness shows concave. The depressions on the right are parts of the outer and inner walls of the crucible. The detection results are in line with reality, so the Hough transform results are extracted accurately.
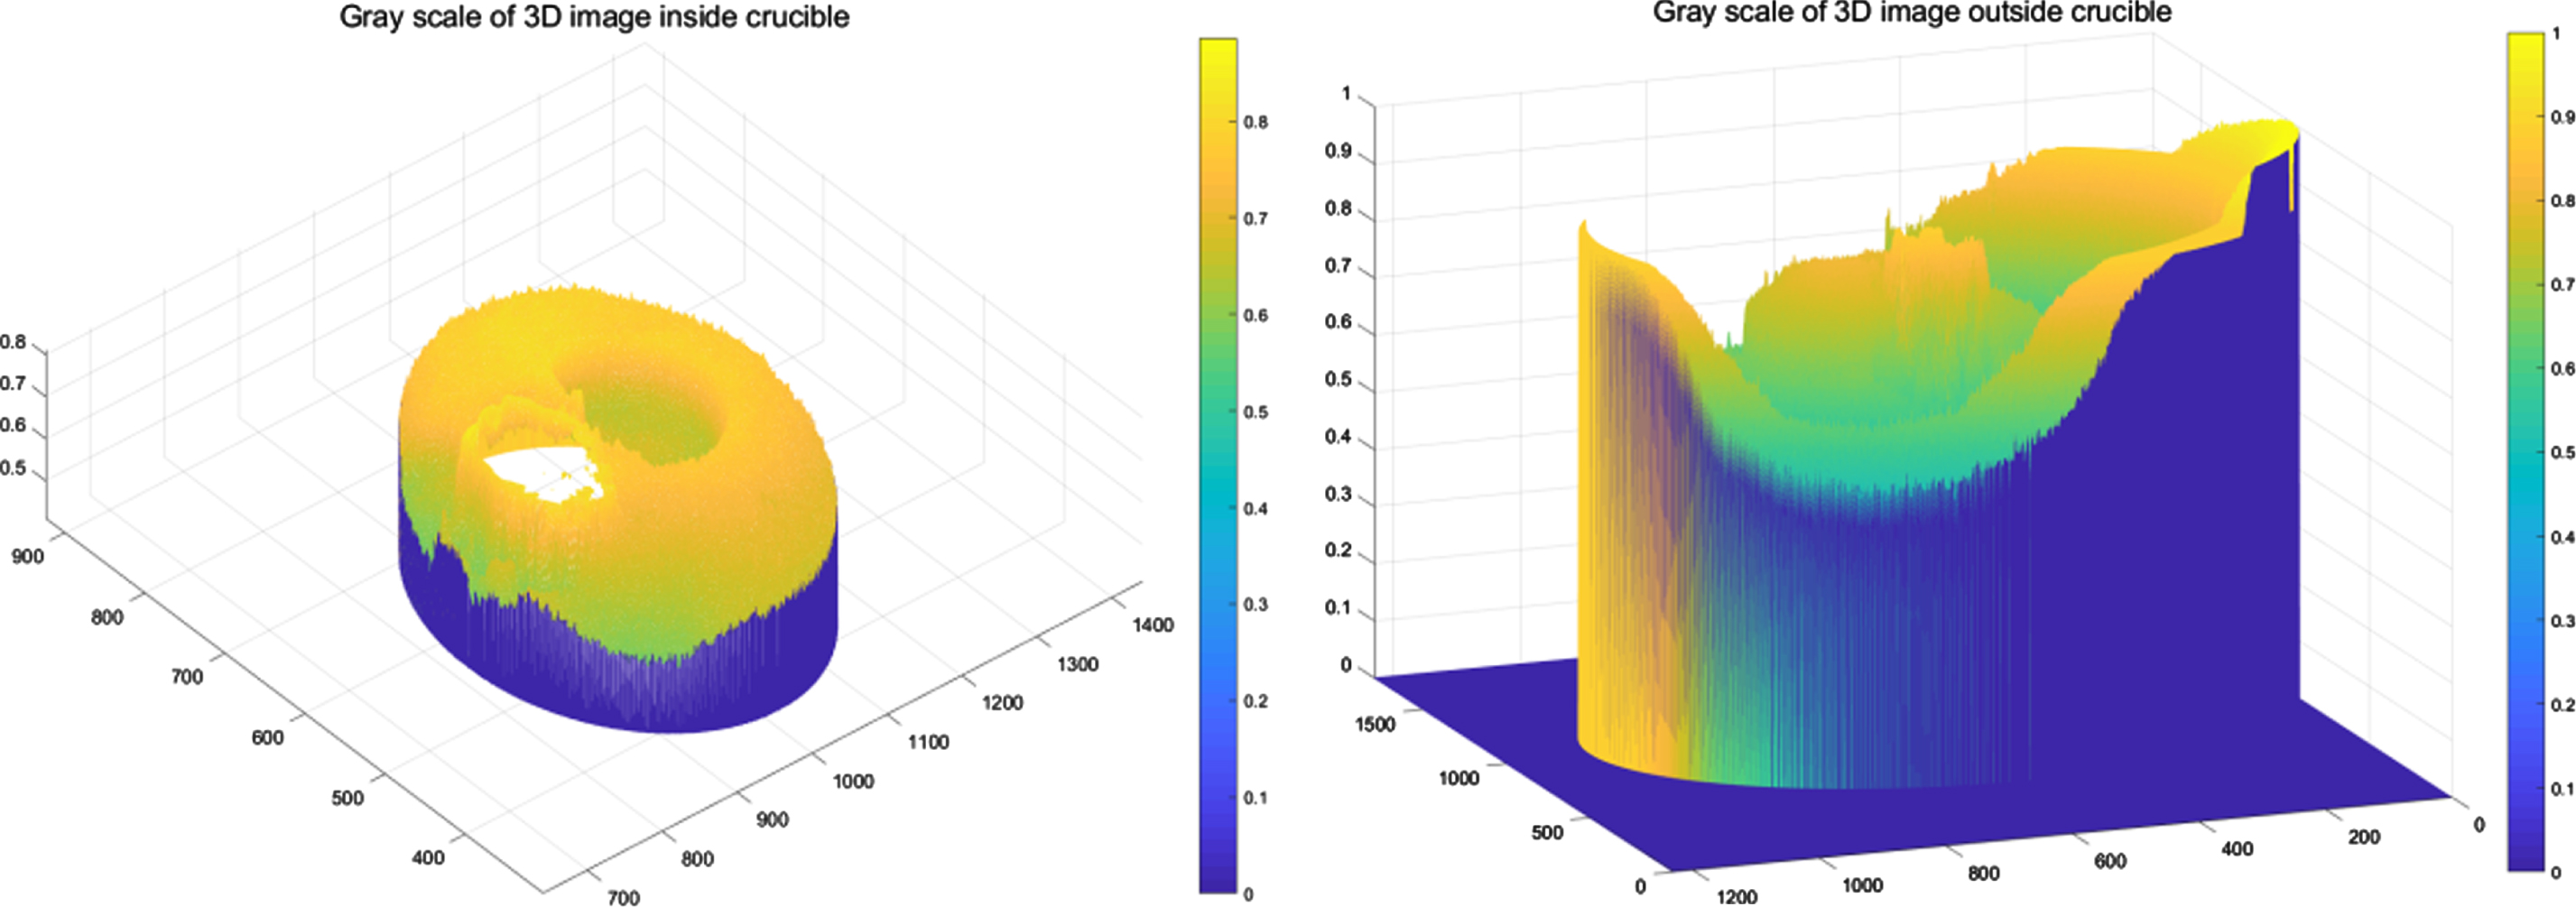
Graying of 3D image inside and outside areas of the crucible.
In this paper, the histogram equalization processing of optimizing the output entropy value and Wiener filtering are combined to optimize the detail information of the target image, and then the maximum interclass variance segmentation method is used to extract the region of interest in the image, thereby reducing the segmentation error. Based on the detected crucible circle area, ROI extraction is performed. The specific steps are described below:
(1) Perform a histogram equalization normalization process to optimize the output entropy value of the target image X to obtain an equalized image X1.
(2) Use Wiener filtering to process the image X1, eliminate the amplified noise after equalization, and obtain the filtered image X2.
(3)The imageis X2 subjected to image threshold segmentation processing using the maximum inter-class variance method to obtain the corresponding area of interest, and the final image Y is output at the same position of the target image.
Entropy optimization of target images
In general, when gray information in a certain area has a higher probability of appearance, the value of the information is high. In information theory, when the distribution of data is close to a uniform distribution, the information entropy carried by the data is the largest. Based on this, it may be desirable to set the size of the target imageas X as M × N, and its gray level L has 256 possible values n L , so that the probability p L that each gray level appears is:
Usually the information entropy H can be calculated from the gray level probability p
L
:
For a given digital image, the distribution of the gray value is clearly fixed and can be reflected by the histogram, so the size of the image information entropy can be used as a measure of the image information obtained by the human eye. The histogram equalization algorithm generally broadens the gray values of the pixels that play a major role in the image frame and returns the gray values of the pixels that play a minor role in the image frame to achieve a clear image.
In this paper, the double histogram average (BHE) processing is adopted, and the gray level segmentation threshold is selected to ensure that the output image entropy value is optimized after the histogram equalization of the target image, so that the detailed information in the image can be further enhanced; the Wiener filter algorithm is used to eliminate the histogram. The graph equalizes the amplified noise to achieve the effect of smoothing the image, thereby increasing the information entropy value of the image.
Wiener filtering [24, 25] is to calculate the variance by selecting the template that is most likely to belong to the same area as the central pixel to be processed among the 9 types of denoising statistical templates shown in Fig. 8 below. The effect of smoothing the image and preserving the border.
Denoising statistical template.
The specific algorithm steps are as follows:
(1) traverse all pixels in the image to be processed, and calculate the gray variance of all pixels in the template area with non-boundary pixel values as the center according to the 9 templates listed in the figure above.
(2) For non-boundary pixels that meet the requirements, find the template position with the smallest variance among the gray variances of the 9 template areas calculated above.
(3) Calculate the gray average value of all pixels in the template based on Euclidean distance weighting, replace the gray value of the pixel in the center of the original template, and repeat the first step until all pixels are processed.
The core of the image segmentation method is to find a suitable segmentation threshold. The threshold obtained using the maximum inter-class variance method is a commonly used metric in statistical discrimination analysis. In the case that only the foreground target and the background area are considered in the image, it may be desirable to define the segmented foreground target as C1 and the background area as C2, and calculate the two types of gray averages m1 and m2, respectively. The statistical relative distance can be calculated. metric:
If the value of the relative distance metric reaches the maximum value, it indicates that the difference between the foreground target and the background area after the image segmentation is the largest under this threshold, so it can be regarded as the best segmentation. The specific algorithm steps are as follows:
(1) Given an initial threshold T = T0, the image is divided into two categories, the foreground target and the background area, and the gray averages of the two categories are calculated respectively.
(2) Calculate the relative distance metric S according to formula (3).
(3) After traversing all possible thresholds, select the optimal threshold T = T*, so that the image is divided into two categories C1 and C2 according to the threshold, and the following formula is satisfied:
The system uses the centroid method [26–28] for data processing to improve the test accuracy. Because the centroid method can make the image resolution on the CCD reach 1/10 of the size of the photosensitive element, the serial number of the photosensitive source corresponding to the center of the imaging bright line on the CCD can be a decimal number, not necessarily an integer. The accuracy is improved by 0.1 percentage point.
Based on the entropy-optimized method of image area of interest extraction, the results in following Fig. 9 are obtained, which are the areas of interest of three images, 0497.bmp, 0498.bmp, and 0499.bmp, respectively.
Area of interest.
Since the pixels farther from the center of the spot have less influence on the determination of the centroid, the reciprocal of the distance is used as a weighting function, which can reduce the noise far from the spot, reduce the interference of noise on the centroid detection, and improve the accuracy of the centroid detection.
At the same time, the pixel value of the part near the center of the spot is enhanced, so that the influence on the spot that has a greater impact is further increased, and the accuracy of the centroid detection is improved. To eliminate noise interference. Therefore a strong weighted distance centroid algorithm is adopted.
Among them, (x
i
, y
j
) is the coordinates of the current measured pixel, (x
c
, y
c
) is the center coordinate of the light spot, (
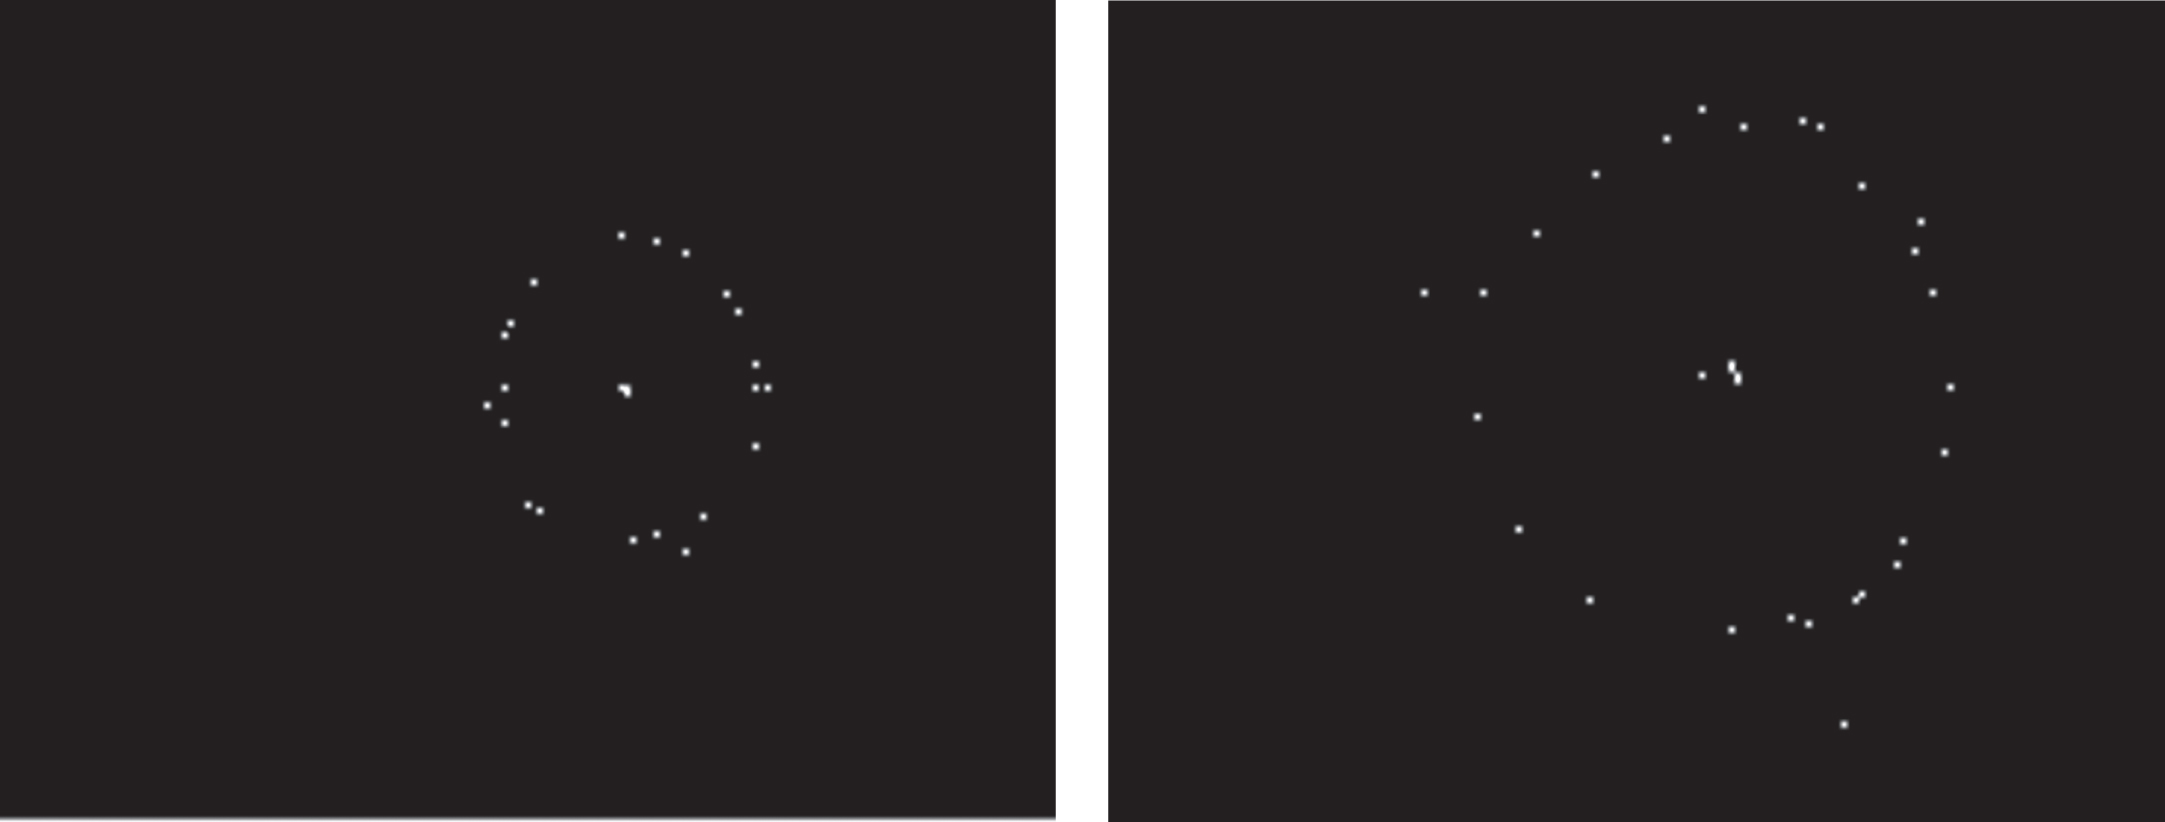
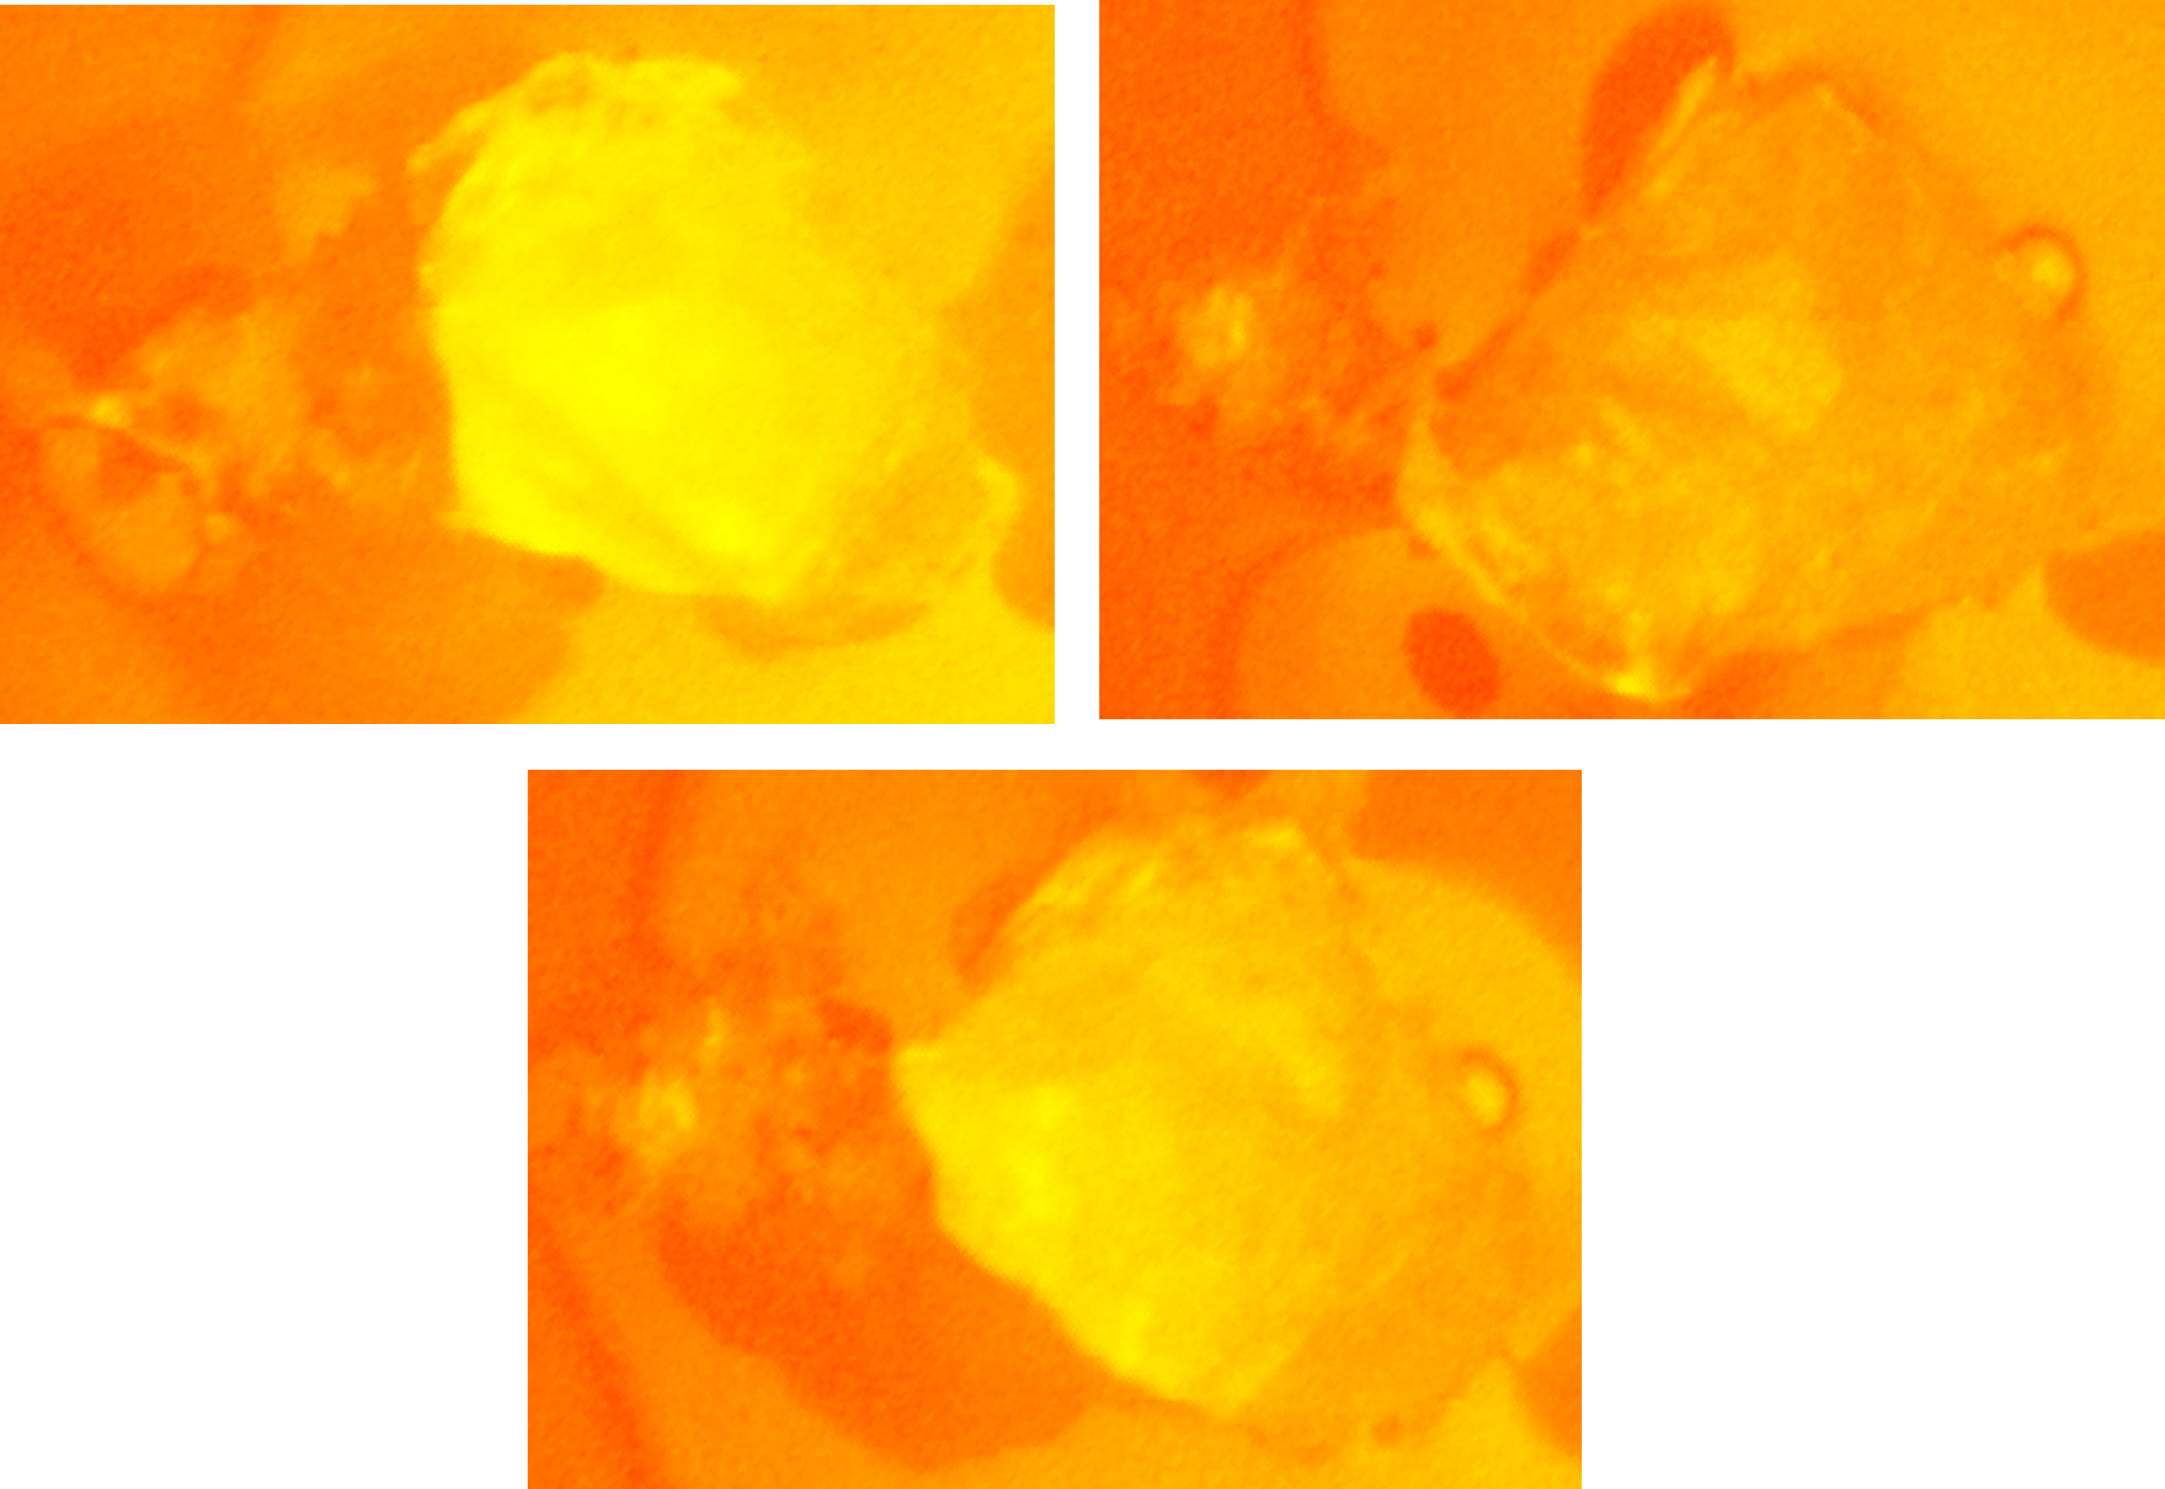
The Fig. 10 shows the physical positions of the particles of silicon dioxide crystals in the molten state in each image after the area of interest is extracted.
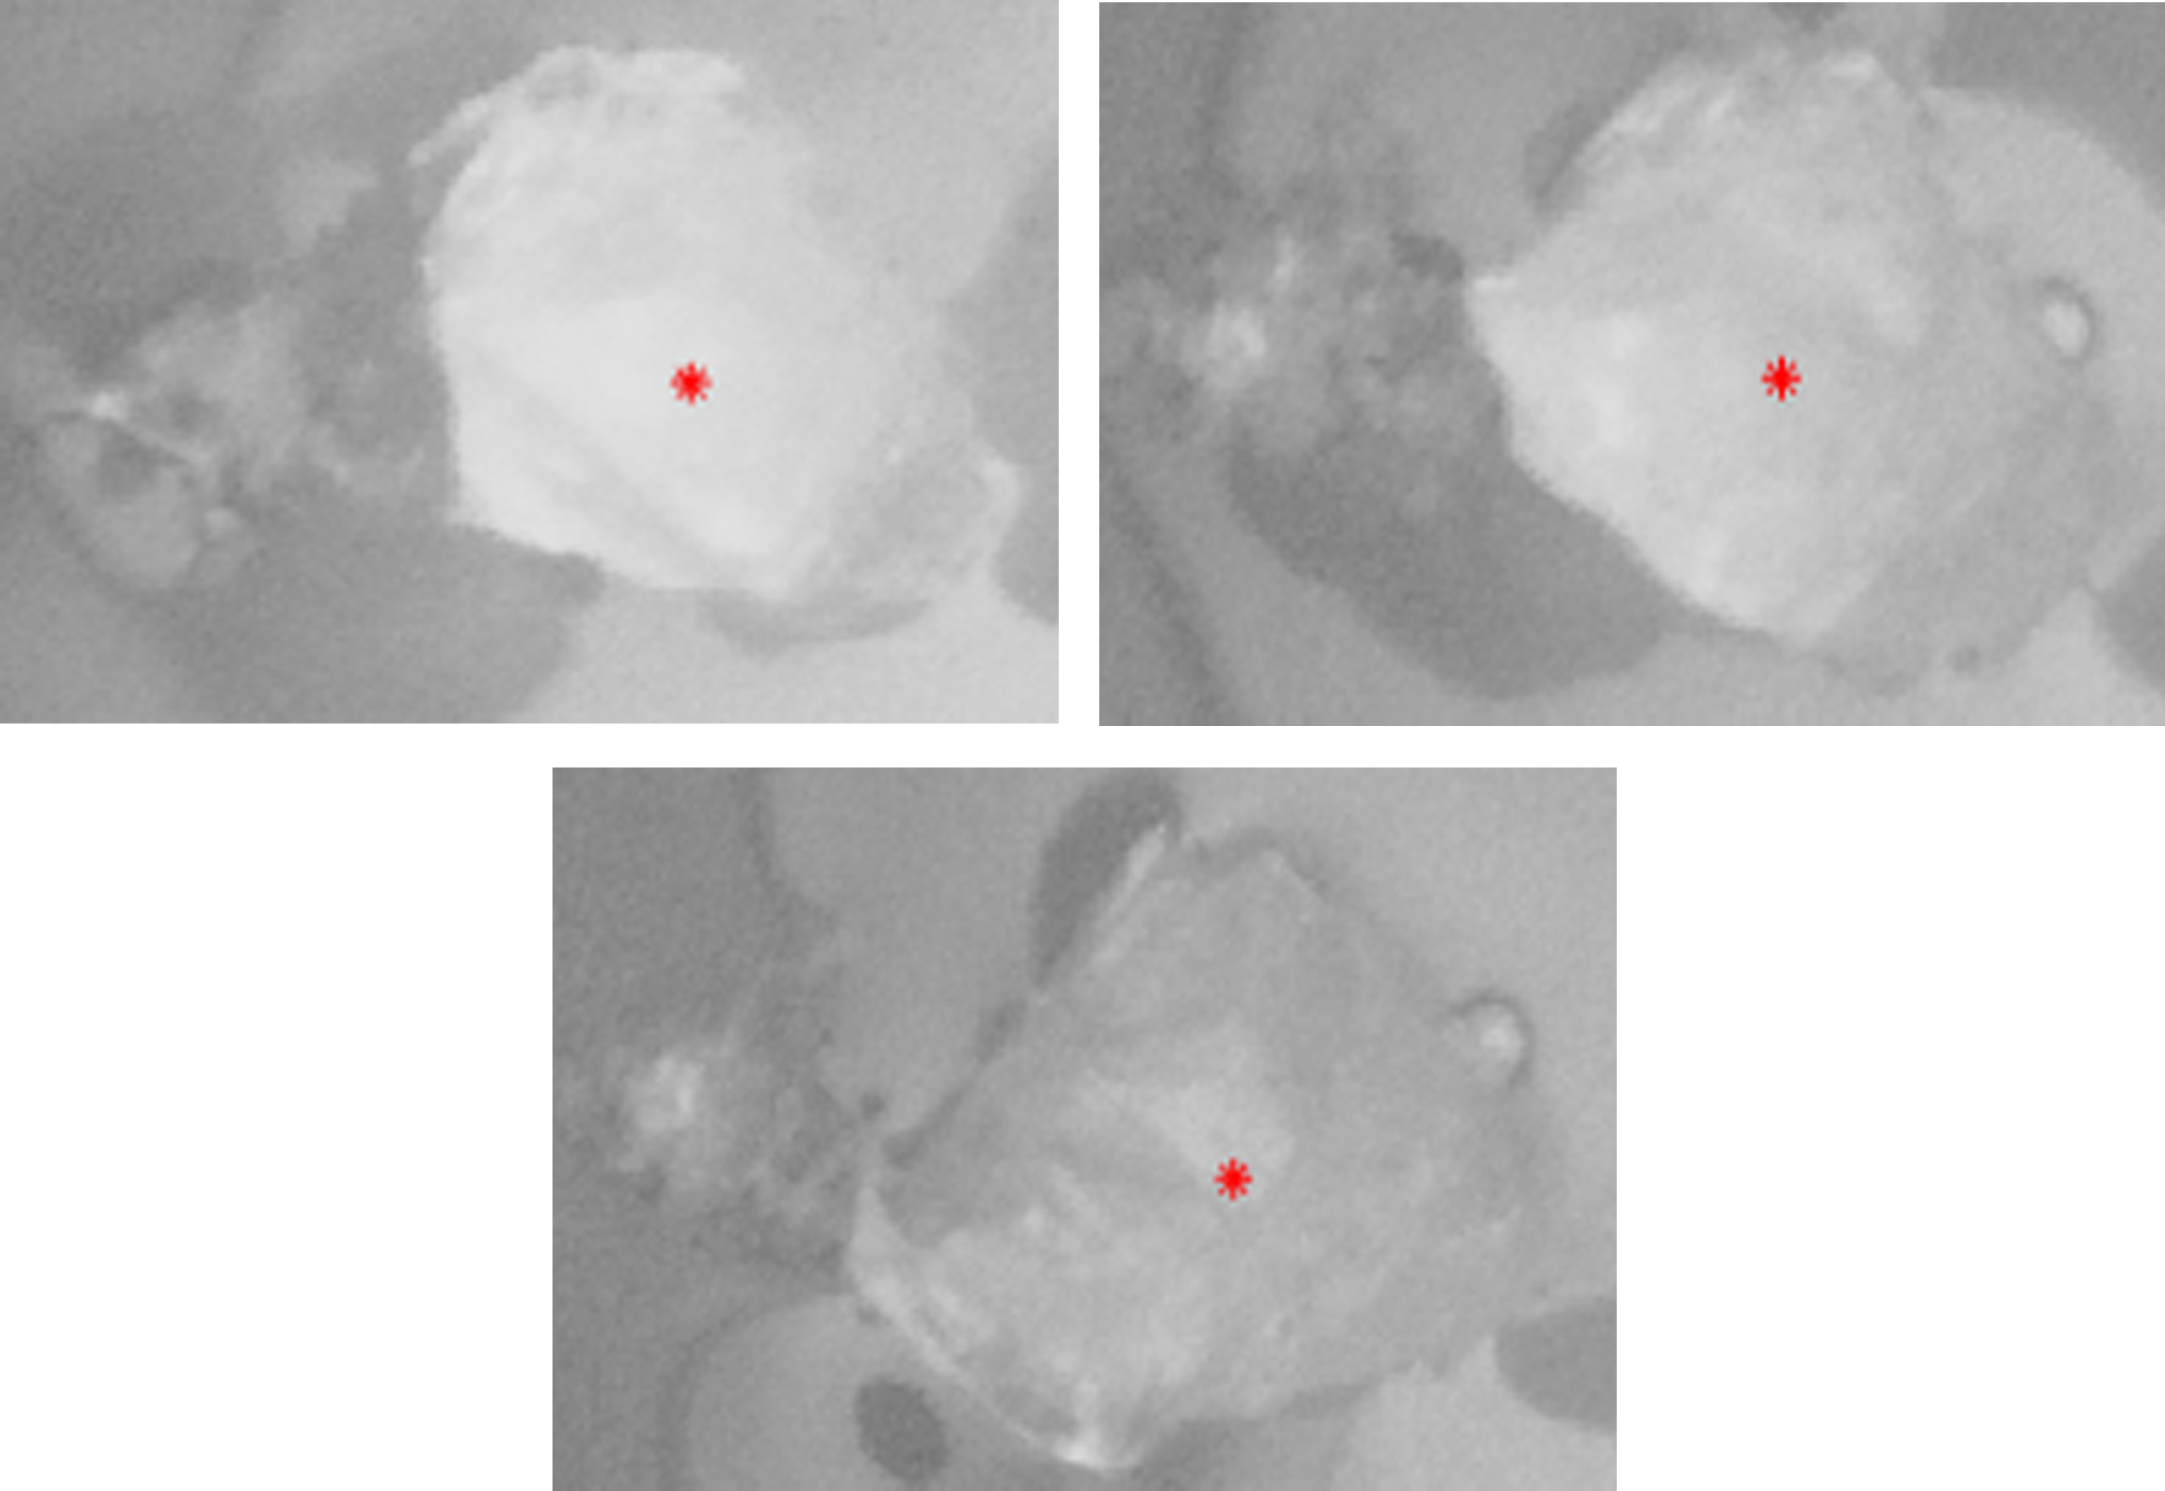
Centroid extraction point.
In this section, the edge profile of silicon dioxide is extracted, and then further morphological manipulations are used to extract the shape of the silicon dioxide, such as corrosion and expansion.
Snake Active Contour Algorithm
Snake active contour [29] is a two-dimensional deformation curve that generates motion under the influence of image forces. Its behavior is controlled by internal and external forces. The internal force plays a role of smoothness. The external force guides the contour line to move toward the image feature. The active contour line finds the minimum value of its energy function under the internal and external forces.
Discretizing the Snake model combined with the greedy algorithm [30] can be expressed as:
In the formula (8), N is the total number of snake points, and v i =(vi,0) represents the snake points and the points in their 8 neighborhoods v ij (j≠0).E cont (vi,j), E curv (vi,j), E grad (vi,j), E gray (vi,j), E cons (vi,j) are the continuity energy, curvature energy, gradient energy, gray energy, and constraint energy of the corresponding points. The term belongs to external energy, and E grad (vi,j) and E gray (vi,j)belong to image energy. α,β, γ, δ, Ω are the weights of each energy term, which are used to adjust the proportion of each energy term in the total energy. In order to balance the influence of each item, each energy item should be normalized to a number in the interval [0, 1]. The specific analysis of each energy term will be given below.
For continuous energy, the distance between two adjacent snake points on the model is calculated.
In formula (10),
The closer the distance between adjacent snake points to the average distance, the smaller the energy it contains. When the distance between adjacent snake points is equal to the average distance, the energy is zero. This avoids the tendency of the model to shrink, while also retaining the original nature of the continuous terms. Then normalize it to get the final expression of continuous energy:
The bending energy is a second-order central difference, which is more versatile. Its mathematical expression is:
Compare this formula with the curvature calculation formula:
Where K is the curvature, y′′ is the second derivative of the y = f (x), and y′ is the first derivative. It can be found from the comparison that the above formula actually corresponds to the curvature. That is, the larger the curvature, the greater the bending energy. When the contour curve is a circle, the bending energy is the smallest, and the smoothness of the curve is better.
Image energy contains kinds of energy, which are line energy, edge energy, and endpoint energy. Because the extracted image features are generally more obvious edges and other features, the first two are commonly used. The first image energy used in this article is “line energy”, also known as gray energy, that is:
In formula (15), I (vi,j) represents the gray value at point vi,j, and min Gray and max Gray represent the minimum and maximum gray values in the neighborhood, respectively.
The second image energy used in this paper is the gradient energy, which is the magnitude of the gradient of each pixel in the image. For all points in the v j neighborhood, find the point with the largest gradient and the smallest gradient, and normalize the gradient energy. Let G j be the gradient at j (j = 0, 2, ⋯ 8).
The normalized gradient can be:
There are many different methods for calculating the pixel’s gradient amplitude. The most primitive one is based on the gradient definition. The gradient of image f (x, y)at position (x, y) is defined as the following vector:
Here, an important quantity is the size of this vector, here represented by ∇f
In digital image processing, the simplest approximation that satisfies the specified conditions is f (x + 1, y) - f (x, y) and f (x, y + 1) - f (x, y) instead of solving partial derivatives. The isotropic Sobel (Isotropic Sobel) operator is used to calculate the gradient.
The constraint energy of this paper uses the potential energy of the distance between the snake point and the center of gravity of the snake, and its calculation formula is as follows:
Among them, v c is the center of gravity of Snake, that is:
Where N is the number of snake points, v i is the coordinate of the i -th snake point.
The Sobel Operator [31] is mainly used for edge detection [32]. Technically, it is a discrete difference operator that is used to calculate the approximate value of the gray level of the image brightness function. Using this operator at any point in the image will generate the corresponding gray vector or its normal vector.
The operator contains two sets of matrices, horizontal and vertical. The X-direction template has the greatest influence on the vertical edges, and the Y-direction template has the greatest influence on the horizontal edges. The two templates are combined to form a gradient operator.
The specific formula is as follows:
The horizontal and vertical gray values of each pixel of the image are combined by the following formula to calculate the gray level of the point:
If the gradient is greater than a certain threshold, the point (x, y) is considered as an edge point.
The Fig. 11 shows the results of our Sobel operator edge detection process.
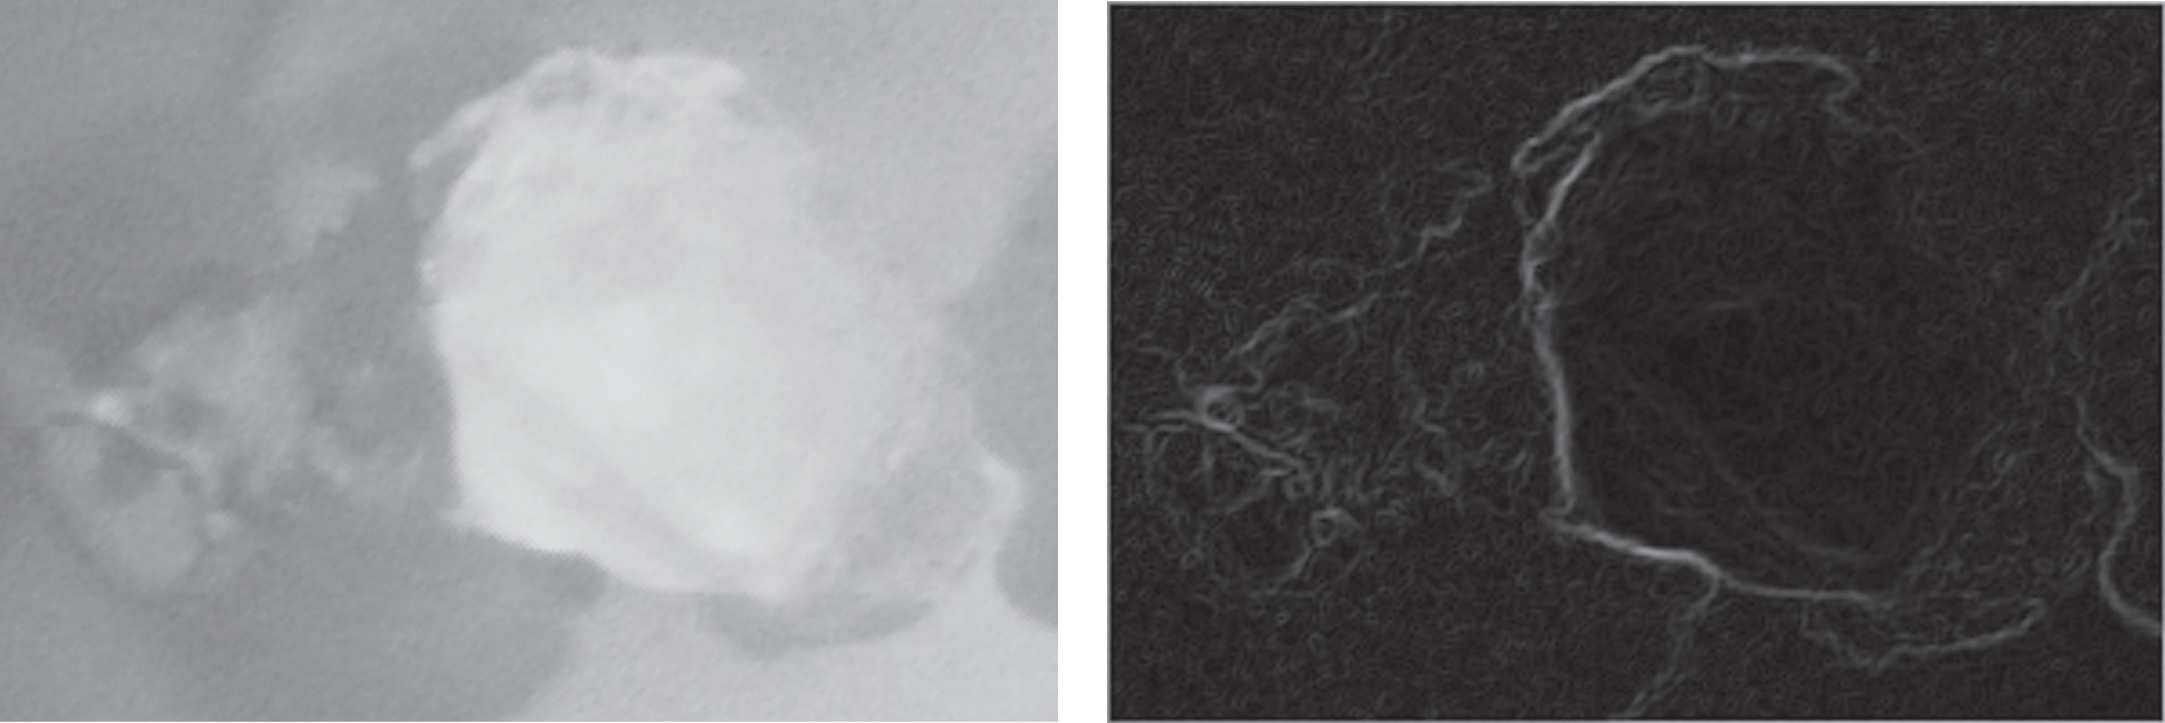
Sobel edge detection.
Image morphology operations can be divided into binary morphology and gray morphology. Gray morphology is extended from binary morphology. Mathematical morphology has two basic operations, namely corrosion and expansion, and corrosion and expansion form an open operation and a closed operation through combination.
Open operation is first corrosion and then expansion, closed operation is first expansion and then corrosion the expansion operation convolves image A with kernel B of any shape, usually square or circular. Kernel B has a definable anchor point, usually defined as the kernel center point. The dilation will "grow" the area of the target area, and merge the background points that the target area touches into the target to expand the target boundary to the outside. The effect is to fill some holes in the target area and eliminate the small particle noise contained in the target area.
The Corrosion is just the opposite of the expansion operation. It extracts the minimum value of the voxel covered by the kernel. When performing the corrosion operation, the kernel B is drawn across the image, and the minimum phase prime value of the area covered by the kernel B is extracted and replaced with the phase prime at the anchor point position. Therefore, erode is an enhancement and expansion of a small gray value area, which is mainly used to remove bright noise. Dilate is an enhancement and expansion of areas with large gray values, and is mainly used to connect areas of similar color or intensity.
The open operation used in this paper is corrosion first and then expansion, which can mainly eliminate isolated points higher than its neighboring points. The results are shown below:
The first image in Fig. 12 is an image of interest, the second image is an image after binarization, the third image is an image after an erosion operation, and the fourth image is an image after an expansion operation. It can be clearly seen from the figure that the amount of small particle noise in the edge area is reduced.
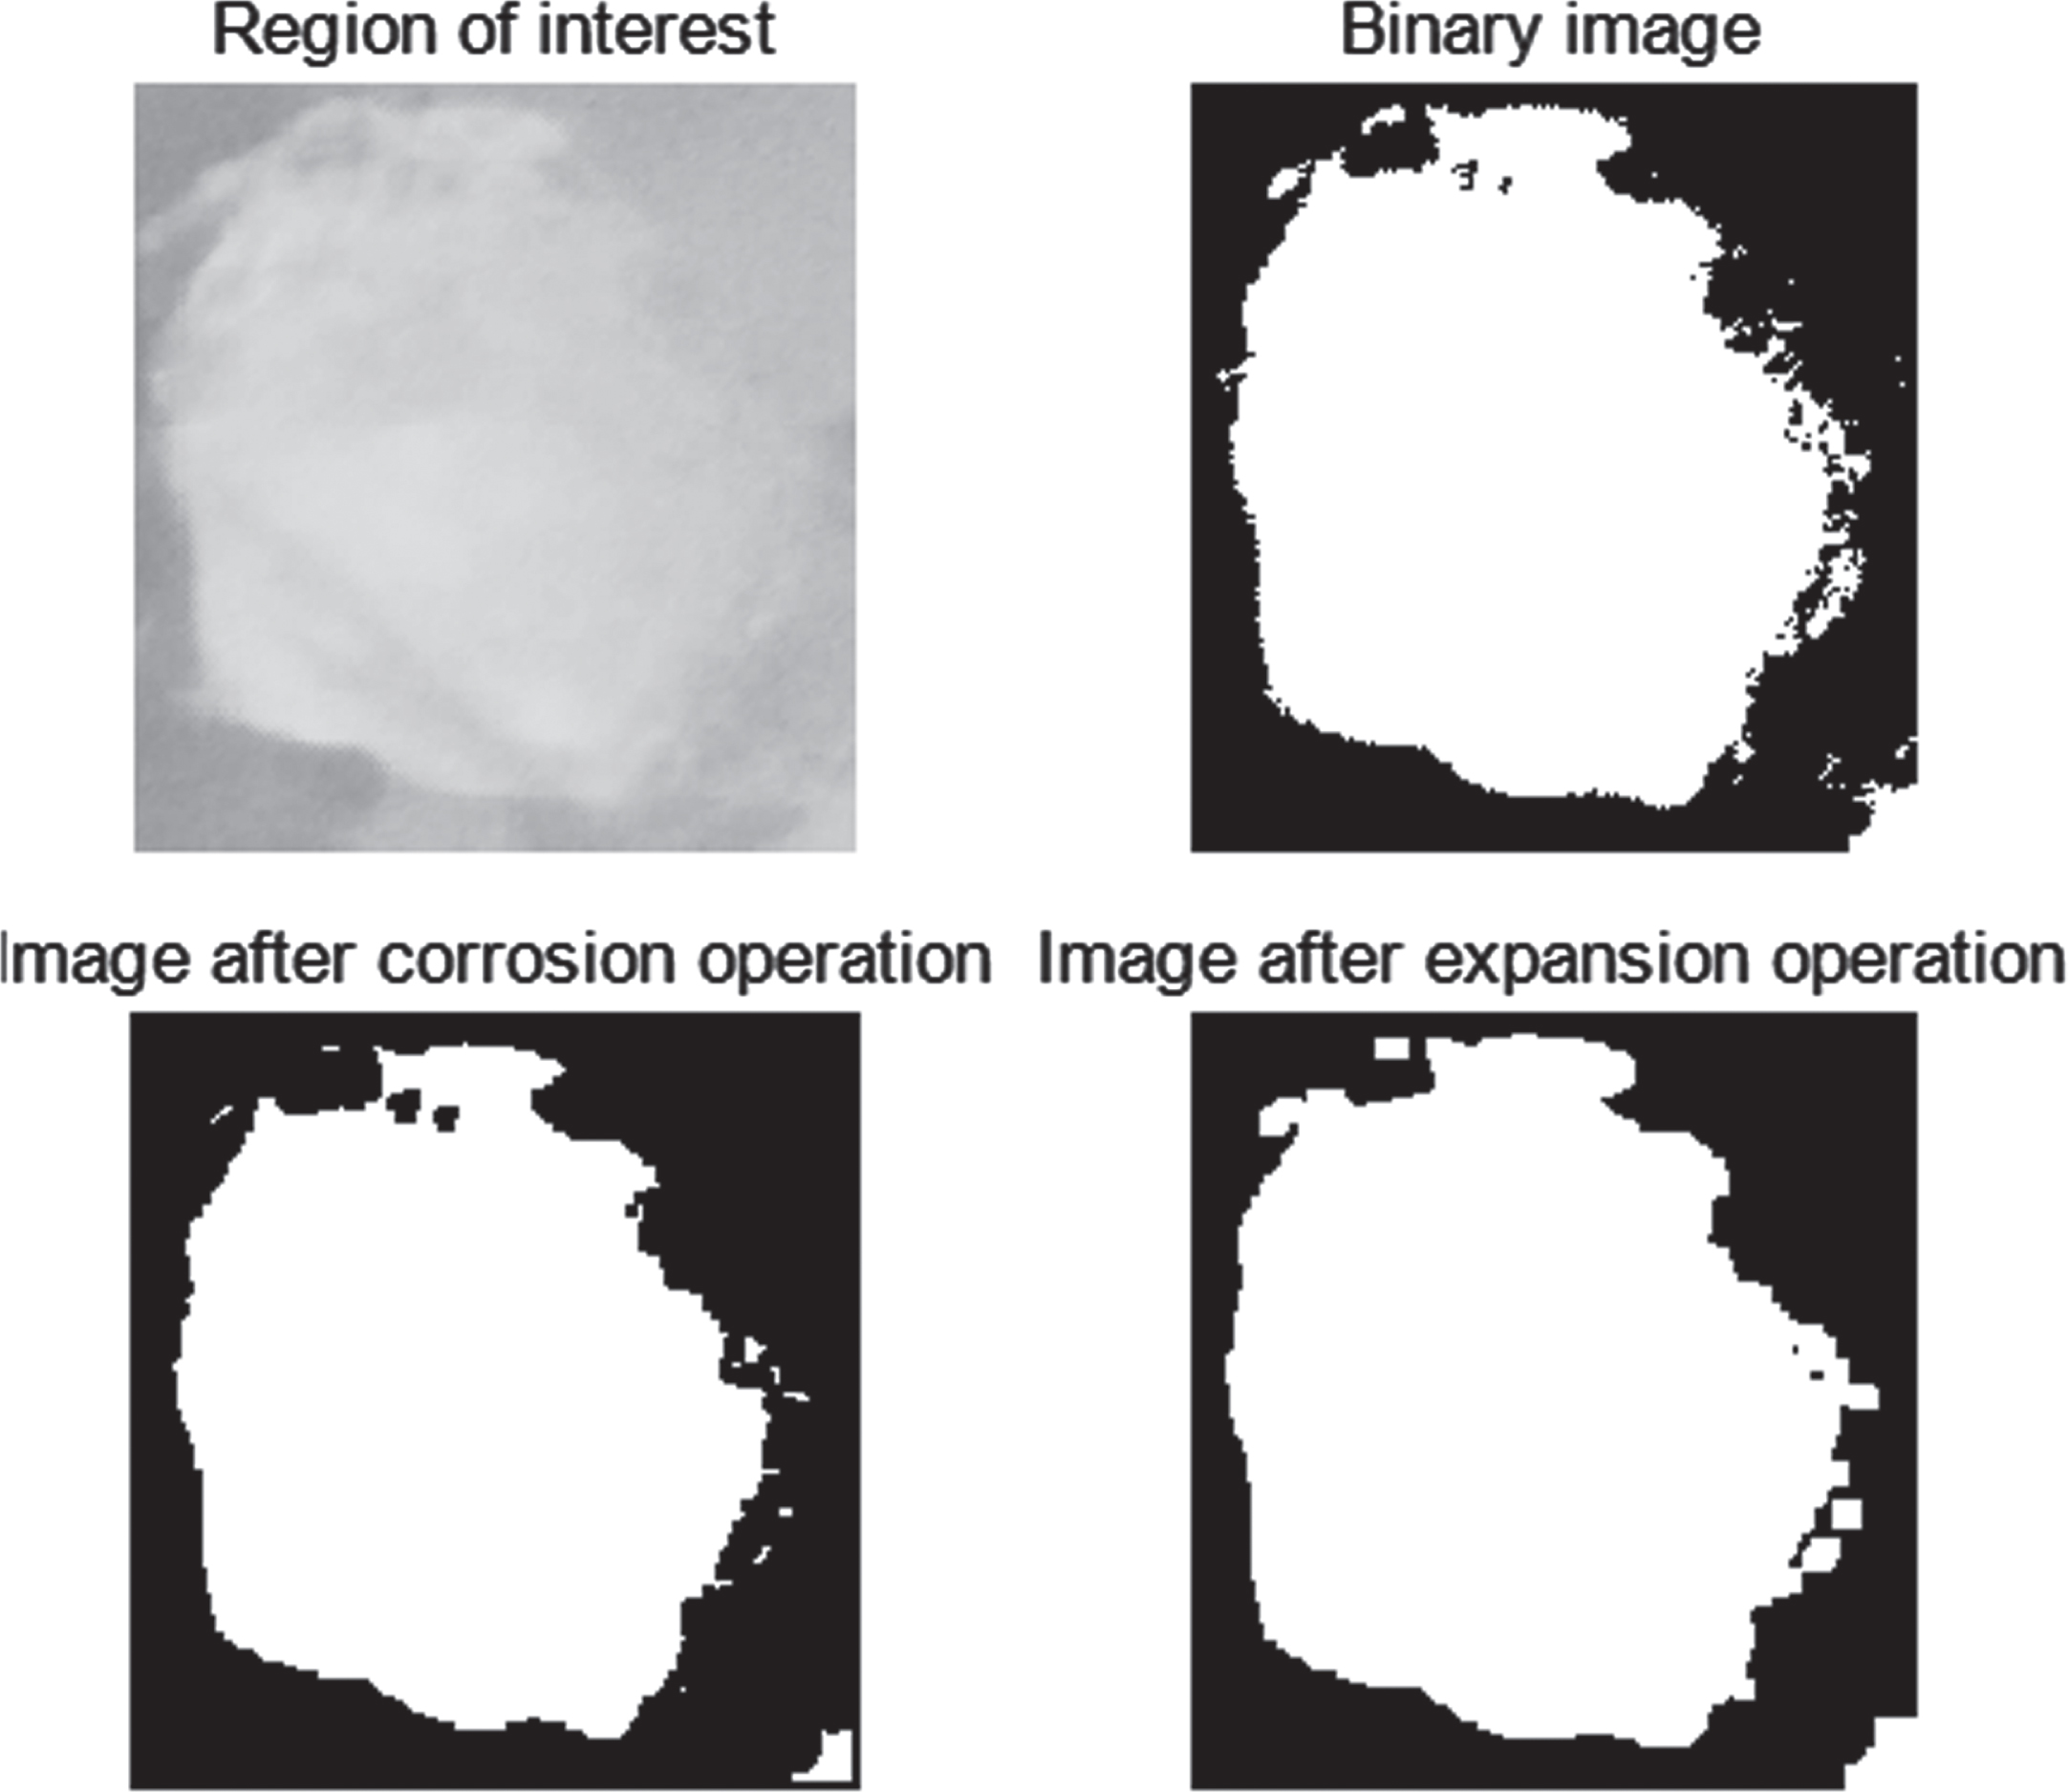
Morphological corrosion and expansion operation.
In this section, a three-dimensional skeleton generation model is established, estimate the depth information, and extend the two-dimensional skeleton information to three dimensions.
Skeleton theory basis
The skeleton, also called the central axis, is an important way to express the shape of an object. For fused silicon dioxide images, if accurate skeleton features can be obtained, it means that various useful morphological information can be extracted from the skeleton. Compared with the previous morphology of the skeleton, the melting change of the crystal can be significantly observed. And analyze the estimation of the three-dimensional skeleton.
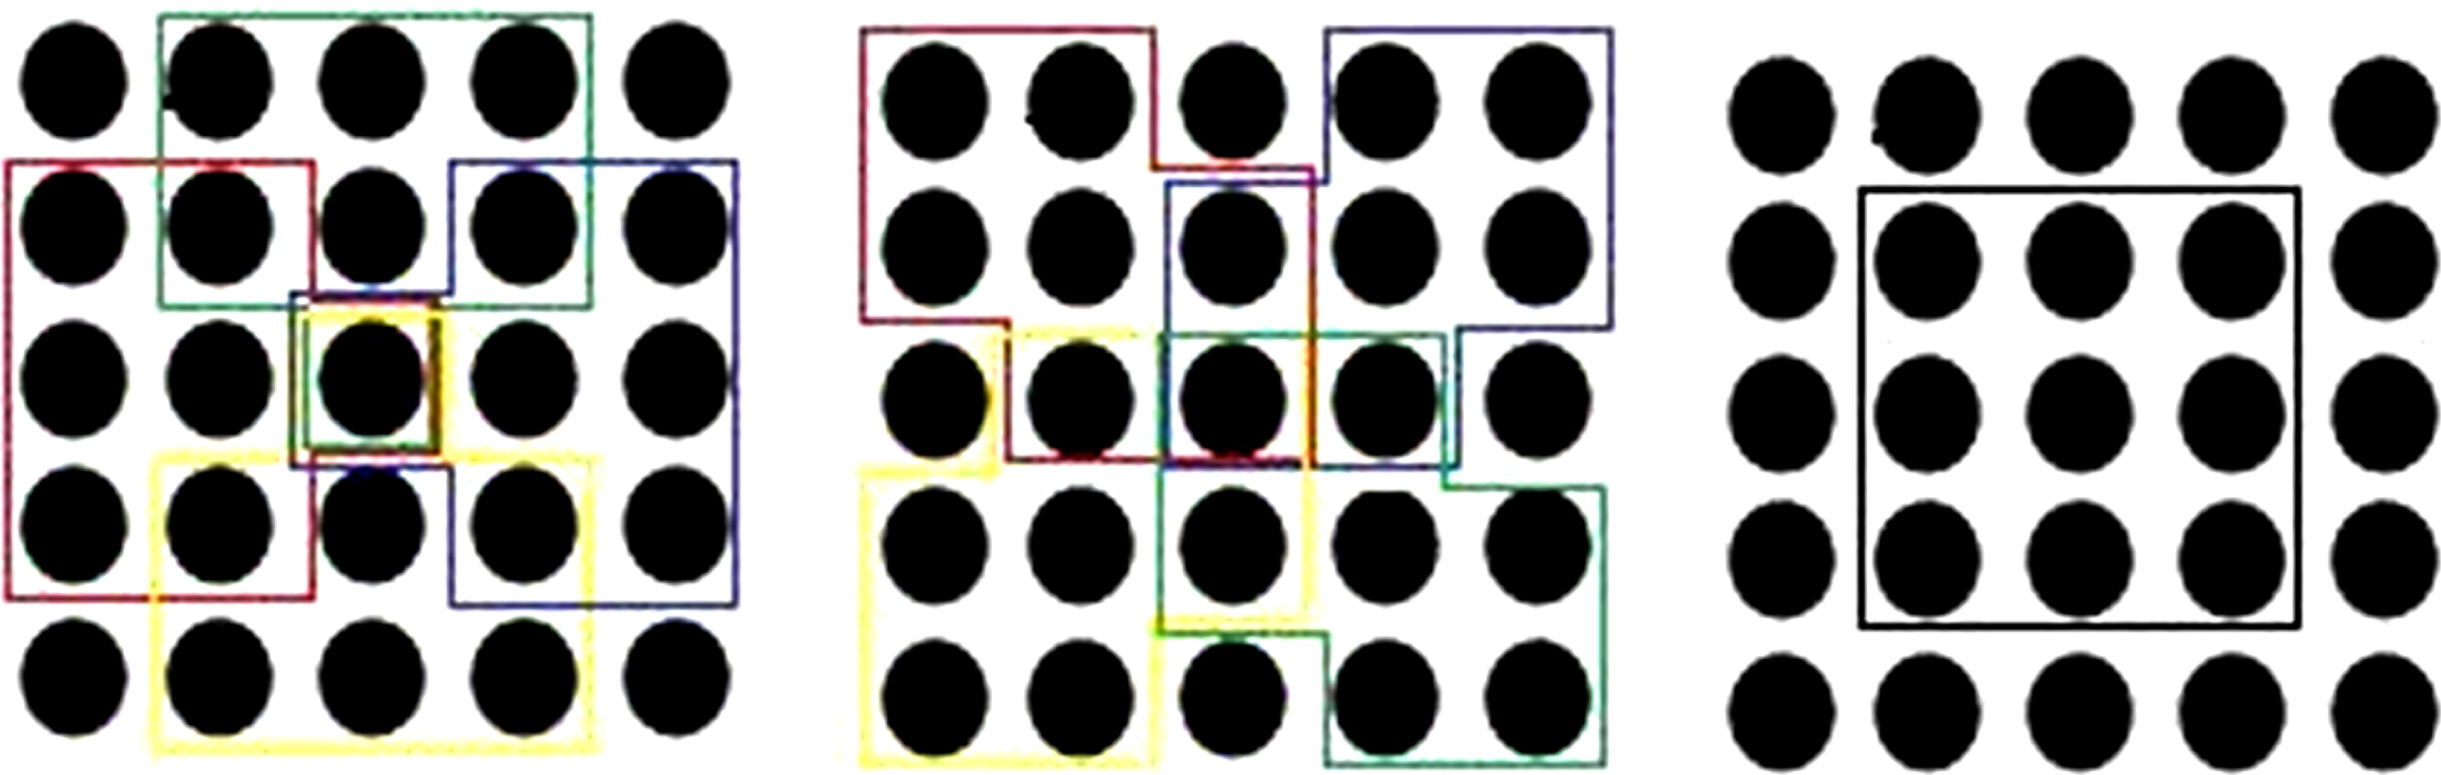
The skeleton is proposed back to the 1960s and is defined by Blum through the Grassfire Model, as shown in Fig. 13 below. Assume that each boundary point of the target figure is on fire at the same time, and the burning fire is continuously burning in all directions inside the target figure at the same speed until it goes out. Finally, the sum of the extinguished points can be understood as the skeleton of the figure.
Grass Burning Model and Max Ball Model.
The grass burning model is defined as follows:
Blum also give a definition of another type of Maximal Disks. The skeleton is the center of all the largest balls. The largest ball is a ball completely contained inside the figure and is not contained by any other balls contained inside the figure. The definition of the maximum ball model is as follows:
A skeleton is a set of curves that completely express the shape of an object in accordance with the connectivity of the original shape and the distribution of the topological structure. A more common method is to use the concept of the target’s central axis, that is, the points (pixel points) of the central axis are defined as those pixels that are equidistant from two points on the target boundary. According to the definition of the skeleton, the skeleton of the image can be calculated. The extraction of the skeleton simplifies the amount of information of the object, while ensuring the connectivity of the object and the integrity of the topology information. The specific algorithm pseudo code is as follows:
The Table 1 shows the algorithm flow. Some lines and curves through the skeleton of an image (ideally a single pixel width) are gotten, so the skeleton can provide the size and shape information of an image target. Therefore, skeleton plays an important role in digital image analysis, and image refinement is an important method for image recognition and target analysis.
Algorithm flow
Algorithm flow
Generate a star skeleton by detecting the outer. boundary points of the object. According to the characteristics of the crystal, first according to the following formula:
Find the center of gravity of the area surrounded by the edge of the moving silicon dioxide, followed by the following formula:
Find the distance from each boundary point to the center of gravity point, where N is the total number of boundary points in the silicon dioxide area, and A is the point on the target boundary; the discrete function is finally defined:
The local maximum of is used as an extreme point (local maximum). Among them, the local optimal solution algorithm is:
Step 1: To find the point from positive to negative;
Step 2: Find the inflection point, find the logical vector;
Step 3: Calculate the element difference before and after. The difference is positive, recorded as 1, and the difference is negative, recorded as -1;
Step 4: Calculate the element difference before and after again;
Step 5: The point where the logic is [false, 2, false] is the local maximum, and the logic is [false, -2, false] is a local minimum.
The skeleton function is obtained as following formula, and the skeleton is extracted through trigonometric functions and angle calculations.
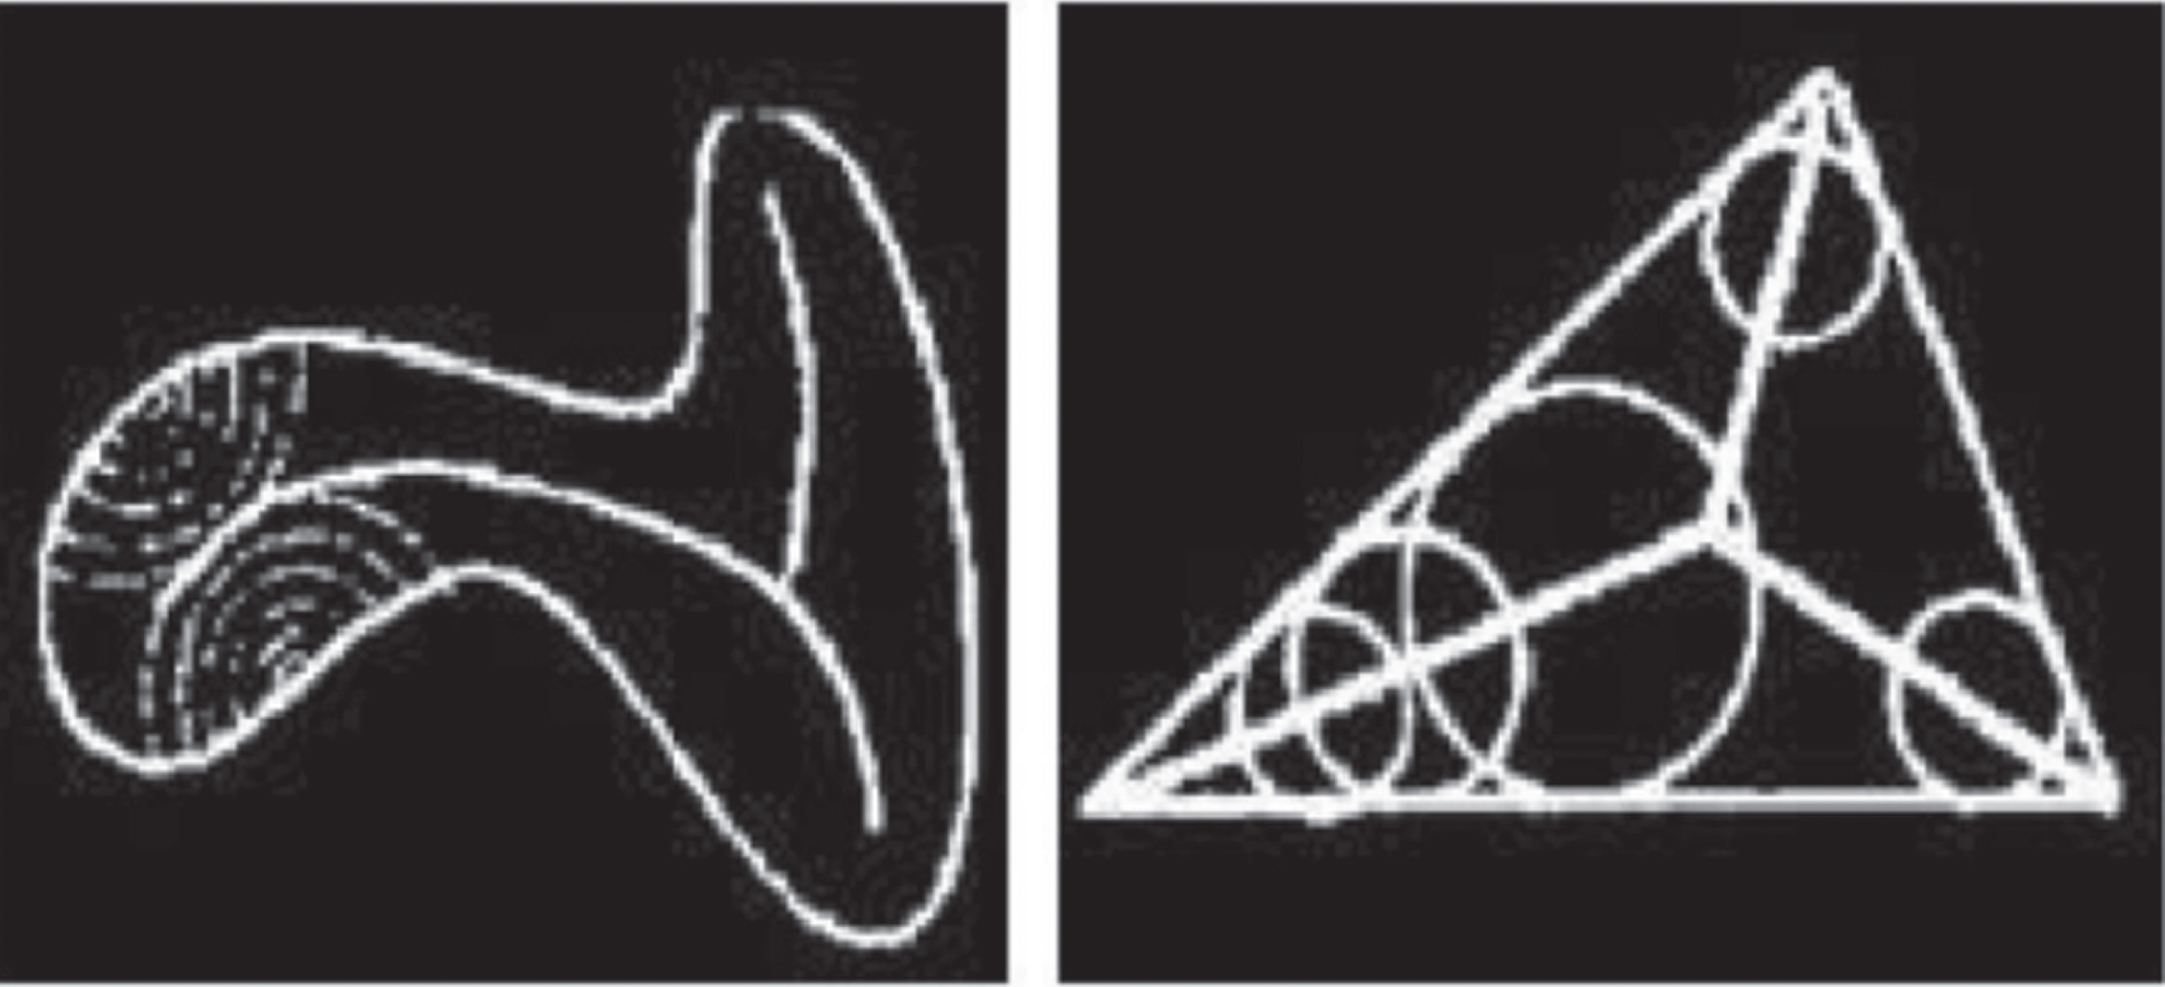
As shown in Fig. 14, the above four images are the target boundary pixel removal, the stimulus pixel removal, and the edge and skeleton images of the binary image. When removing the target boundary pixels, the target is not allowed to be separated, and the remaining pixels are combined into the skeleton of the image. After finding the edges of the binary image, it is necessary to perform a morphological closing operation, that is, first expanding and then corroding. The star skeleton extraction diagram is shown in Fig. 15 below:
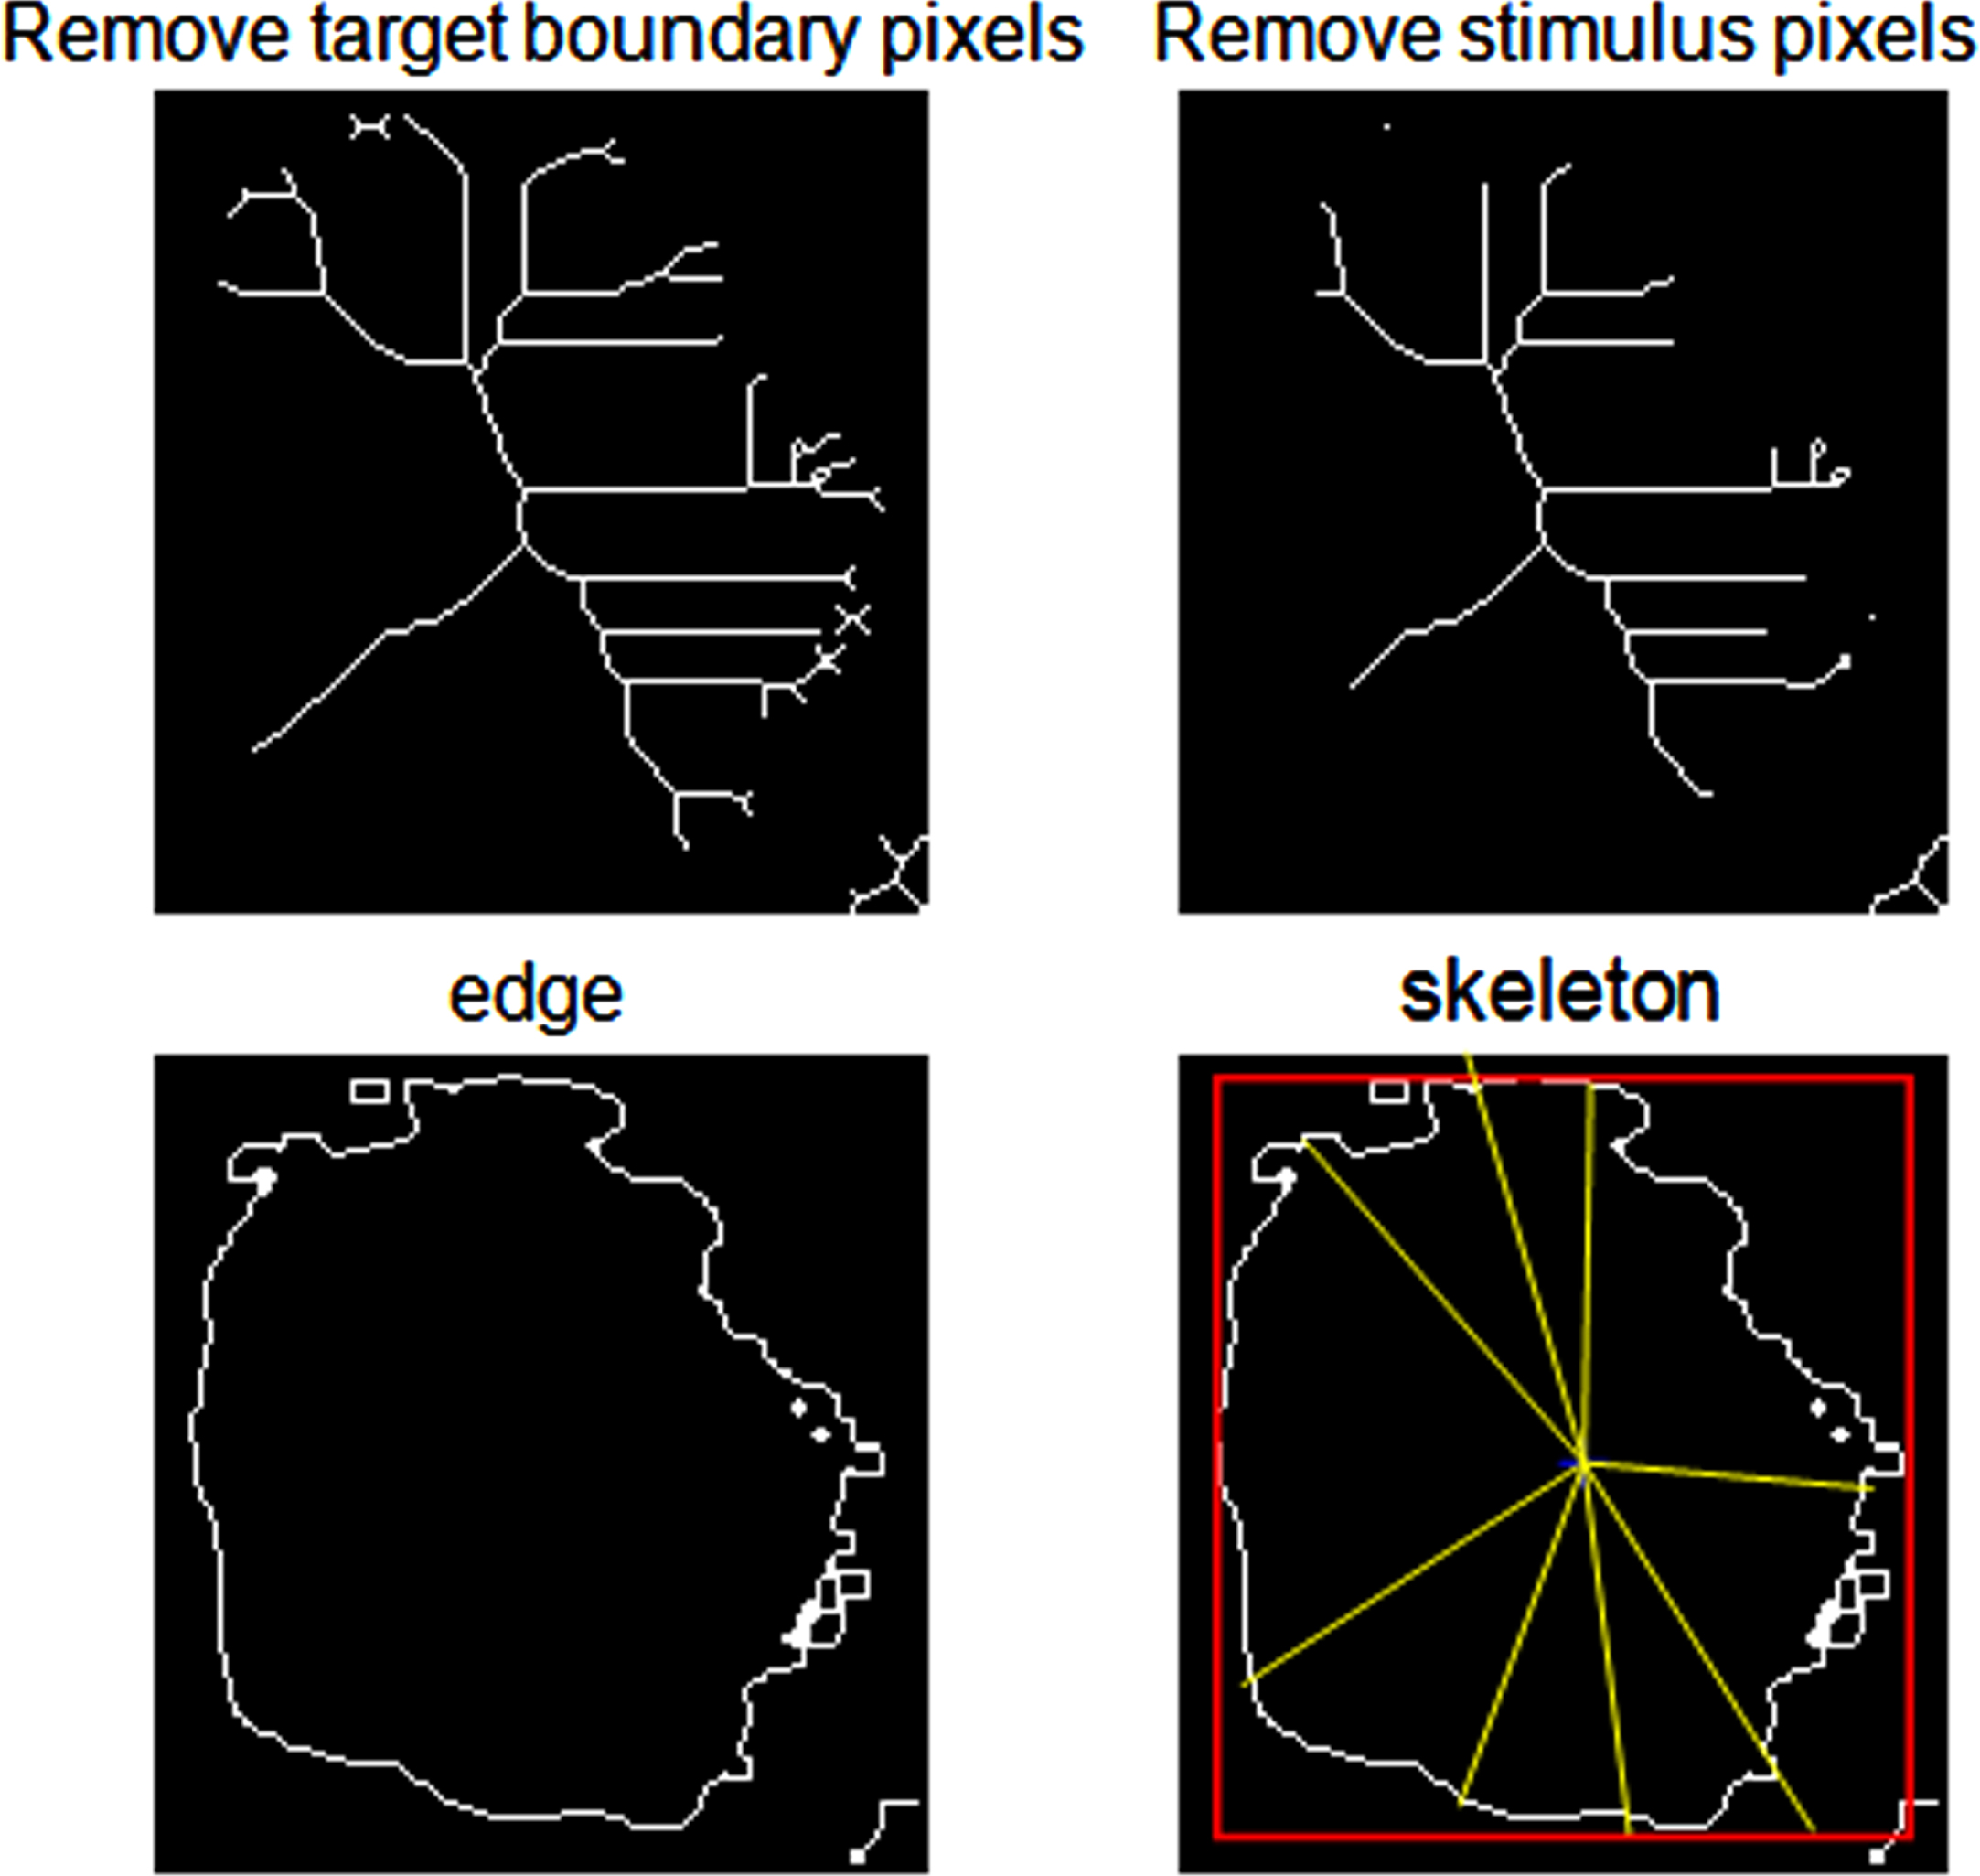
Star skeleton.
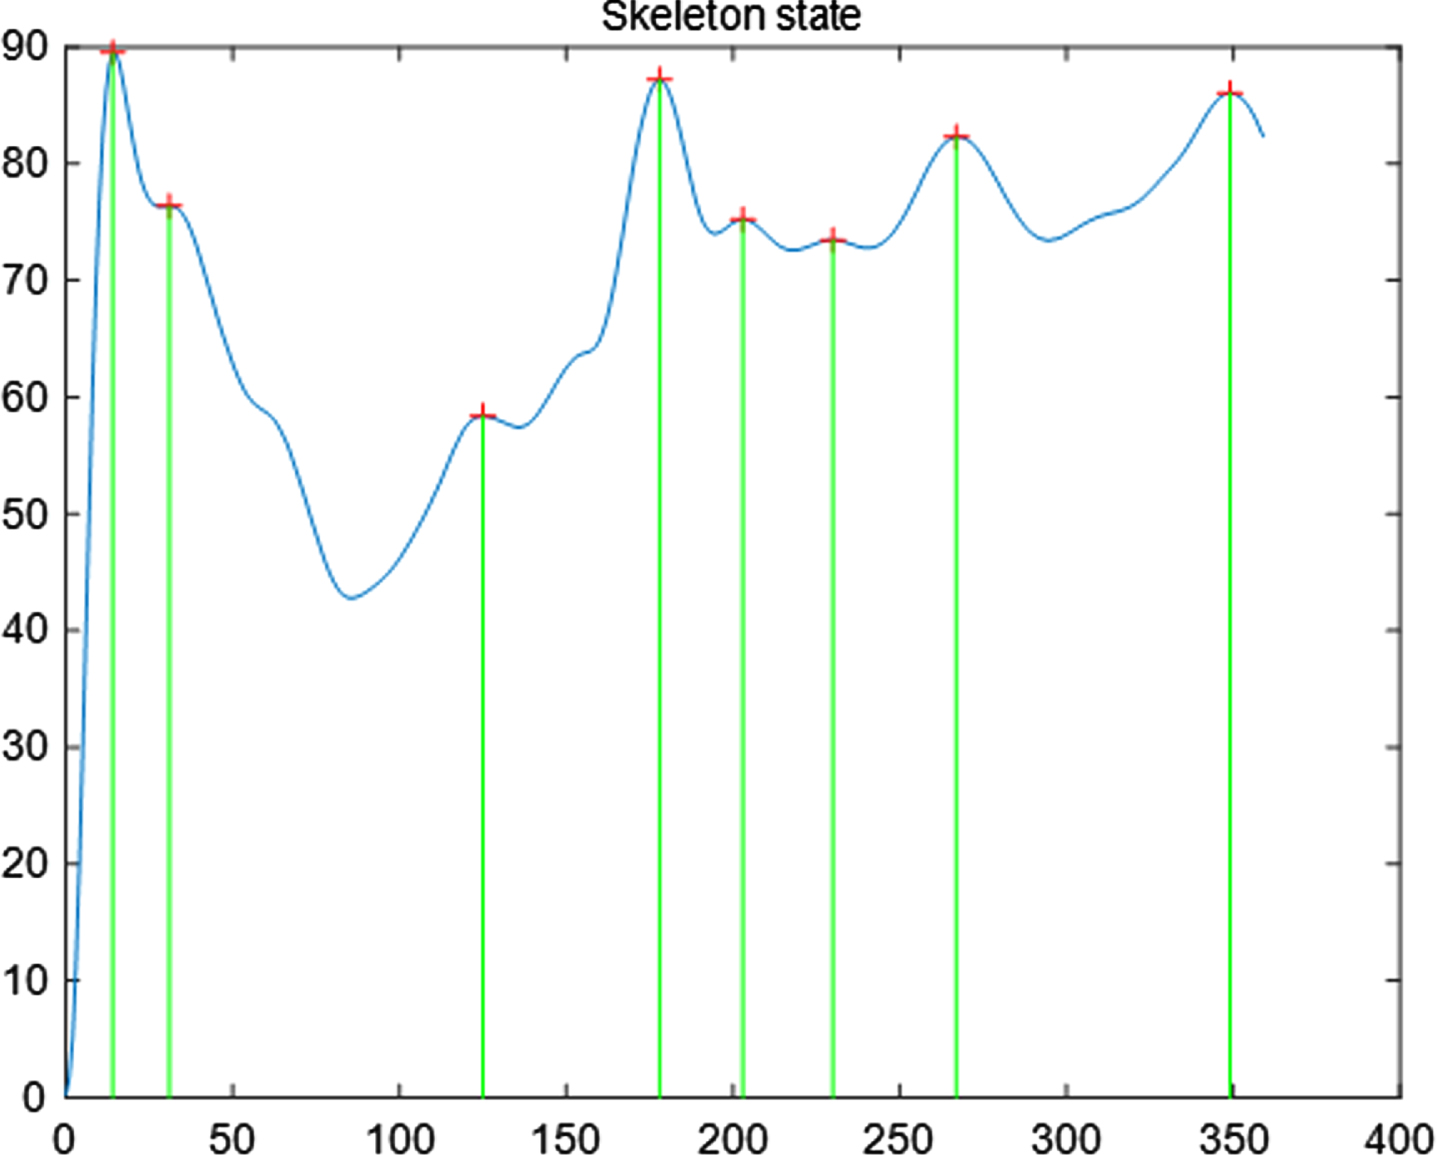
Skeleton state diagram.
In this section, using the obtained two-dimensional skeleton and the European-style skeleton growth algorithm based on the connectivity criterion to obtain depth information and expand it from two-dimensional to three-dimensional.
The general steps of the improved 3D skeleton extraction model method are as follows:
(1) Calculate the distance transform value of each voxel point in the model, and the coordinates of the nearest boundary point to it.
(2) Select the point with the largest distance transformation value as the skeleton seed point.
(3) Starting from the seed point, the neighborhood of the skeleton point 26 is judged according to the skeleton point judgment algorithm, and other skeleton points are gradually grown.
Skeleton width threshold determination
In order to ensure the connectivity of the skeleton, a width value is given to the skeleton. In the direction of the linear skeleton, voxel points within this width are used as the skeleton points of the model.
In three dimensions, as shown in Fig. 16, Q1 and Q2 is a line segment in space. Assuming Q1 (x1, y1, z1) and Q2 (x2, y2, z2), compare x = |x2 - x1|, y = |y2 - y1|, z = |z2 - z1| to calculate max(x, y, z) and min(x, y, z). If the z value is the smallest, then project Q1Q2 onto the XOY plane to obtain a projection line segment q1q2 with a length of D0, where p1p2 is the projection line segment of p1p2 on the coordinate plane with a length of δ0
Skeleton model diagram.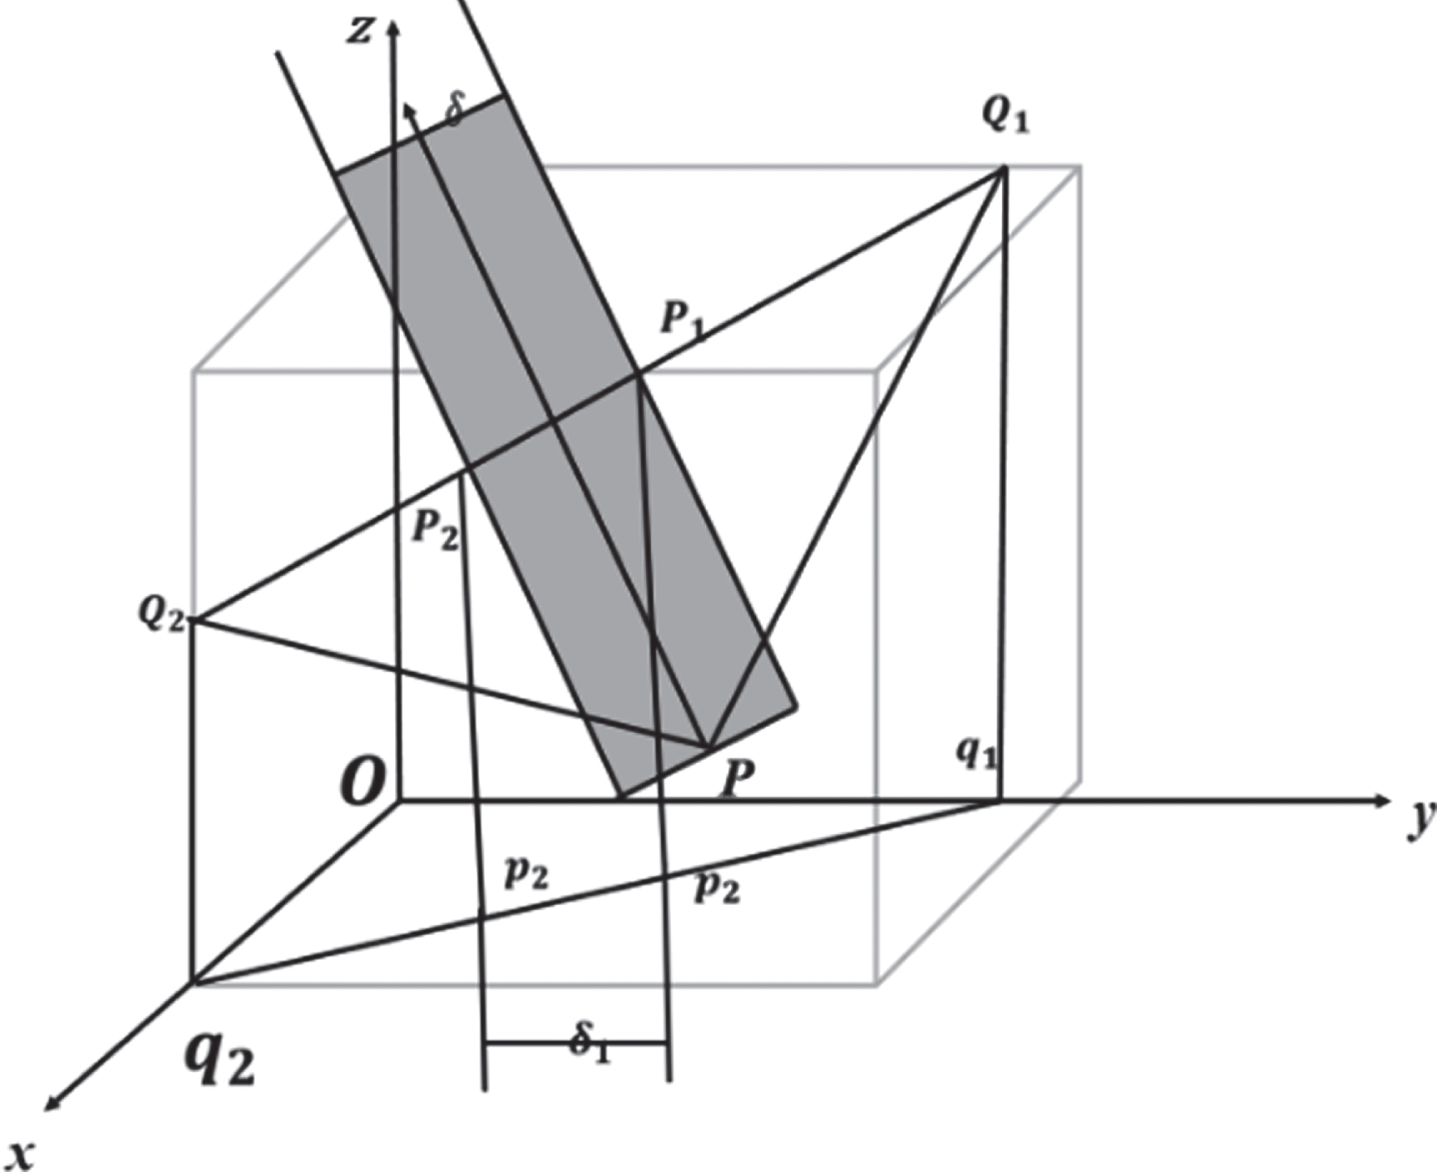
As shown in Fig. 17, constructing a right-angled triangle with line segment q1q2 as the hypotenuse of the triangle requires that the two right-angled edges be along the x and y axis directions. At this point δ0 depends on the larger of x and y, which is max(x, y, z).
Skeleton model diagram-2.
Corresponding to δ0 to get δ:
According to the above, the skeleton width threshold w can be derived as:
To determine whether a voxel point is a skeleton point, the distance transformation information of the voxel and its neighborhood is very important. In order to ensure the connectivity of the three-dimensional skeleton, the distance transformation value of the neighborhood of the skeleton point 26 and the coordinates of the nearest boundary point corresponding to the neighborhood need to be calculated.
The skeleton point judgment algorithm is as follows:
Step1: Set point P as the skeleton point to be judged, calculate the distance transformation d p of point P, and find the nearest boundary point Q according to it;
Step2: Find the 26 neighborhood 1 ≤ i ≤ 26 of point P, calculate the distance transformation value of P i , get the nearest boundary point of d P i , and calculate the distance dt (PQ i ) from point P to Q i ;
Step3: From this, 26 point pairs (Q,Q
i
) are obtained, and judged according to the skeleton point judgment criteria:
The process of growing the skeleton is an iterative process. The newly generated skeleton points in the previous iteration are defined as the growth frontier points of the next iteration. The task of each iteration is to grow one or more in the 26 neighborhoods of each growth frontier point. New skeleton points for this round. The skeleton growth algorithm steps are as follows:
Step1: According to the above-mentioned skeleton point judgment algorithm, determine the 26 neighborhoods of the skeleton seed points.
Step2: Neighbor points that meet the skeleton point judgment criteria are put into the stack.
Step3: Operate the stack vertices, find 26 neighborhoods of the stack vertices, and judge these neighborhood points. It is determined that the point pair formed by the nearest boundary point of the neighborhood point and the stack vertex satisfies the skeletal point judgment criterion. If yes, pop out of the stack and put it into the stack and enter Step 4; if not, go directly to Step 4.
Step4: Determine whether the stack is empty. If it is, the algorithm ends; if not, go to Step3.
Results
The centroid position and the motion trail of centroid of silicon dioxide
In this paper, the parameter limits are used to get the points to be counted and set the points, and the final boundary point is obtained. To facilitate the display of results, the detected edge points are marked with contour lines.
As shown in Fig. 18, the Hough transform circle detection method is used to obtain the position of the crucible, traverse and accumulate the center of the circle corresponding to all non-zero points, and consider the center of the circle. On the module vector of each point on the circle, that is, on the vertical line perpendicular to the point and the tangent line passing through the point, the intersection of the module vectors on these circles is the center of the circle. Using the bottom left corner of each image as the origin (0,0) to establish a rectangular coordinate system with a step size of 1 unit pixel.
Contour marker.
The data in Table 2 is the parameters of the circle that is detected. By finding the center of these cir-cles and making a final judgment based on the num-ber of intersections of the modular vectors on the "center" and the threshold. ROI extraction is then performed based on the detected crucible circle area. Optimize the entropy of the target image, and use Wiener filtering and image segmentation calculation with the largest inter-class variance to obtain the physical position of the particles of the silicon dioxide crystal in the molten state in each image.
Parameters of the circle label t2
As shown in Table 3, the location of the centroid coordinates of the silicon dioxide in each image was detected. By saving the coordinates of the centroid each time and then connecting them with lines, the motion track of the centroid is obtained, as shown in the following Fig. 19:
Coordinate position label t3
As shown in Fig. 19, take the first image as the time 0s. At 0-100s at this stage, the melting phe-nomenon is obvious but the movement trajectory is not obvious, so zoom in to show it.
Motion track of center of mass.
Because the time interval of each trajectory point is equal, the figure shows that the two points that are farther away from each other are between 80s and 111s. According to the actual situation, it can be known that the silicon dioxide has a low quality in the later stage, so the melting is unstable and it is easy to scatter.
In this part, three indicators are established that represent the contour features of the silicon dioxide edge during the silicon dioxide melting process, including shape, perimeter, and area.
Edge Contour Feature Index–Shape Extraction
The shape is a two-dimensional image. The Fig. 20 below is the fused silicon dioxide shape extracted from the images with the numbers 497, 512, 542, and 569. It is can seen that the shape of silicon dioxide is unstable and the area is smaller and smaller.
The changing trend of the shape of silicon dioxide.
The perimeter can quantify the range of the image (fused silicon dioxide). According to the following formula, the perimeter of the fused silicon dioxide range is calculated by a four-neighbor search algorithm:
Step1: Read in the processed binary image I and obtain the image size M × N;
Step2: Use the lower left corner of the image as the origin x = 0, y = 0 to establish a rectangular coordinate system;
Step3: traverse all pixels x ∈ 1, 2, ⋯ , M ) , y ∈ (1, 2, ⋯ , N);
Step4: Determine the four neighboring pixels of the pixel, that is, whether the sum of I (x + 1, y), I (x - 1, y), I (x, y + 1), I (x, y - 1) is greater than 0 and less than 4, and if yes, go to Step5;
Step5: perimeter variable C = C + 1;
Step6: C is the perimeter of the fused silicon dioxide image after the traversal Expressed in mathematical formulas:
In formula, C is the actual perimeter obtained by the solution, M × N is the pixel size of the image, and α1 is the weight coefficient of the image to the actual environment. Where Ii,j is the perimeter marker value obtained by the search algorithm, and the assignment strategy is as follows:
Perimeter indicator change. Perimeter indicator change label t4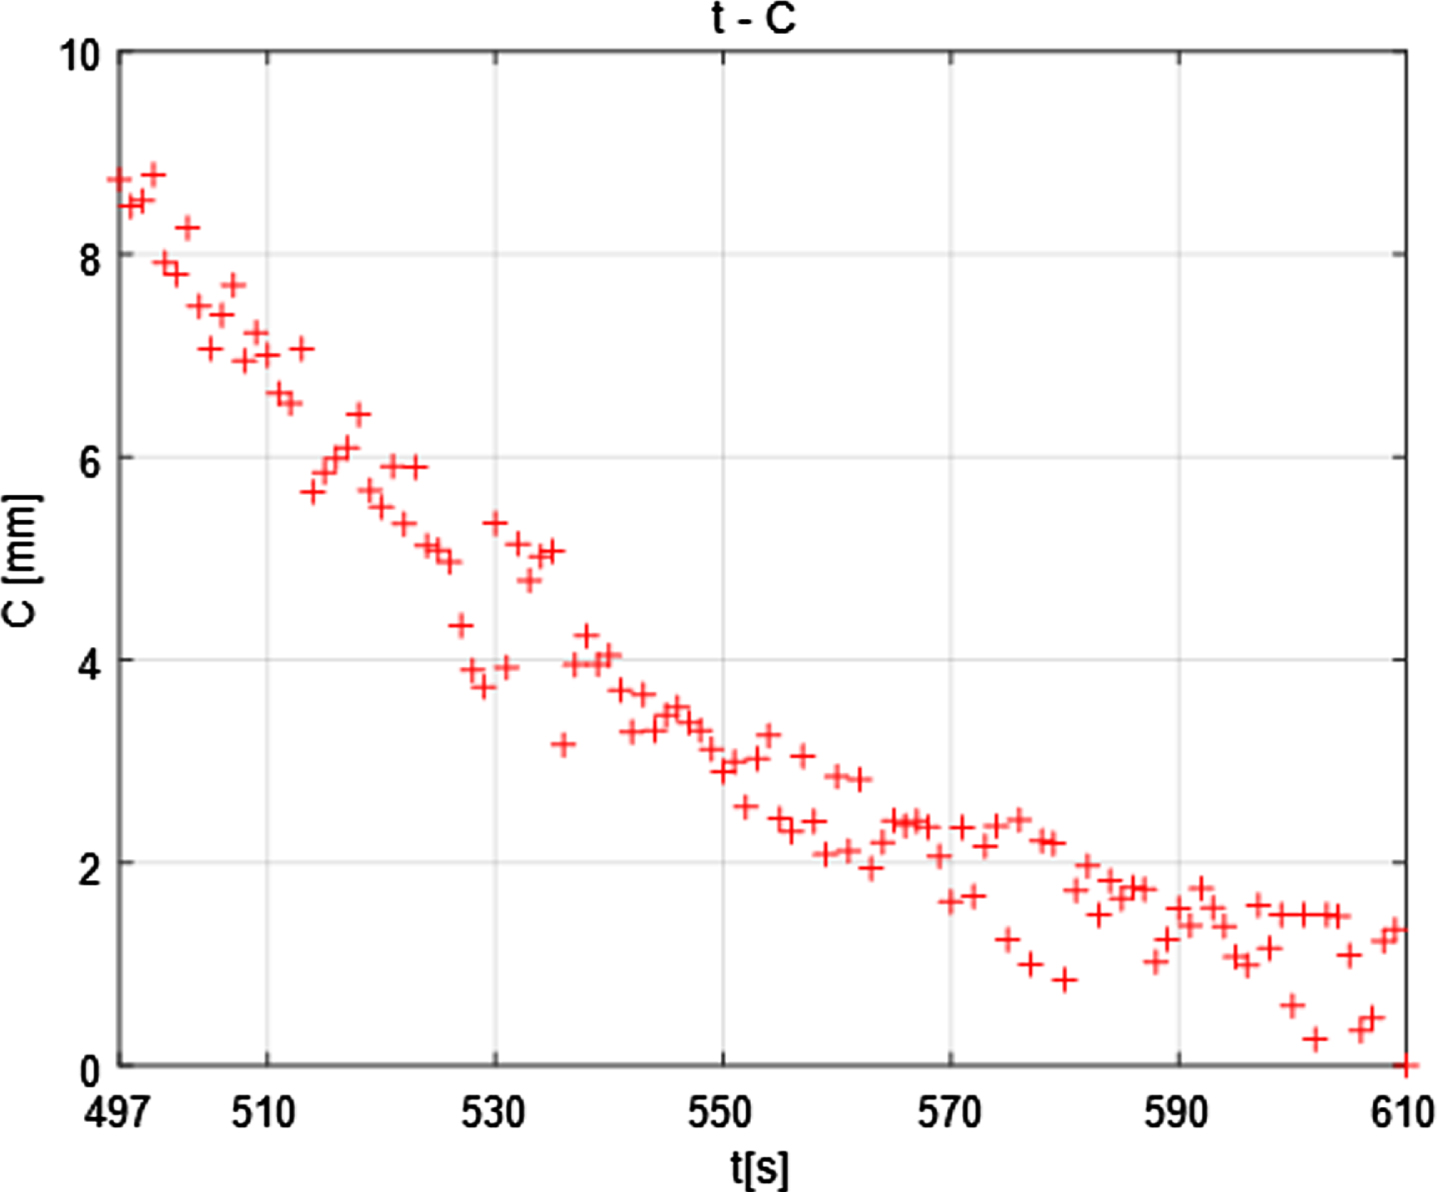
The area can quantify the size of the image (fused silicon dioxide). According to the following formula (39), the area during the quartz melting process is calculated from the pixels:
After determining the conversion weight coefficient α2, the area of fused silicon dioxide at each moment is calculated, as shown in the following table:
As shown in Table 5, it is can seen that the area change of silicon dioxide from 497s to 605s has been reduced from the first 6.0718 m2 to the last 0.0275m2, a total reduction of 6.0443m2. In order to show the change trend more intuitively, using a scatter plot to show the results, as shown in Fig. 22:
Area index change
Area index change.
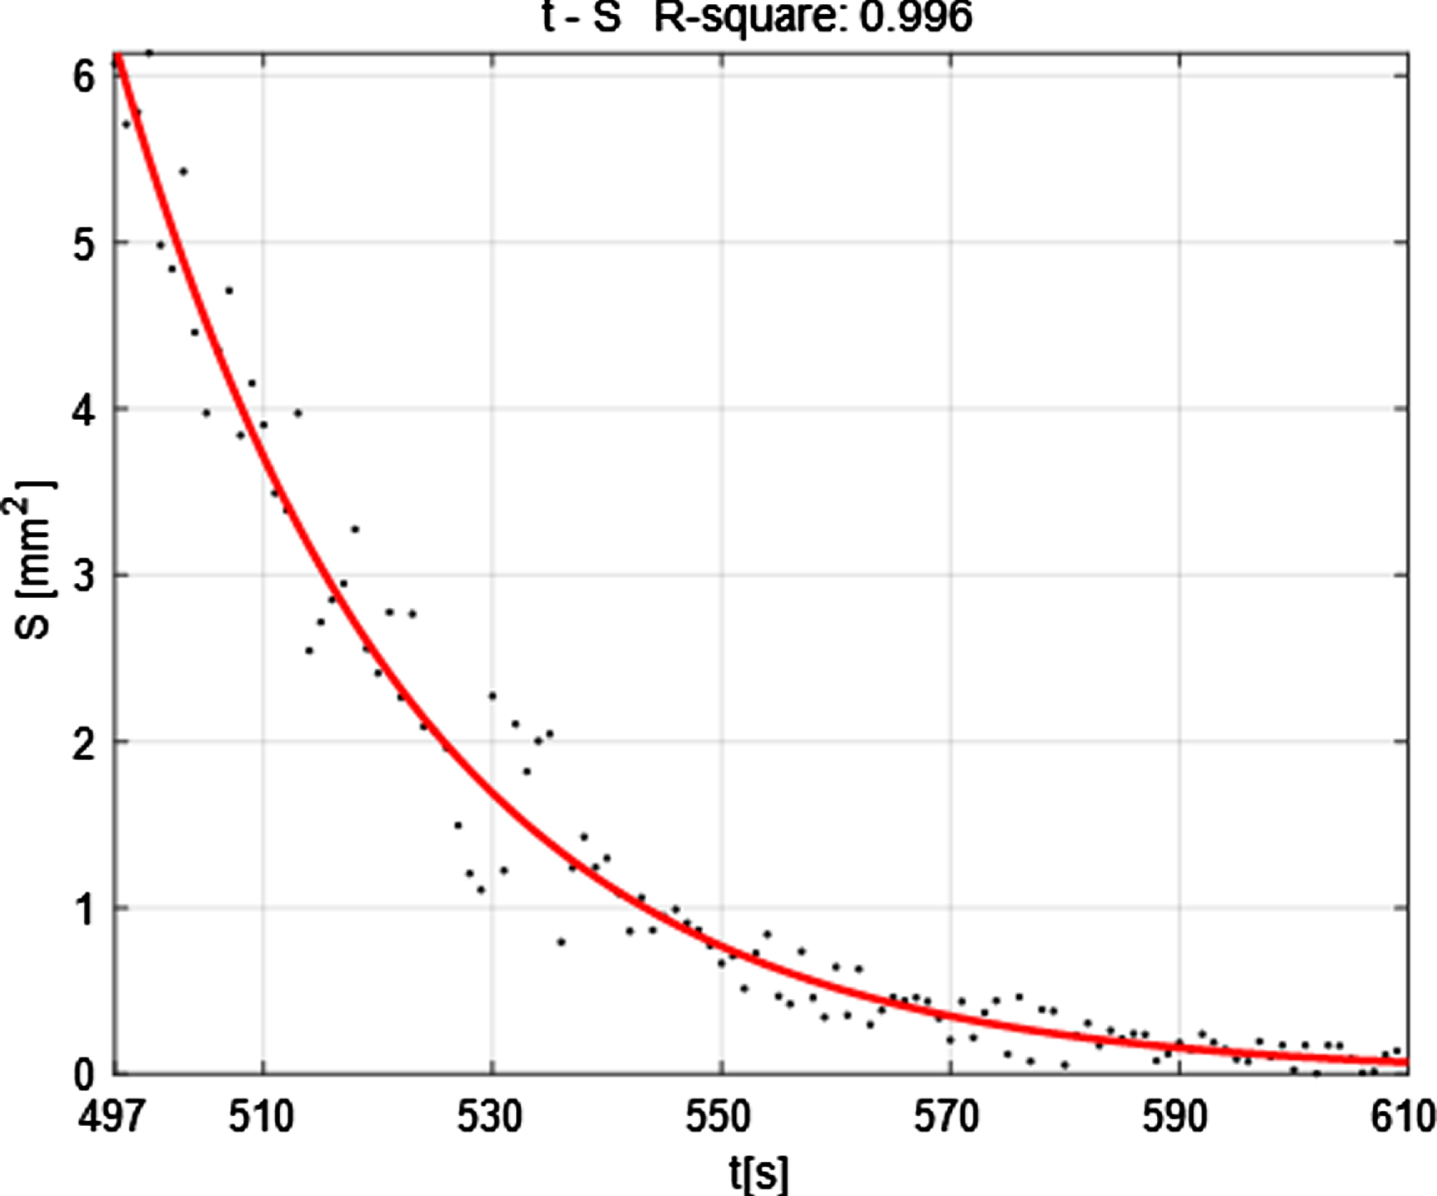
The function of the melting silicon dioxide area S over time t is obtained by fitting as:
In order to verify the fitting effect, it is necessary to establish a certain evaluation standard to measure its pros and cons, using the average relative error MRE (Mean Relative Error) as a test index.
In formula (42), S Mi is the measured area at time i; S Pi is the theoretical area at time i, and n is the number of measured values.
It is calculated that the average relative error MRE is 0.004%, and the fitting effect is good.
The volume of the obtained three-dimensional skeleton is estimated, that is, the volume of the crystalline silicon dioxide. Here it is defined the actual melting rate of silicon dioxide:
The melting rate corresponding to the moment is calculated as follows: As shown in Table 6, it is can sene that the melting rate of silicon dioxide changed from 497s to 605s, which decreased from the first 5.2327mm3 to the last 0.1463mm3. Although there is an undulation in the middle, the overall trend is still downward. In order to show the change trend more intuitively, using a graph to show the results, as shown in Fig. 23 below:
Area index change
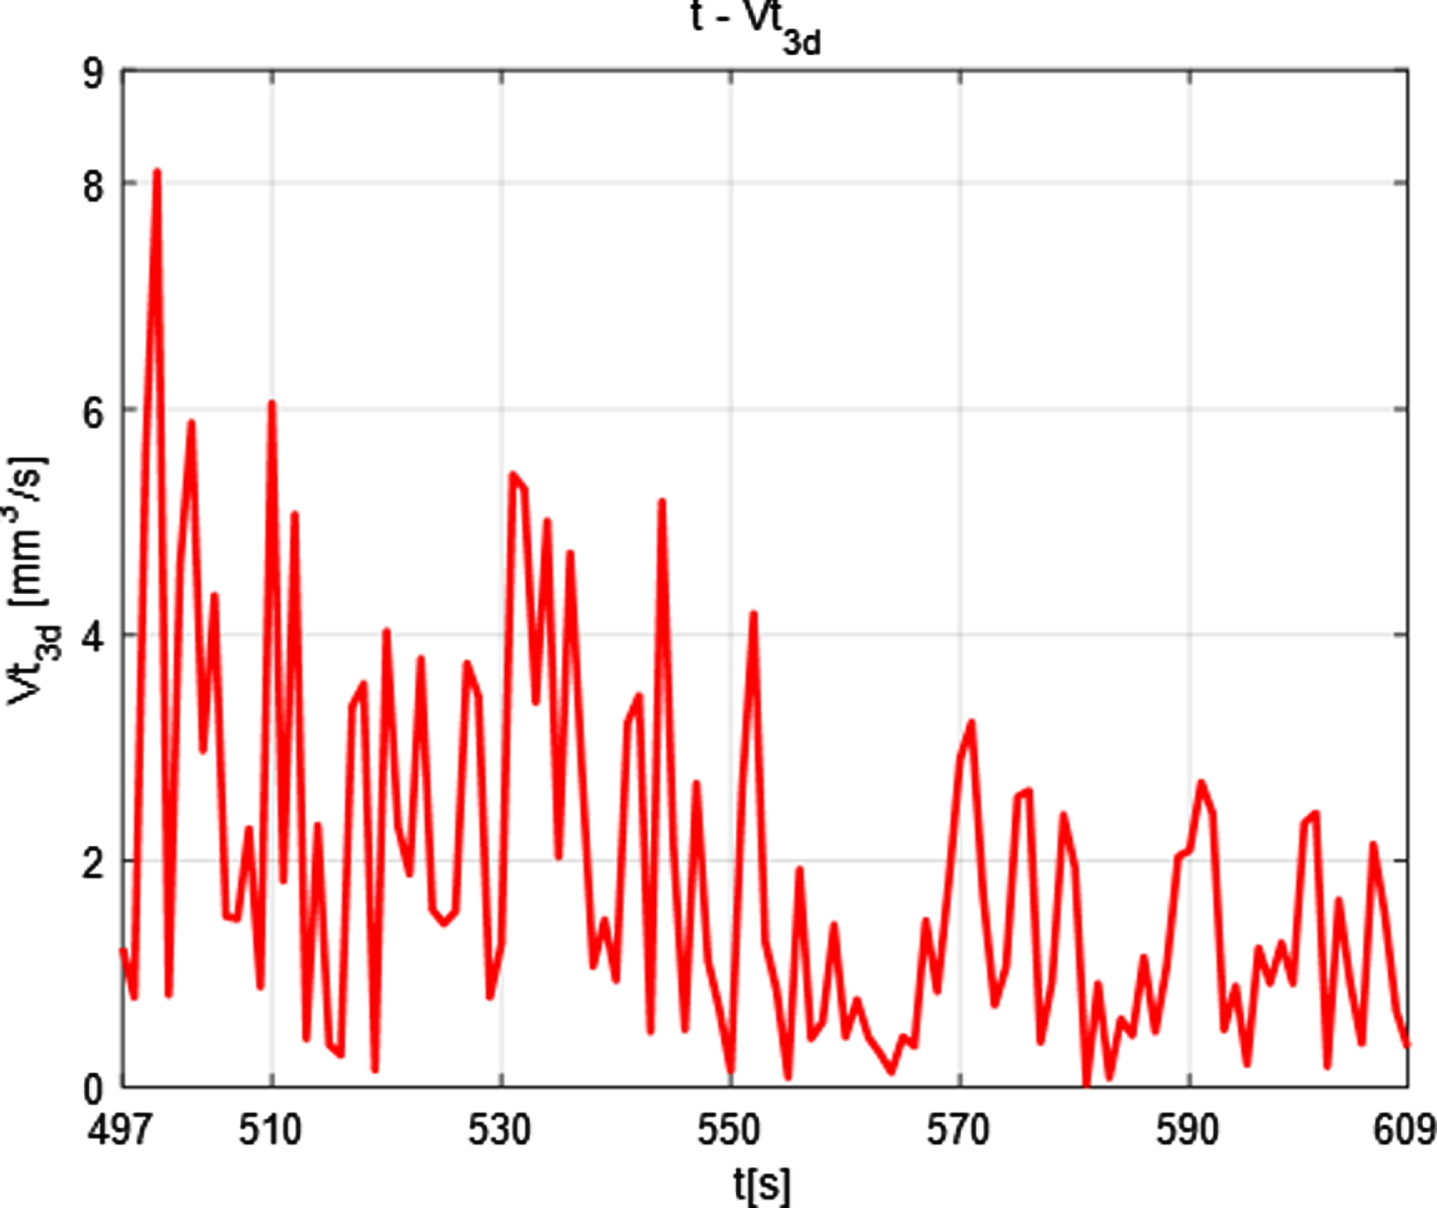
Melting rate trend.
As can be seen from the Fig. 23, through analysis, the early stage silicon dioxide has a large volume and a large mass, so it is unstable and has a fast melting rate. In the later stage, the quality is small, and the melting rate is slow, which conforms to the chemical mechanism. The results are reasonable.
In order to verify the results, simplified the actual melting rate of fused silicon dioxide to two dimensions and analyzed the changes in the area of fused silicon dioxide extracted in section 4.2.
The melting rate at the corresponding moment is calculated by the area change function in the section 4.2 fitting as shown in Table 7 below:
Melting rate
According to the analysis, the same tendency as the change in the melting rate obtained from the volume, the early silicon dioxide has a large volume and a large mass, so it is unstable and the melting rate is fast. The late quality is small and the melting rate is slow, but the overall change value is small, which is consistent with the chemical mechanism. The results are reasonable.
As shown in Fig. 24, the red line indicates the change of area with time, and the blue line indicates the change of melting rate with time. Where the transformation function of the melting rate is:
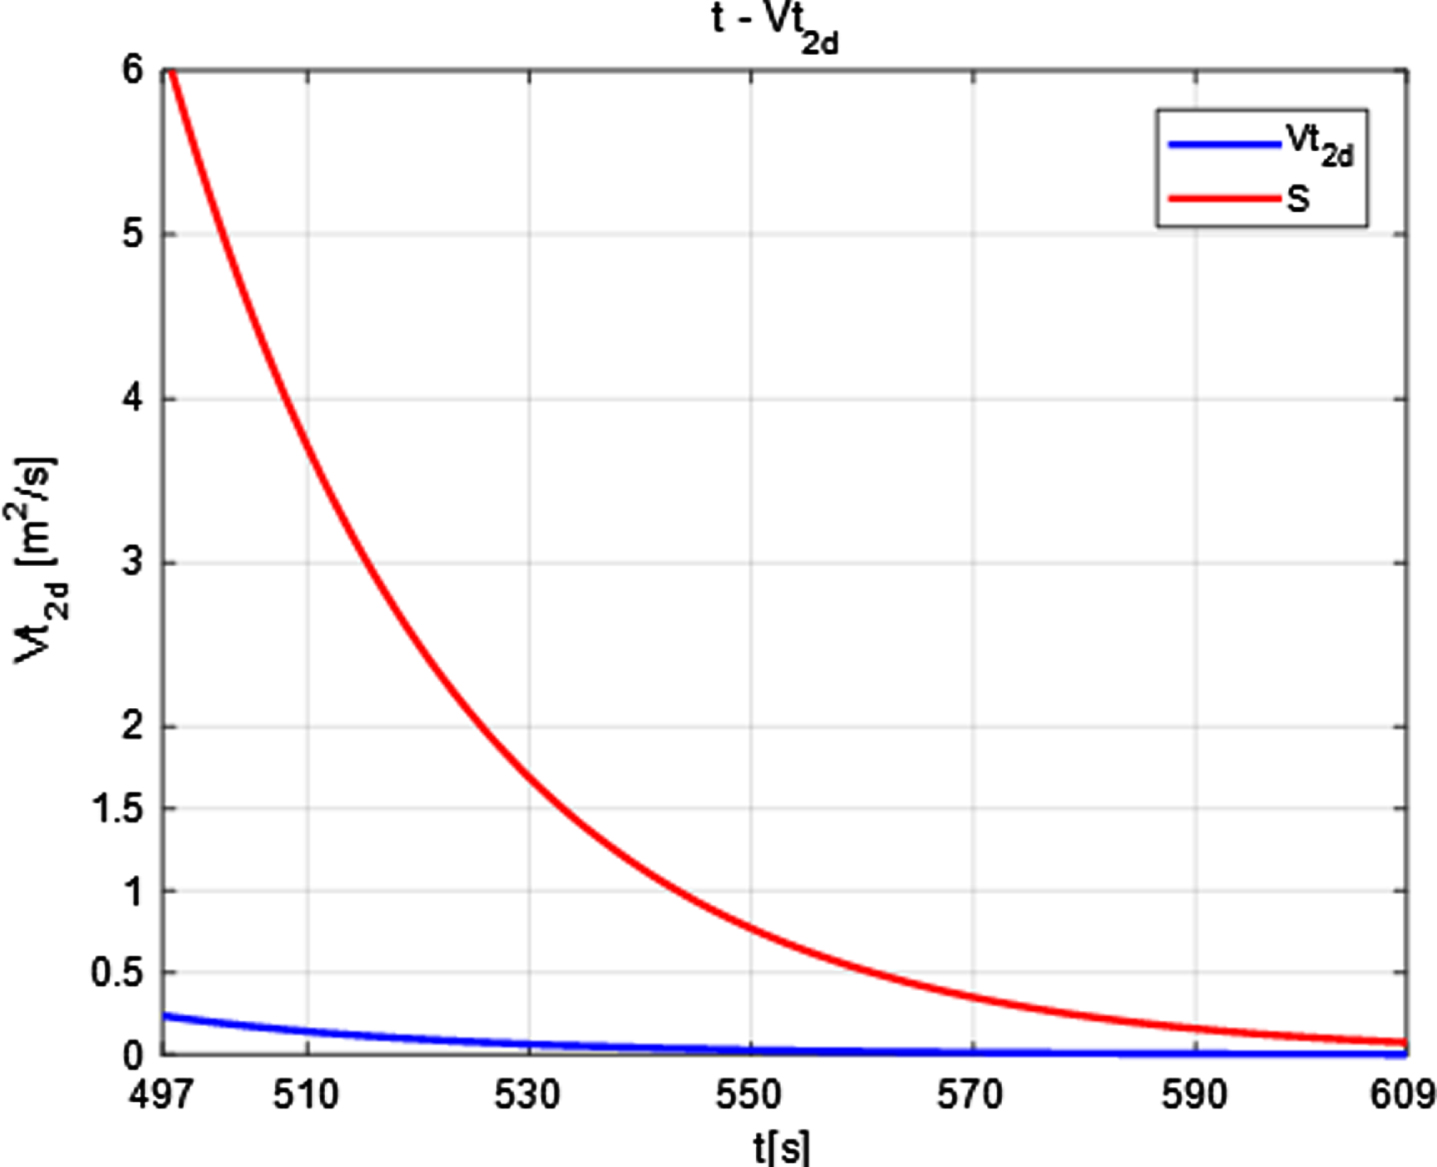
Trend of melting rate.
The silicon dioxide melting rate calculated according to the fitted relationship is shown at the end of Section 7.3 of the article. In order to test the model, the melting rate at the corresponding moment is recalculate based on the data calculated by the model, as shown in the following Table 8.
Test the Models
Test the Models
According to the analysis, the same tendency as the change in the melting rate obtained from the volume, the early silicon dioxide has a large volume and a large mass, so it is unstable and the melting rate is fast. In the later stage, the quality is small, and the melting rate is slow, which conforms to the chemical mechanism. The results are reasonable and the changing trend is in line with the actual situation. Therefore, the model test results are good as shown in Fig. 25.
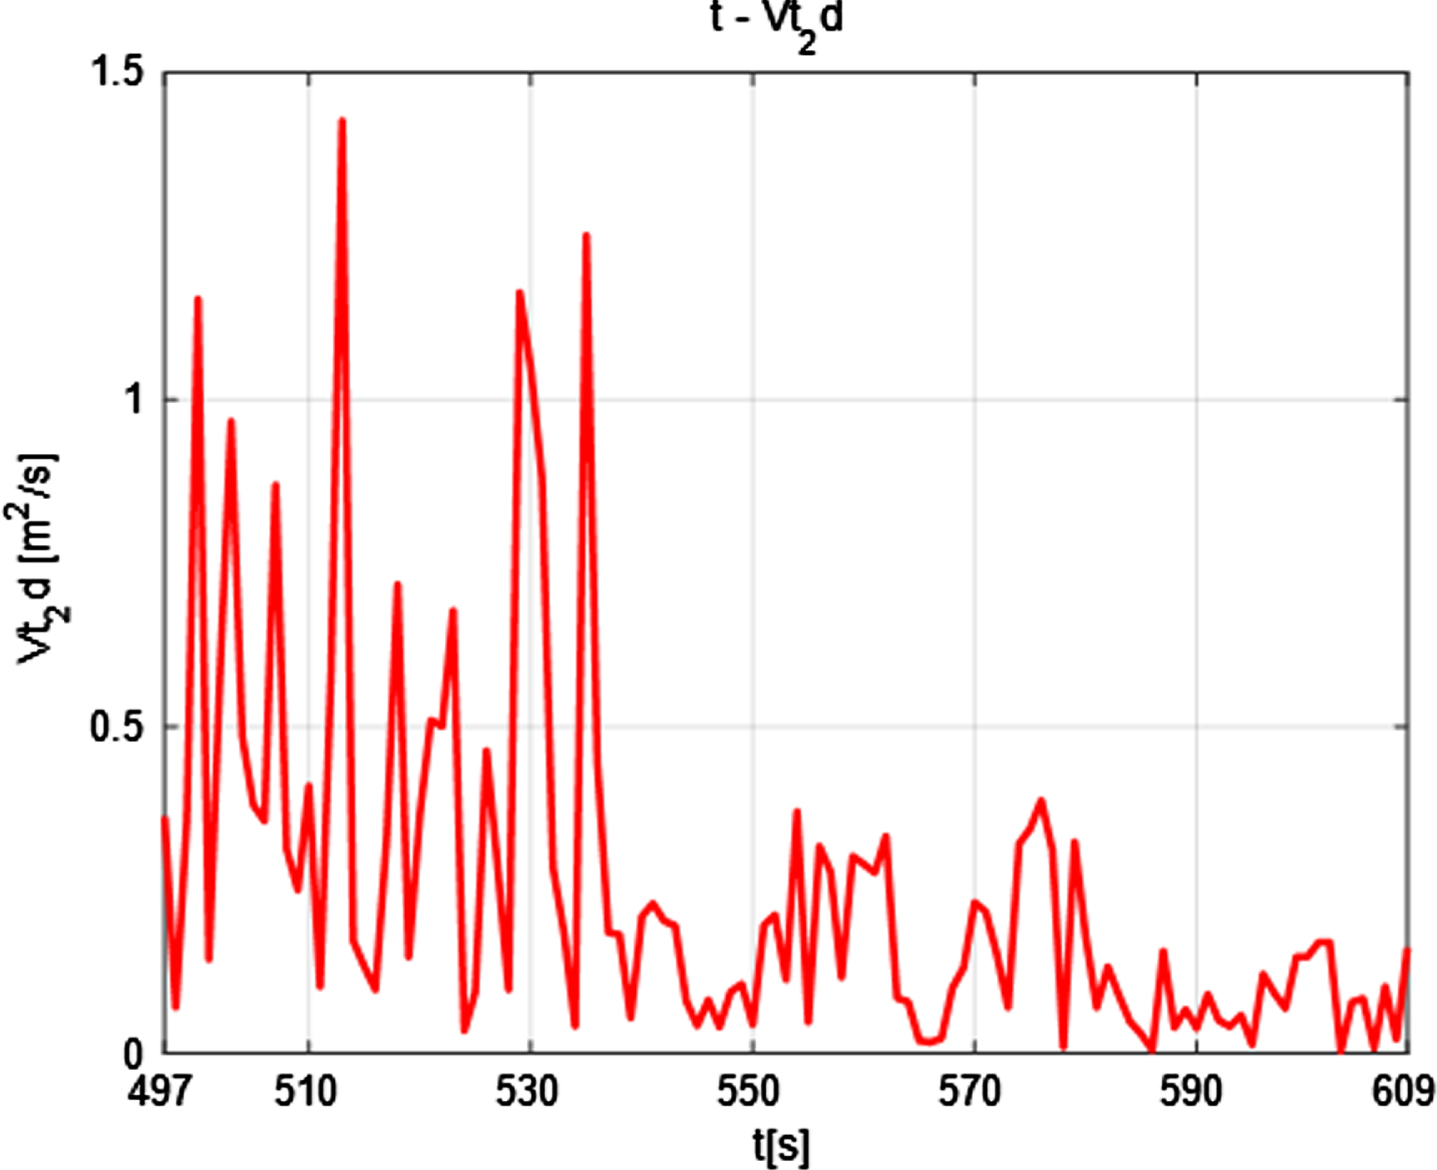
Test the Models.
In this paper, the Hough transform algorithm is used to detect circles. A strong weighted distance centroid algorithm is used to obtain the centroids of 114 images of silicon dioxide and visualize the motion trajectories of the centroids. The contour extraction of silicon dioxide is performed using Snake active contour algorithm combined with Sobel operator. Restrictions obtained from image data are bottom-up and various prior knowledge are top-down, making image data, initial estimates, target contours, and knowledge-based constraints unified into one image feature extraction process. It is improved connectivity criteria based on European skeleton extraction algorithm and extended it to three dimensions. The resulting 3D skeleton is more accurate and ensures connectivity. From the skeleton data, the volume of silicon dioxide and determine the actual melting rate parameter formula are estimated, through numerical simulation calculation to obtain the silicon dioxide melting rate at each moment.
Strengths and Weakness
The Hough transform has a long history of research and a strong theoretical basis, with high stability and accurate results. In the Hough gradient method, Sobel derivatives are used to calculate local gradients. In most cases, it may generate some noise in the output. Snake’s active contour algorithm has the smallest time and space complexity and has a poor implementation effect. The skeleton extraction algorithm needs to introduce saddle points to solve this problem, but in three dimensions, the position of the saddle points is difficult to determine and the calculation cost is high. There are still many areas for improvement in the model.