
Abstract
This work deals with educational text mining, a field of natural language processing applied to education. The objective is to classify the feedback generated by teachers in online courses to the activities sent by students according to the model of Hattie and Timperley (2007), considering that feedback may be at the levels task, process, regulation, praise and other. Four multi-label classification methods of the data transformation approach - binary relevance, classification chains, power labelset and rakel-d - are compared with the base algorithms SVM, Random Forest, Logistic Regression and Naive Bayes. The methodology was applied to a case study in which 11013 feedbacks written in Spanish language from 121 online courses of the Law degree from a public university in Mexico were collected from the Blackboard learning manager system. The results show that the random forests algorithms and vector support machines will have the best performance when using the binary relevance transformation and classifier chains methods.
Introduction
The online learning and education management systems industry is one of the fastest growing today [15]. In Mexico, online education has also shown an increase as a study alternative [3]. In online education, feedback is essential to show and make sure that the learning process is taking place [14].
Feedback is a product resulting from the review and analysis by the teacher of the activity, contribution or project sent by the student(s) [14]. It is the ability that the teacher develops when sharing specific information with the student about their performance in order to reach their maximum learning potential [21].
Feedback is one of the most important factors in- fluencing student success [2, 17]. It is important for the improvement of student performance and the achievement of learning objectives, in addition to being the central part of the formative evaluation, so it must be constant, clear, timely, sufficient and pertinent [18]. It is the means that allows the student to identify what is needed to achieve success according to what is expected of him [14]. It helps students to identify and solve their misconceptions with which performance is improved [6].
In online education, feedback plays an important role because of the way they work, in which students submit their assignments electronically and usually receive feedback from it. Thus, as soon as the teacher sends the feedback in the first attempt at a formative assessment, the student is expected to use it to make adjustments to the activity in order to achieve expectations and learning objectives [14].
In online education, it is an essential practice as it helps to scaffold learning and establishes a connection between teacher-student distance [20]. Research on feedback focuses on trying to assess when feedback is effective to determine if and how to improve it [8]. An effective feedback is one that allows closing the gap between current and expected performance of the students [11, 20].
In the Hattie and Timperley model [11], it is established that effectiveness depends on four levels at which feedback can operate: the task level, the process level, the regulatory level and self level or praise. Based on this classification, Hattie and Timperley [11] point out that the most effective feedbacks are those located at the process level and regulatory level, that feedbacks at the task level are only effective if combined with those from process level or regulatory level and that self or praise level are not significant for learning.
In this work, a methodology is shown to classify the feedback generated by a teacher to the activities sent by students in online courses according to the levels proposed by the Hattie and Timperley model [11] to distinguish between messages that are in the Task, Process, Regulatory, Praise and Other level where those located in Other are messages that are not located in any level.
For the classification, four multi-label classification methods of the data transformation approach are used, which are: binary relevance (BR), classifier chains (CC), label powerset (LP) and rakel-d since a feedback can be located in several of the levels at the same time. For each method, four base algorithms are used: support vector machines (SVM), random forest (RF), logistic regression (LR) and naive bayes (NB). At the author’s discretion, in this work, recommendations are made on the data transformation method and base algorithm to be used to automatically classify feedbacks using the model of Hattie and Timperley [11].
The work is organized as follows: in section 2 the preliminaries of the feedback model of Hattie and Timperley and multi-label classification are given, section 3 provides details on the applied methodology. The results and discussion are in section 4 followed by the conclusions and future work in section 5.
Preliminaries
In this section, we present the preliminary work that describes the feedback model proposed by Hattie and Timperley [11] and the multi-label classification.
Hattie and Timperley feedback model
In the literature, there are several proposals to determine the effectiveness of feedback, Uribe and Vaugman [20] point out that there are four types: corrective, which focuses on requirements and content; epistemic that clarifies or explains through indications and questions; suggestive including tips or ideas for improvement; and epistemic more suggestive that includes questions, indications and ideas for the scaffolding of learning. Shute [22], proposes to classify them into: result, correct and elaborate answers. Hattie and Timperley [11] point out four levels in which feedback can be found: task, process, self-regulation and praise, the first three being the ones that produce an improvement in learning.
The Hattie and Timperley model [11] is the most referenced and has been used for the development of applications that offer feedback at a specific level [2], analysis of comments [1, 17]; and as a stra- tegy to improve teacher performance [9].
The Hattie and Timperley model [11] assumes that the purpose of feedback is to reduce discrepancies between what a student has understood or performed and the desired objective.
The authors argues that there are several ways to reduce the gap between what is understood and what is expected, that feedback is not always effective in improving learning, and that those that are, answer three questions: Where am I going? How do I arrive? What comes next? The questions work together at the task level, process level, regulation level and self level, where the level to which the feedback is directed influences effectiveness.
The levels proposed in the model are: (1) task level, which are comments that may be about the task or product indicating whether it is correct or incorrect or includes indications to acquire more different or correct information, (2) process level that are comments directed to the process used to create a product or complete a task, directed to the information processing or learning processes that require understanding or completing the task, (3) regulation level that are comments directed at self-regulation, includes strategies to improve self-evaluation or confidence to commit more to a task and (4) self level, which are comments directed to the self that are not related to the performance of the task. Examples of feedbacks at each level can be found at [11].
Multi-label classification
For the automation of feedback classification accor- ding to the feedback model of Hattie and Timperley, multi-label classification techniques were used.
The multi-label classification is a prediction task in which each of the instances has associated a vector of outputs instead of a single value as is the case of the traditional classification. The size of the vector is adjusted according to the number of different labels in the data set, where each element of the vector will be a binary value indicating whether the corresponding label is relevant to the example or not. Several tags can be active at the same time [7].
Multi-label classification can be approached from different points of view: data transformation, adaptation of methods and assembly of classifiers, Herrera et al. [7], establish that the first is based on transformation methods that applied to original multi-label data sets are capable of producing one or more binary or multiclass data sets, once transformed, binary or multiclass classifiers can be used to process them.
The second seeks to adapt existing algorithms so that they can deal with multi-label data sets by produ- cing several outputs instead of one.
The third one combines adapted algorithms or data transformation methods to make predictions.
In this work the data transformation approach was used using the following methods:
To evaluate the classification, there are metrics that are grouped according to two criteria, (1) How the prediction was computed, which includes metrics based on examples and based on labels; (2) How the result is provided that includes binary bi-partitioning and label ordering [7]. The following were used in this work:
The formulas for the calculation of each metric can be found in [7].
Automatic feedback analysis
In the literature, several proposals can be found for the automatic analysis of comments to the student in online courses, for example, in [4], it is performed a study to analyze the feedback process in an online learning environment of a high school level course where English as a second language is taught, they use unsupervised learning and natural language processing techniques to analyze teacher-student interactions to identify different types of observed feedback and to gain an overview of the most effective strategies that improve student engagement.
In [1], propose a way to analyze comments to the student written in Portuguese language based on indicators of good feedback, they use the levels proposed by Hattie and Timperley in addition to text mining techniques to train and evaluate a classifier using the random forest algorithm with the binary relevance transformation method.
Unlike the previous mentioned works, in this study it is proposed to analyze feedbacks that have been written in Spanish language, a comparison is made of four algorithms of random forests, vector support machines, naive bayes and logistic regression using four for each one, data transformation methods binary relevance, classifier chains, power set and rakel-d to determine those that allow generating multi-label classifiers with better performance in the task of locating feedback at the task, process, regulation, praise and other levels proposed by Hattie and Timperley.
Methodology
The methodology to automatically classify the feedbacks according to the levels of the Hattie and Timperley [11] model followed in this work considers four steps: (1) data collection and integration, (2) pre-processing and TF-IDF calculation, (3) classification (4) analysis and evaluation.
The methodology is applied in a case study, the feedback generated by teachers to the activities of students in online courses of the law degree of a public university in Mexico were collected from the Blackboard learning manager system.
Data collection and integration
The data set contains feedback written in Spanish, generated by teachers who published them through the task review tool in the learning management system. The data set is made up of 11,013 feedbacks from 121 online degree courses in law. The average number of words in each feedback is 77.
Each feedback was manually classified by instructional design experts who followed the model des- cribed by Hattie and Timperley [11] to locate each feedback at levels: Task, Process, Regulatory, Praise, and Other.
At the end of the multi-label classification, a multi-label dataset was obtained in which each feedback has a vector of five elements associated to the labels task, process, regulation, praise and others where each element is a binary value indicating whether the corresponding label is relevant or not, several labels can be active at the same time.
The multi-label data set was divided into two sets: training and testing containing 66% and 34% of the feedbacks respectively, chosen randomly. The distribution of feedback classified by each level is shown in Table 1.
Distribution of feedback in multi-label training and testing sets
Distribution of feedback in multi-label training and testing sets
The characteristics of the multi-label data sets for training and testing used in this work are shown in Table 2. Cardinality counts the number of relevant mean labels for each instance in the set of data. Density refers to the cardinality normalized by the total number of all possible labels. MeanIR obtains the maximum ratio of unbalance, that is, the ratio of the most common label against the rarest. The SCUMBLE value measures the concurrency between frequent and rare labels. The formulas of each metric can be found in [7].
Characteristics of multi-label data sets
Following the recommendations of Herrera et al. [7], the feedback from the test and training sets is preprocessed as follows: (1) HTML / CSS codes were removed; (2) cleaning methods are applied to obtain only the words and digits of each feedback and digits, web addresses and file names were replaced by identification keys; (3) feedbacks were converted to small letters to make comparable words with the same meaning; (4) the lemmas of each of the words were obtained; (5) a spelling checker was applied that uses the Levenshtein distance for words with frequency less than 10; (6) stop words were eliminated; (7) stemming was applied.
Once the preprocessing stage was completed, the feedbacks were transformed into a term-document matrix representing the frequency of each word in each feedback. The TF-IDF value combining the term frequency and the inverse frequency of feedbacks was calculated by multiplying the local frequency weight of each feedback by the inverse weight of the feedback [7].
Classification
Once the training and test data sets were preprocessed and the TF-IDF value was obtained, it was passed to the classification stage. This stage consisted of applying data mining algorithms to train multi-label classifiers to learn from the test set that contains the manual classification of feedback. In total, 16 multi-label classifiers were trained. Four for each of the data transformation methods binary relevance, classifier chains, label powerset, rakelD, described in section 2.2. Four base algorithms were used for each data transformation method: SVM, RF, LR and NB.
Analysis and evaluation
For each multi-label classifier created in the classification stage, it was analyzed and evaluated how well they did the task of locating the feedbacks according to the levels proposed in the Hattie and Timperley model.
The feedbacks from the test set described in section 3.1 were passed to each multi-label classifier, to predict the levels at which the feedbacks were located. The result was a set of predicted labels for each feedback.
To measure how well the feedback is located accor- ding to the levels of the Hattie and Timperley model each multi-label classifier, the commonly used metrics were adopted: accuracy, f1-micro, f1-macro, hamming loss, subset accuracy, ranking loss, average precision and coverage which were described in section 2.2. These metrics compare the set of predicted labels with the ones you should actually get contained in the test data set. Table 3 shows preprocessed feedbacks of the test set with the actual labels and the labels predicted by one multi-label classifiers.
Test set feedbacks with actual labels and labels predicted by a classifier
Test set feedbacks with actual labels and labels predicted by a classifier
The experiments were carried out on an Intel Core i5-3210M CPU 2.50GHZ, using the Windows 10 o- perating system. The Python scikit-multilearn library was used [16], which is built on the well-known scikit-learn ecosystem.
The results obtained are shown in Table 4, which shows for each data transformation method BR, CC, LP and Rakeld the metrics evaluated using the base algorithms SVM, RF, LR and NB.
Results of trained classifiers
Results of trained classifiers
It is observed that for Accuracy, the base algorithms that best classify are RF and SVM, as they manage to classify well 7 out of 10 instances compared to NB in which less than 60% of feedback ranks well.
Regarding the F1-macro, it is shown that: the BR and CC approaches are the ones that best classify. The base algorithm that gives the best result is RF. It should be noted that the values are affected by the imbalance of the classes.
For F1-micro that considers the level of unbalance, it is the BR approach that best classifies with the SVM algorithms, the RF algorithm also shows a good cla- ssification in comparison on what is achieved by the LR and NB algorithms. It is detected that a high value is reached in the detection of labels that are relevant where 8.5 out of 10 predictions marked as positive are correct.
For Hamming loss, the classifiers using BR and CC are the best able to classify feedbacks when u- sing SVM and RF algorithms with only 8 out of 100 misclassified instances. For the Zero-One metric, it is found that using CC with the RF algorithm the best classification is obtained by only having only 2.8 out of 10 misplaced feedbacks when considering the complete set of labels.
For the ranking loss metric, it is observed that for BR, CC and LP it is the RF algorithm that classifies the best, followed by the SVM algorithm. For the AvgPrecision metric, it is the RF algorithm that classifies the best. SVM also shows values very close to those of RF. For the coverage metric, the best classification is achieved with BR and CC using the RF base algorithm.
In the radial graphs of Figures 1, 3 and 4, each vertex corresponds to an evaluated metric and the points that correspond to a single multi-label classifier are connected to form a polygon. The larger the area of the polygon, the better the classification. It is observed that for BR, CC, LP and rakeldD the SVM and RF base algorithms classify better as in LP and rakelD.
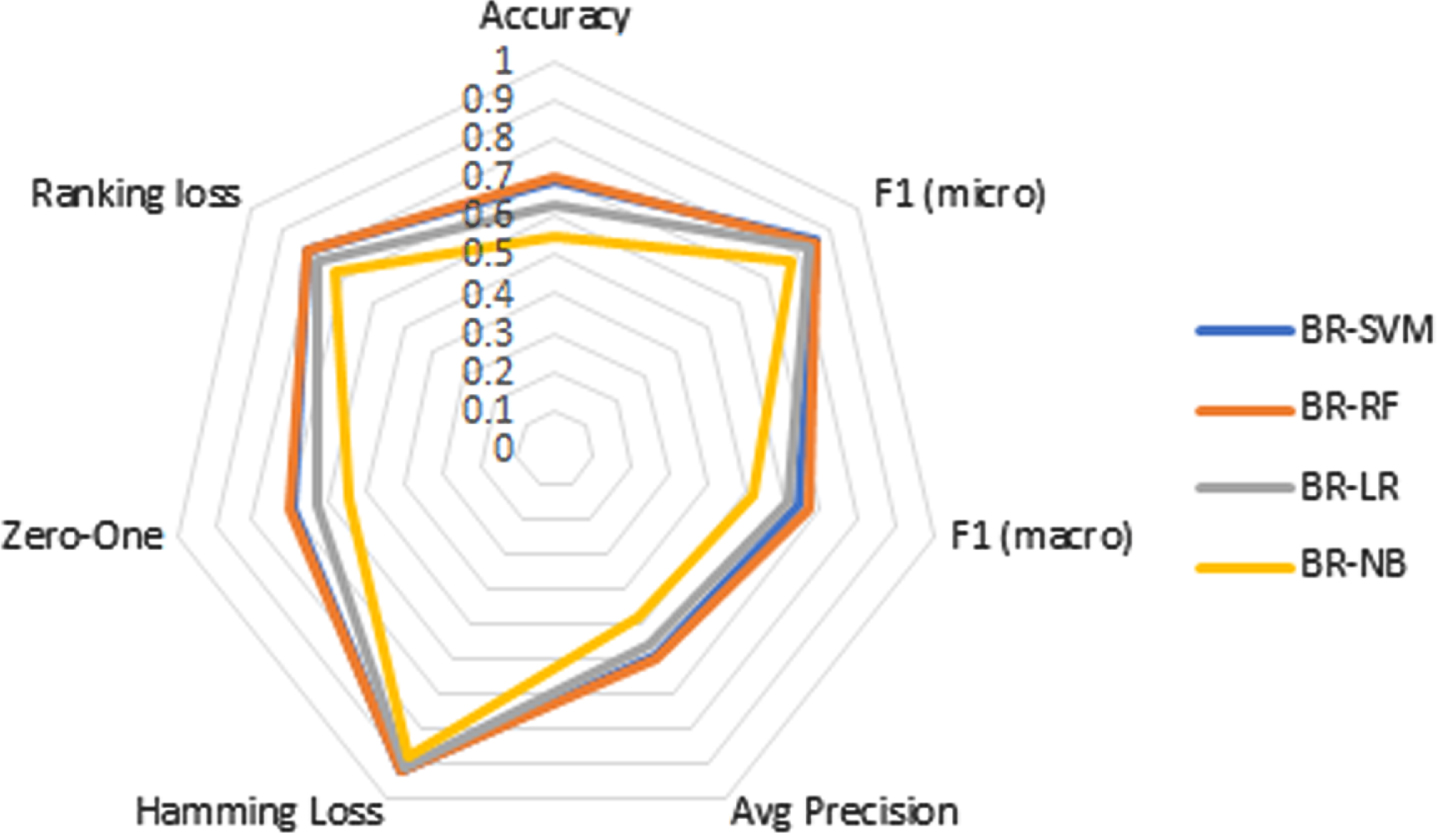
Radial graphs of multi-label classifiers using BR.
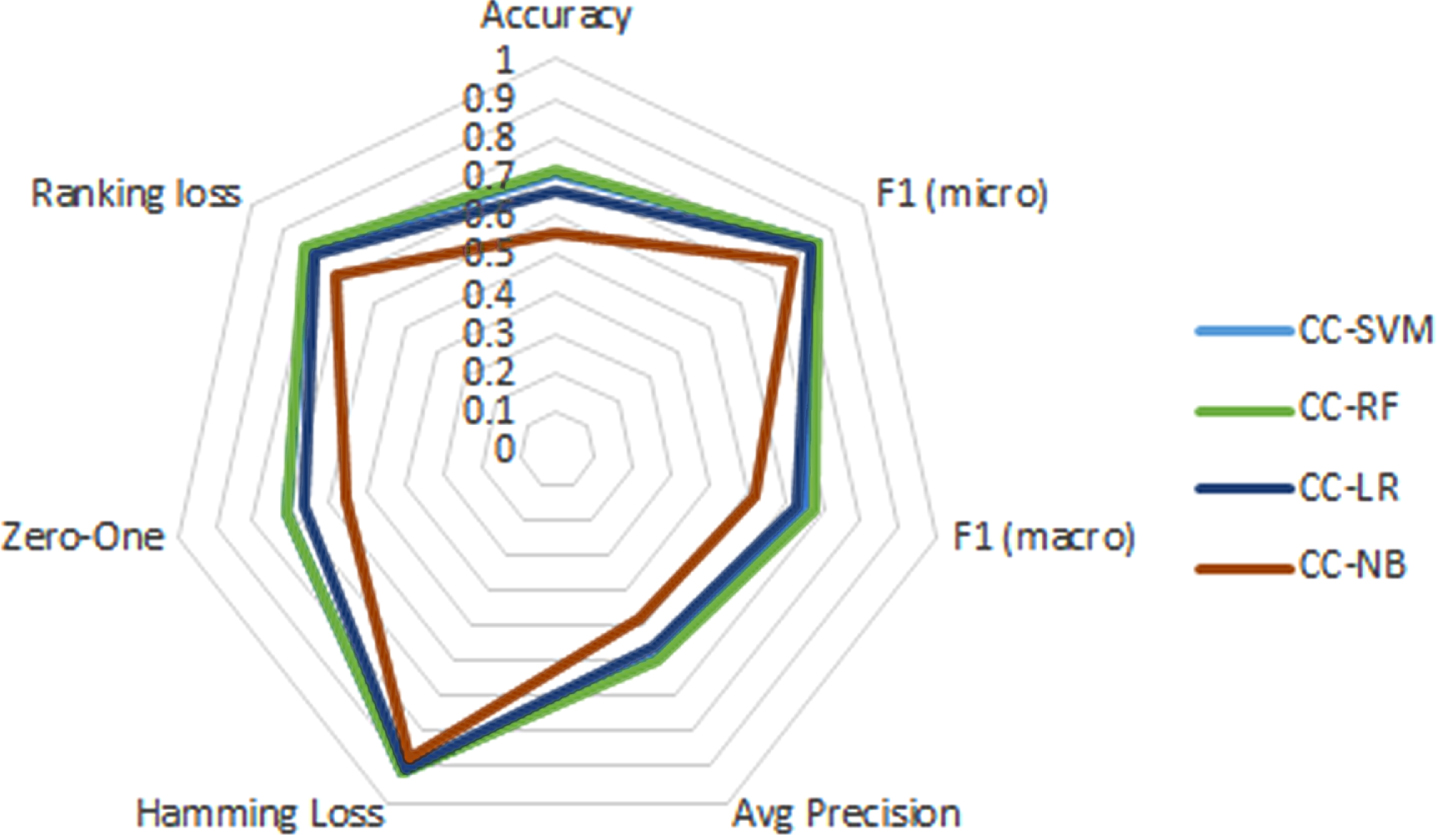
Radial graphs of multi-label classifiers using CC.
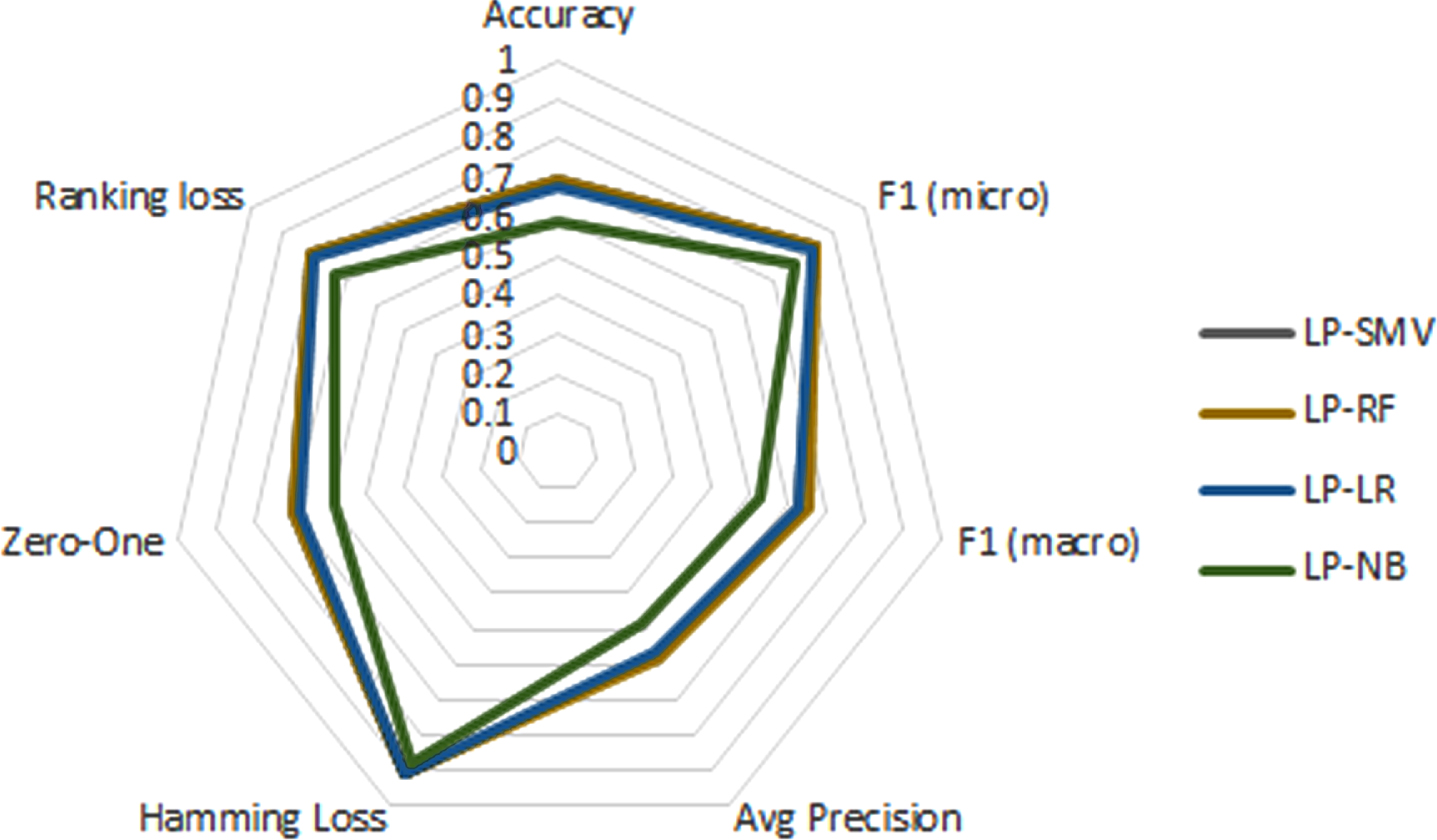
Radial graphs of multi-label classifiers using LP.

Radial graphs of multi-label classifiers using rakeld.
In this work, a methodology is applied to classify the feedback generated by a teacher to the activities sent by students in online courses according to the levels proposed by the Hattie and Timperley model to locate them at the Task, Process, Regulatory, Praise and Other levels. Four multi-label classification approaches are compared each with four base algorithms.
The results show that the best multi-label classifier is obtained using CC with the RF base algorithm when reaching the best values in 5 of the 7 metrics analyzed. Using the RF and SVM algorithms as the basis for the RB, CC, LP and RakelD multi-label classification approaches allows to obtain better classification metric values. The NB algorithm shows a low misclassification compared to RF and SVM.
As future work, we will try to test whether the classifiers work with feedback obtained from online courses in other areas of knowledge. It will be explored whether the values of the classification metrics can be improved by using different tokenization configurations (bigrams, trigrams,...).