
Abstract
An Intracranial cyst is an abnormal growth of mass in the brain that affects functioning of the nervous system and so an early detection of the lesion enables to avoid adverse effects. The processing unit in the Magnetic Resonance Imaging (MRI) system performs reading the images followed by primary image enhancement to suppress distortions thereby enhancing the feature quality in terms of its intensity, augmenting the resolution by image segmentation, post-processing by thresholding based on grayscale values and performing several morphological operations. With the existing methodologies, extracting the Region Of Interest (ROI) with the overlapping intensity values lead to inaccurate results. A novel method in which the input image that is anisotropically diffused and blurred is converted into a sharp image. Further, fuzzy partitioning of pixels deployed on Global Thresholding –Clustering Methodology (GT-CM) based segmentation takes 4 clusters into account hence forth seperating the exterior portion of the skull, the border region of the skull, the ventricles which may include the lesion and the noise. Statistical results based on several metrics such as sensitivity, specificity, F measure, Jaccord Index, Dice Coefficient and precision show that the proposed method is far more effective. An accuracy of 99.26% is obtained in exactly locating and extracting the lesion along with its attributes.
Introduction
Brain which is responsible for the function of nervous system works by sending and receiving electrical signals all through the body. The anatomy of the brain [1–3] is disturbed when there is an abnormal growth of cells which then accumulate to form lesions or cysts [5]. Hundred Billions of neurons and trillions of glial cells are present inside of the brain. The formation of brain tumor interferes with its neurological function thus causing abrupt symptoms like seizure or a stroke. This can sometimes indicate presence of some malignant growth inside the brain [10]. Most common brain tumor symptoms are heachaches that typically do not respond to common headache remedies or pain relievers. Brain tumor symptoms differ based on which part of the brain, the tumor exist. Most of the brain tumors do not spread to other organs of the body [10]. Brain is a very compact structure that even a compromise of few centimeters of the cyst may not enable the brain to function normally.
The first and foremost investigation for the patient presented with severe headache or other neurological dis-order symptoms is directed for detailed diagnosis through MRI of the brain. The MRI scan not only help to visualize the presence and locate the brain lesion but also help to decide whether a surgery is possible to remove the tumor or not. The MRI system has several units including the computer that helps to capture and create several slices or series of brain views thus differentiating diseased and normal tissues. The results through MRI are found to be better [5] compared to that of the results produced by Computed Tomography (CT), ultrasound or X-rays. Several algorithms have been proposed to improve processing speed and accuracy of results based on segmenting the captured images because staying enclosed inside a machine for a long time is strenuous for the patents undergoing the scan [17].
The intent of the proposed GT-CM (Global Thresholding –Clustering Methodology) based segmentation is well-erected to be implemented in the following manner. Initially, the system necessitates the MRI images to be read so as to convert the input image into a grayscale image whose pixel values lie between 0 to 255. The next action is the noise cancellation as the MRI system is normally accountable to salt and pepper noise, Gaussian noise and speckle noise. Sharpening the image goes well with de-noising that employs an anisotropic diffusion filter [22] to filter some portion of the noise and again subtracting itself from a Gaussian blurred original image. The immediate step is the segmentation of the resultant image by means of the GT-CM algorithm which segregates the pixels into several clusters based on the pixel’s intensity values. The de-noised brain slice undergoes several iterations and the loop breaks once the convergence condition based on the FCM algorithm [19] is satisfied. Finally, the tumor along with its attributes are preserved and highlighted efficiently when the GT [13] is implemented.
Thus, this methodology favors the building of an efficacious model in terms of computation speed as well as the accuracy of the results that tends to be permissive in locating the ROI which in our case is the lesion that is particularly dominated by a cluster of highest intensity pixels owing to statistically ruling out its exact dimensions.
Literature survey
Segmentation of an image is the partition of an image into a detailed class of pixels [4]. The data collected from World Health Organization (WHO) categorizes intracranial lesions into 120 types based on the tissue type, its origination site, and several other characteristics [17]. Processing of medical images involves reading the images followed by enhancing the data’s resolution. MRI images usually suffer with gaussian noise, salt and pepper noise which is removed by averaging filters such as mean or median filter [8]. Smoothing the image by using such filters is intended towards diminishing the inter-pixel resolution variation. The next step is the mandatory part which is the image segmentation to which several methods are implemented so as to segment the image. For further detailing, final step would be extraction of the cyst [5].
There are several methodologies for segmentation based on thresholding. Global Thresholding (GT) in general is a simple thresholding methodology where the pixel’s value is replaced by 0 or 1 (black or white). The threshold value is initially calculated by averaging the pixels of the image and the pixel whose resolution that is less than the threshold value is assigned 0 and the pixel is assigned the value 1 for whose intensity is greater than 1 [8]. Otsu’s thresholding is the most common method of global thresholding by binarizing automatically depending on the bi-modal histogram, partitioning the foreground and the background pixels [7]. The drawback of Otsu’s method is that the probability summation of the intensities of background and the foreground is inaccurately optimized to pixel value 1, leading to dissimilar illumination of the pixels. Adaptive thresholding (AT) based segmentation calculates threshold value for region of different intensities, thus computing different threshold value for different region [6]. GT defines a definite pixel value based on the threshold value determined from the histogram [12] of the distributed intensity levels of the image. On the other hand, AT assigns varying thresholds for different region of the image [15]. Hence, GT is found to have fast and simple computations with target and the background being assigned with higher contrasts, leading towards a segmentation effect. The drawback of GT is its difficulty to obtain accurate results due to the grayscale overlap leading to intensity unevenness. It is also highly sensitive to noise and discards the spatial information only considering the gray information, thus leading GT to combine with other methods [18]. Another existing methodology is segmentation by K- means algorithm. K- means [20] algorithm is a clustering type of segmentation that clusters several groups based on similarity in the data and the data belongs to only one cluster. An integration of K –means and FCM is suggested to reduce the number of operators and the equipment errors [16] but then the analysis goes to a complex mode on its implementation in a Neural Network platform. Clustering by K means is quite ambiguous depending on the scale distribution of the datapoints [20].
Another type of segmentation is by Fuzzy C means (FCM) which is again a clustering methodology [19] that clusters the entire dataset and assigns each datapoint to belong to two or more clusters with a factor defining how firmly the data belongs to that particular cluster which is a flexibility advantage when compared with K means algorithm. It also provides accurate results in the overlapped region which makes FCM practically operative than K means clustering [19]. A progressive assignment of membership values to the clusters is definitive in the range of [0,1] thus providing flexibility to manifest that, data points can fit into more than one cluster. [23] has proposed a image segmentation method by Atanassov’s intuitionistic fuzzy sets which analyzes the pixels that belong to both background and foreground by using two or three threshold values thereby segmenting the image. But by selecting multi-level thresholds, the computation time is aggravated which makes the method impractical in medical image segmentation.
With this survey, a conclusive effective proposal based on considering the advantages of GT and FCM is set forth leading to GT-CM based segmentation that takes the edge off complexities in terms of computation, time [1] and is also definitive in its results by determining the location of the cyst with its properties.
Proposed methodology
The Protons that are abundant in the human body is used by the MRI. Magnetic charge is created as the protons spin. The MRI machine creates a strong magnetic field and hence the protons align to that field [3]. The radio frequency pulse introduced by the technician disrupts the proton and hence it is forced for a re-alignment with the static magnetic field in 90 or 180 degree. The proton is thus pushed by the radio frequency pulse against the nature. The realignment of the protons with the magnetic field happens once when the pulse is turned off and therefore an electromagnetic energy is released. The MRI is able to detect the energy thus differentiating various tissues [4] based on how quickly the energy is released after the pulse is turned off. An MRI machine works in any spatial direction producing sectional images that is fed to a computer and thereby, helps in visualizing strokes, tumors or inflammation [2].
Therefore, in the Data Acquisition unit of the system, the following flowchart (Fig. 1) act as the framework in distinguishing the various tissues of the brain whereby detecting the presence of cyst [9]. The database for the proposed methodology is provided by https://www.kaggle.com/datasets. In this proposal, a 2D image from this database is fed into the model of the system as shown in Fig. 1. The pixels of the 2D image is processed by transforming the pixels into a gray scale image.
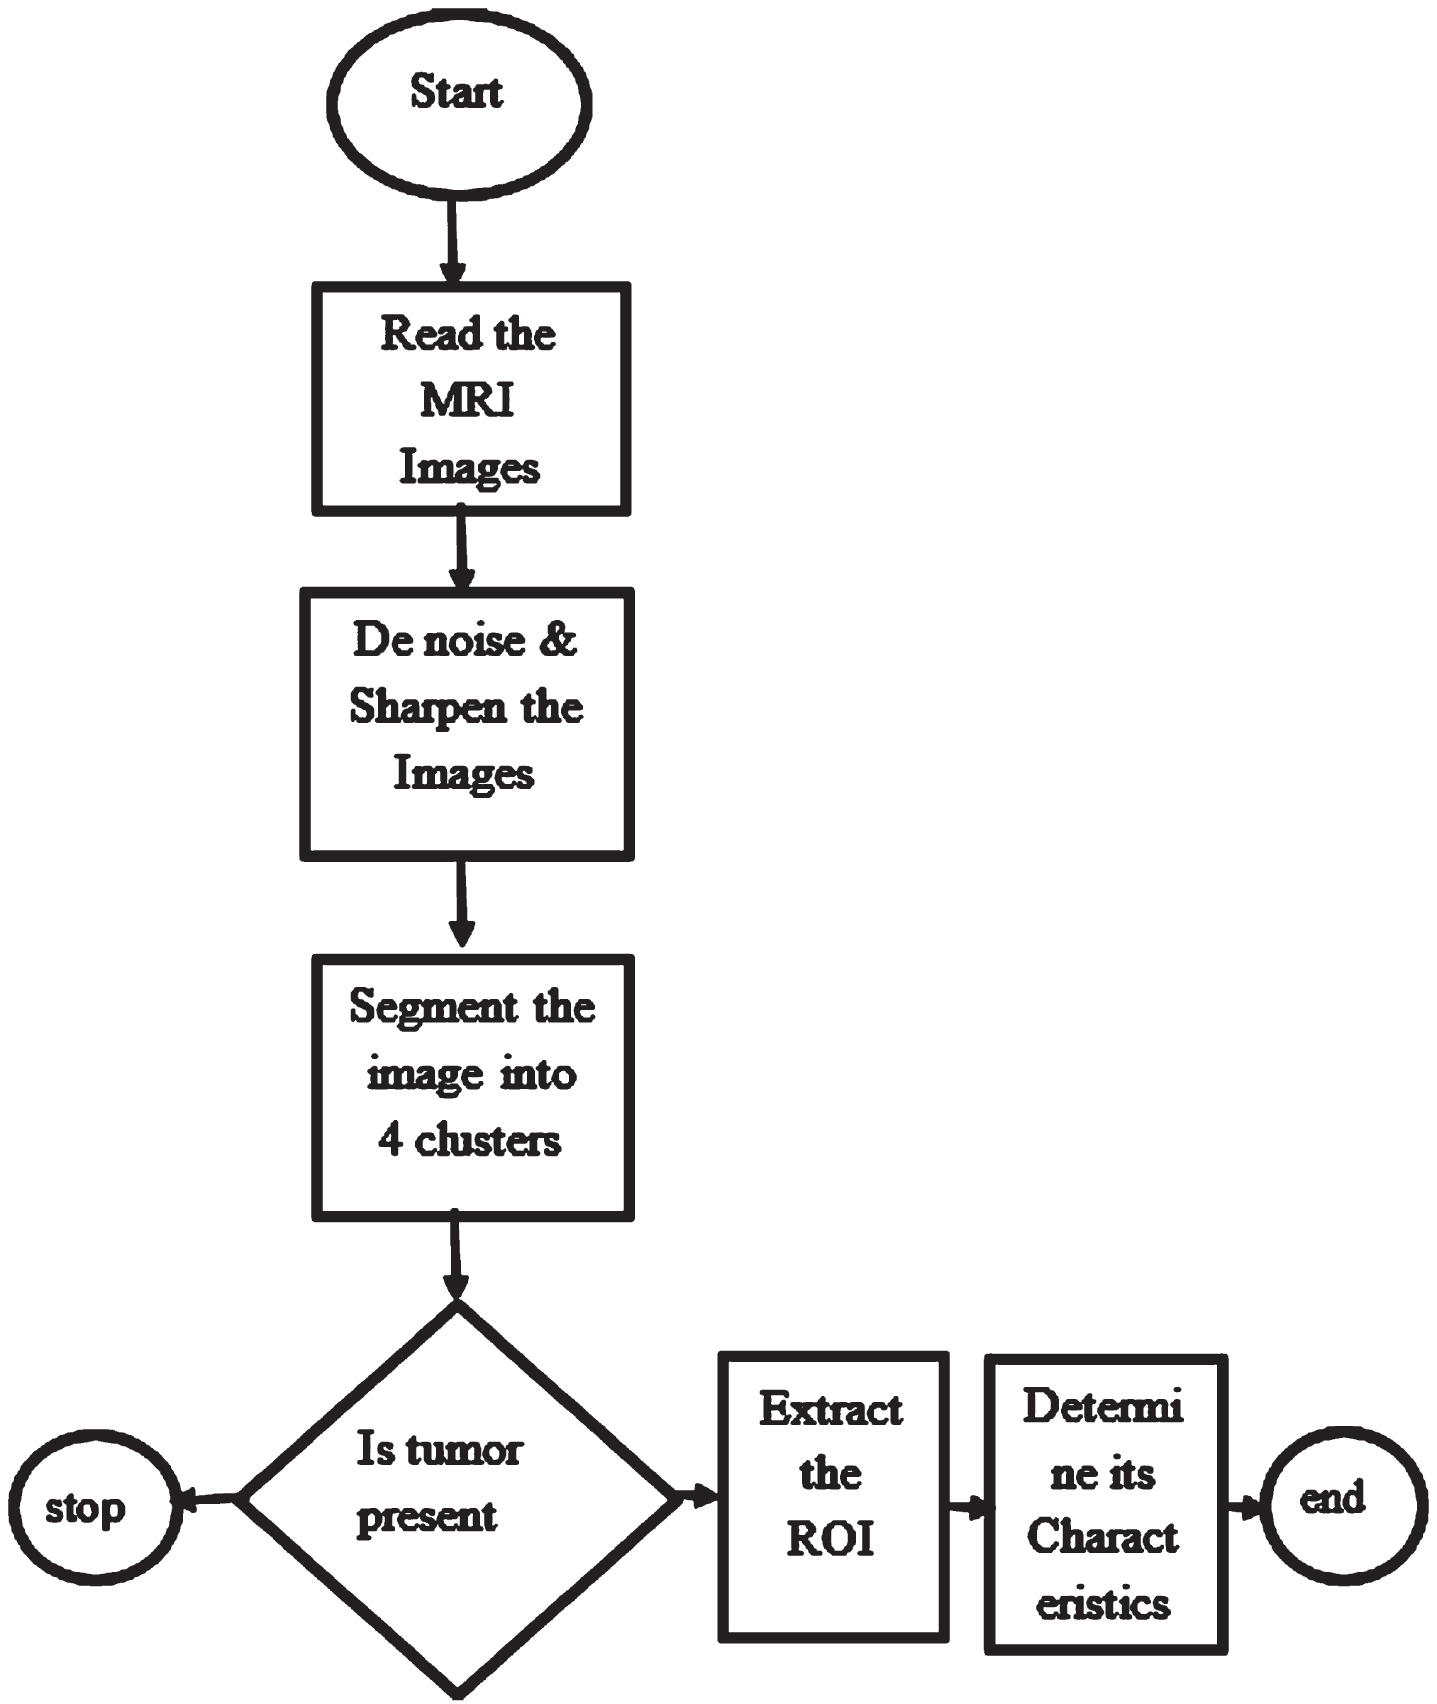
Model of the proposed work.
If the grayscale image is F(x), the formula to convert the input RGB image to a grayscale image is given by Equation (1)
Once when the image is converted into a 2D grayscale image, the data acquisition is fulfilled.
To build better computer vision model, image pre-processing play a vital role. Image pre-processing are large deterministic steps to format images in the correct path [13]. So now that the gray scale image is made available, the following steps help in creating a sharpened image for further processing.
Sharpening the image
Due to precision lacking and fluctuation of values owing to sampling by average filtering [15], a robust and more efficient filter is used for de-noising and preserving the useful information. Videlicet, in order to bring a more feasible image,
The following is the heat equation in terms of medical image processing.
Diffusion equation is therefore, the intensity of the pixels with respect to time that changes with equal distribution in every direction. Heat equation is considered in image processing as the intensity of the pixels that are related to heat. With the progression of time, uniform distribution of the intensity values happen leading to a coarse resolution and smoothened image. Applying equation (2) iteratively to all the pixels, a coarse resolution is obtained. Hence the identification of features at coarse level provides a fine resolution. There upon, this type of filtering is efficient in terms of intra-region smoothing rather than inter-region smoothing [22]. Equation (2) can be re-written as
The intensity derivative with respect to time t, Kt in Equation (3) is given by divergence of conduction coefficient, c and the divergence of the gradient of k. A known phenomenon is that divergence of gradient is laplacian. Hence, in the next step divergence of gradient k is substituted to intensity derivative in discrete domain. An assumption of c = 1 is made in case of anisotropic diffusion so as to smooth only the intra-region of the image leaving the edges or the inter-region with c = 0. Therefore, blurring happens in each region separately with no interaction with the other regions making c significant. Here in this initial stage with no clue of the edges of the image, this equation is noteworthy, convincing to determine a proper estimate of c(i,j,t). With conduction coefficient c = 1, the latter part of the Equation (3) tends to the value zero. The gradient is an outstanding estimate of the pixel location. This means, if the gradient is high, there is probably an edge and hence blurring is stopped over there. The conduction coefficient, C is a function that is applied to the grad(K).
Equation (4) is the diffusion equation [22] that is applied in four directions to estimate the gradient which is illustrated in Fig. 2. Therefore, the gradient of the pixels is computed in the north, east, west and south directions. CN is the gradient of K in north direction. Gradient is calculated similarly in all the directions. The most higher value of the gradient is brought to zero and the other gradient values gets iteratively added up until the total values are almost less than or equal to the highest gradient value and this in return gets added up with the primary pixel. Wherefore, the intra pixel intensity values get added up leaving the edges. Now that the resolution is improved, Gaussian blurring is applied by convolving Gaussian kernel across the image so as to blur the entire image.
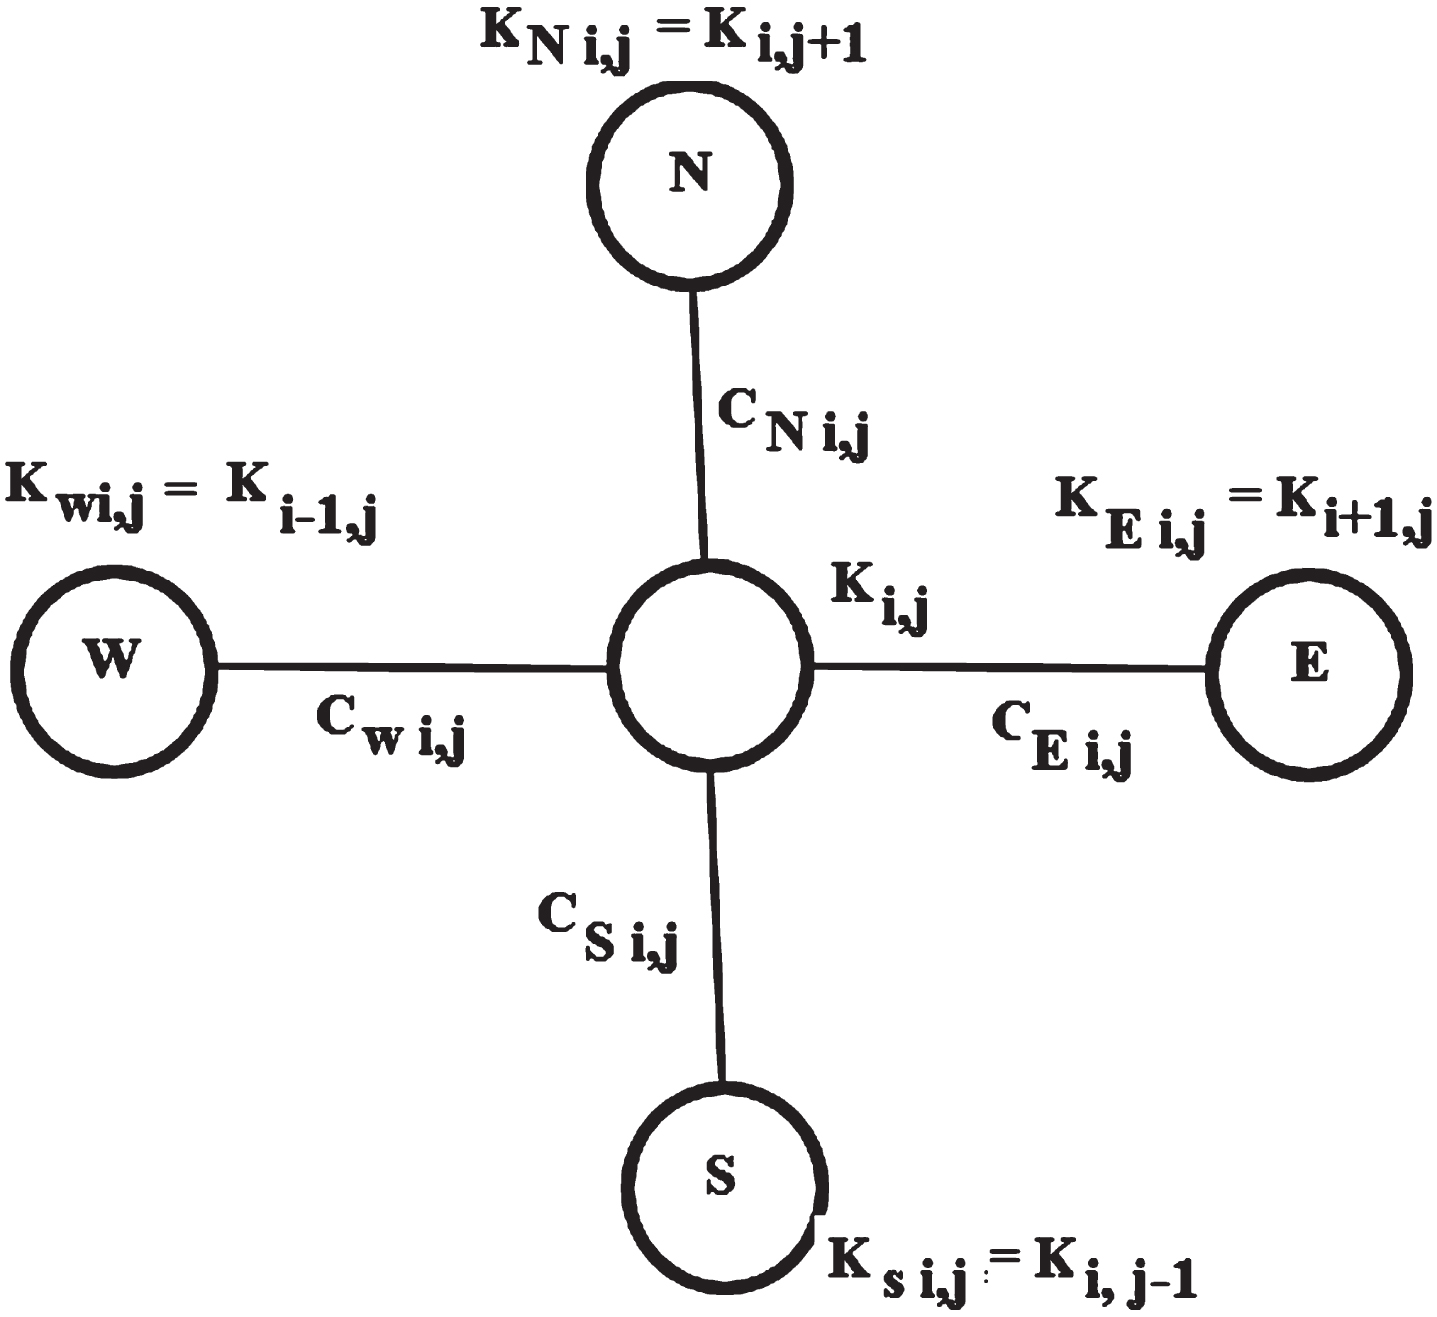
Diffusion by calculating gradient.
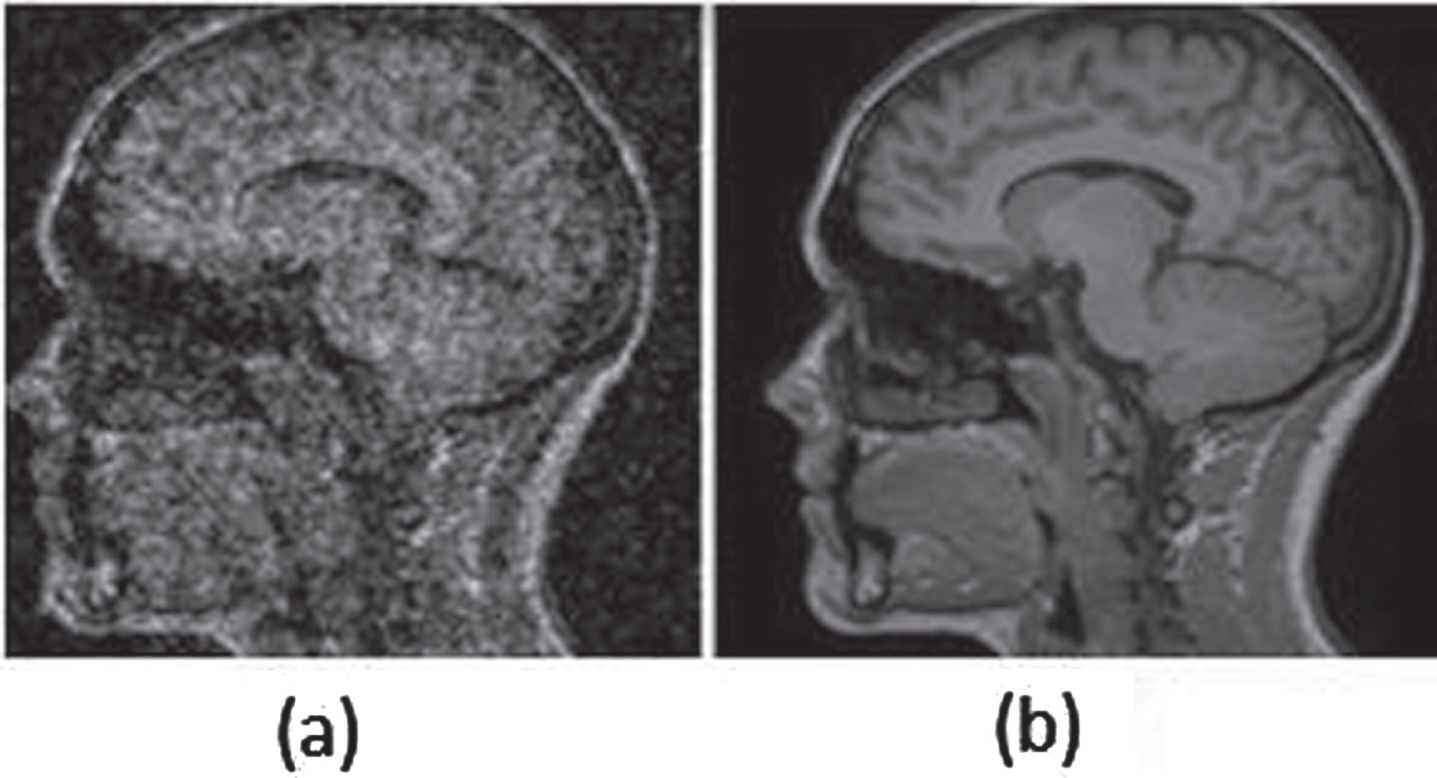
(a) Example of a noisy brain slice (b) Example of blurred brain slice after applying diffusion filter and Gaussian blur.
On subtracting the original grayscale image from the blurred image, a sharpened image is obtained.
Segmenting images refers to extracting the properties of the sharpened image thus partitioning into several regions. As a consequence, segmentation of the attributes that are intra-region and inter-region of the image and also the ROI take place. Here GT-CM refers to Global Thresholding Clustering Methodology.
Clustering the pixels through fuzzy assist in clustering each grayscale value in one of the several cluster groups [19]. FCM algorithm acts as a powerful tool in extracting the ROI by which several detailing is made possible [11].
Clustering methodology
In an MRI image, the major findings would be the segregation of pixels in the border region of the skull, the exterior portion of the skull, the interior portion of the skull along with the features such as lesion and the noise and this pixel segregation is labelled as clusters. As there are four differentiated sets of pixel segregation, the number of clusters is chosen to be 4. The lesion is the outstanding cluster with highest intensity of pixels compared to other pixel values. Thus there are four color intensities of gray (4 clusters) that are prominent in the MRI image where the pixels will be clustered in maximum.
The Fig. 4 is the framework illustrating the steps involved in clustering the pixels based on the clustering algorithm. This model is centered on fuzzy C means clustering methodology [14] so as to obtain a partition of the pixels in the lesion region. Following are the steps to be followed.
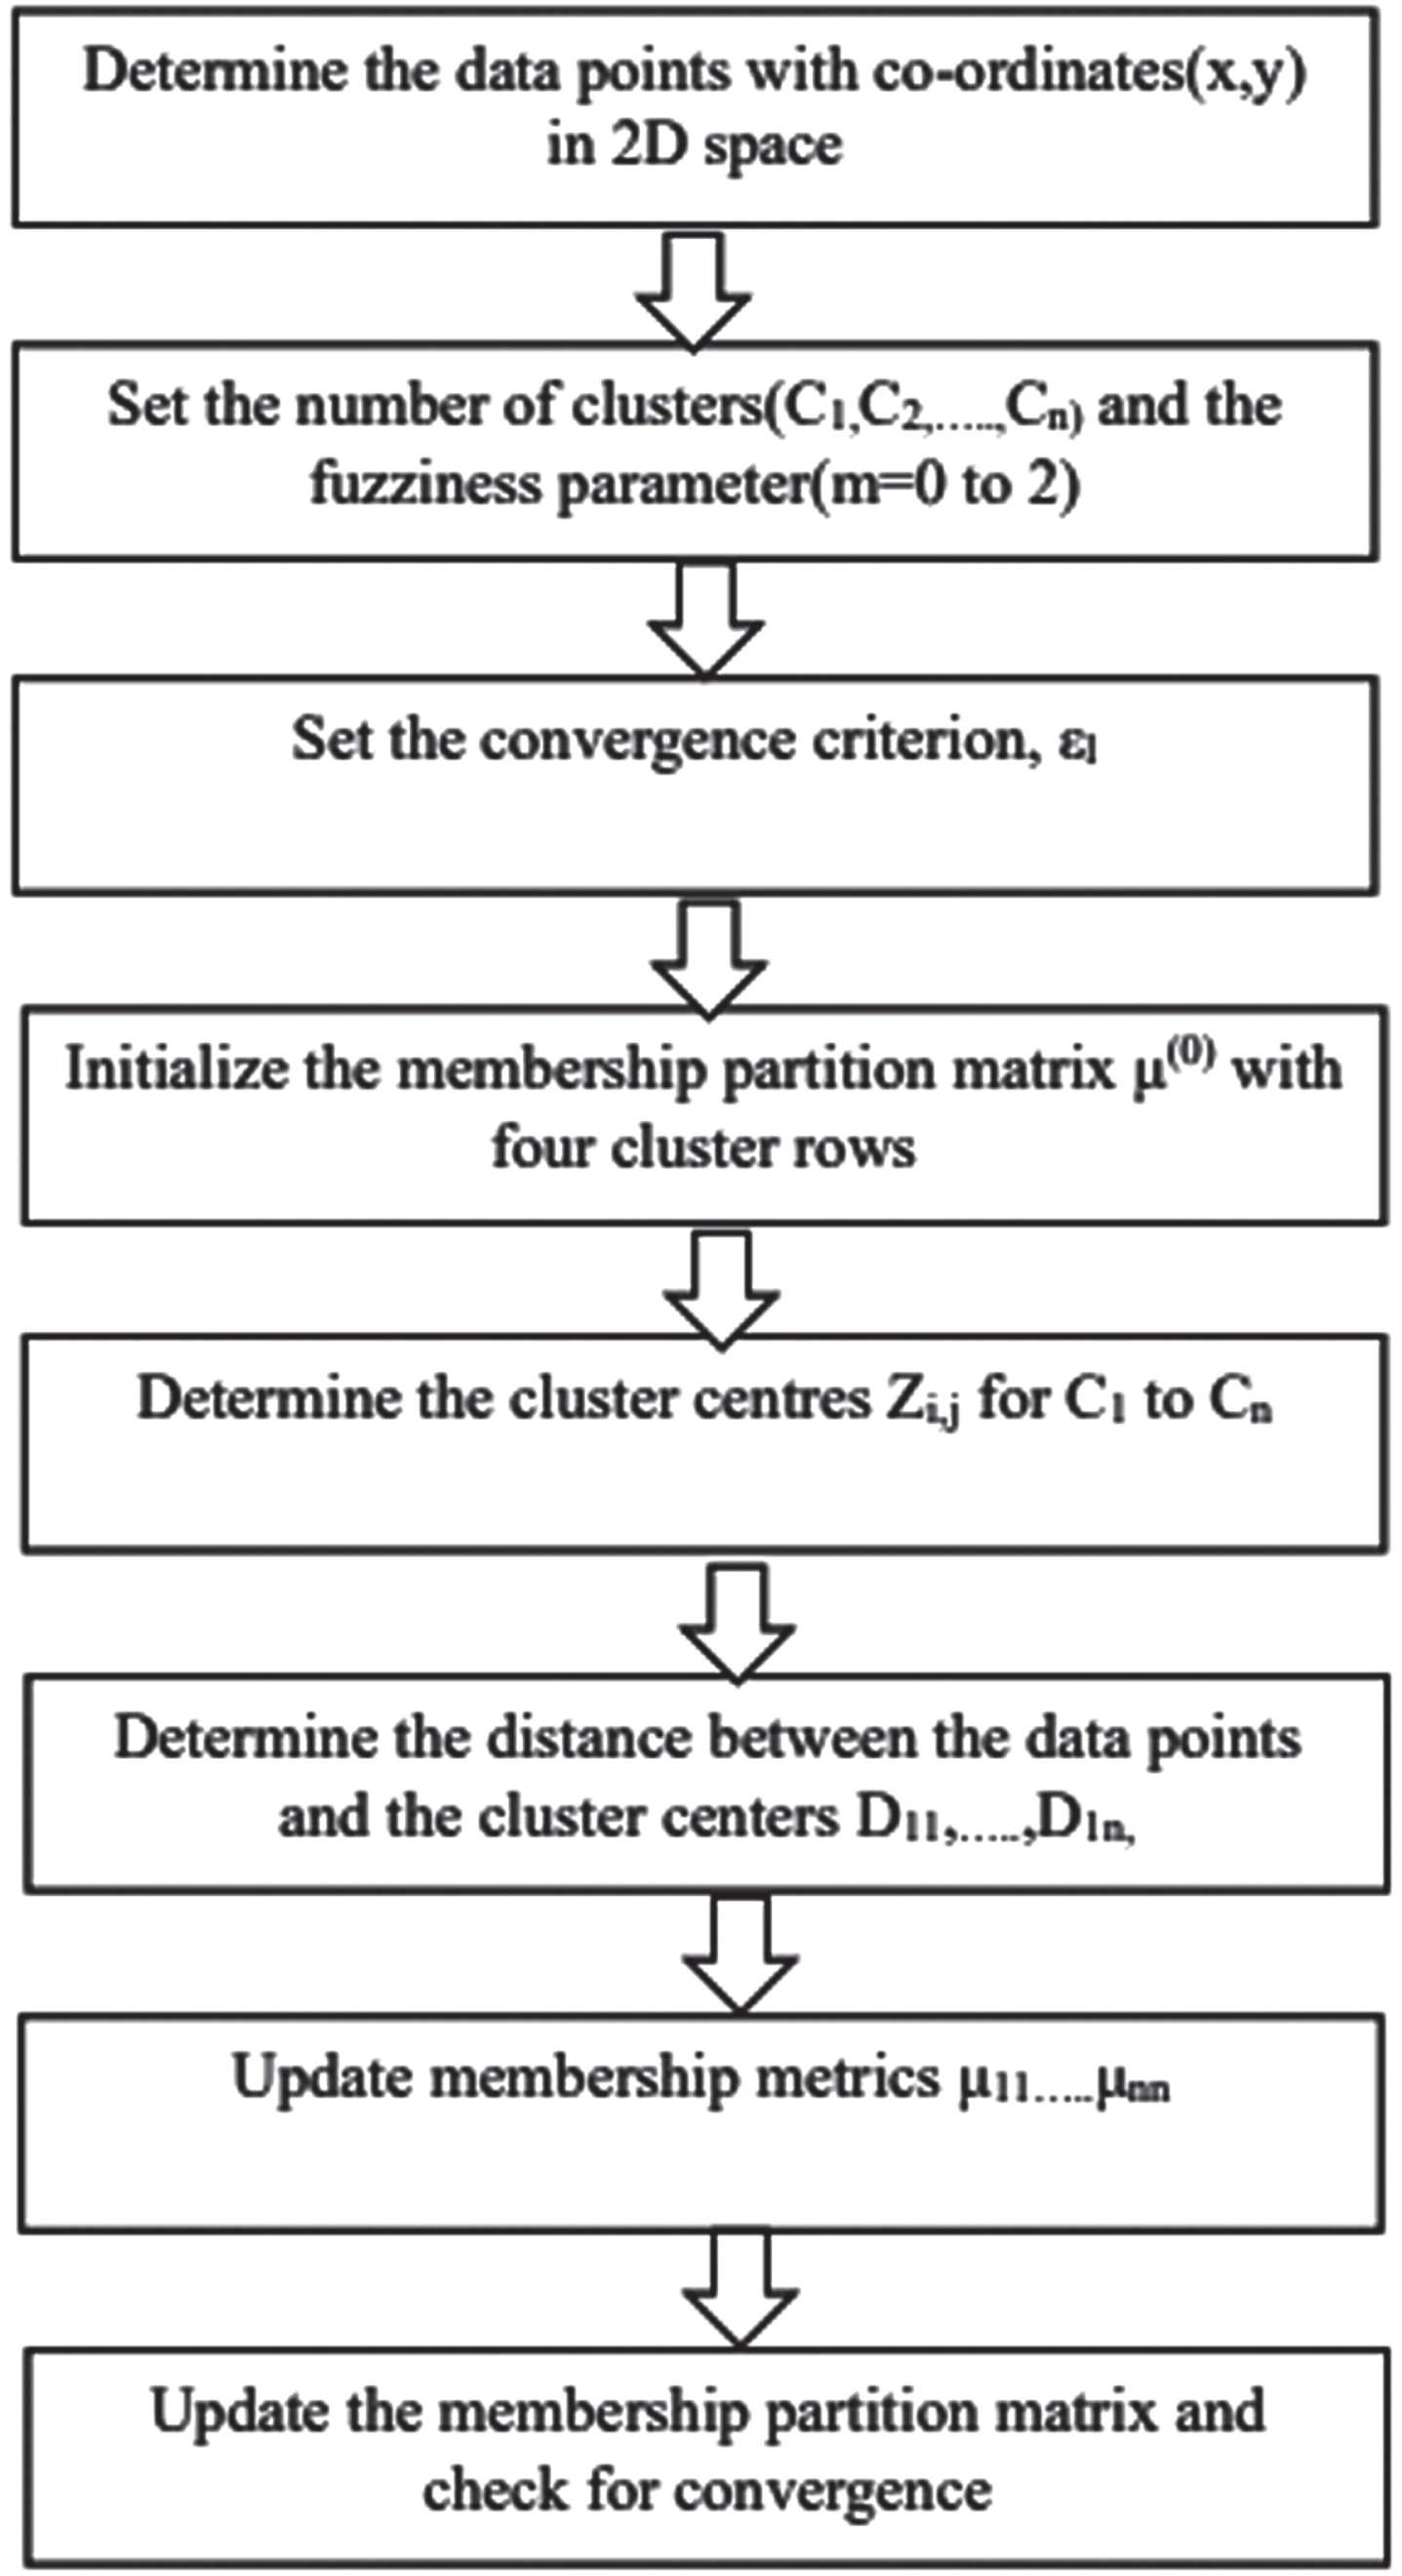
Steps for clustering the pixels.
Determine the data points or the pixel co-ordinates from the two dimensional brain image.
Label the clusters C1, C1, C3 and C4 so as to separate the exterior region of the brain, interior region which includes the ventricles, the boundary, the noise and the lesion.
The fuzziness parameter m is always set to 2 for convenience [3].
The convergence criterion which is the termination point is represented by ɛl. Lower the value of ɛl, better the result will be. In-order to obtain accurate result, ɛl value is set to 0.00001.
Set the initial membership matrix μ(0) which is a matrix of zeros and ones with four rows. The four rows represent the four initial clusters.
Determine the cluster centers for each cluster which is represented by Zi,j
Where, μi,k is the membership value Xkj is the corresponding data point
Now for clusters C1, C2, C3 and C4 calculate the cluster centre, Zi,j.
Calculate the euclidean distance [16] between each datapoint and each cluster center djk
Here,
Where, r is a constant. The next step is to check for convergence. Convergence value should satisfy the following criterion. i.e.
The partitioned clusters labeling the brain image proceeds to Global Thresholding (GT) segmentation process of the image.
This is a Global Thresholding [4] means of segmenting the image based on the various classes of pixels obtained. The highest intensities of all the four clusters is set to pixel value 1 bringing other intensities to 0. The pixels of low resolution act as outliers after being assigned 0 by GT. The boundary and the lesion region are the remains with high intensity thereby, formulating the area of the lesion by calculating the total number of pixels in lesion region. Discarding the minimum region that includes the boundary and some white noise, and considering the maximum area, the tumor alone is extracted.
Results and discussions
The dataset is scrapped from Kaggle which is a website that helps to build models based on bio-medical data science domains. This database consist mid –saggital and the coronal sections of the brain viewed through MRI. The brain slices are downloaded from the above-mentioned website for experimental cause.
The two –dimensional images of the slices presented with tumor in Fig. 5 are read and processed by a multi- paradigm programming platform MATLAB 6.0. After the data acquisition step, the images converted to gray-scale image is forwarded to a pre-processing unit which includes filtering and sharpening of the image.
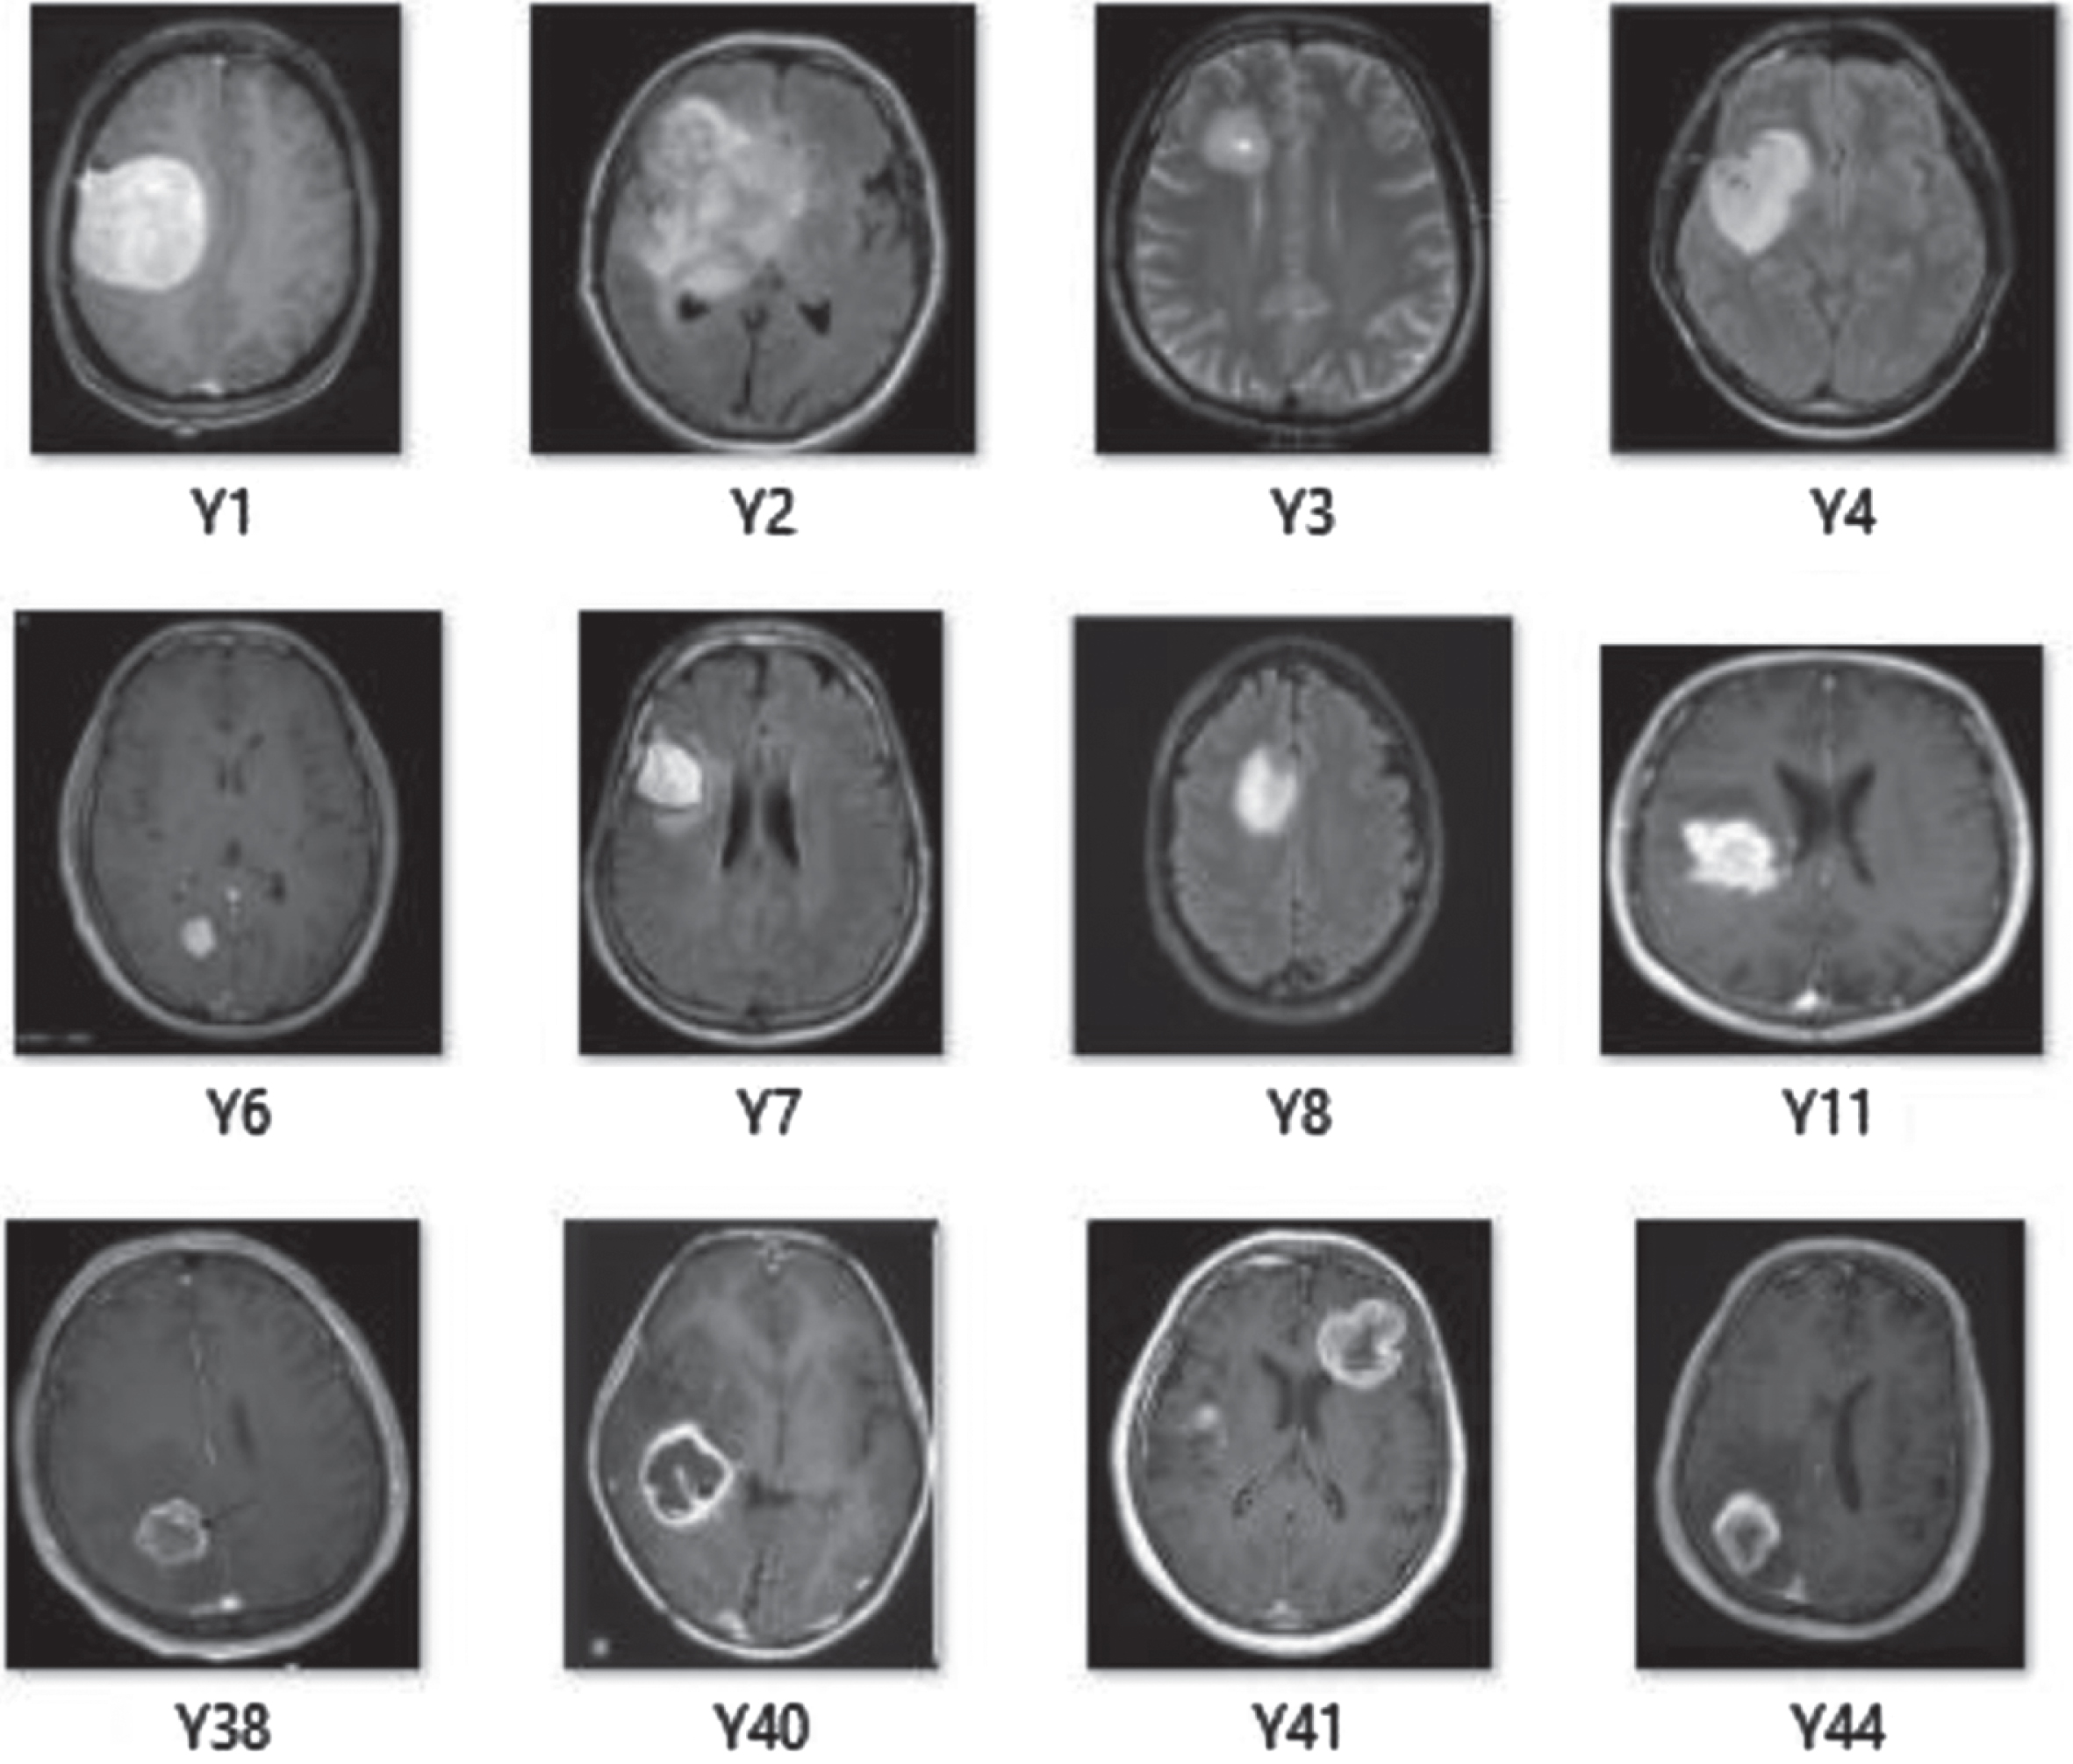
Database for processing through GT-CM.
The improved resolution of the gray-scale input image by AD filter is shown in Fig. 6. Further, the image is forwarded for a feature detailing segment by downscaling so as to sharpen the image.
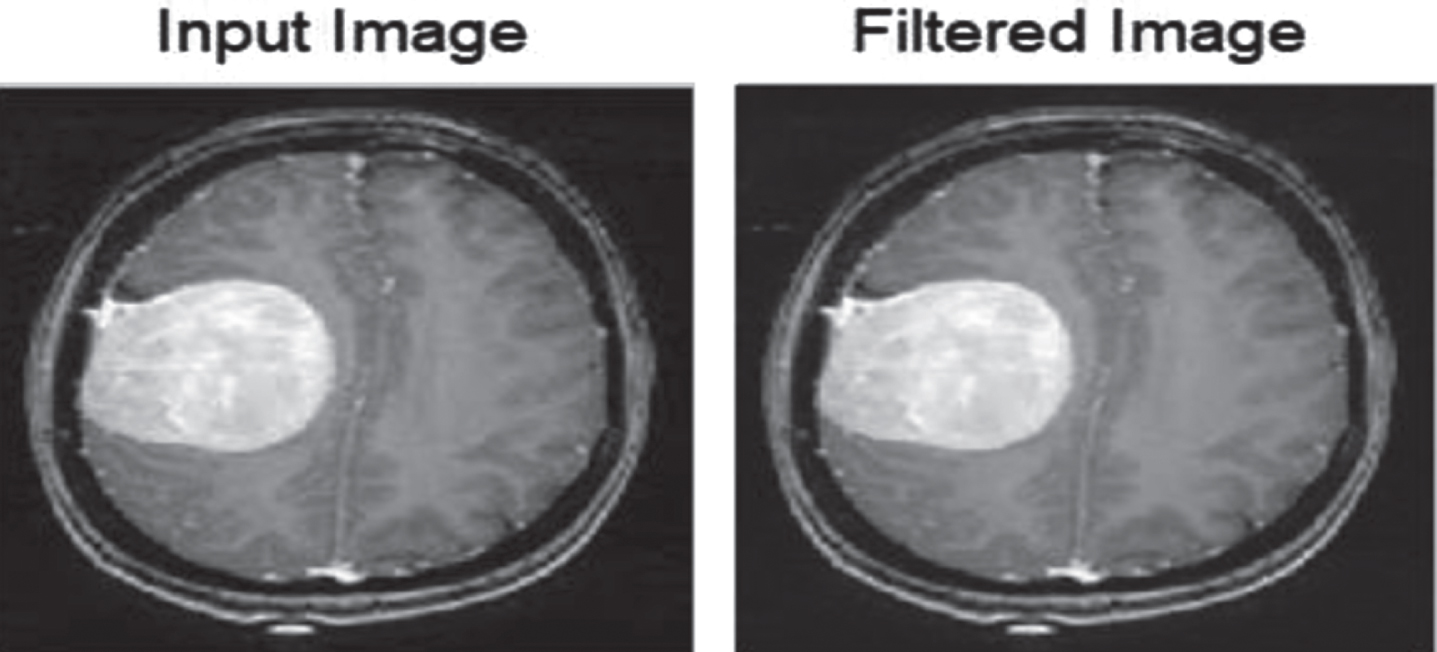
Anisotropically diffused image.
The initial fuzzy partition/membership matrix, μ(0) is set in such a way that four clusters, C1, C2, C3, C4 along the row is set to values 0 or 1 thus building a matrix with the total value along the column 1, column 2 . . . .., column n equal to the value 1. Thus by applying the FCM algorithm to the sharpened image (Fig. 7), an indexed image is created. Now that the up scaled image with sharp boundary of the skull and sharp interior portions with ventricles and the lesion is visualized (Fig. 7), the goal of determining the cluster of the lesion is achieved by initially gathering several attributes thus leading to the labeling of clusters.
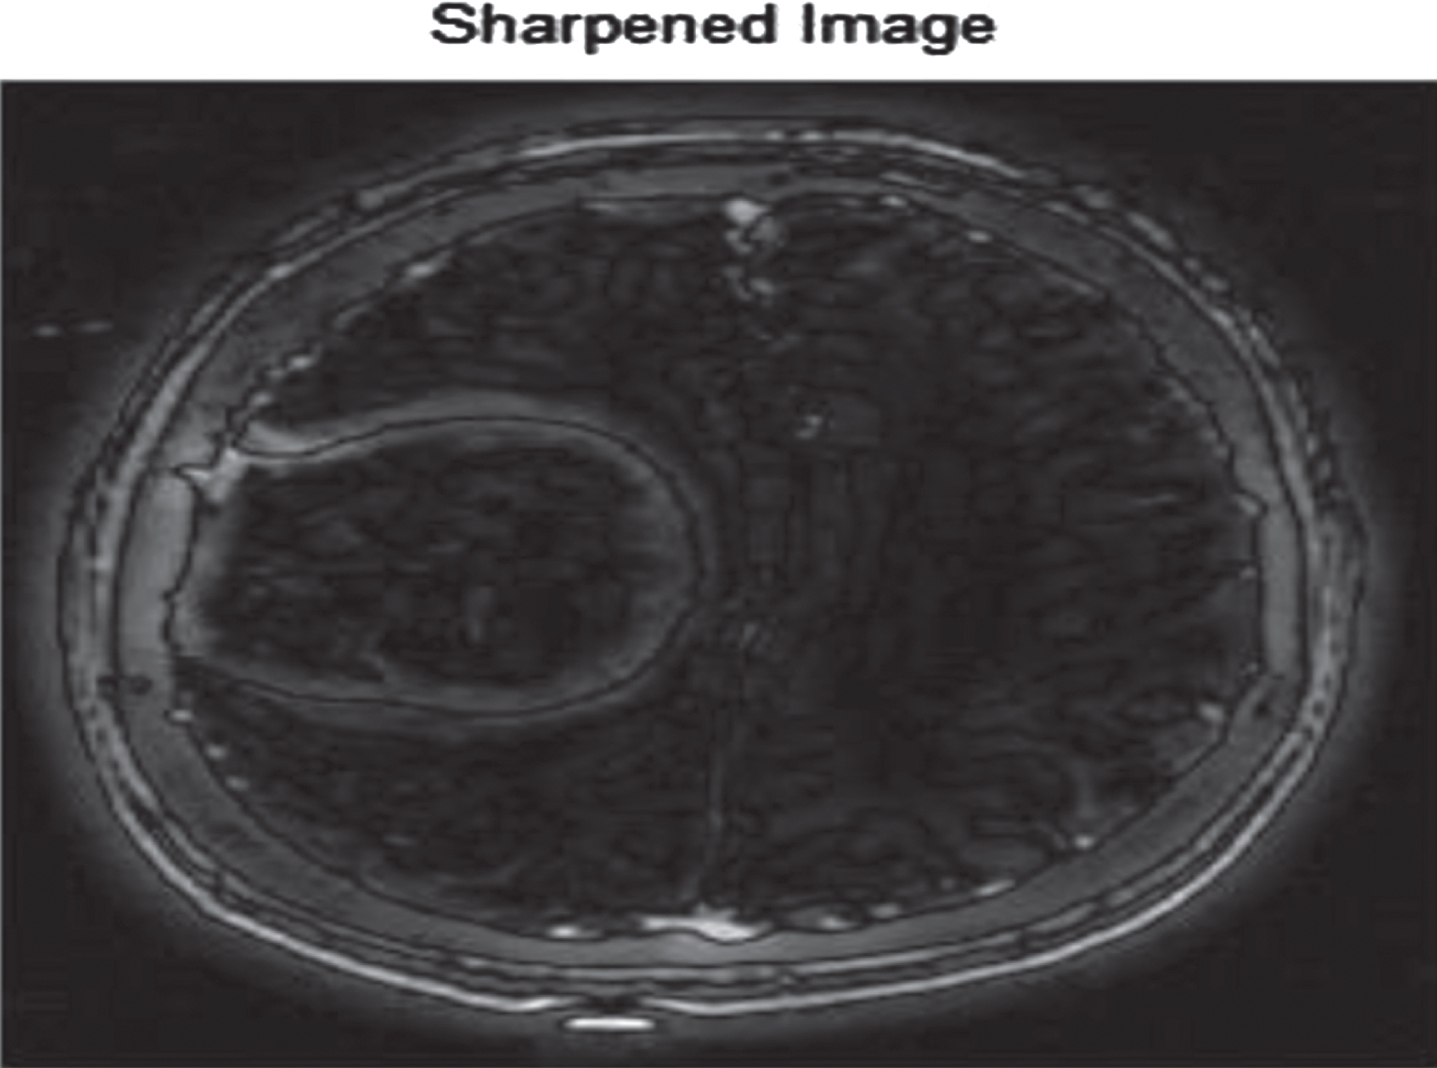
Sharpened image.
The Indexed image (Fig. 8) is a labelled image with segregation of separate details of the features by gathering the nearest pixel values as clusters based on the gray-scale intensity.
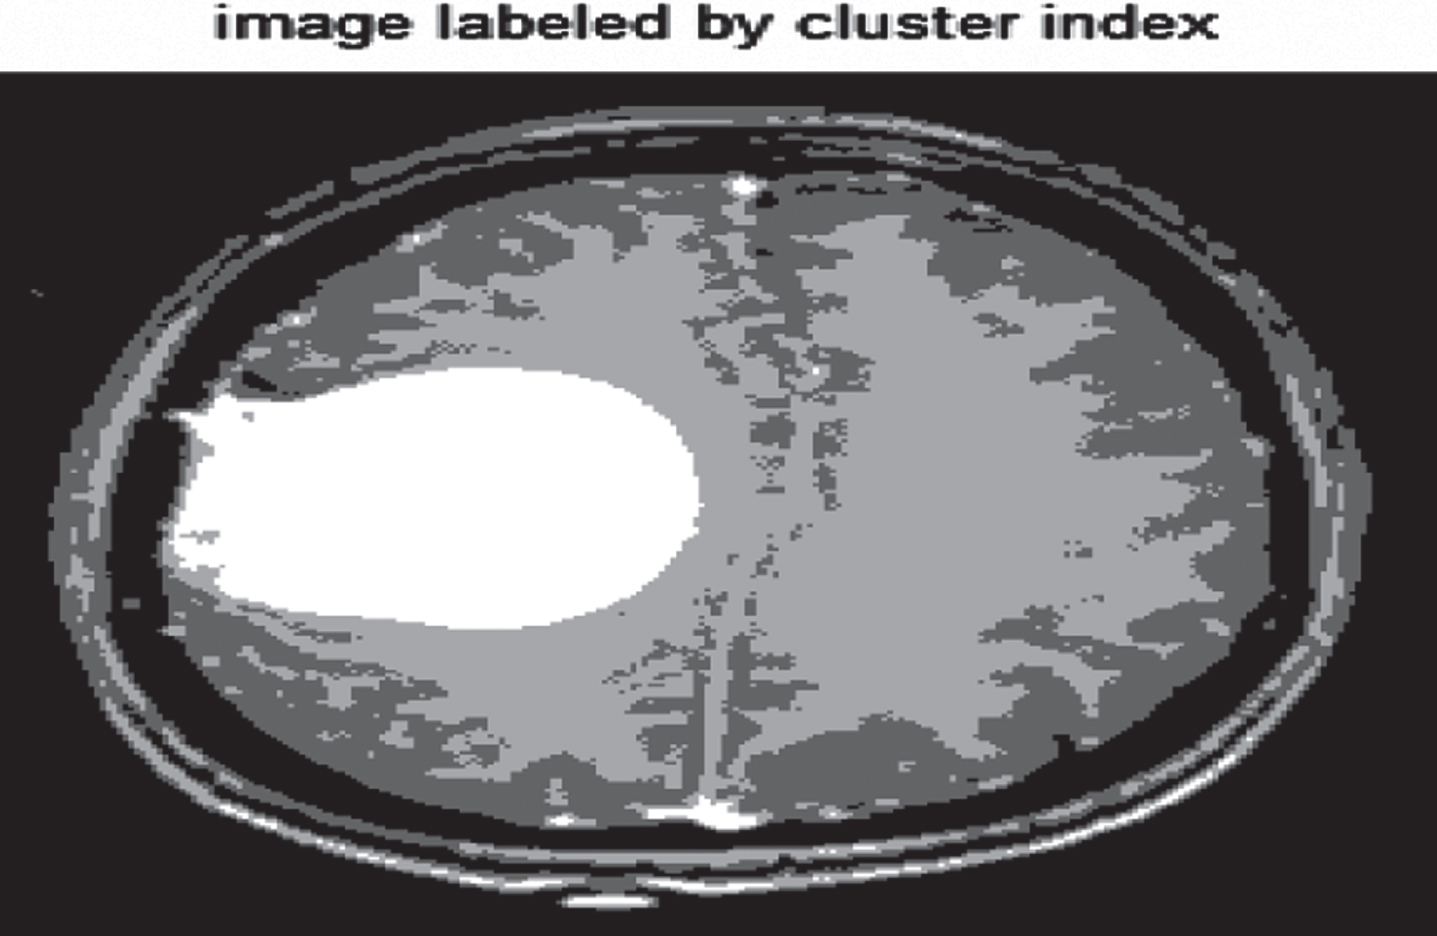
Indexed image.
Hence, segmenting the image by clustering methodology through Fuzzy provides the segmented view of the image by which the higher intensity pixels with image projecting the lesion with some part of the edges and the ventricles is separated (Fig. 9). This is the image that is computed after the convergence criterion is satisfied. The value, ɛl. is equal to 0.00001. The loop terminated in the 68th iteration. In case the loop doesn’t terminate, the number of iterations on clustering is set to 100.
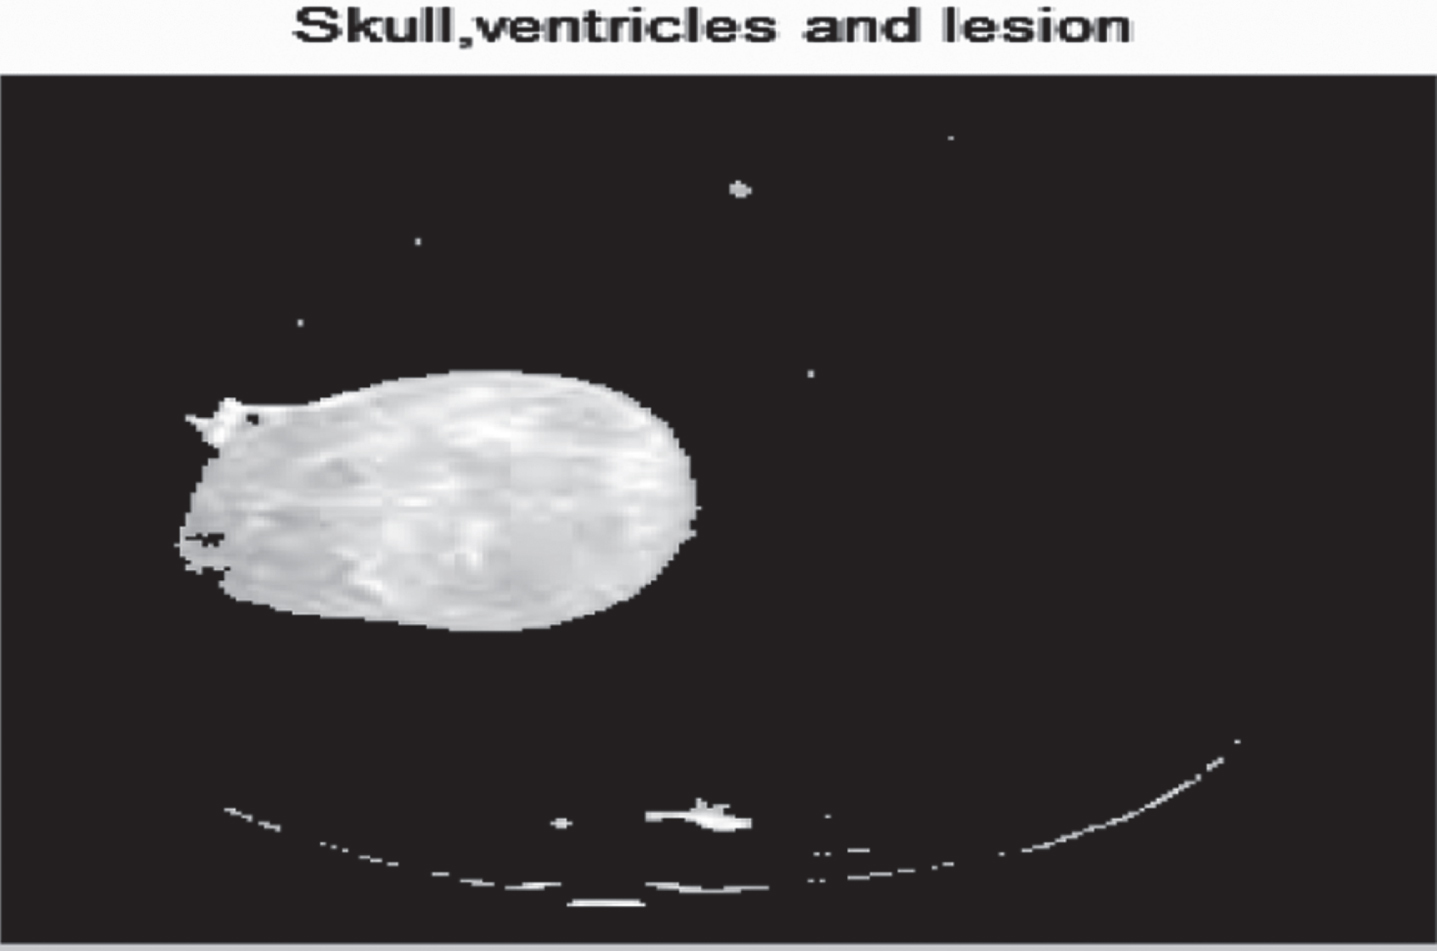
Higher intensity pixels of the segmented image.
For a better view of the segmented image a color map is also drawn from the segmented image (Fig. 10). In-order to extract the lesion from the colored map, apply GT by drawing out the higher intensity pixels along with neighboring pixels and assigning the value 1. Again, assigning 0 for other pixels derives the exact location of the lesion (Fig. 11) also preserving its precision. The number of pixels grouped are calculated to be the area. The number of visible pixels grouped together is calculated in descending order and thus eliminating the minimal values aid in extracting the tumor alone.
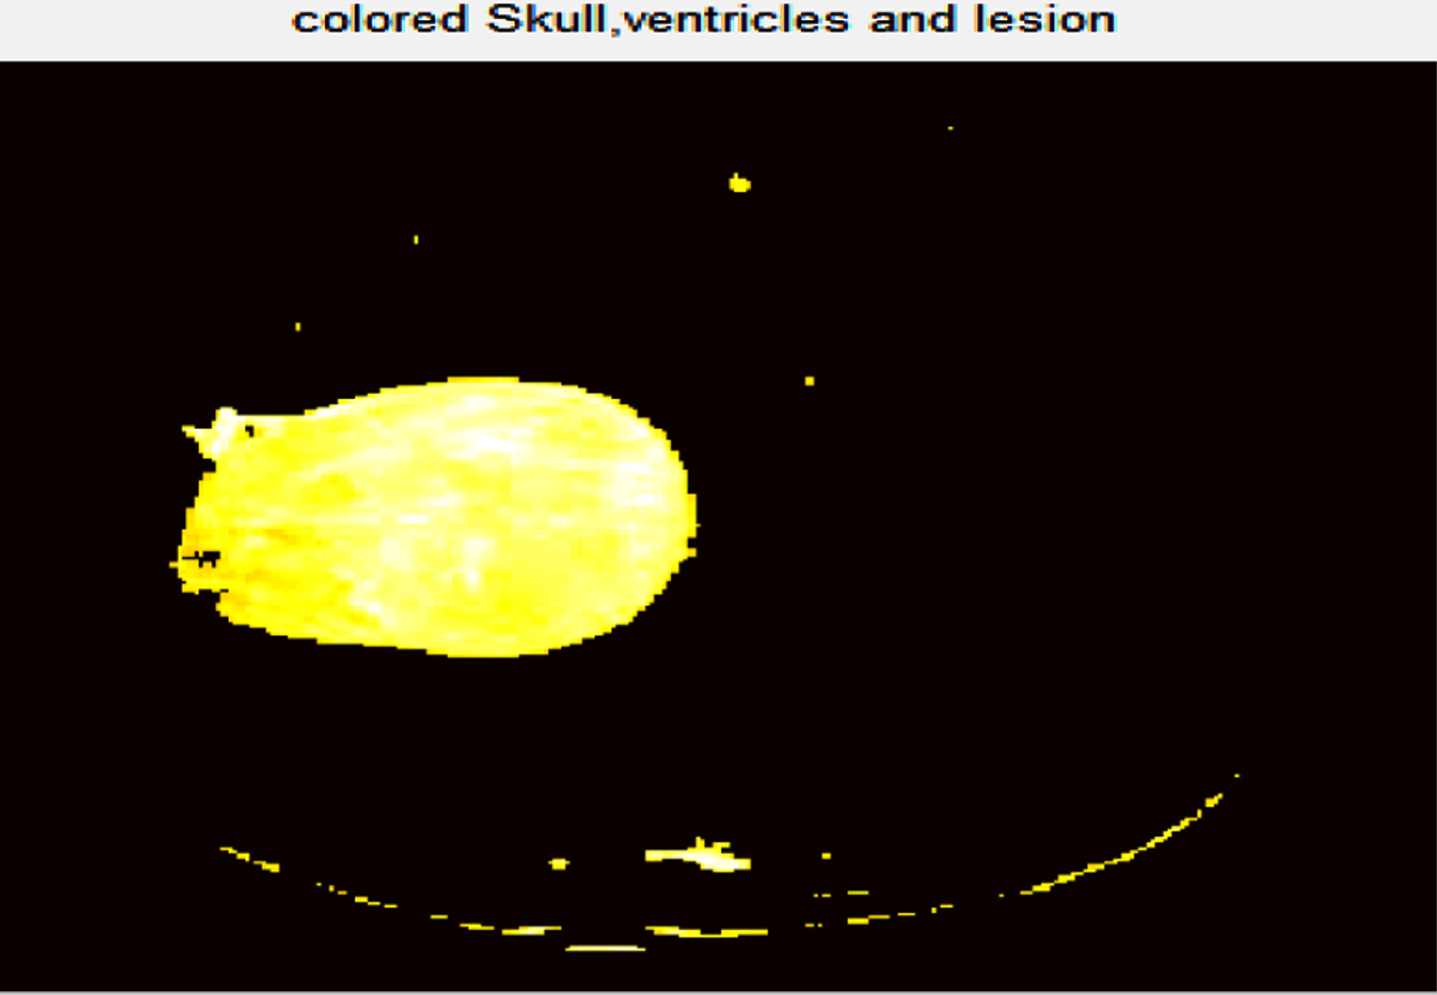
Color map applied to the segmented image.
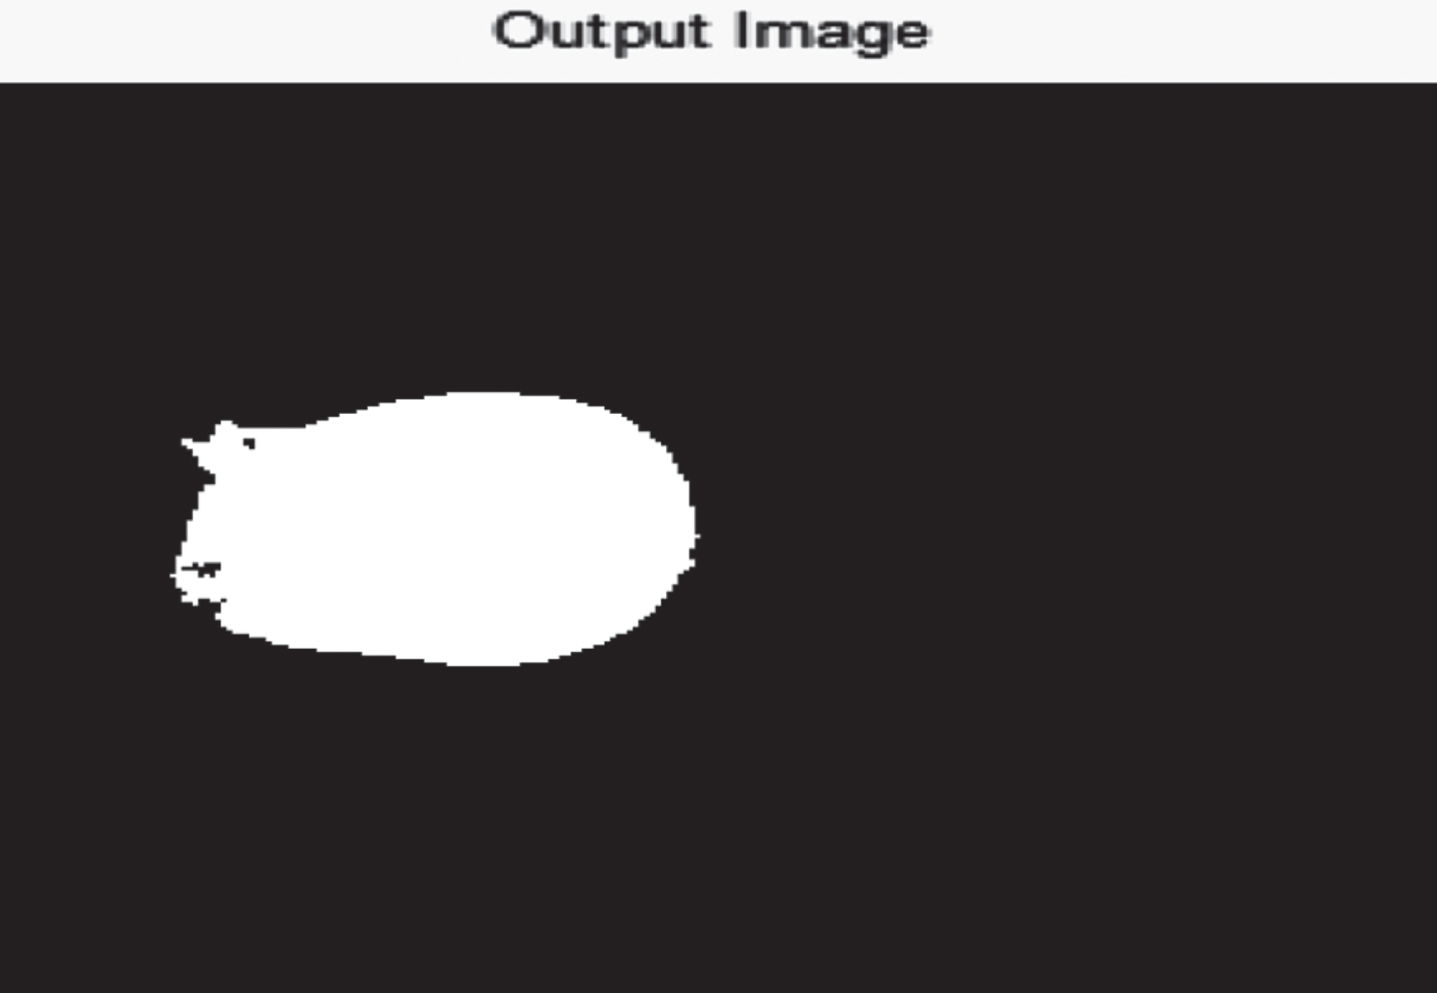
Abstraction of the cyst.
Hence, this GT-CM segmentation helps in extracting the needful features by reducing intensity of the unwanted data from the big dataset without disturbing the spatial information and originality of the imperative data.
Now, for ground truth determination (Fig. 12) purpose, a manual extraction of the cyst is performed. Henceforth, the segmented image and the ground truth image take effect in evaluation of performance metrics based on the predictions of the outcomes.
Ground truth image by creating mask.
Performance of the proposed model is analyzed by determining the qualitative features of the image and calculating its quantitative parameters. This cognitive behavioral learning helps to calculate the statistics of the targeted features. By knowing the instances such as True Positives(X), False Positives(X’), True Negatives(Y) and the False Negatives(Y’), the following are metrics that assist in evaluating the performance of the proposed GT-CM segmentation method.
Sensitivity
Sensitivity is the measure of the proportion of all the actual positives that are identified correctly. Which means the proposed model potential to report a positive result for the disease in a ill patient. It is given by,
Specificity is the measure of the proportion of all the actual negatives that are identified correctly. Which means, the proposed model potential to report a negative test result for a illness free patient.
The values of Sensitivity and specificity show efficient results in the performance of the proposed model. Table 1 shows the various sensitivity and the specificity values for all the database considered based on the GT-CM segmentation.
Sensitivity and specificity % values for the 12 intracranial cysts images
Based on the earlier and the proposed GT-CM segmentation algorithm, a comparative analysis chart (Fig. 13) is generated with the sensitivity and the specificity values.
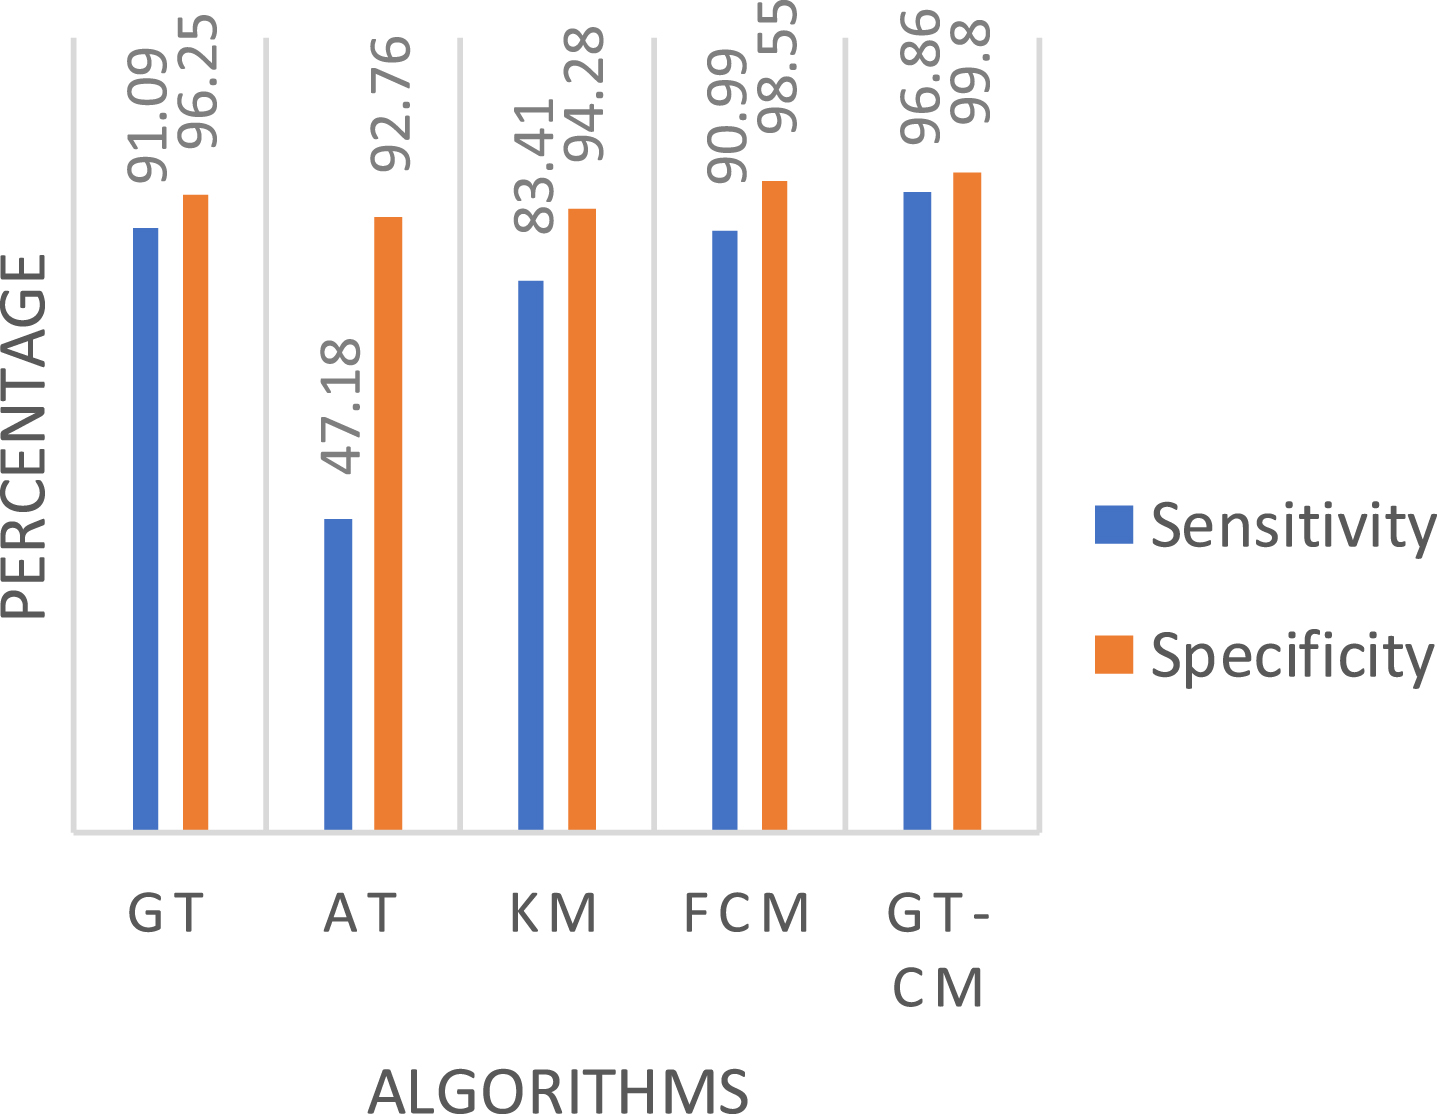
Comparative Analysis of GT-CM model’s performance with some existing methodologies.
GT-CM algorithm proves to be efficient compared to that of the studied existing methodologies [1]. Further, several more segmentation scores are discussed.
Precision is the percentage of the proposed algorithm assumption of cyst where the cysts is present actually. It only considers the positive predictive values stated by,
This is another accuracy protocol of the proposed model which is measured by the previously obtained precision and the sensitivity values specified by,
More accurate the proposed model will be with higher values of F score. The following shows the efficient performance of the GT-CM model with the F score value determination for all the twelve databases.
Based on the harmonic mean of the sensitivity and precision values of every database, the determined F score values and its corresponding graph structure (Fig. 14) shows that the proposed model is efficacious.
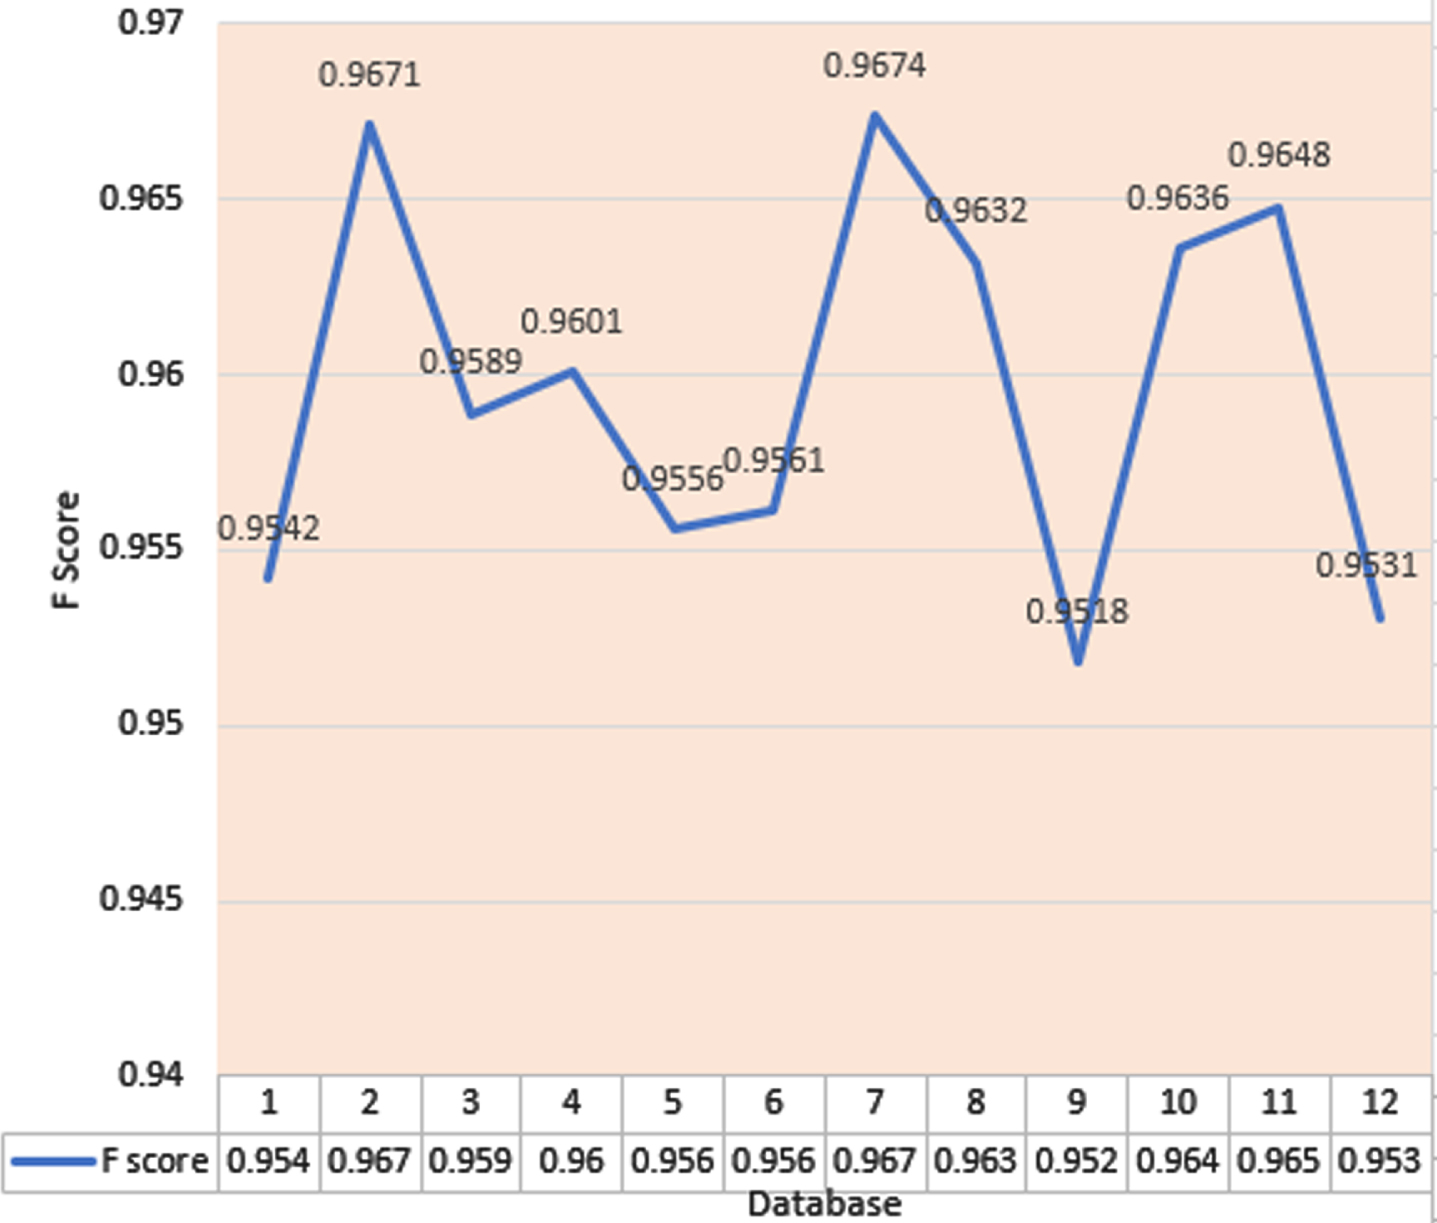
F score graph structure for GT-CM model with values lying between 0.95 and 0.97.
It is again a performance measure that measures the overlap between predicted and the original values of the model.
It is the similarity index that compares and considers the common values between the predicted values and the actual values. The formula is derived from dice co-efficient.
Table 2 interprets the GT-CM model’s and the existing model’s performance. Considering the performance metrics for one of the database, higher values of Jaccard and Dice Co-efficient for GT-CM model is the resultant analysis based on the comparison (Fig. 15).
Performance based on existing [2] and proposed method
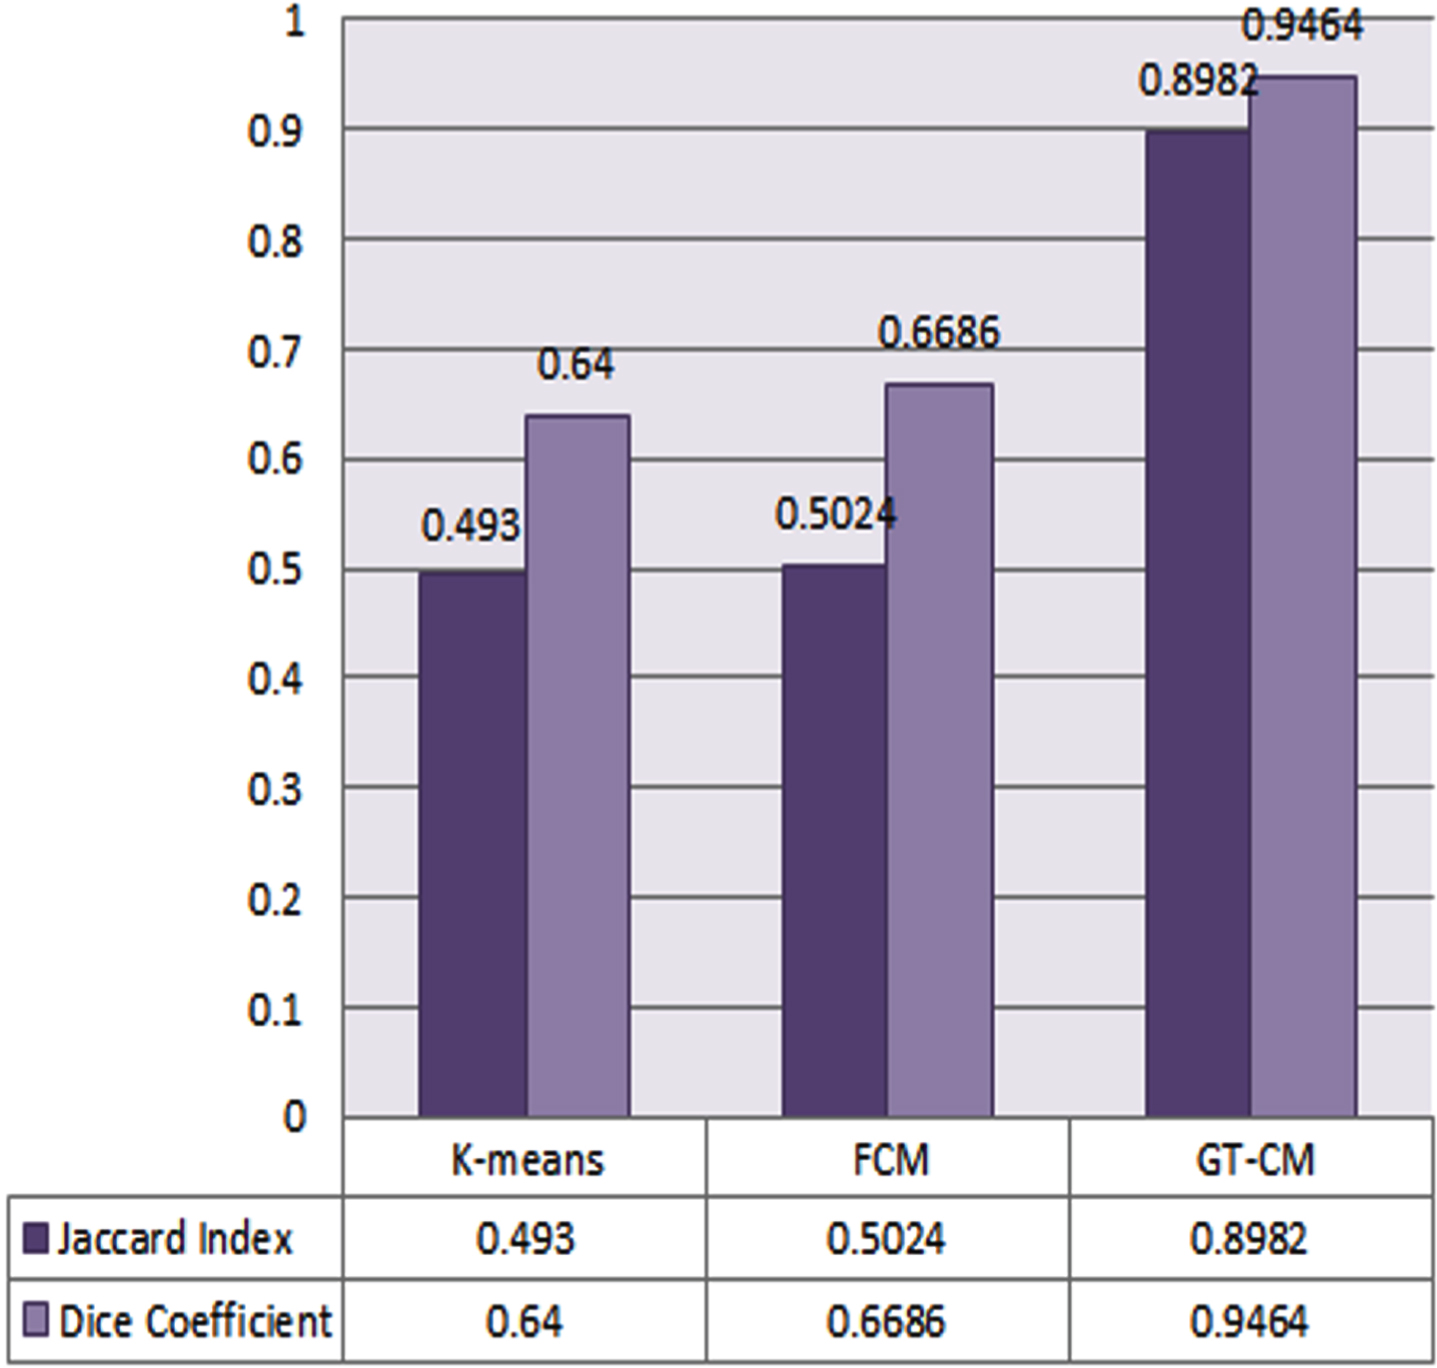
Comparative analysis of Jaccard Index and Dice Co-efficient with existing models [2] and GT-CM model.
Accuracy is the proportion of exactly classified instances such as True Positives(X), False Positives(X’), True Negatives(Y), False Negatives(Y’) and is given by
The gray scale image of the order 256 × 256 with 65,536 pixels segmented by the proposed model segregates pixels of different intensities into four clusters whose clustered accuracy is found to be higher as reported in the Fig. 16.
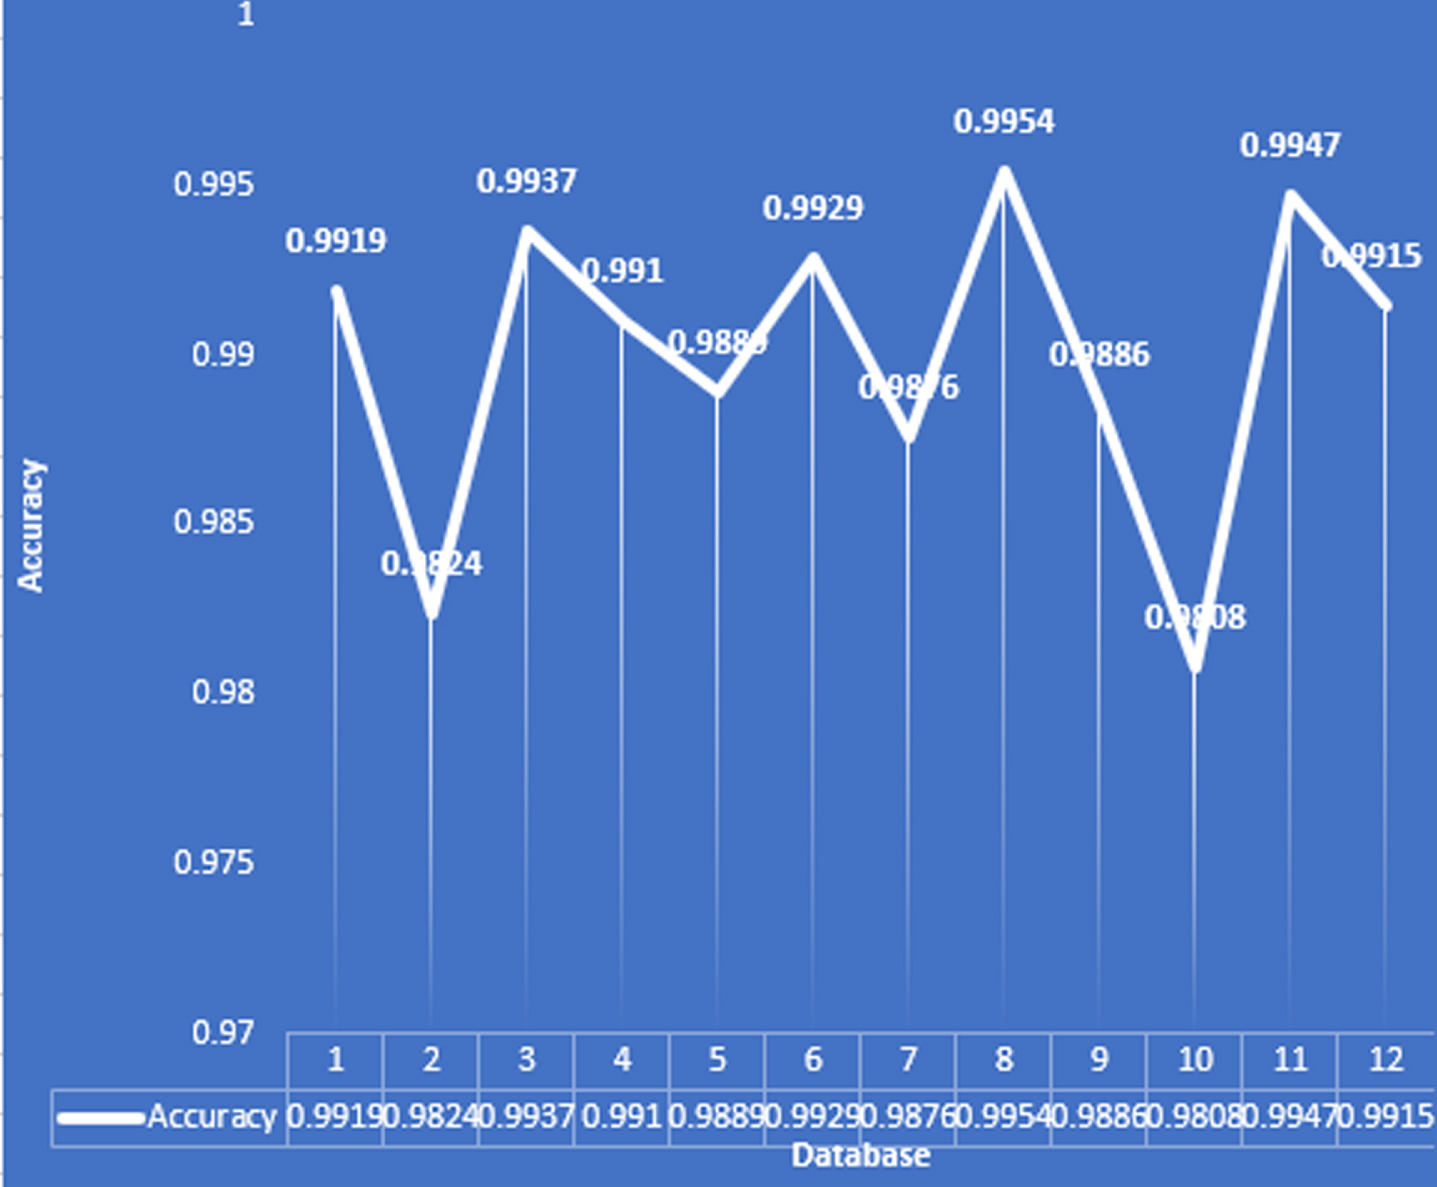
Chart depicting higher accuracy values which accords higher impact to GT-CM model.
Pictorial depictions for the pixels clustered into four classes are shown in Fig. 17. Index each cluster by considering only pixels with highest resolution (Fig. 17) and label the images based on exterior part of the skull, interior part of the skull with ventricles along with lesion and the noise, boundary of the skull and the lesion. Thus the indexed image (Fig. 8) obtained is segmented by applying global thresholding taking only the highest intensity pixels and assigning the value 1 and assigning 0 for the rest of the pixels thereby generating the accurately extracted lesion image (Fig. 9).
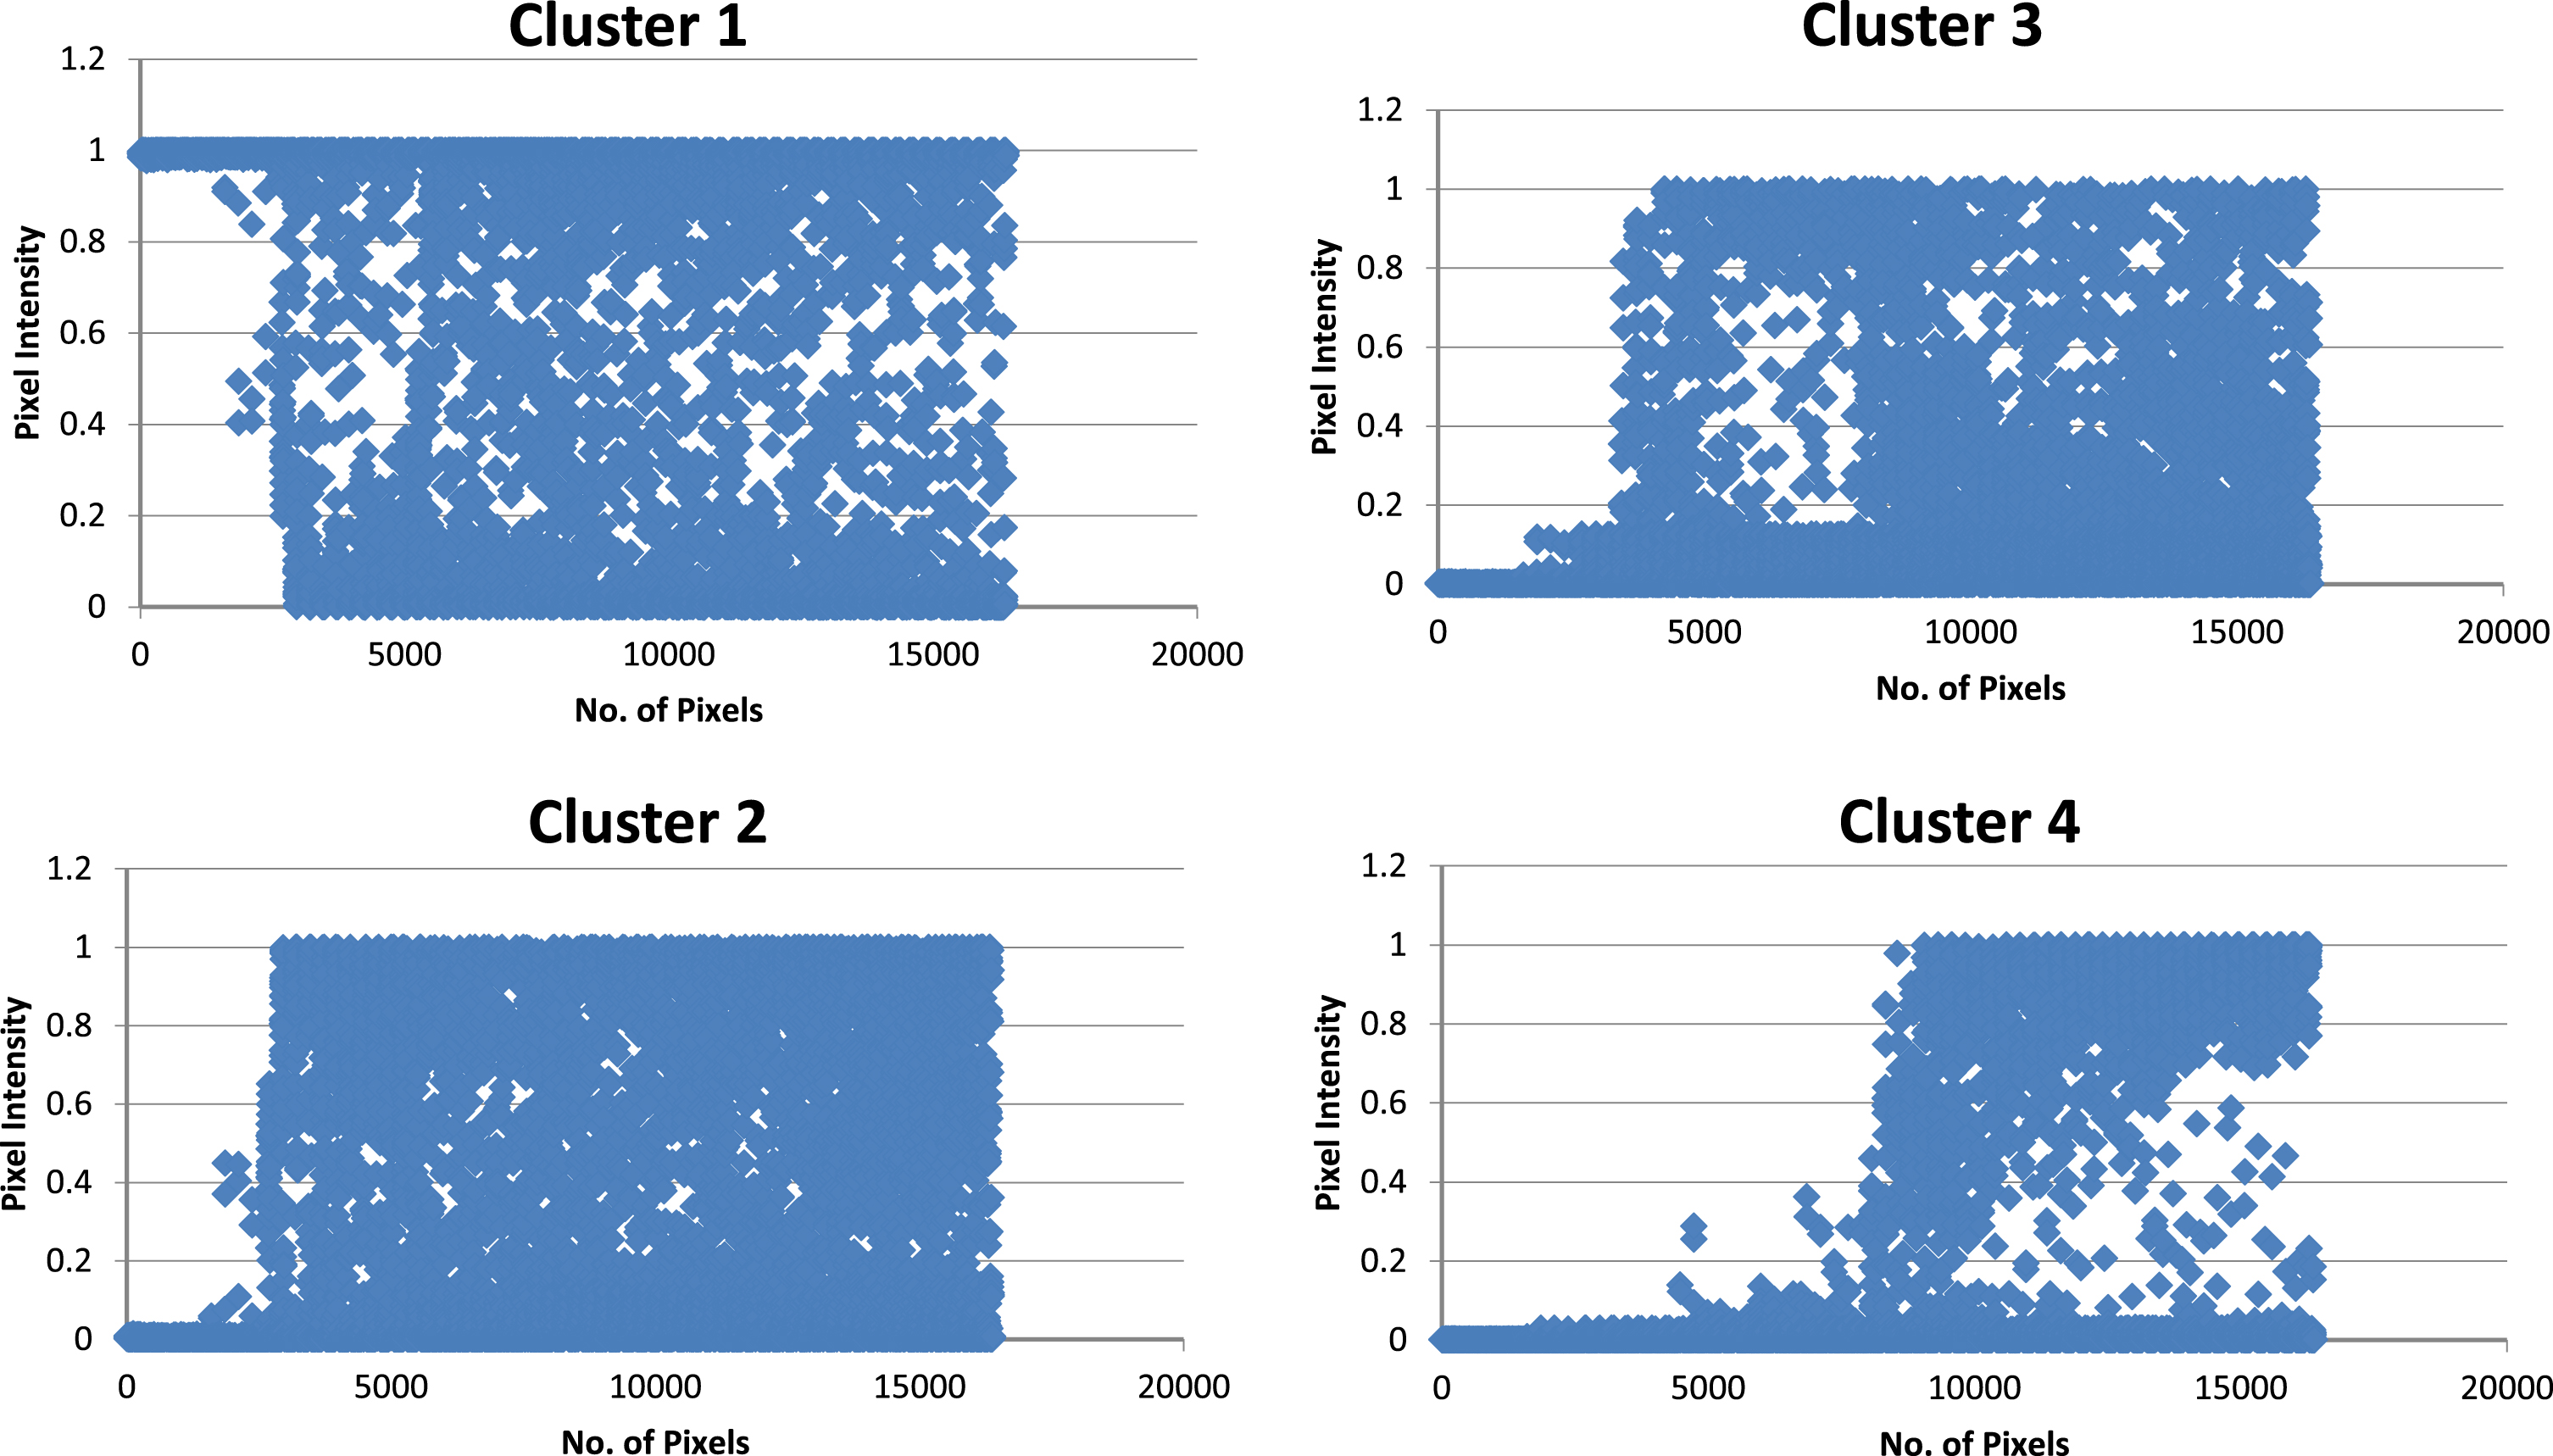
GT-CM based segmented pixels into various clusters.
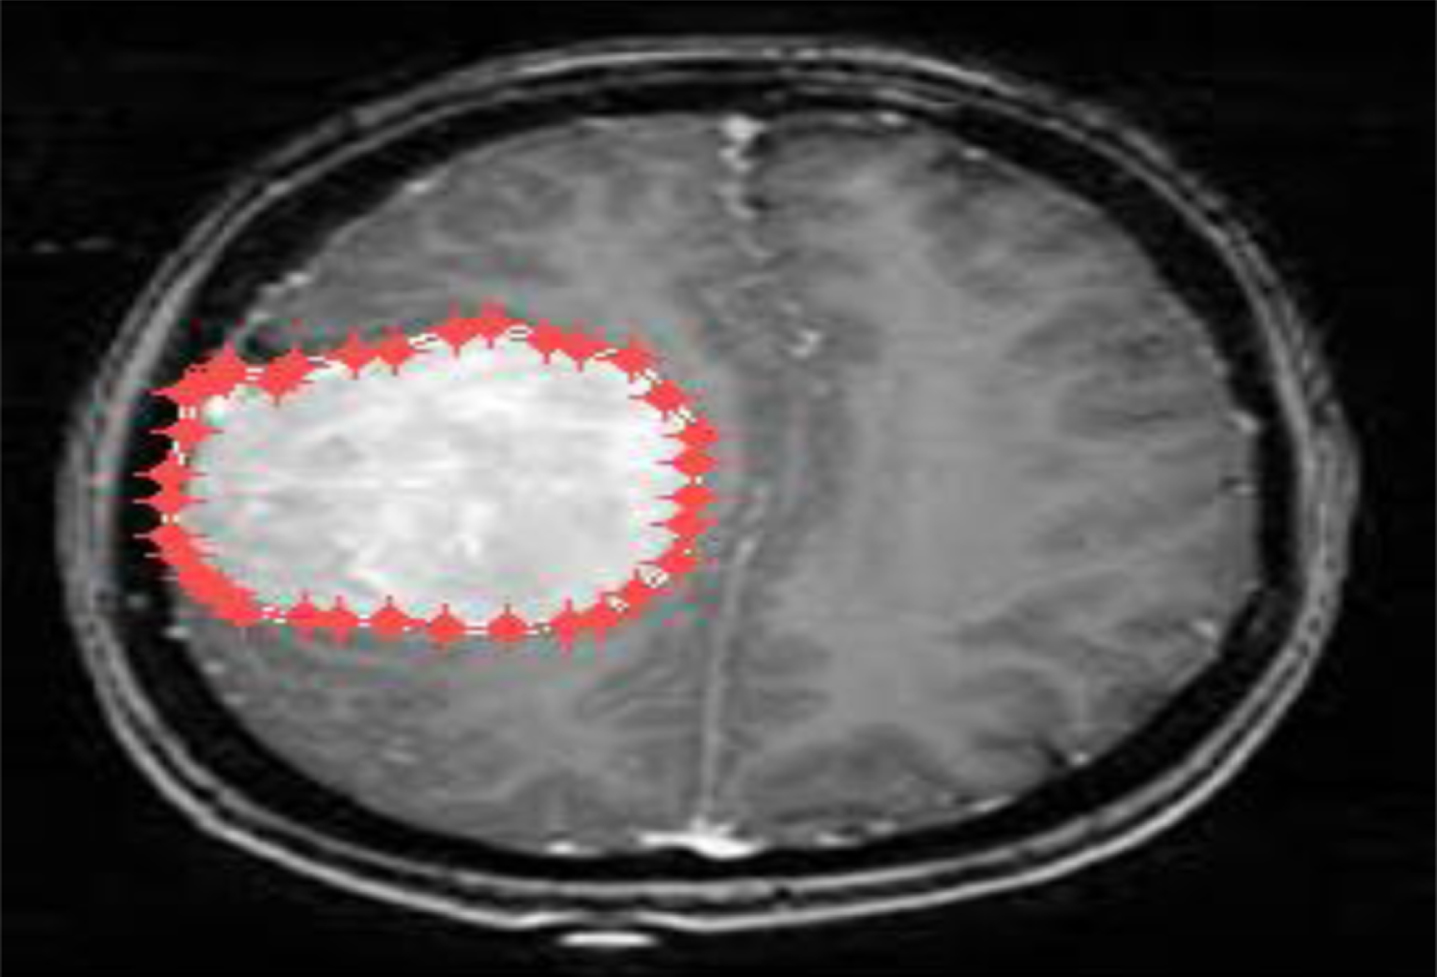
Now that the skull and lesion in it is left out, the major axis and minor axis length is calculated. By estimating the perimeter of the skull and the lesion, the minimum area is eliminated and the maximum area is considered, thereby extracting the lesion region. Hence, the proposed model is a highly accurate segmentation methodology in the intracranial lesion detection with an accuracy of 99.3%. The time for computing by means of GT-CM is found to be 8.319569 seconds thus accomplishing a highly versatile model for segmentation.
The number of pixels in the lesion region is calculated. Out of 65,536 pixels, 5731 pixels in the image are affected which is the lesion region thus obtaining detail oriented size of the cyst.
So, apart from the common image enhancement tools, fuzzy plays an important role in medical imaging providing convenience to handle non-specific features thus aiming in diagnostic reliability of the MRI system results by assessing the cystic tumors.
This novel method proposed for the intracranial cyst detection formulated by fuzzy partitioned GT-CM segmentation decomposes the brain lesion image into several disjoint clusters of high intensity pixels. An assignment of membership value for the data points through fuzzy exhibit a highly defined matrix faithfully separating the cyst from the exterior region, the interior region that includes ventricles along with the other anatomic structures of the skull including the noise. Finally, the segmented image by Global Thresholding (GT) methodology show beyond doubt that the pixels in the ROI and its clusters segregated are 99% accurate based on its statistical analysis. The various attributes of the lesion such as its size, location aid the radiologist to read the result precisely at a very fast computation time which is approximately 8 seconds.
In the earlier phase, with GT [4] it was found that there is a large overlap of grayscale values and also its sensitive behavior to noise and grayscale unevenness has led to incorrect results. But only with the implementation of GT in the proposed system, the tumor and its features are highlighted. Although, the accuracy results are high, the fact cannot be ignored that GT at once which was a counterproductive method had to be implemented which is a shortcoming of this proposed method. But then, with the integration of FCM methodology this drawback is overcome.
Though, the implementation of this proposed methodology is contributed towards the detection of the tumor along with its detailing, sooner or later at some point as the studies suggest [21] classical computers will be replaced by quantum computers. In the quantum era, this GT-CM methodology needs a quantum algorithm or a quantum encoding system to be fused with to fit into the quantum system for the detection of lesion which is going to be the future work of this study.