
Abstract
Multi-scale defect features, blurred edges and inability to locate geometric features have been the three key factors limiting the detection of surface defects on quality control system in the industrial manufacturing process. In this study, a method based on the fusion of multi-scale features and pixel-level semantic segmentation is proposed for the detection of surface defects. The proposed method firstly fuses multi-level feature maps to balance the expressiveness of multi-scale features, then adds a boundary refinement module to enhance the accurate inference of edge fine-grained, and finally adopts an en-decoder architecture to locate geometric features at the pixel-level for each type of defects, realizing intelligent detection of geometric features of end-to-end multi-scale defects on the surface of parts. We conduct experiments using the collected parts datasets to evaluate the effectiveness of our framework. The experimental results show that the proposed model achieves MIoU of 80.1%, the recognition accuracy reaches more than 95 %, and a detection rate of up to 29.64 FPS, demonstrating the advancement and effectiveness of the proposed method with less misclassification and superior generalization performance and has progress and effectiveness in detecting surface defects of multi-scale features. It provides a research idea for the subsequent realization of surface quality inspection in the manufacturing process system.
Keywords
Introduction
Quality control has always been an important stage in the industrial manufacturing process. It is a challenge to integrate quality control processes into the production line to achieve smart manufacturing and autonomous execution [1]. The digitization trend of Industry 4.0 [2] and the Internet of Things (IoT) [3] have led to an unprecedented growth of data in manufacturing, introducing new capabilities in a data-driven manner to transform product quality control systems in industrial manufacturing processes and allowing for intelligent software control. Functions such as mass customization can improve the operational efficiency of manufacturing processes [4], so the importance of applying intelligent manufacturing technology to comprehensively perceive production status and intelligently optimize process operations is gradually being widely used in the industry [5].
As the basic unit of industrial manufacturing industry, parts are the necessary factors to support the sustainable and healthy development of manufacturing industry. However, surface irregularities such as blisters, cracks, scratches, and other defects may occur [6, 7] during the manufacturing process of parts, resulting in its rigidity and strength and other properties being affected, the performance is lower than the expected target, some problems even reduce or seriously damage the safety performance of the engine and vehicle [8]. Therefore, it is increasingly important to optimize the quality control system of parts in the manufacturing process to assess the suitability and safety of parts early. At the current stage, most parts manufacturing industries rely on manual visual inspection (MVI) to complete full or random product inspection, which is not only economically inefficient and affects production efficiency, but also easily leads to missed detection and misjudgment of product quality defects.
Therefore, building an intelligent quality inspection system (IQIS) is the key to achieving efficient product surface quality inspection. Machine vision technology has a wide range of applications in IQIS. Machine vision-based surface defect detection methods mainly focus on pre-processing the surface images of products to enhance features, and then use recognition algorithms to classify these features into a given type [9–11], this kind of method is known as image processing methods (IPM). For example, the paper [12] combines a grey-scale co-occurrence matrix and a Gabor wavelet transform method to obtain a comprehensive range of texture features for aluminium profile defects, significantly improving the efficiency of online detection of surface defects in aluminium profiles. The paper [13] used the adaptive thresholding method to extract geometric features of aluminium plates and used shallow BP neural networks for defect classification to successfully identify surface defects of aluminium plates, with an identification accuracy of 94%. The paper [14] used an X-ray image texture-based method to extract autocorrelation moments and wavelet coefficient moments as basic classification features based on image texture analysis, and selected the nearest neighbor method based on weighted Euclidean distance to achieve the classification of aluminium alloy images. Compared with MVI method, IPM has the advantage of long-term operation in complex production environments, effectively improving the accuracy and efficiency of quality inspection. However, IMP still has limitations, current feature extraction schemes usually require extensive expert experience and lots of experiments, the complexity of this process leads to high costs and time consumption, and does not guarantee long-term validity and generalization, making it difficult for IMP to gain traction in practical applications.
However, with the rapid development of deep learning technology, data-driven techniques are gradually favored by researchers and engineers [15], and the deep learning-based surface defect detection (DL-SDD) method has been widely used in various industrial scenarios, and has become the mainstream method in the field of defect detection. It can learn features from the bottom data and is more capable of characterizing complex structures, resulting in superior results. At the same time, due to its rapid adaptability to new products, DL-SDD is ideal to solve product quality control problems on flexible production lines required by the manufacturing industry [16]. For example, the paper [17] used a deep convolutional neural network (CNN) to extract the features of aluminum extrusion defects in videos, and effectively-identified common surface defects of extruded aluminum profiles, achieving 98%detection accuracy in detection. The paper [18] built an improved You Only Look One (YOLO) network to detect six types of steel strip surface defects, achieving a final mAP of 97.55%and a recall of 95.86%. The paper [19] used a novel lightweight detection method based on an attention mechanism, focusing on industrial applications for aluminium strip defect detection. Experiments show that the method achieves a 96.28%mAP, an 83.38%reduction in volume compared to the original model, and a 3-fold increase in detection speed.
Although the DL-SDD method has been proven to have a better generalization and detection rates, there are still three problems. Firstly, surface defects on parts surfaces are usually characterized by different sizes, uncertain locations and different shapes, including large-size defects such as scratches and cracks, but also small-size defects such as porosity. The single-resolution features output by the general backbone network usually contains some specific receptive field scales, which leads to the imbalance of feature expression capability and makes it difficult to detect multi-scale defects. Therefore, how to design networks that can simultaneously consider multi-scale feature (MSF) extraction has become the focus of research [20], for example, Wei and Bi [21] designed a multi-scale deep CNN for detecting multiple defects of various sizes on aluminum contours. Secondly, due to a large amount of noise interference in a real and complex industrial environment, and the low resolution of advanced feature maps after multiple convolutions, there are usually small differences and low contrast between surface defects and background, resulting in an inability to accurately locate defect edges and small defect. Finally, most DL-SDD methods use convolutional neural networks to classify or output defect bounding boxes, which can only present classification results or defect types and locations at the grid-cell level. More specific geometric feature localization and recognition cannot be achieved. In order to obtain the geometrical characteristics of surface defects, such as their width, length and area, the location and class of defects need to be precise at the pixel-level.
In order to solve the above problems, this paper builds an intelligent real-time detection system for parts surface defects, detects the multi-scale geometric defect features on the surface of parts through the recognition method of pixel-level semantic segmentation (PL-SS), and uses real shot data to verify the proposed method. Firstly, the paper analyses the appearance and size characteristics of product surface defects, and attempts to enhance the representation and classification of multi-scale defects by improving the backbone feature network and using MSF fusion. Then, a boundary refinement module is added to enhance boundary information and fine defect extraction for the small differences and low contrast problems that usually exist between surface defects and background. Finally, the en-decoder architecture is used to classify the defects at the pixel-level, enabling a deeper level of fine-grained reasoning about surface defects. The main contributions of this paper are as follows:
A data-driven semantic segmentation online defect detection method is proposed to achieve the localization and identification of defects with pixel-level geometric features on the surface of aluminium alloy parts. An MSF fusion neural network is built for multi-scale defects, capturing multi-level information from the global context simultaneously in a deep-level feature extraction network. A boundary refinement module is added to enhance the high response capture of edge details and improve the precise localization of fine defects. The feasibility of the real-time detection system is verified by a case study, which provides methods and technical support for the wide application of intelligent quality detection technology in the manufacturing process.
The rest of this paper is arranged as follows: Section 2 presents the proposed integrated learning model and algorithm in detail; Section 3 describes the datasets used for training and evaluating the network, the construction of the experimental platform, and the experimental process and comparative analysis; finally, conclusions and future works are given in Section4.
Methodology
This section first introduces the overall architecture of the inspection system, then describes the structure of ES-Net. Finally, the modules of the ES-Net are described in detail.
System overview
In order to create a new document, do the following: At present, there are still three challenges in surface defect detection of parts: multi-scale and multi-shaped defect features on the surface of parts; low contrast between defects and background and inaccurately locating defect edges or small defects; unable to realize specific geometric features location identification. To solve the above challenges, this study establishes a data-driven PL-SS method for detecting and classifying surface defects of parts, and monitors and optimizes the accuracy and efficiency of manufacturing process quality inspection in real-time. This paper first proposes an algorithm Efficient Segmentation Network (ES-Net) based on the fusion of MSF and PL-SS, which is optimized for three key existing problems. Then collects and manually labels a multi-type defect dataset to meet the data requirements of model training. Next, the self-made dataset is used to train and evaluate the optimal model. Finally, the model is deployed in the industrial field to achieve end-to-end multi-scale intelligent detection at the pixel-level. The specific system overview is shown in Fig. 1.

System overview.
In this study, the goal is to use PL-SS to localize and classify each pixel of multi-scale defects on the surface of parts, and obtain precise geometric features of the defects, thus defining a new deep fully convolutional network ES-Net for segmentation, which is based on the FCN [22] architecture. Firstly, the EfficientNet-B3 [23] is used as the backbone to perform the feature extraction, each node generates a multi-scale feature map through the fully convolutional network, depending on the size of the feature map, the model can be divided into eight stages, different stages have different recognition capabilities and therefore different consistency performance. Five stages with different size layers are selected for high and low-level feature fusion to fuse local and global semantic appearance information. Skips are then added between layers to enhance their dense prediction through network inward upsampling and pixel loss, mainly through bilinear interpolation for upsampling and high-resolution feature map fusion. The skip architecture is learnt to refine the semantic and spatial accuracy of the output. Then after each fusion, the feature map goes to the boundary detection module for edge detection learning to enhance the boundary information and fine defect extraction. After the last upsampling, a predicted image of the same size as the original image is generated. The framework of the model is illustrated in Fig. 2. Several important features of the model framework are described in detail in the following section.

Framework of ES-Net.
General machine learning algorithms and tools are mainly used in ‘big data’ and scenes with a large number of datasets, because the problem involved is to build a computer program that automatically improves with experience [24]. Using big datasets has significant advantages over the stability and flexibility of the trade-off model. When the dataset is very small, the model is easy to overfit, it is difficult to avoid the occurrence of outliers caused by data imbalance, and the stability of the model is the law. As a result, the use of machine learning algorithms and tools is often hindered. In this paper, compared to other methods using thousands of public datasets, our dataset is a small dataset, making some related methods unsuitable for the current task.
Researches [25, 26] show that the depth of the network is one of the important factors in visual recognition tasks, and deep convolutional networks can enrich feature extraction by stacking the depth of convolutional layers. But when the network becomes very deep, it becomes difficult to train, and the performance of the network gradually saturates and starts to degrade [27]. Therefore, the Efficientnet is used as the backbone to uniformly scale the depth, width, and resolution of the host dimension by compounding coefficients to deepen the network while still ensuring the feature extraction capability of high-resolution images, guaranteeing detection accuracy and speed while using a small dataset. The EfficientNet series architectures [23] have been shown to significantly outperform other networks in classification tasks while having fewer parameters and triggers.
This study selects Efficientnet-B3 as the backbone to select discriminative features and predict the unified semantic label of a certain category. From the experimental results of the Efficientnet series, Efficientnet-B7 does have the best experimental results. But with the current limited experimental hardware resources, we seek to find a good compromise between the number of parameters and computational complexity and the representation ability of the network. Efficientnet-B7 has the most parameters, and the number of channels in each stage is more than other models. Compared with other networks, it requires more hardware memory and a longer time for training and inference. Considering the rational configuration of the parameters of depth and channel width, and the performance of defect location and identification can meet the actual needs, we plan to use a lighter network, so we choose Efficientnet-B3 in this experiment finally.
It consists of eight stages, which are called stage 1 to stage 8 from left to right. The main structure is shown in Table 1. Its core part includes 26 MBConvBlocks. MBConv is an inverted linear bottleneck layer with deep separable convolutions. The detailed structure of MBConv is shown in Fig. 3. It mainly includes a 1×1 convolution for dimension up, which includes batch normalization (BN) and Swish activation; then there is a Depthwise Conv convolution of k×k, which has two cases: 3×3 and 5×5 (stride 1 or 2), then through an SE module. Next, there is a 1×1 convolution for dimensionality reduction, including BN and y = x linear activation, and finally the Dropout layer. The shortcut only exists when the input feature matrix of MBConv structure is the same as the output feature matrix shape. The main purpose of the SE module [28] is to enhance the key features. The detailed structure is shown in Fig. 4, which consists of a global average pooling and two fully connected layers. The number of nodes in the first fully connected layer is 1/4 of the MBConv feature matrix channels, and the Swish activation function is used. The number of nodes in the second fully connected layer is equal to the feature matrix channels output by the Depthwise Conv layer, and the Sigmoid activation function is used.
EfficientNet-B3 baseline network –Each row describes a stage i with
layers, which input resolution
and output channels
EfficientNet-B3 baseline network –Each row describes a stage i with
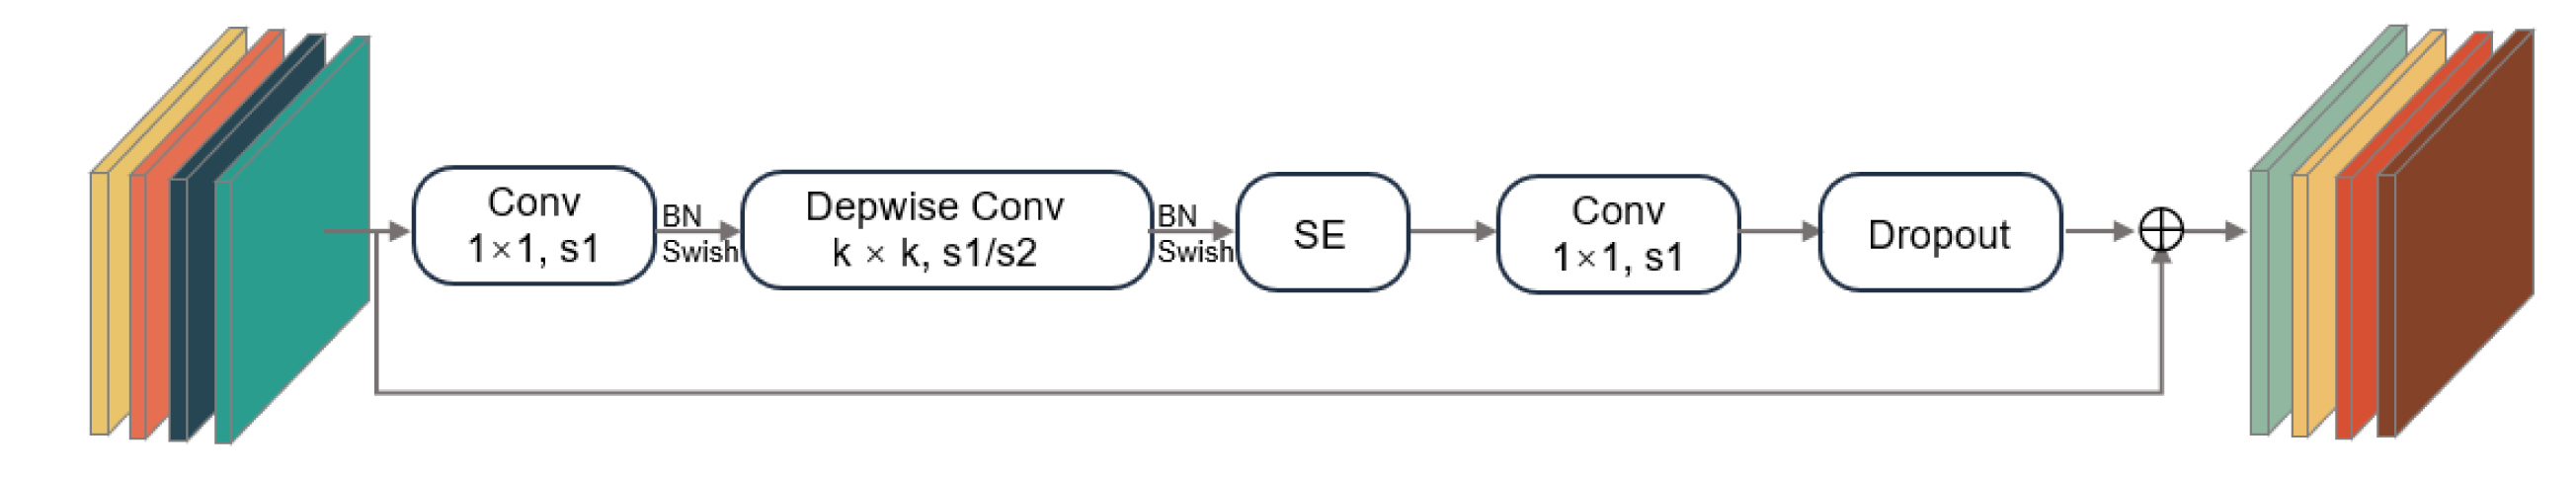
Specific structure of MBConv, where s is stride, BN is batchnomolization, swich is activation function, k is el size, SE is Squeeze-and-Excitation module.
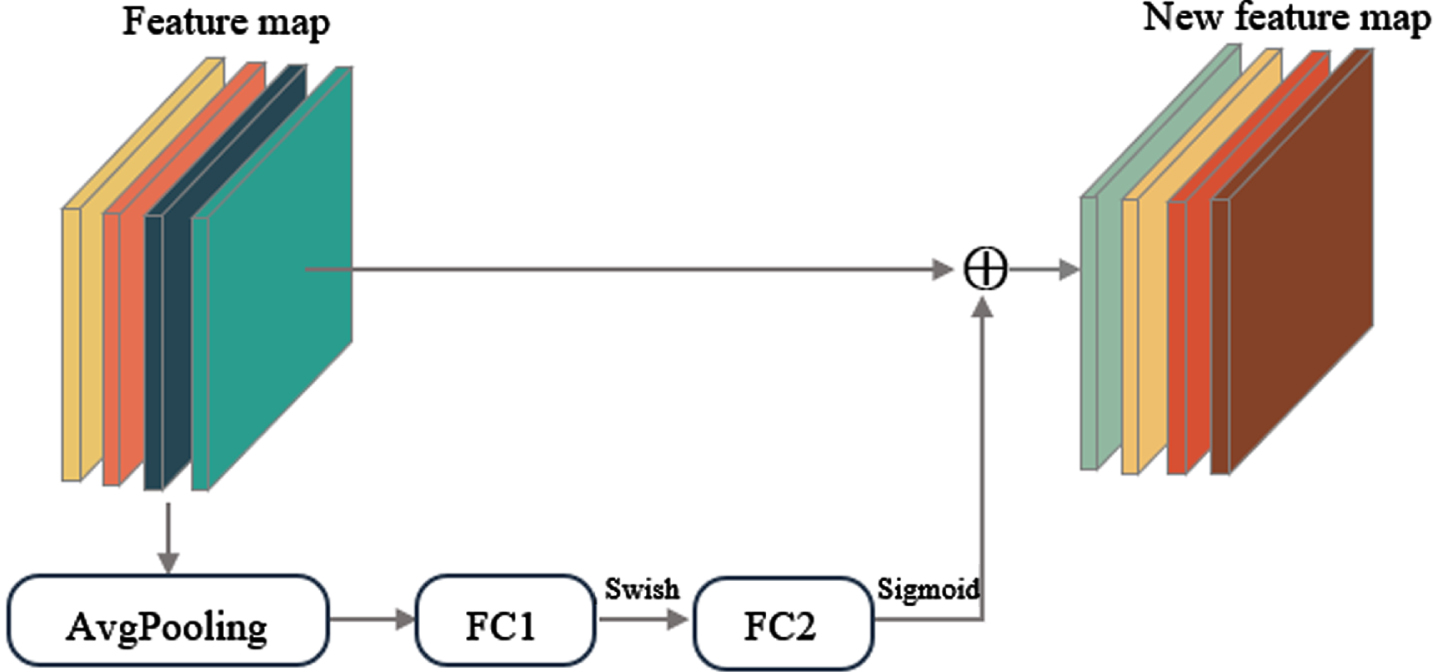
Specific structure of SE module, where FC refers to the fully connected layer.
During the feature extraction process, the size of the receptive field is very small in the low stage, which is sensitive to the microscopic and local feature information of the image [30], but the lack of contextual information prevents discriminative differentiation of large-size defect features; in the high stage, with the increase of the number of convolution operations, the feature map becomes more abstract and more inclined to express macroscopic and global information, but is unable to capture fine defect features due to the large receptive view. As Lin et al. [29] also showed that low-resolution feature maps are suitable for detecting large objects, while high-resolution feature maps are suitable for detecting small objects, and this pattern is logical and valid in most classification and detection tasks. However, in this study, the size of the surface defects of parts that need to detect is diverse, including large-size defects such as surface irregularities, while small-size defects such as porosity, miss-runs and foreign matters are also presented (e.g. Fig. 5). The diversity of defective properties results in significant feature size differences between defects, and the single-scale feature maps output by the backbone network perform poorly in detecting multi-size defects. To solve this problem, this paper chooses the method of multi-scale feature mapping, combining multi-scale features and global context features to encode local and global information to help realize multi-scale defect location and classification of surface defects.
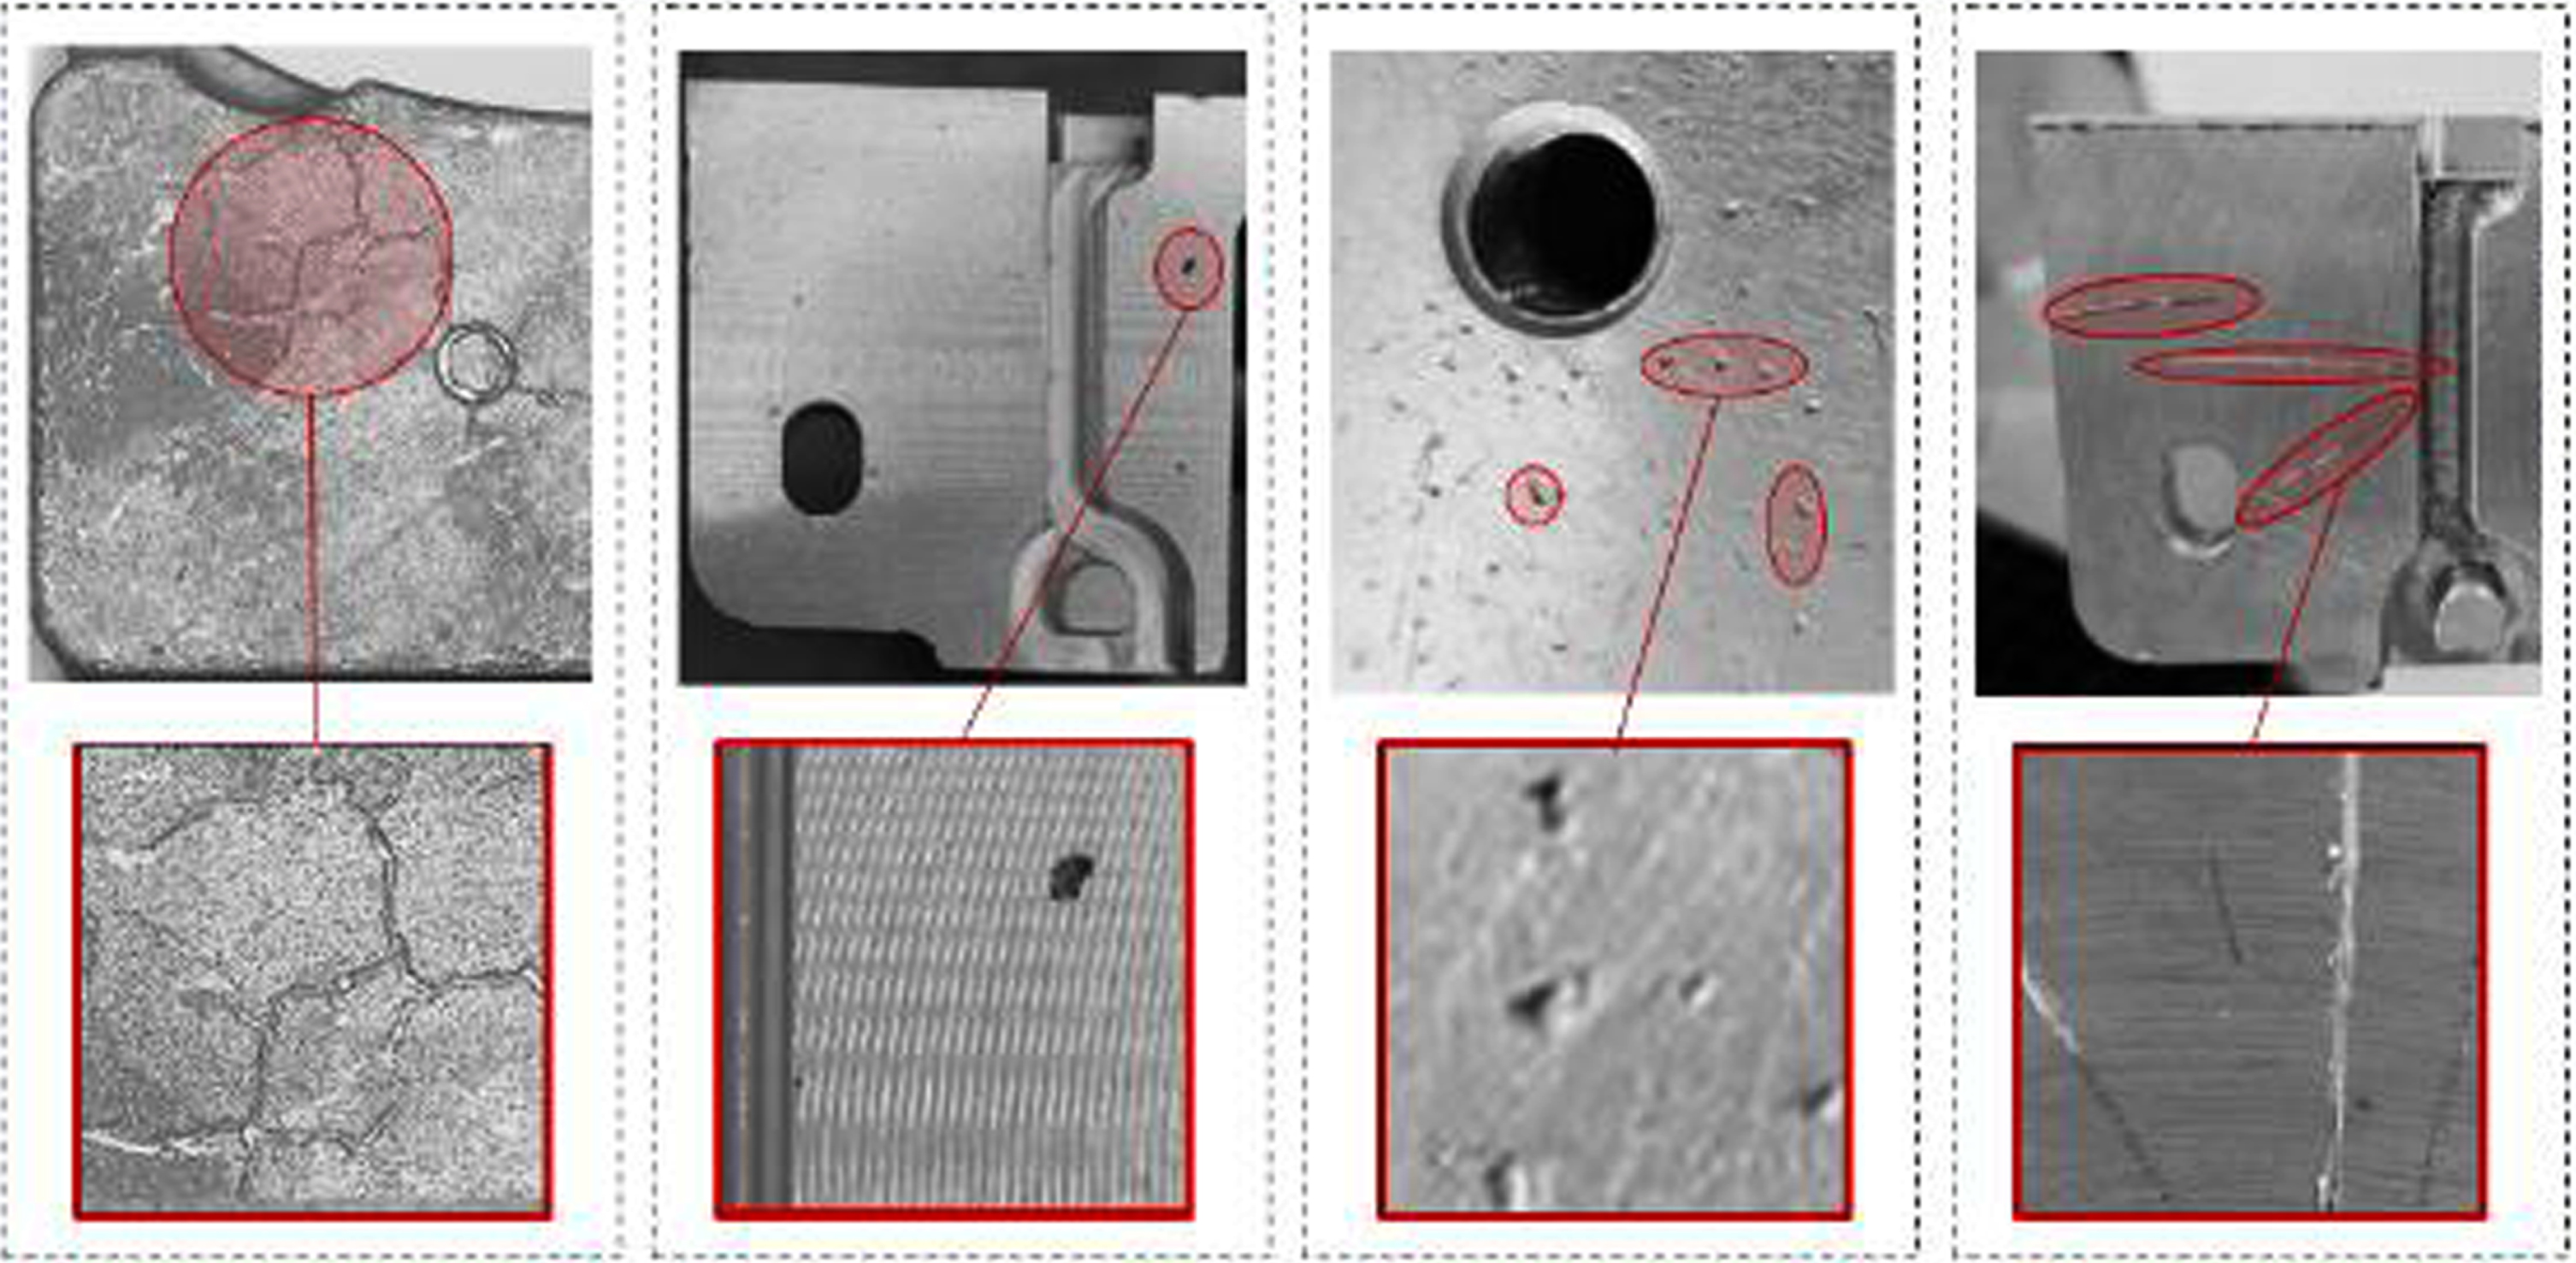
Multi-scale surface feature defects on the dataset. Red borders represent defects.
In this paper, we use the pre-trained EfficientNet-B3 [23] as the backbone network to extract features, generate abstract semantic features, and then fine-tune specific tasks. The backbone network consists of 8 stages (Fig. 6(a)). Each node generates a multi-scale feature map through a fully convolutional network. According to the size of the feature map, it can be divided into five blocks. The resolution of each block feature map is halved. Different blocks have different recognition capabilities, so the consistency performance is also different. They are represented by C1 (150×150), C2 (75×75), C3 (38×38), C4 (19×19), and C5 (10×10). These five feature layers are then used for high-level and low-level feature fusion. For example, C5 is selected for upsampling by bilinear interpolation, element-wise summation with C4, and boundary refinement to output P4 (19×19) (Fig. 6(b)), and so on to generate P3 (38×38), P2 (75×75), and P1 (150×150). After the last upsampling, a predicted image of the same size as the original image is generated. The whole feature fusion process is mainly to add jumps between layers, enhance its prediction density through inward upsampling and pixel loss, and learn the jump architecture to improve the multi-scale semantics and spatial accuracy of the output.
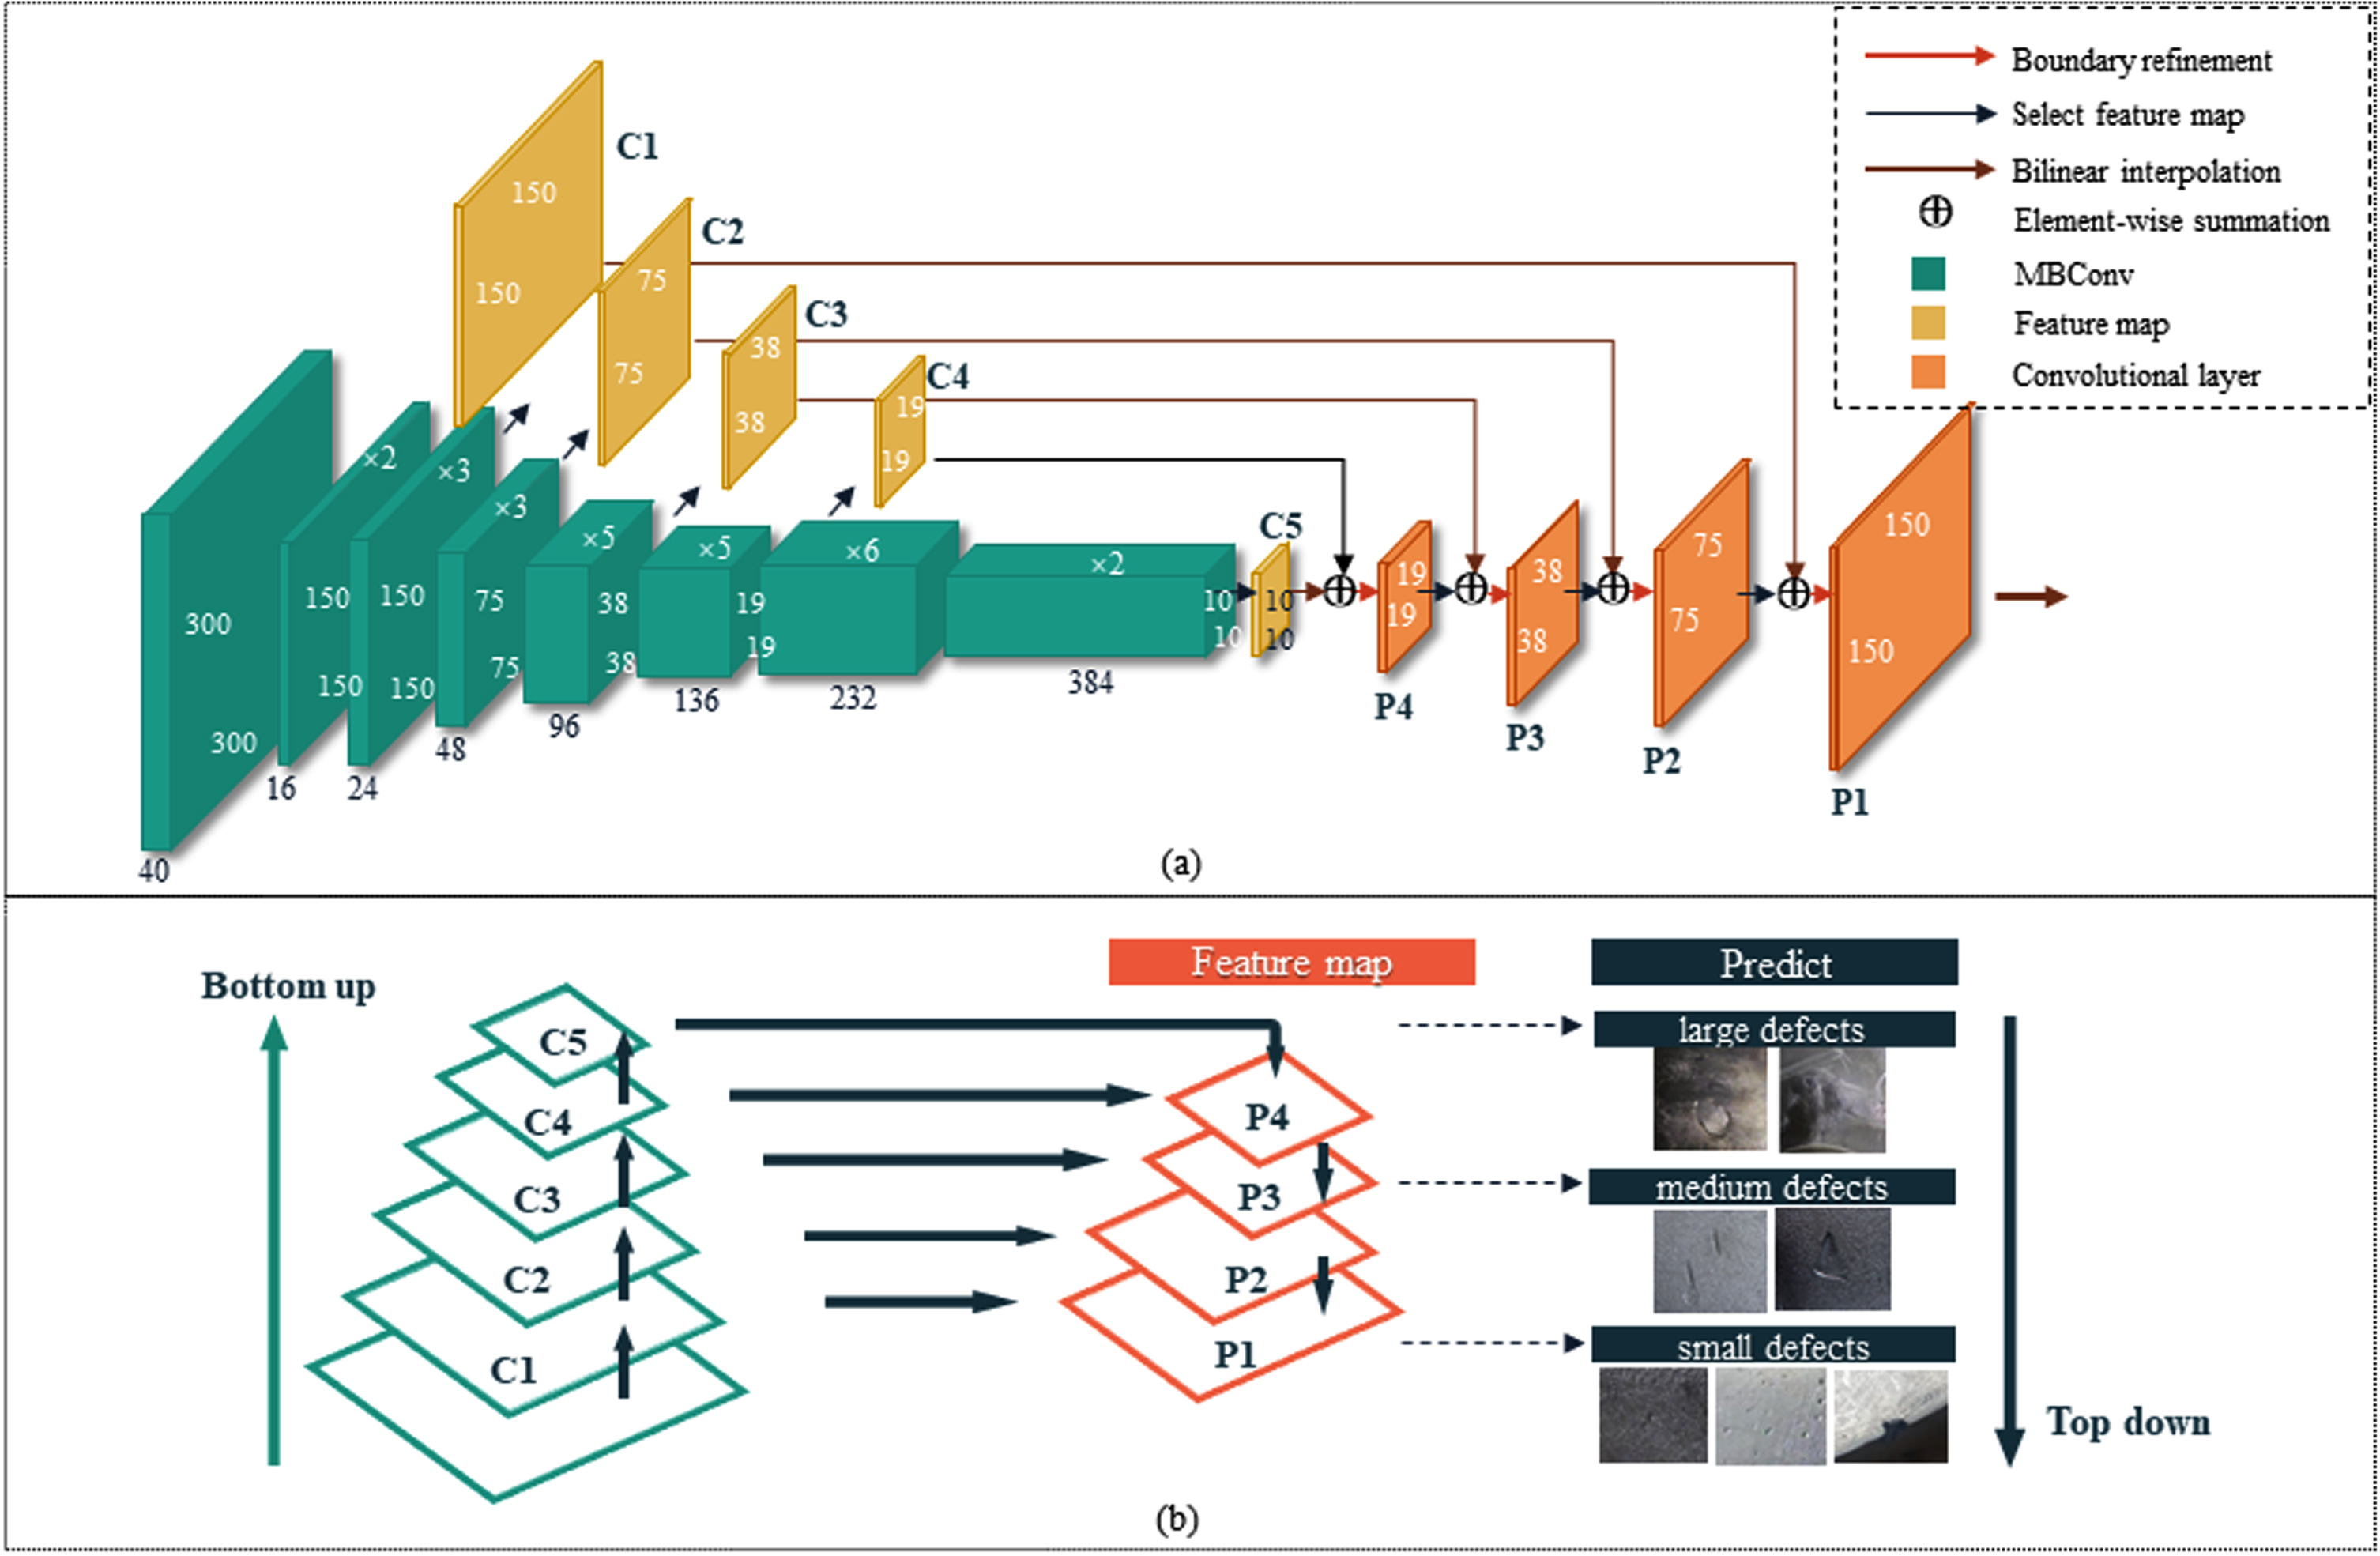
(a) Feature extraction and multi-scale feature fusion process diagram of ES-Net. (b) Schematic representation of the different stages of the model.
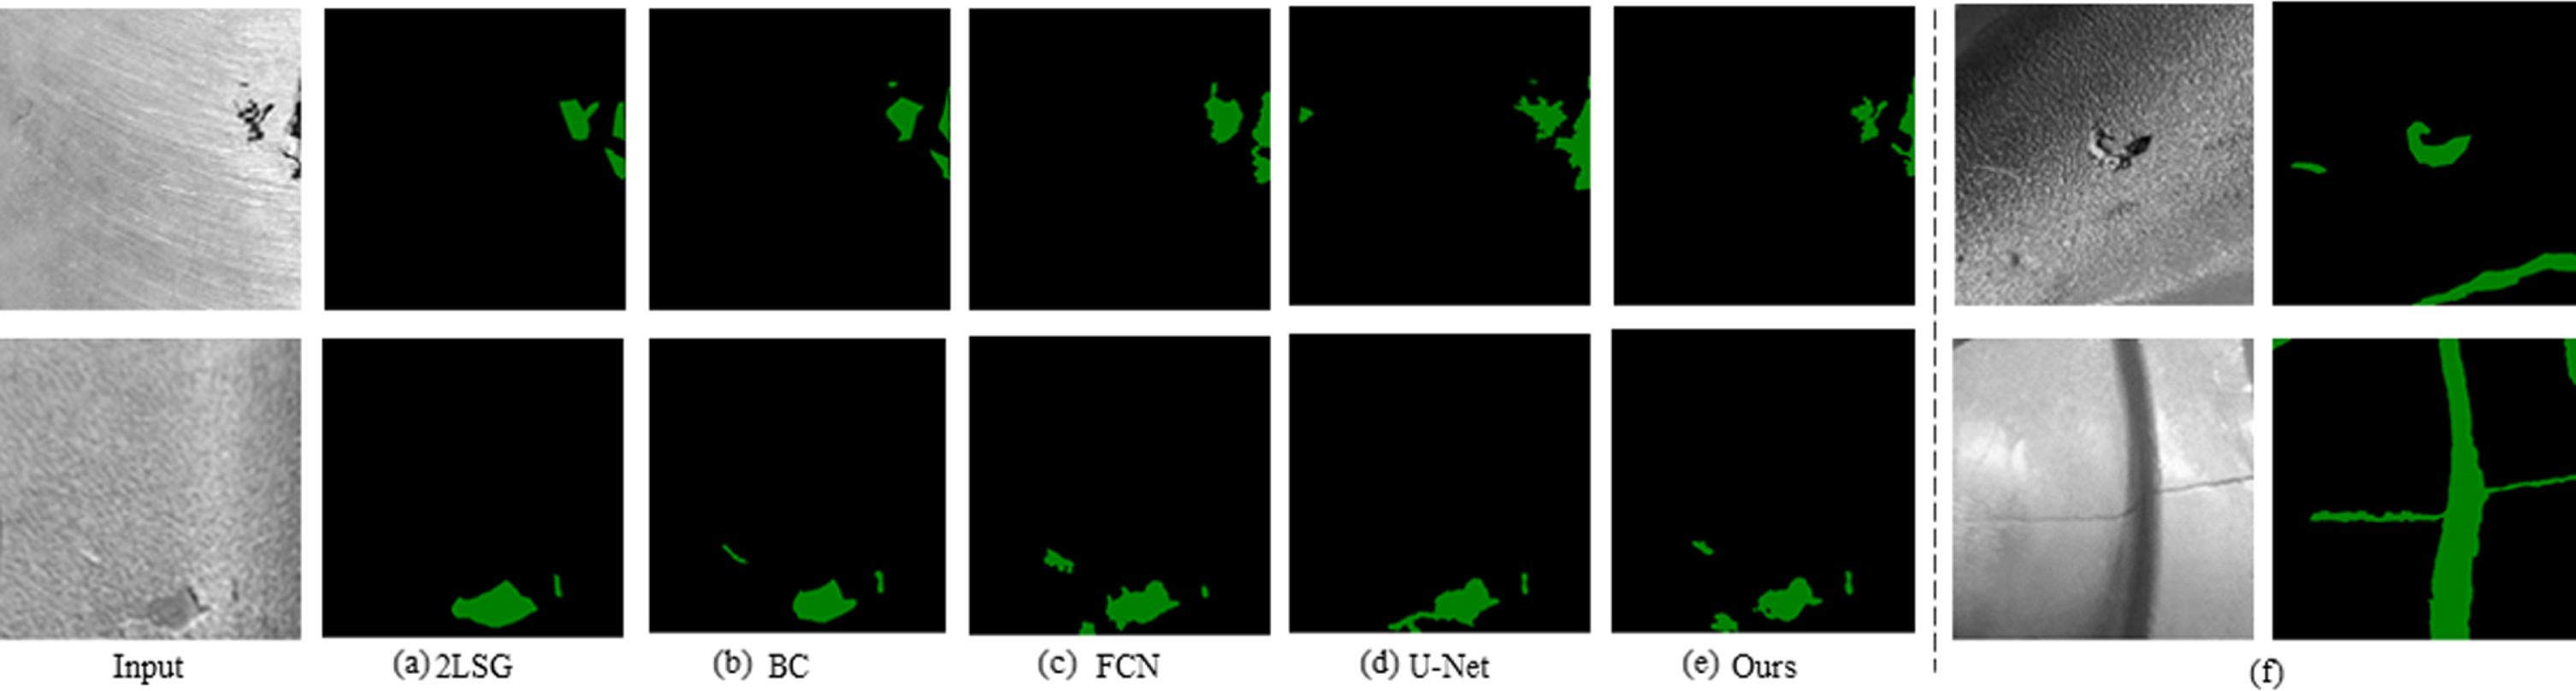
The high response to the defect edge in the defect detection task is an important factor in accurately segmenting defects, which determines whether to accurately classify the edge pixels and ignore small defects, so as to effectively represent various defects on the feature map. However, the edges of defect features (such as porosity, mis-runs, etc.) in industrial scenarios are not easy to extract (as shown in Fig. 7), especially when they are spatially adjacent, which can easily lead to confusion of prediction categories. Directly using traditional methods or semantic segmentation of natural image methods to detect defect images may not achieve good results (as shown in Fig. 8(a) (b)). Traditional natural image methods using 2LSG [31] and BC [32] perform poorly and can only roughly calibrate the location of prominent defects. The detection accuracy of the natural image method based on semantic segmentation has been improved, but the local details look blurred or even missing (Fig. 8(c) (d)). The main reason is that most of the existing methods in the semantic segmentation task regard it as a dense recognition problem, trying to distinguish adjacent patches with similar appearances but different semantic labels. When the image is convoluted into a high-level feature map, the resolution of the feature map is usually low. This may lead to blurring of defect boundary, slight deviation of defect location, and weakening of representation ability of small-scale defects. And this method integrates a large amount of global context information in the classification process, ignoring the inter-class relationship of the salient model [33]. Because of these shortcomings, it is difficult to extract the fine edges of defects in the industrial scene. In addition, there are huge differences between the natural image and the defective image. The scale, shape, category, illumination, and external interference (Fig. 8(f)) of the objects photographed in the industrial production scene make it inappropriate to directly use semantic segmentation methods to contact defects.
Defects with similar patterns on the surface of the part, the edge distinction is not obvious on the dataset. Red borders represent defects.
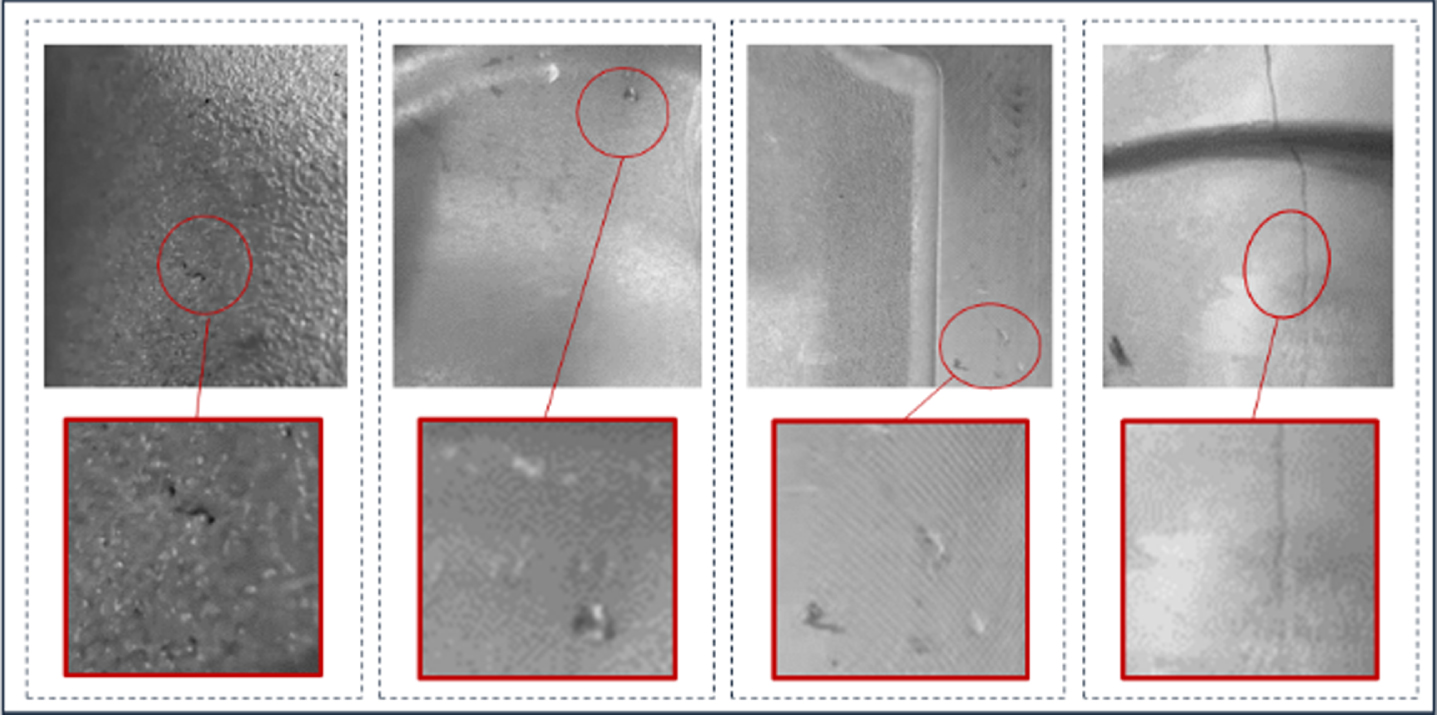
(a) (b) Segmentation of defects using traditional methods (c) (d) (e) Segmentation of defects using semantic segmentation methods (f) Examples of environmental interference with data in industrial scenarios.
High response to defect edges in defect detection tasks is an important factor for accurate defect segmentation, which determines whether edge pixels are accurately classified and small defects are ignored, so that various defects can be effectively represented on feature maps. When the image becomes a high-level feature map after convolutional calculation, the resolution of the feature map is usually low, which may result in defect boundaries becoming blurred, the defect position being slightly shifted, and the representation ability of small-scale defects being weakened. As shown in Fig. 7, the fine edges of defect features such as porosity, mis-runs, etc. are not easily extracted, especially when they are spatially adjacent, which can easily lead to confusion about predicted categories. In the semantic segmentation task, most of the existing methods treat it as a dense recognition problem, trying to distinguish adjacent patches with similar appearance but different semantic labels, a lot of global context information is integrated into the classification process, usually neglecting to highlight the inter-class relationships of the model [34]. Therefore, it is of great significance to enhance edge saliency feature extraction to guide the learning of features, which can amplify the variety of features on both sides, distinguish adjacent regions with similar appearances but different semantic labels, and improve localization and prediction problems near the defective boundary.
Considering the above problems, it is necessary to amplify the difference between adjacent features to extract accurate semantic boundaries. To this end, a semantic boundary supervision module is introduced, which is similar to the semantic boundary detection task, and learns the discriminative features to arge the “inter-class” distinction, so that the features on both sides of the semantic boundary are distinguishable. In this paper, in order to distinguish the adjacent areas with similar appearance, the boundary refinement module from GCN [34] is added at the end of each upper sampling layer, which can arge the changes of the features on both sides, but different semantic labels, and improve the location and prediction problem near the defect edge.
The specific operation is to add a BR module after the multi-scale feature layer, which is a small residual structure to refine the defect edges with residual branches. Assume that the size of the input feature map is W×H×C, which is the width, height and channels. For the residual branch on the right side, convolution is performed using the 3*3 convolution el of stride 1. After ReLU, another convolution is performed. Finally, the output is summed with the direct mapping layer. More specifically, we define
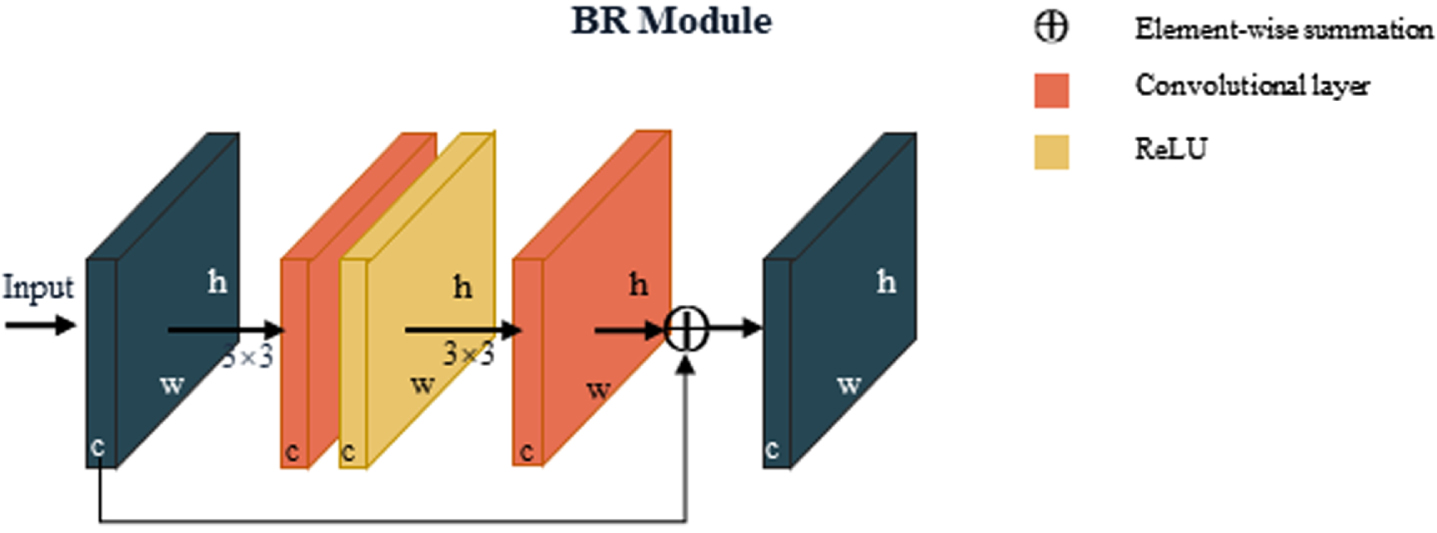
Specific structure of boundary refinement (BR) module.
Dataset
In this study, the example verification is realized by the dataset collected at the Dalian Tianxiang Auto Components Co., Ltd aluminum alloy parts quality inspection station. The company manufactures thousands of aluminum alloy parts. Most of the parts need to be tested on the test bench after the final processing step. At the current stage, most aluminium alloy parts rely on MVI to complete full or random product inspection (Fig. 10). Through investigation, the manual detection time of each part is about 15s to 90s depending on the size of the parts, and the detection accuracy is about 80%. This labor-intensive manual detection method has low economic benefits, production costs and low efficiency, and repeated mechanical manual visual inspection for a long time will cause visual fatigue in workers, resulting in missed inspection and misjudgment of product appearance quality. Therefore, it is necessary to introduce machine vision, a real-time, efficient and low-cost detection method.
Manual visual inspection of product quality.
The surface defect dataset of aluminum alloy parts is very important for the data-driven inspection method, and the use of high-quality and large-scale defect datasets can improve the generalization performance of the model. The experiments of this paper were mainly carried out on the self-made surface defect dataset of aluminium alloy parts, which was made of typical aluminium alloy parts images provided by the engine parts manufacturing factory. The example images of 600×600 pixels were acquired by a high-resolution camera and saved in PNG format. Six representative defect types were collected from these, including porosity, cracks, scratches, surface irregularities, mis-runs, and foreign matters (as shown in Fig. 11). These defects may lead to oil leakage inside the parts and more seriously will reduce the performance of parts and damage subsequent mechanical properties.
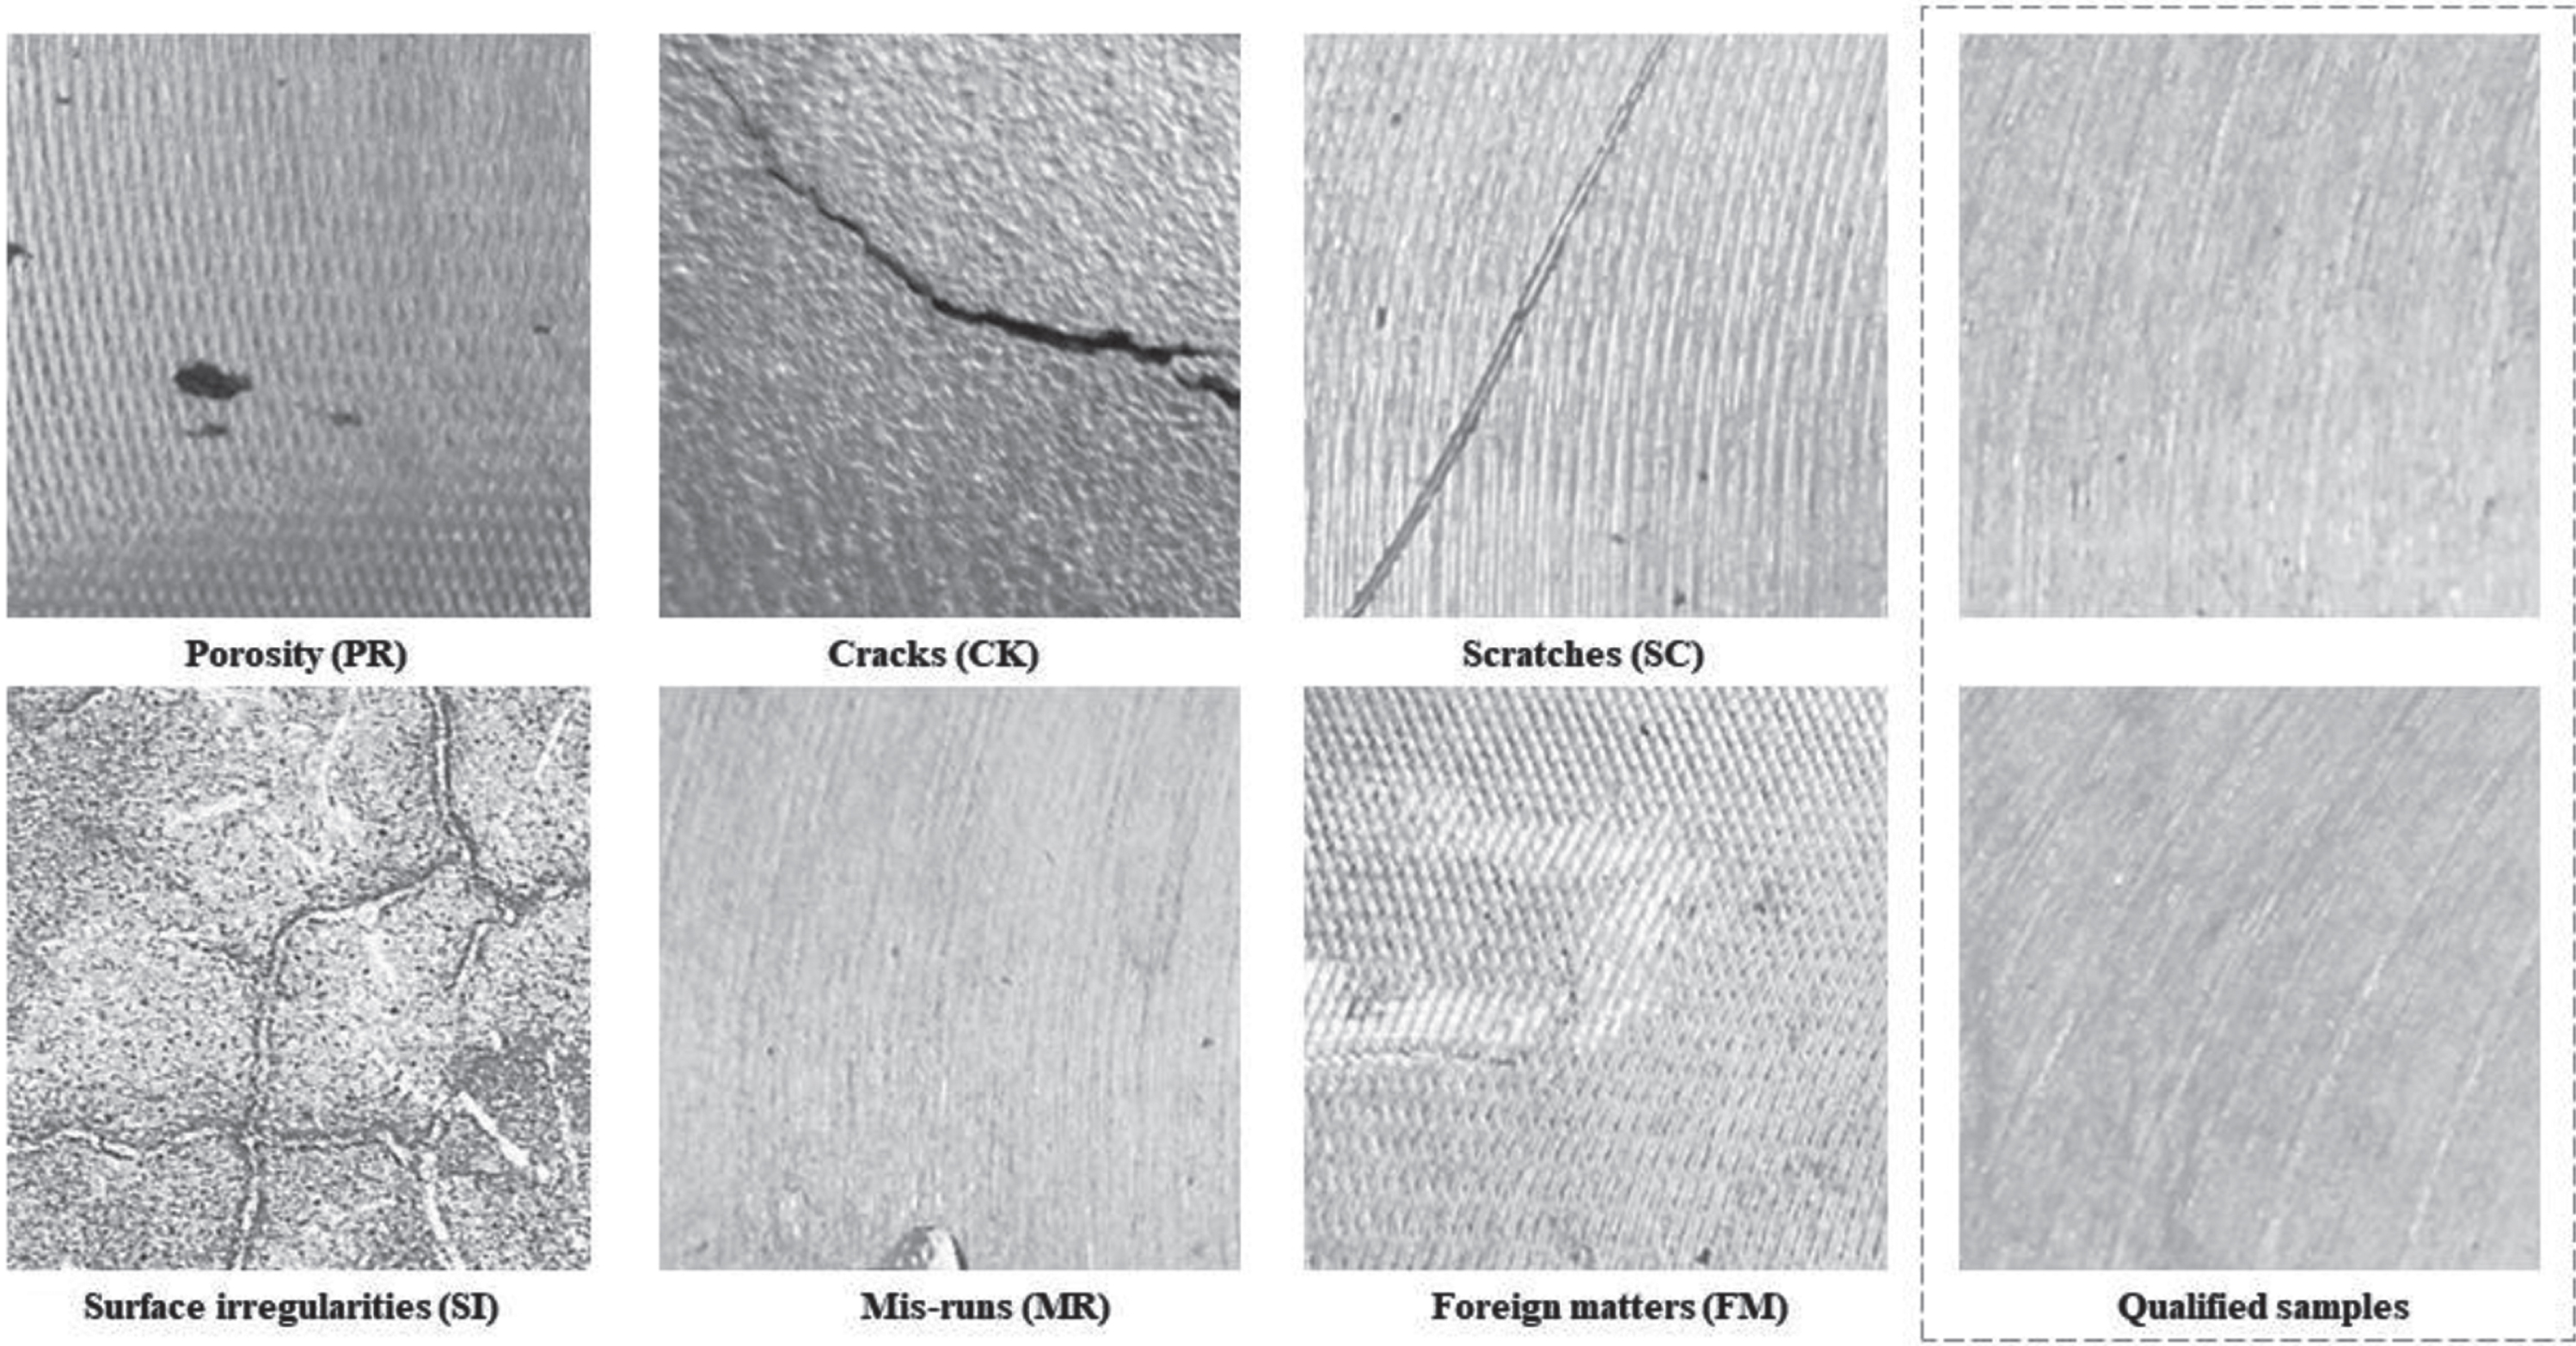
Various types of defects and qualified samples in the dataset.
The dataset consists of 2491 images extracted from the original images. Each image contains one of the six defect categories, all images are manually labeled and each extracted image is resized to 600 x 600 pixels to keep the input size consistent. Among them, 1500 are qualified products and 991 are non-qualified products, with the distribution of defect categories shown in Table 2. Specifically, labelimg is used to finely label each image in detail. The pixel categories are divided into two classes, defective and qualified areas. All labeled images and labels are saved in Pascal voc 2012 [35] format for training. Table 2 lists the types and number of defects in the dataset for this study. The dataset is randomly divided into the training set and testing set. In order to solve the imbalance problem of various types of images in the training process, during the training process, about 300 images will be randomly selected from the qualified categories for training. For other categories, the data expansion technology of graphical conversion (such as translation, rotation, zoom, mirror image, etc.) will be selected. The number of image data of various types will be kept at about 250, and then the optimal training results will be obtained through parameter adjustment.
Datasets for image classification
In the manufacturing site, the real-time system is measured by its ability to support application execution under time constraints. A good quality inspection system should obtain the real-time status data of the product, visually detect the defect information on the surface, and immediately obtain the data. Upload it to the inspection system, and then transmit it to the terminal to give the next feedback information. Therefore, the system must have the good real-time performance to achieve real-time quality assessment and feedback adjustment of the product.
In order to simulate the actual situation of quality inspection of products at the manufacturing site (Fig. 12(a)), this study builds an intelligent real-time inspection system for surface defects of parts at the end of the production line to simulate the actual situation in the laboratory, and the example of the system is built as shown in Fig. 12(b). It is mainly composed of a camera, stripe light source, PC, display terminal, and other hardware. When the parts reach the detection area, the sensor senses the signal and transmits it to the PLC. The PLC controls the camera to shoot, and obtains a clear and stable part surface image through the parameters such as the camera angle and the brightness of the light source adjusted in advance by the system. Then the acquired image is transmitted to the server, using the trained model to make the real-time detection, the inference speed of the detection software can reach 29.64 FPS. Finally, the detection results are displayed on the terminal to facilitate human-computer interaction, thus realizing the whole detection process of the real-time detection system. The schematic diagram of the construction frame is shown in Fig. 12(c).
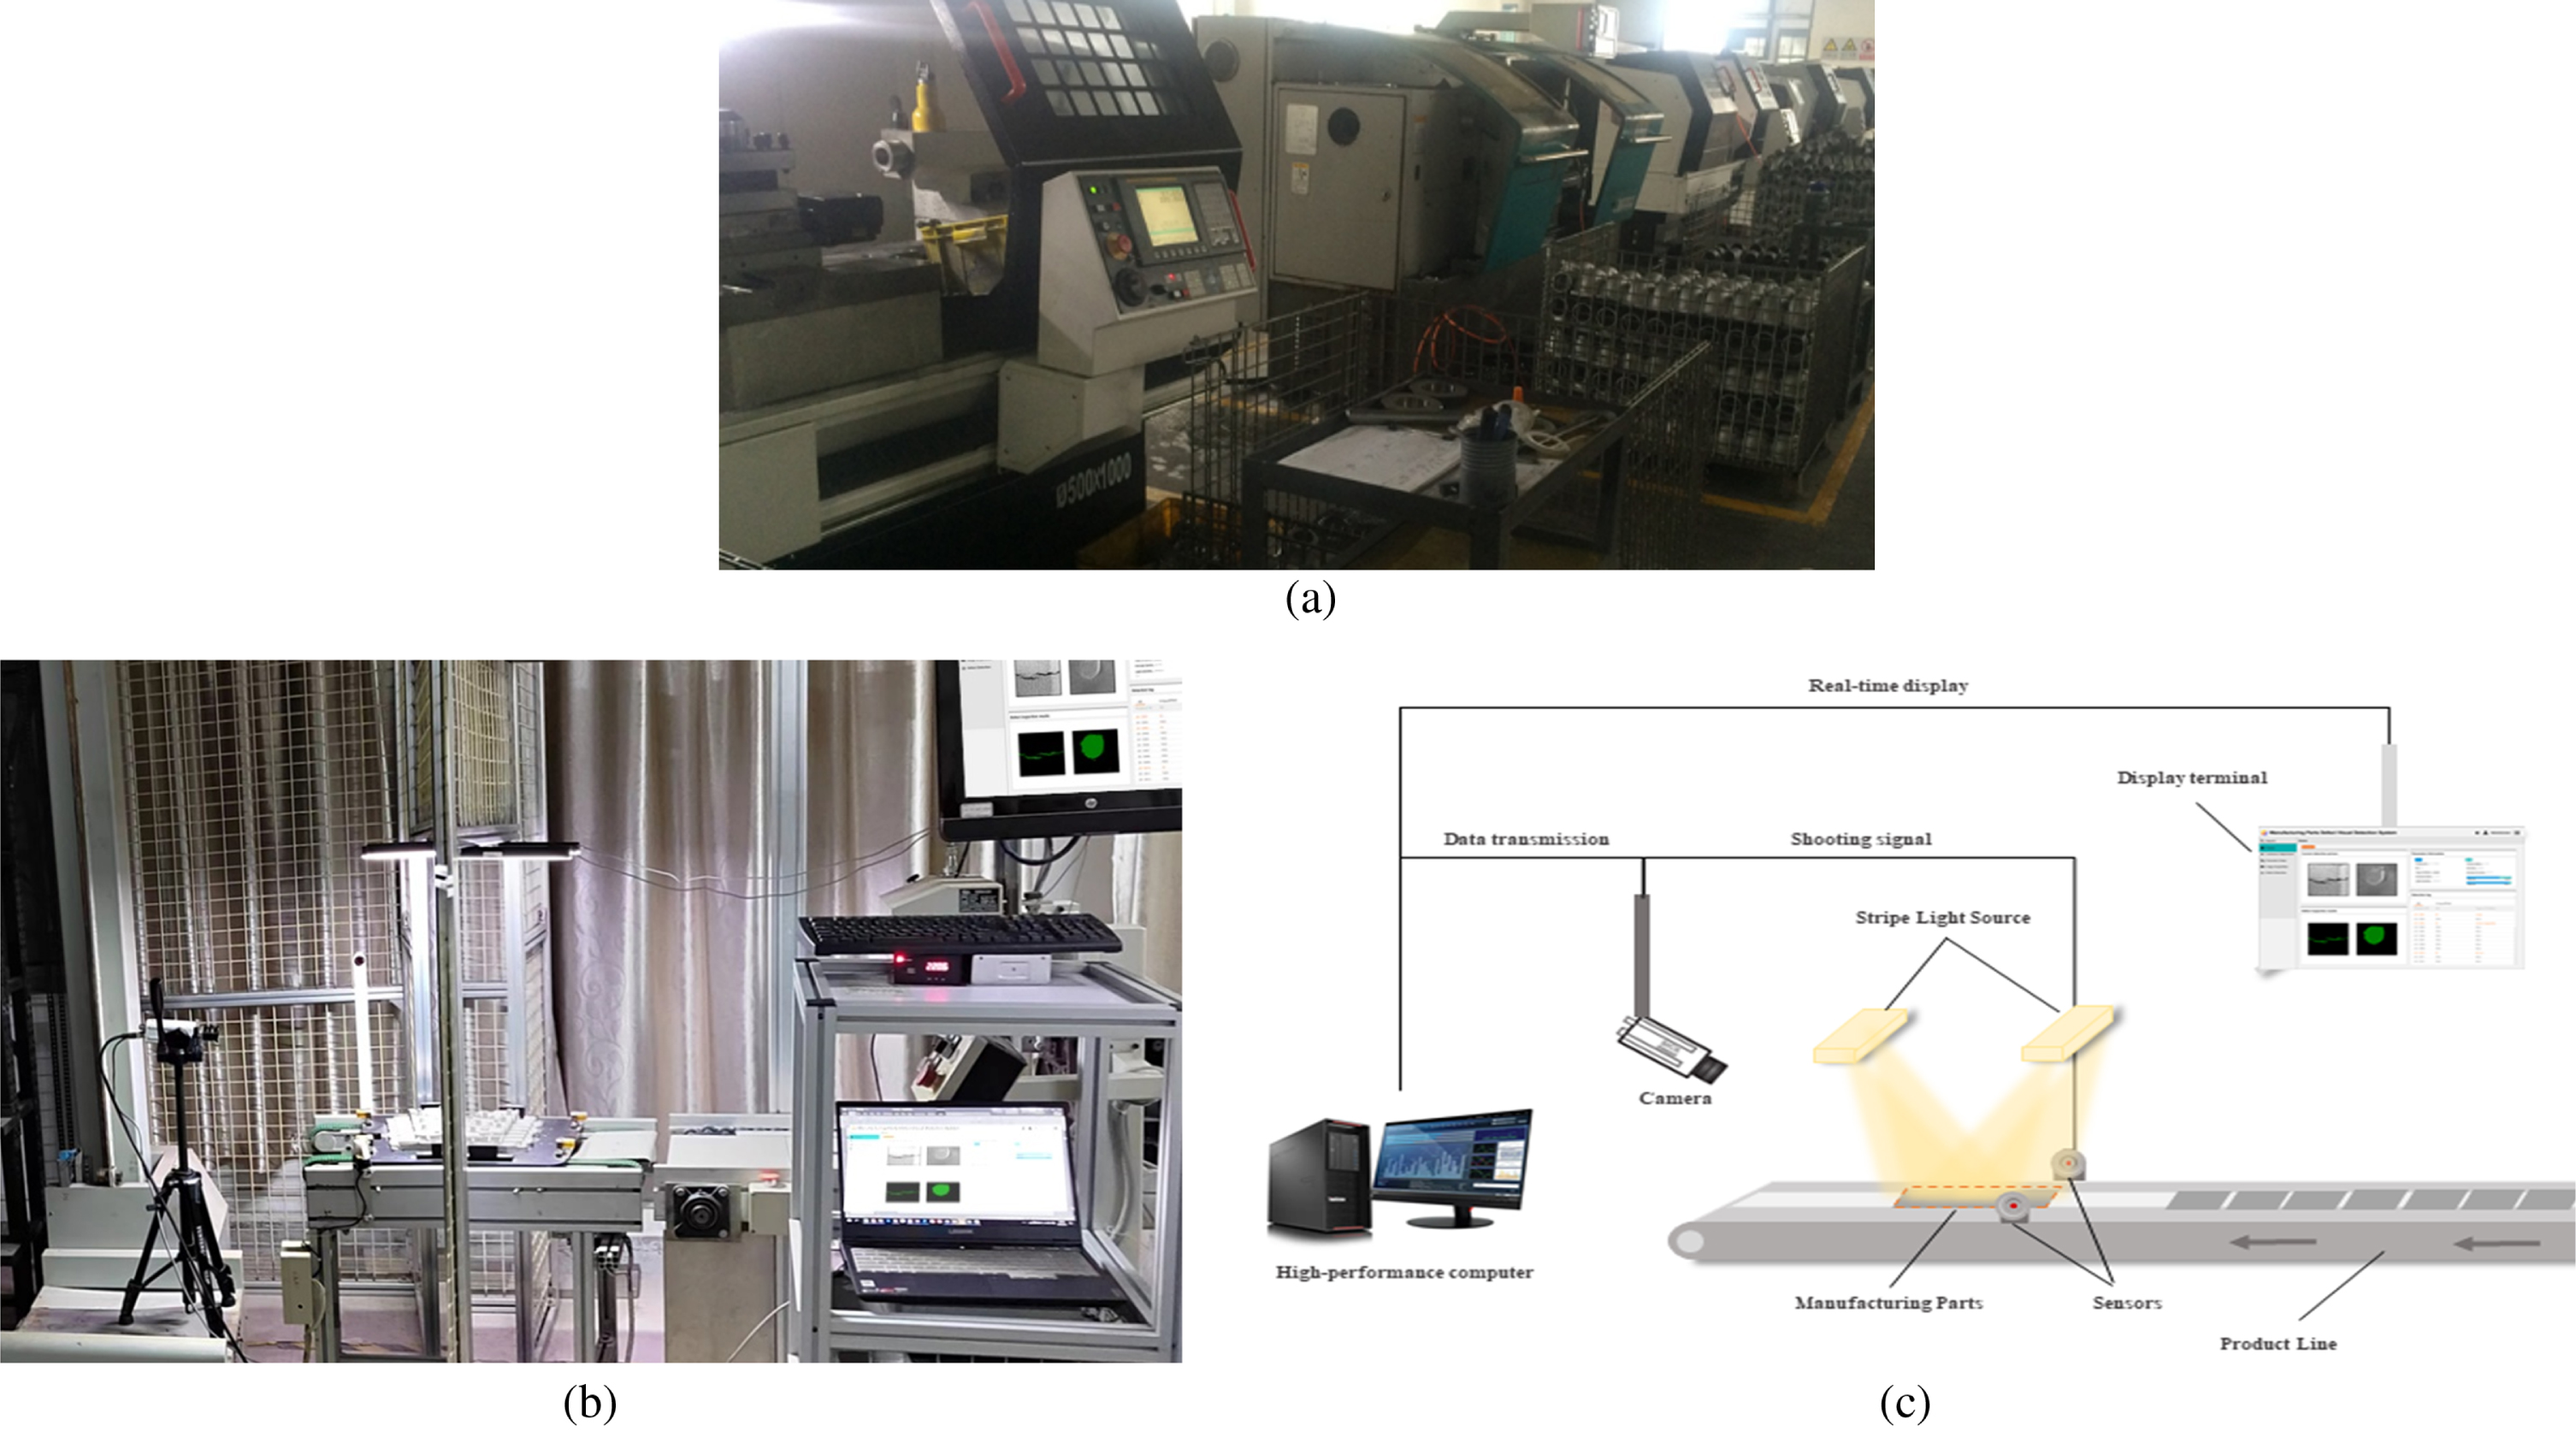
(a) The actual situation of quality inspection of products at the manufacturing site. (b) Example construction of intelligent real-time detection system for surface defects of parts. (c) The schematic diagram of the construction frame.
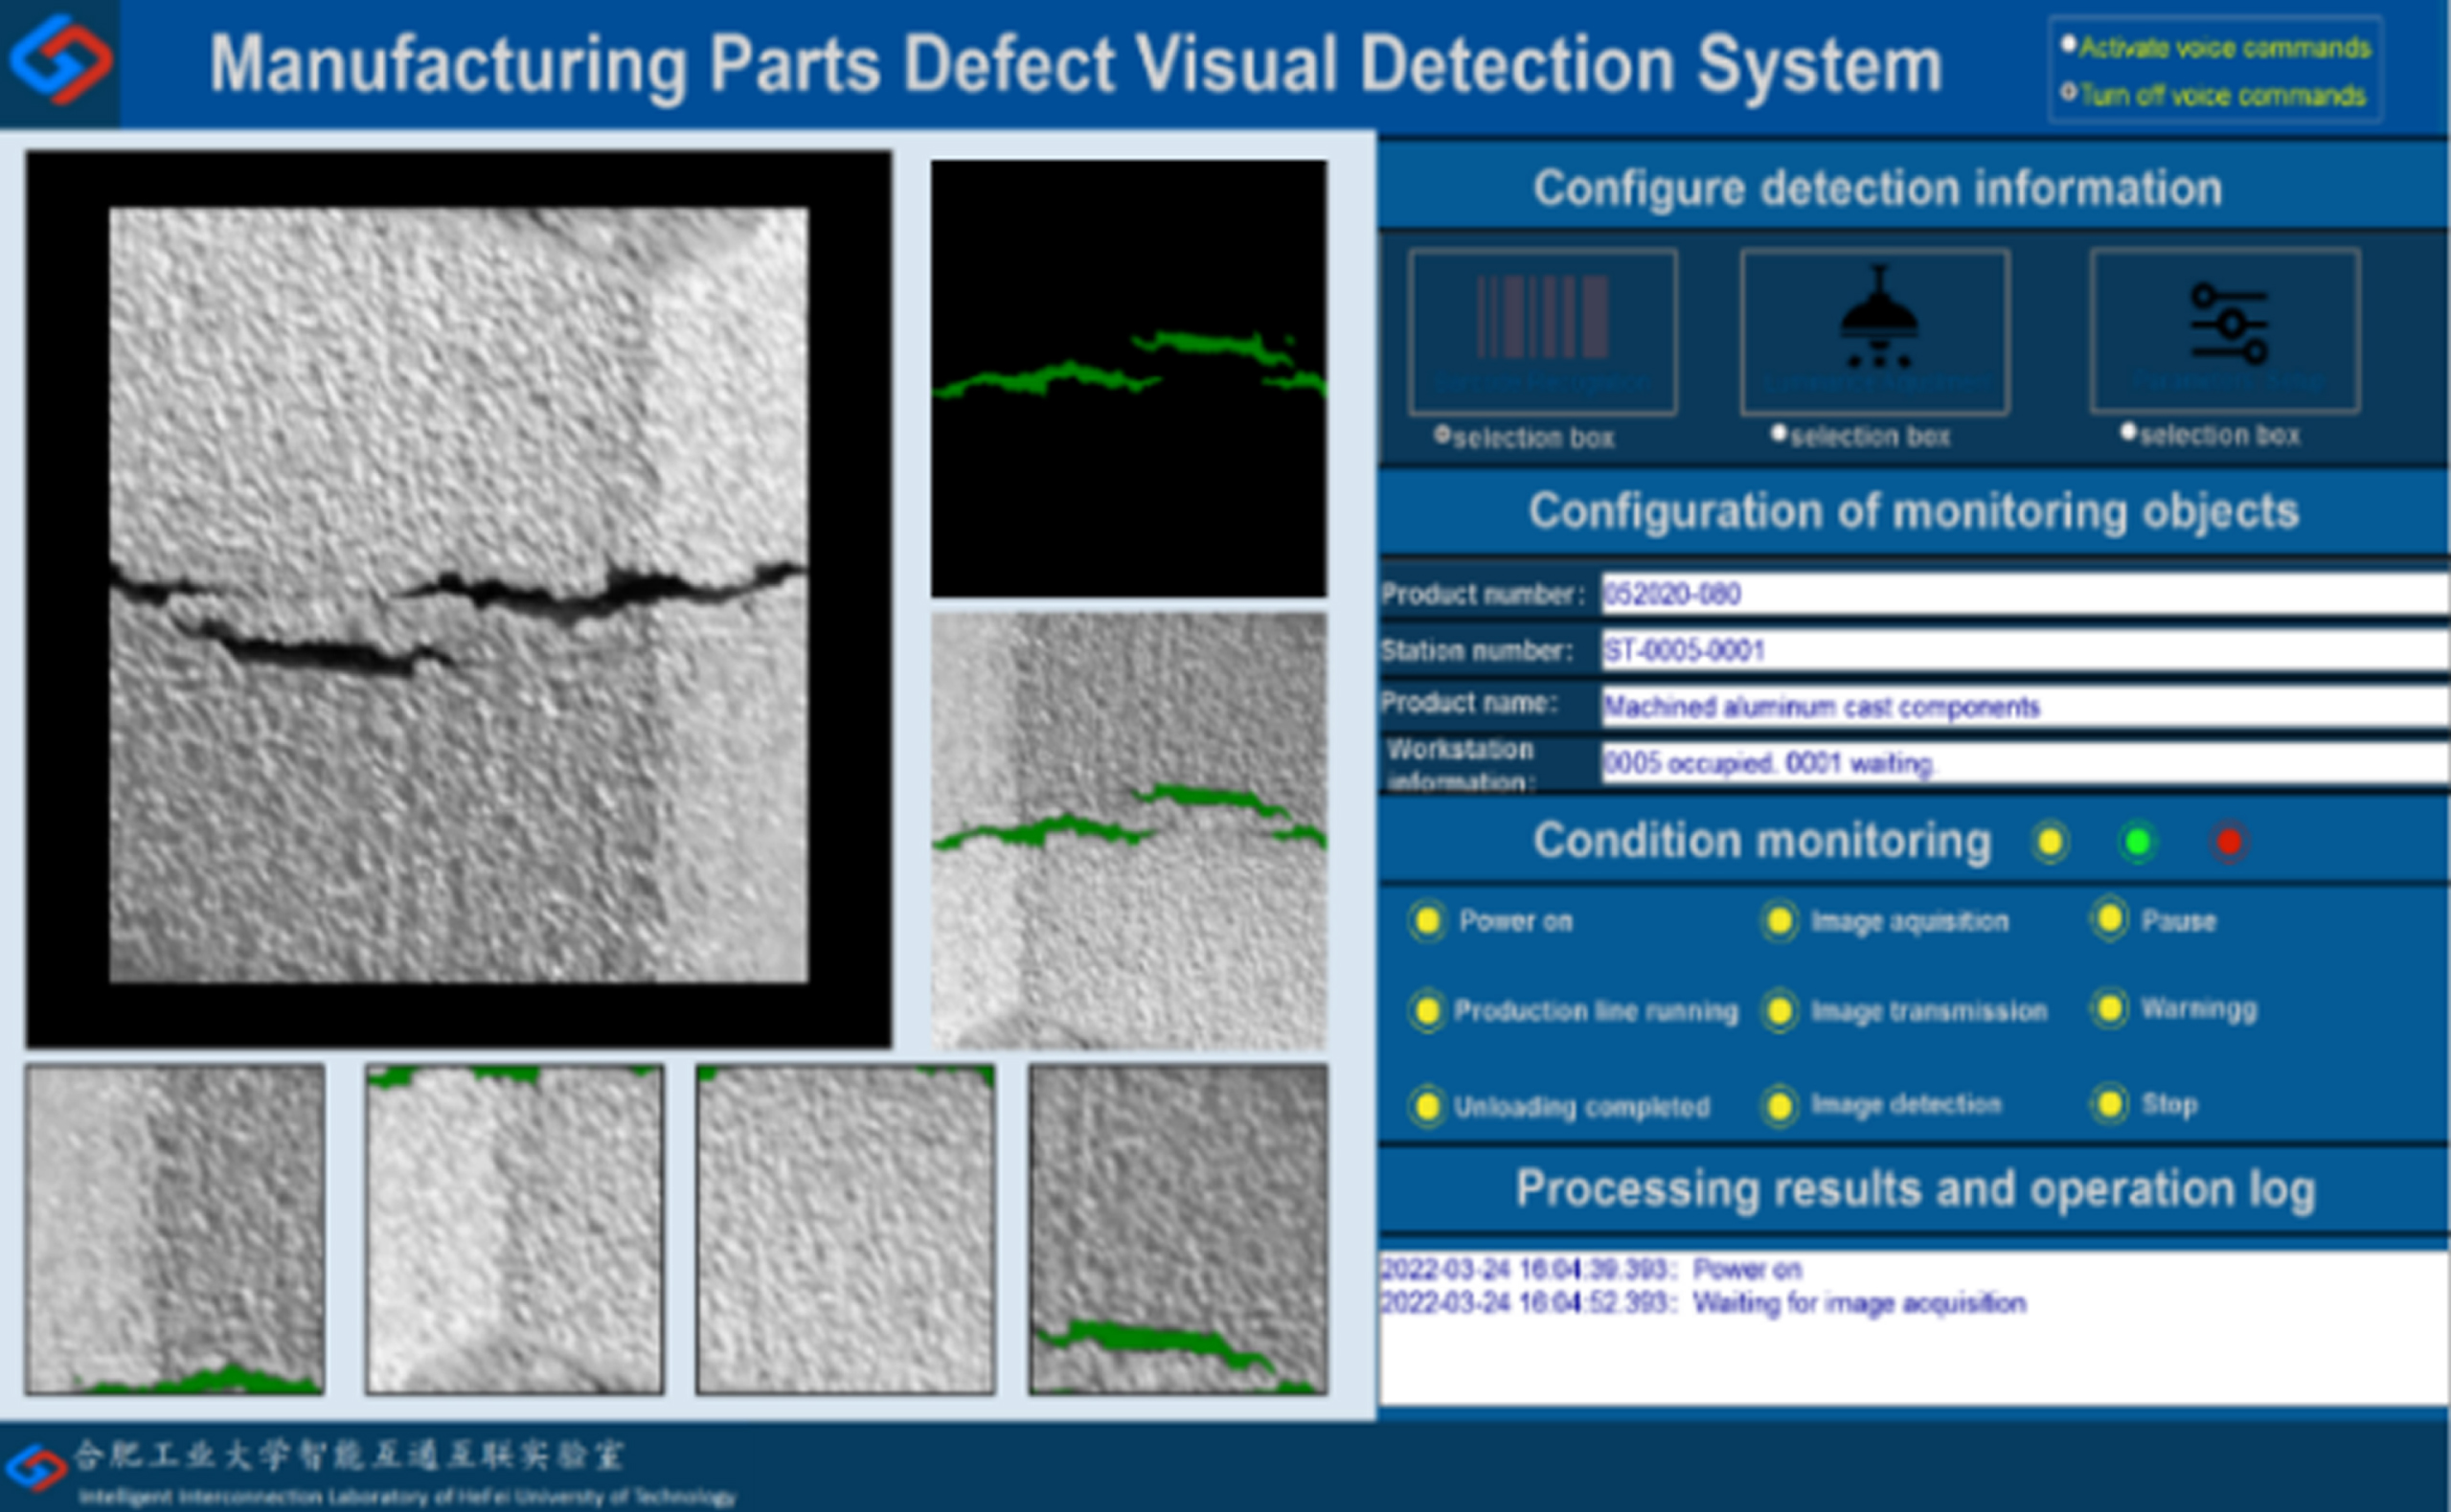
In this study, a Lenovo workstation equipped with a high-performance CPU (Intel Xeon Silver 4210R) and GPU (NVIDIA Geforce RTX 3090) was used as the experimental computing device, and a 4K high-definition intelligent display terminal was used for human-computer interaction, using Python 3.7.2, and the computing software environment of PyTorch. The visual inspection software (as shown in Fig. 13) consists of an image acquisition module, a defect detection module, information on monitoring objects and operation logs, etc. composition. After the high frame rate image was collected by the camera, the images were input into the visual inspection software, analyzed, and processed through the end-to-end integration algorithm, and the inspection result was output to the display terminal.
Visual inspection software.
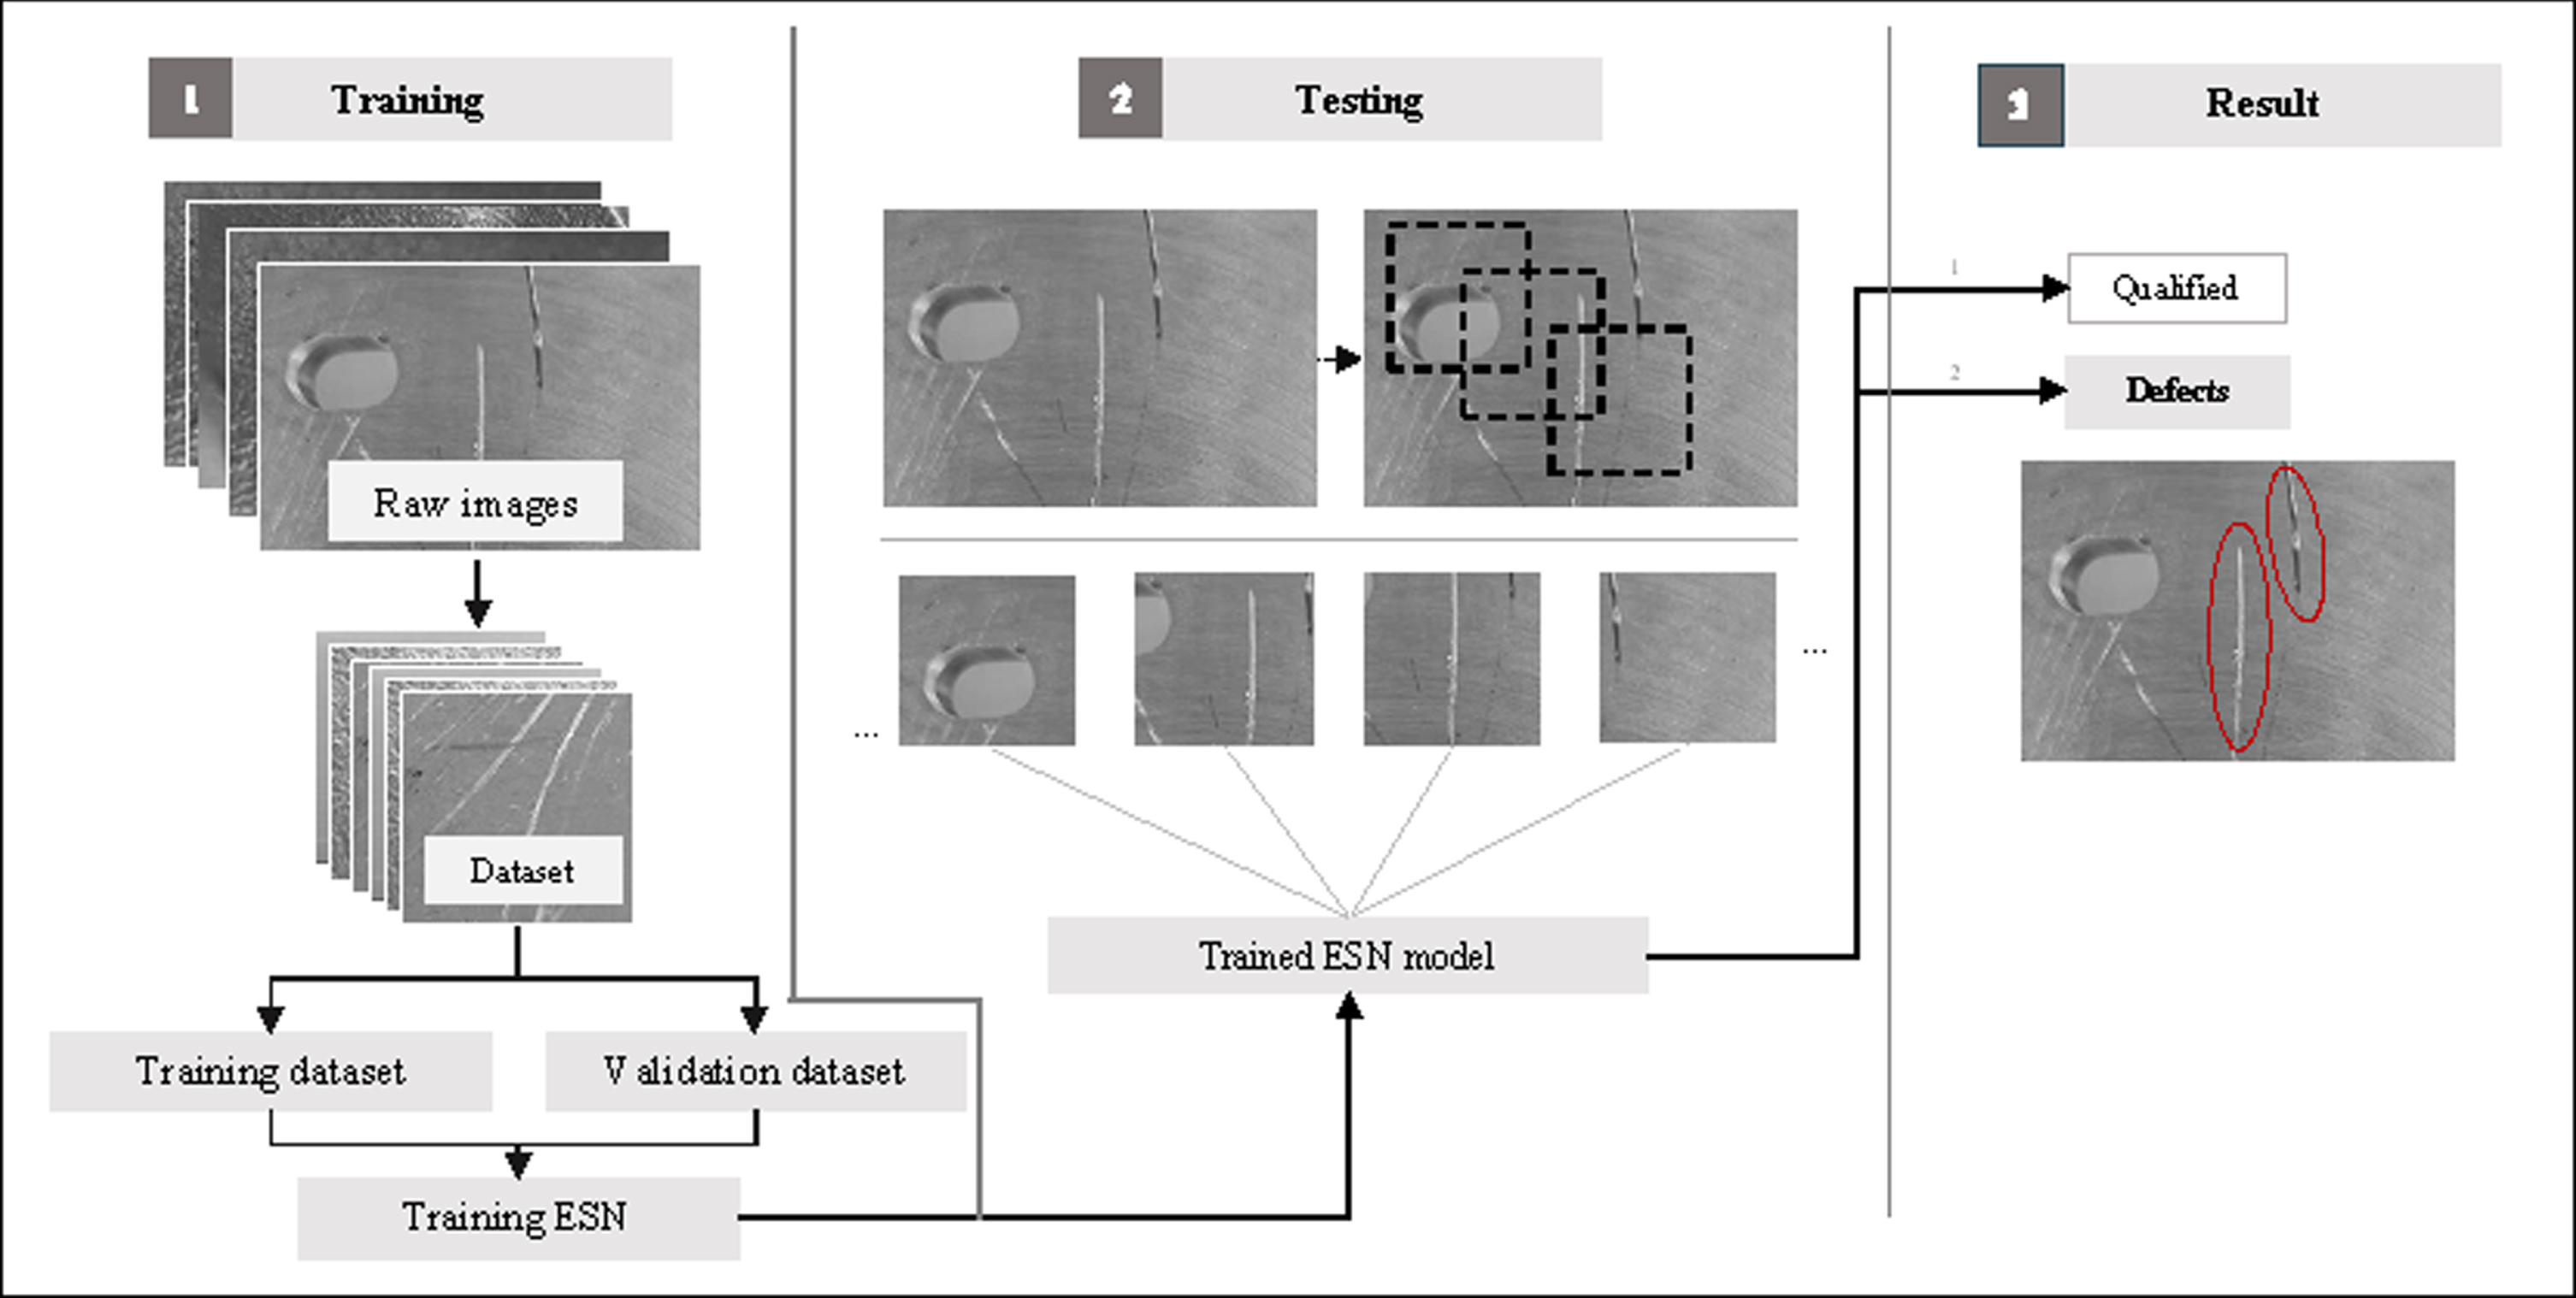
Training the whole network requires a dataset of sufficient images to achieve suitable accuracy, which is difficult to achieve in many fields. In order to alleviate the influence of the amount of available training data on the accuracy of the network, the experiment applied pre-training to improve the training efficiency. This study used pre-trained weights on Pascal Voc2012 to initialize the parameters in the new model. Then used the collected dataset and divided into a training set and a testing set. Various image preprocessing methods such as center cropping and horizontal flipping were applied during training to obtain high prediction accuracy for segmentation tasks. At the same time, the Adam optimizer was used for training, softmax loss was used to supervise the output, negative log-likelihood (NLLLoss) was used as the loss function, which is useful to train a classification problem with C classes, the formula is as follows:
The performance of the model was measured by mean intersection over union (MIoU). The ES-Net model was trained for a total of 30 epochs with an initial learning rate of 1×10--3 for the first 7 iterations, and at 0.5 times the initial learning rate for the next iterations, with the batch size set to 4. All methods were tested on the same testing set for a fair comparison. The final ES-Net model is deployed in industrial sites to achieve real-time defect detection on the surface of parts. The specific flow chart of training process is shown in Fig. 14.
Flowchart of the model training process.
Metrics
This paper mainly takes the mean intersection over union (MIoU) as the evaluation index of model detection, and takes accuracy and frames per second (FPS) as the evaluation indexes of the system.
When evaluating the PL-SS results, the predicted results are often divided into four parts: true positive (TP), false positive (FP), true negative (TN), and false negative (FN). MIoU is the accumulation of the intersection and the ratio of the two sets of true and predicted values of each class after calculation, and then the average is carried out. The obtained evaluation is based on the global evaluation. The calculation formula is as follows:
In the system evaluation, the accuracy rate (the proportion of correctly classified samples to the total sample) and FPS are used as the main standards to measure the detection accuracy and detection rate of the system.
Compared with other semantic segmentation methods, the proposed defect detection method ES-Net mainly has the following characteristics: firstly, Efficientnet-b3 is used as the backbone, and the next five stages of different layers are selected for high and low-level feature fusion to obtain richer high-level and low-level information, then multi-resolution information is fused to capture different size defects, finally a boundary detection module is added to refine defect edges. In this section, three sets of experiments are designed to verify and analyze the feasibility and accuracy of the proposed method.
Experiment on detection performance
Since the detection method in this paper is based on the improvement of FCN, to validate the proposed method, the performance is compared with FCN and other typical semantic segmentation methods (U-net [36], Deeplab [37], and trained and validated on the same dataset. Other methods are implemented and measured using open-source code, and the training parameters are obtained from the paper. Table 3 shows the MIoU for different networks and the IoU for each type of defect.
Inspection results compared with other methods (%)
Inspection results compared with other methods (%)
The experimental results are shown in Table 3. After comparing the segmentation capabilities of different models, the MIoU of the model established in this paper can reach 80.1%. This is a 4.9%improvement compared to FCN, a 4.1%improvement for U-net and a 2.1%improvement for Deeplab. Compared with other segmentation networks, the effect is indeed better, and there is a certain improvement in segmentation performance on different types of defects. Figure 15 shows the histogram of the IoU value of each type of defect. In order to compare the segmentation effects more intuitively, Fig. 16 presents the visual detection results of different models on some testing images. It can be seen that although most defect types have good segmentation results, there are still some particular instances where defect pixels fail to be accurately detected and classified. For example, in the FCN, some background contents are wrongly detected as defects. In Fig. 16(f), the background edges are identified as large-sized defects, and in Fig. 16(c), the machined holes on the part are incorrectly classified as a defect. From the analysis, it can be concluded that the main reason for these problems is that the model either lacks object details or fails to capture all objects in the image. In contrast, Deeplab and the proposed model integrate low, medium, and high-level features in an end-to-end multi-layered manner, enabling more discriminative distinctions for large-sized defect features. Therefore, in detection scenarios with extensive background and multi-scale defect information, fusing multi-scale feature maps may better capture global information. At the same time, the proposed model rationally increases and configures depth and width parameters on high-resolution images, and enriches feature extraction by stacking the depth of convolutional layers while avoiding degradation problems such as gradient explosion and gradient disappearance. It can be seen from the experimental results that it does have a better feature extraction effect, with capturing more comprehensive and refined defects, and reduce the classification error results, which greatly improves the segmentation ability of the overall network.
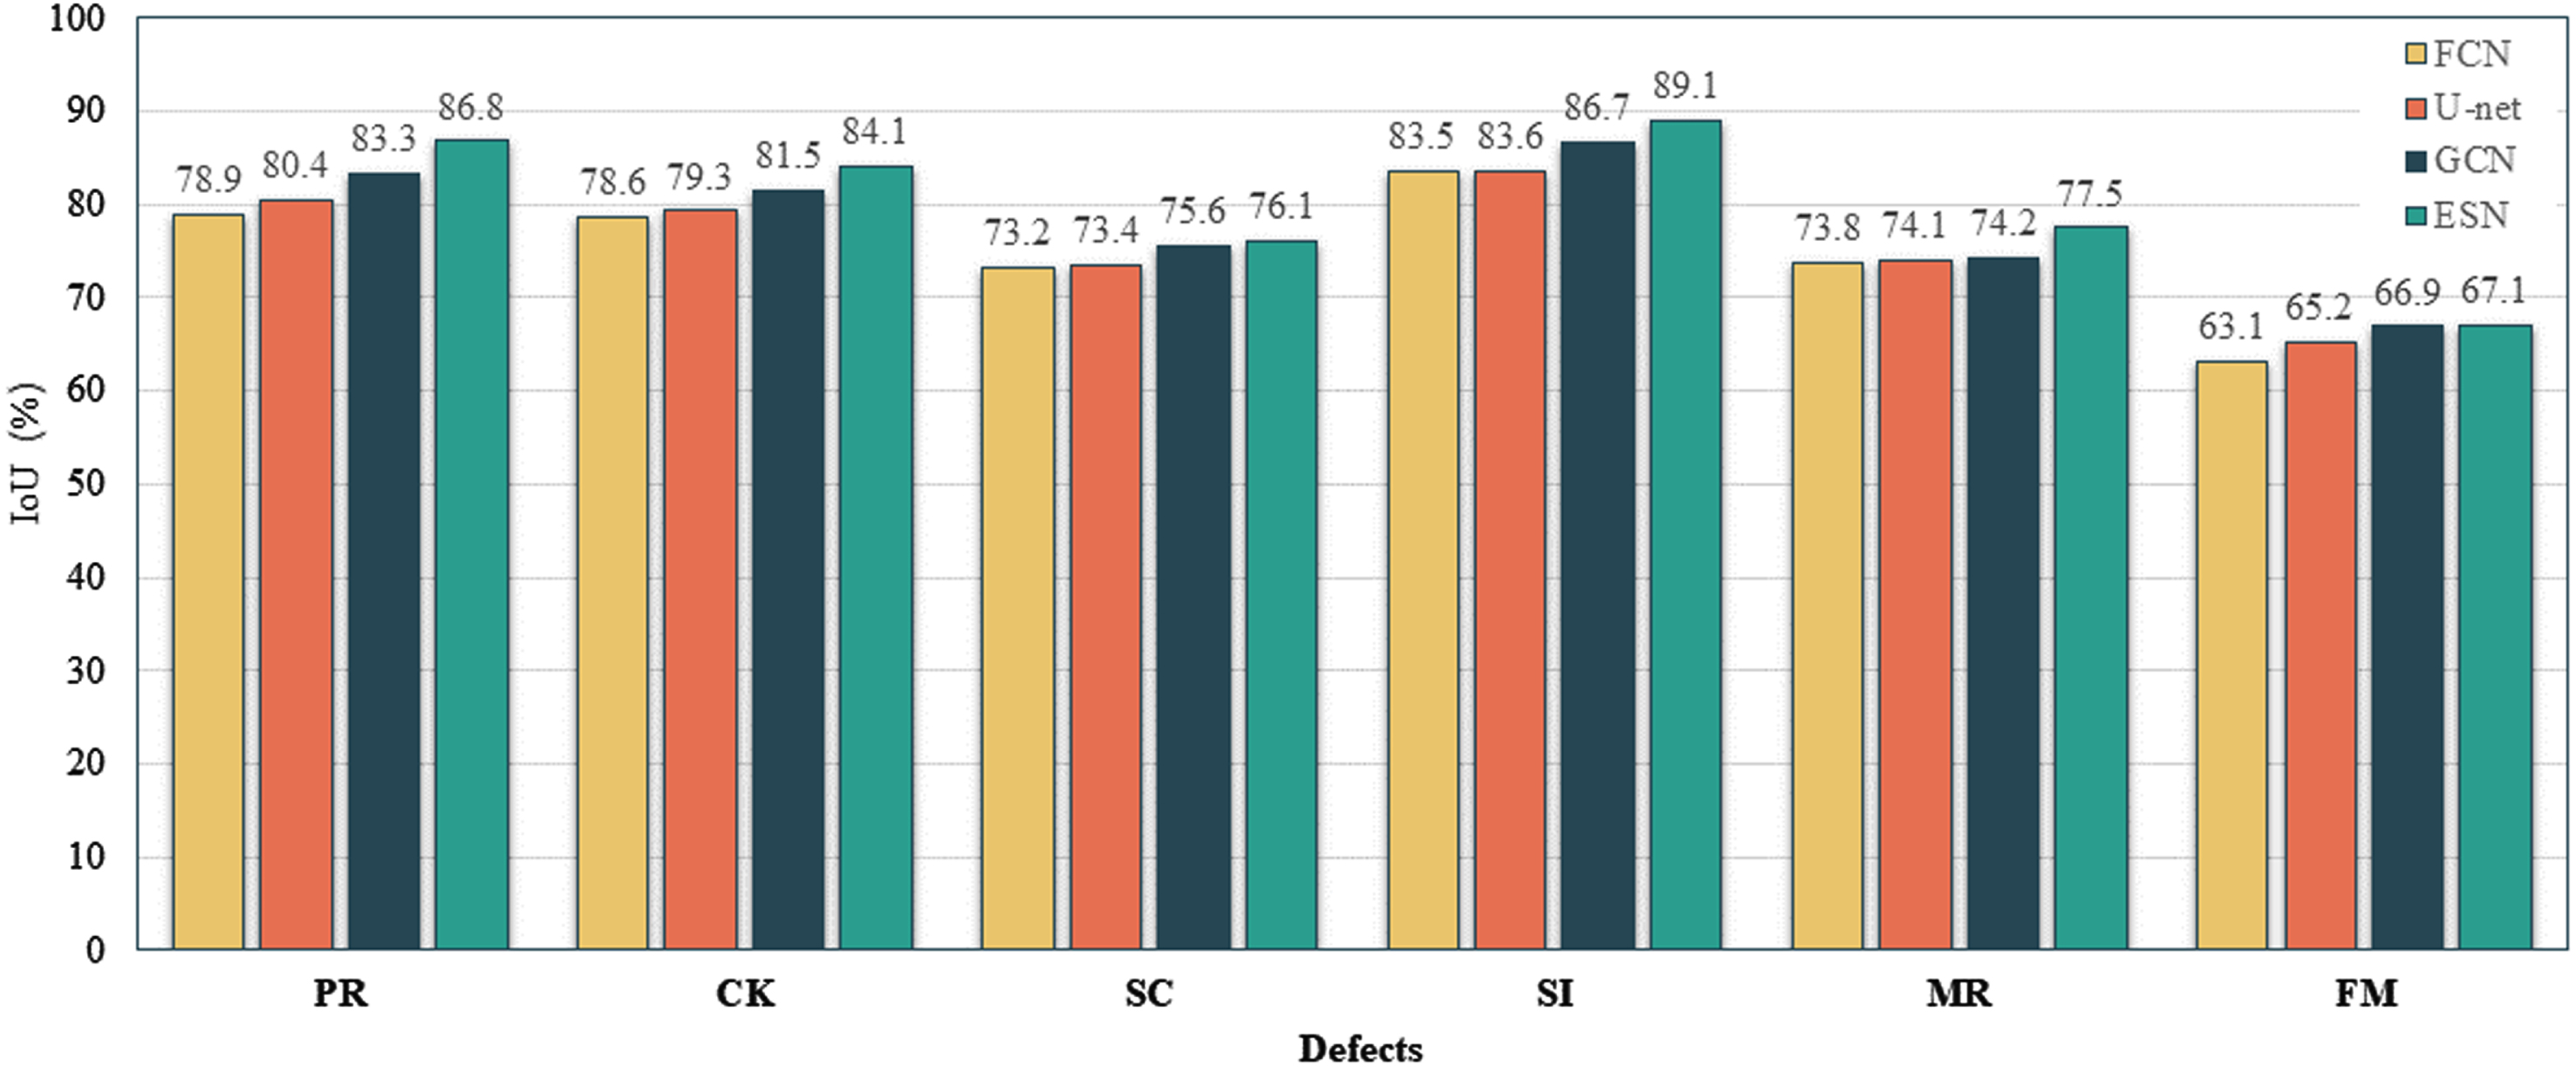
Histogram of the IoU values of 4 models.
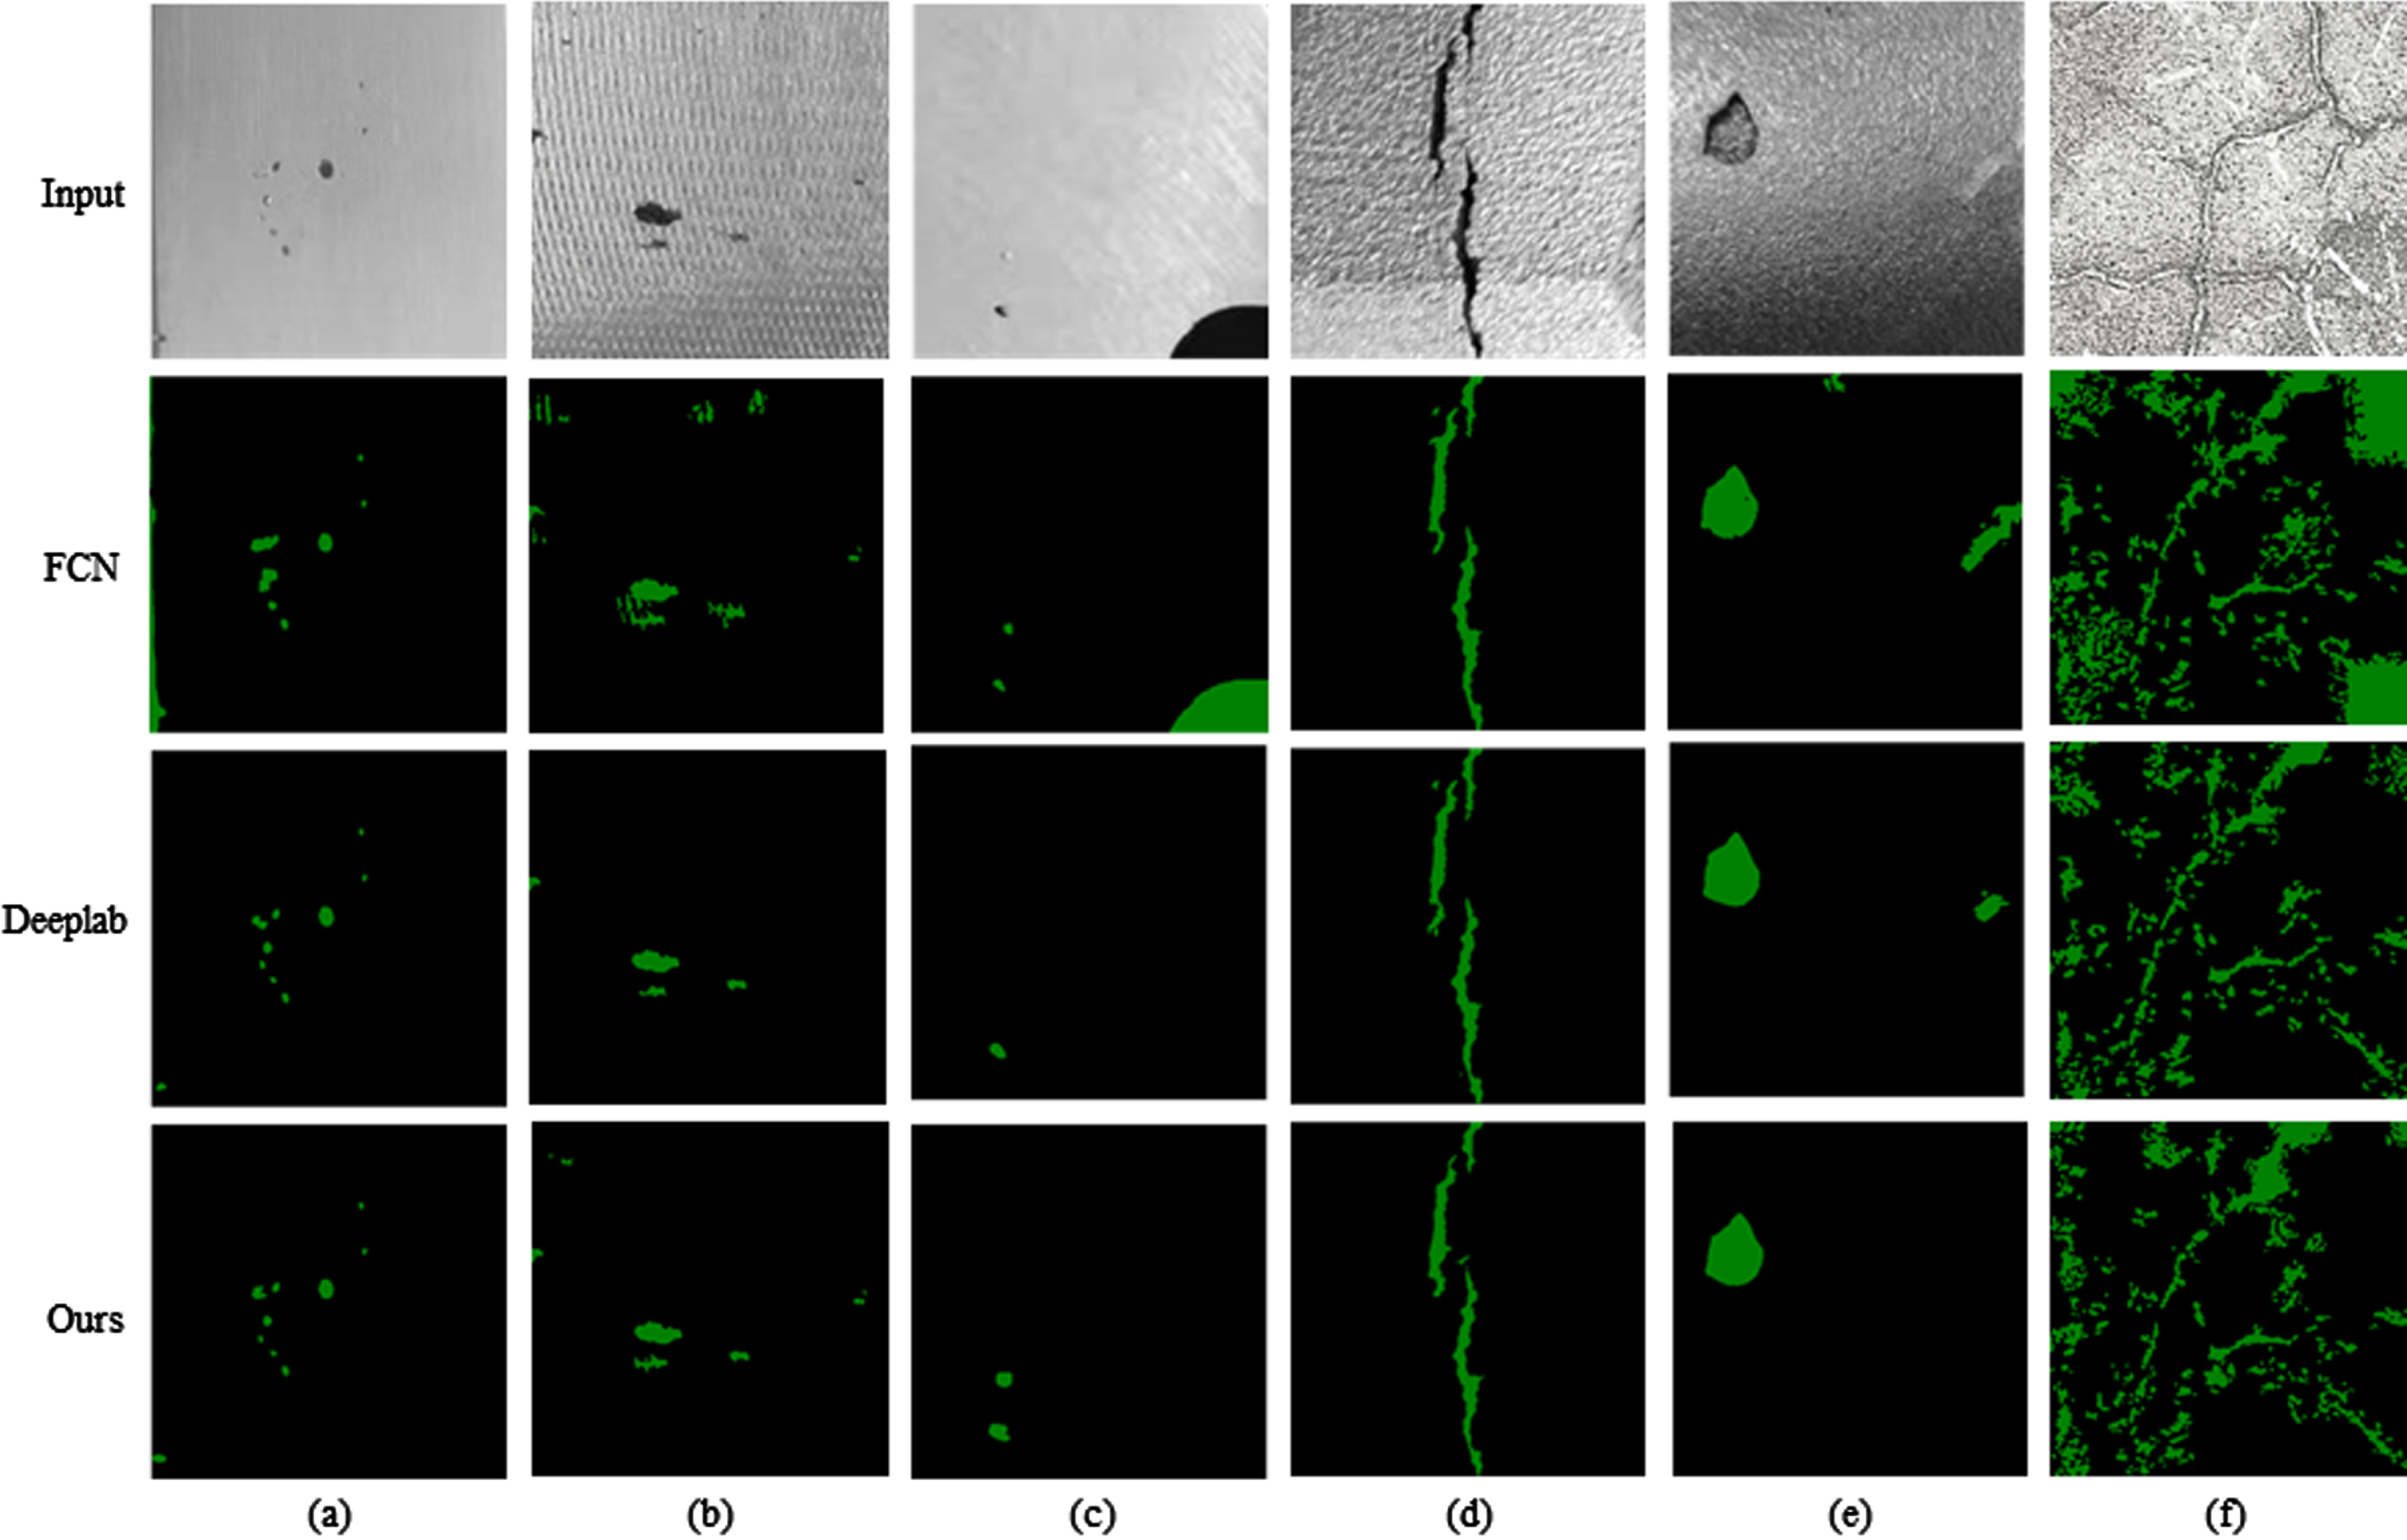
Examples of the detection results using traditional methods and our method, among which the green areas are the defect areas detected by FCN, U-net and our model.
In order to verify whether the added br module can enhance the edge features, the ablation experiment is carried out based on whether the BR module is added. The common error prediction is that the indistinct difference between classes may cause edge blur. Therefore, the targeted experimental results are mainly analyzed for the defect types that need to make high response results to the boundary such as cracks and mis-runs. The experimental results are shown in Table 4. The lOU results and MIou results of various types with or without BR module in the modelare compared. The results of the ablation experiments show that the edge enhancement module improves the accuracy of cracks and mis-runs by 2.9%and 2.1%respectively, and improves the accuracy of scratches by 0.2%. Compared with other types of defects, the BR module has a better improvement effect on defects with larger edge sizes, but the MIoU of the overall network is improved by about 0.6%, which is a small gain in the entire segmentation network.
Comparisons of the detection results (IOU and MIOU) on datasets
Comparisons of the detection results (IOU and MIOU) on datasets
In addition, the addition of the BR module is compared to the visual effects. As shown in Fig. 17, the FCN network performs poorly for edge segmentation of various types of defects in the input image. For example, in Fig. 17(b), there is a higher degree of misclassification due to less accurate edge segmentation for large-sized defects, and in Fig. 17(d) and (e), similar features for adjacent regions can easily lead to confounding of predicted classes, subtle interference from adjacent patches in the background also cause misclassification. With the addition of the BR module, the proposed model is visually effective in smoothing the prediction of object boundaries and optimising the recognition accuracy for small pixel patches. Therefore, it can be concluded that BR module has edge learning capability to enhance edge saliency feature extraction, amplify the variation of features on both sides, and help the model to better focus on PL-SS.
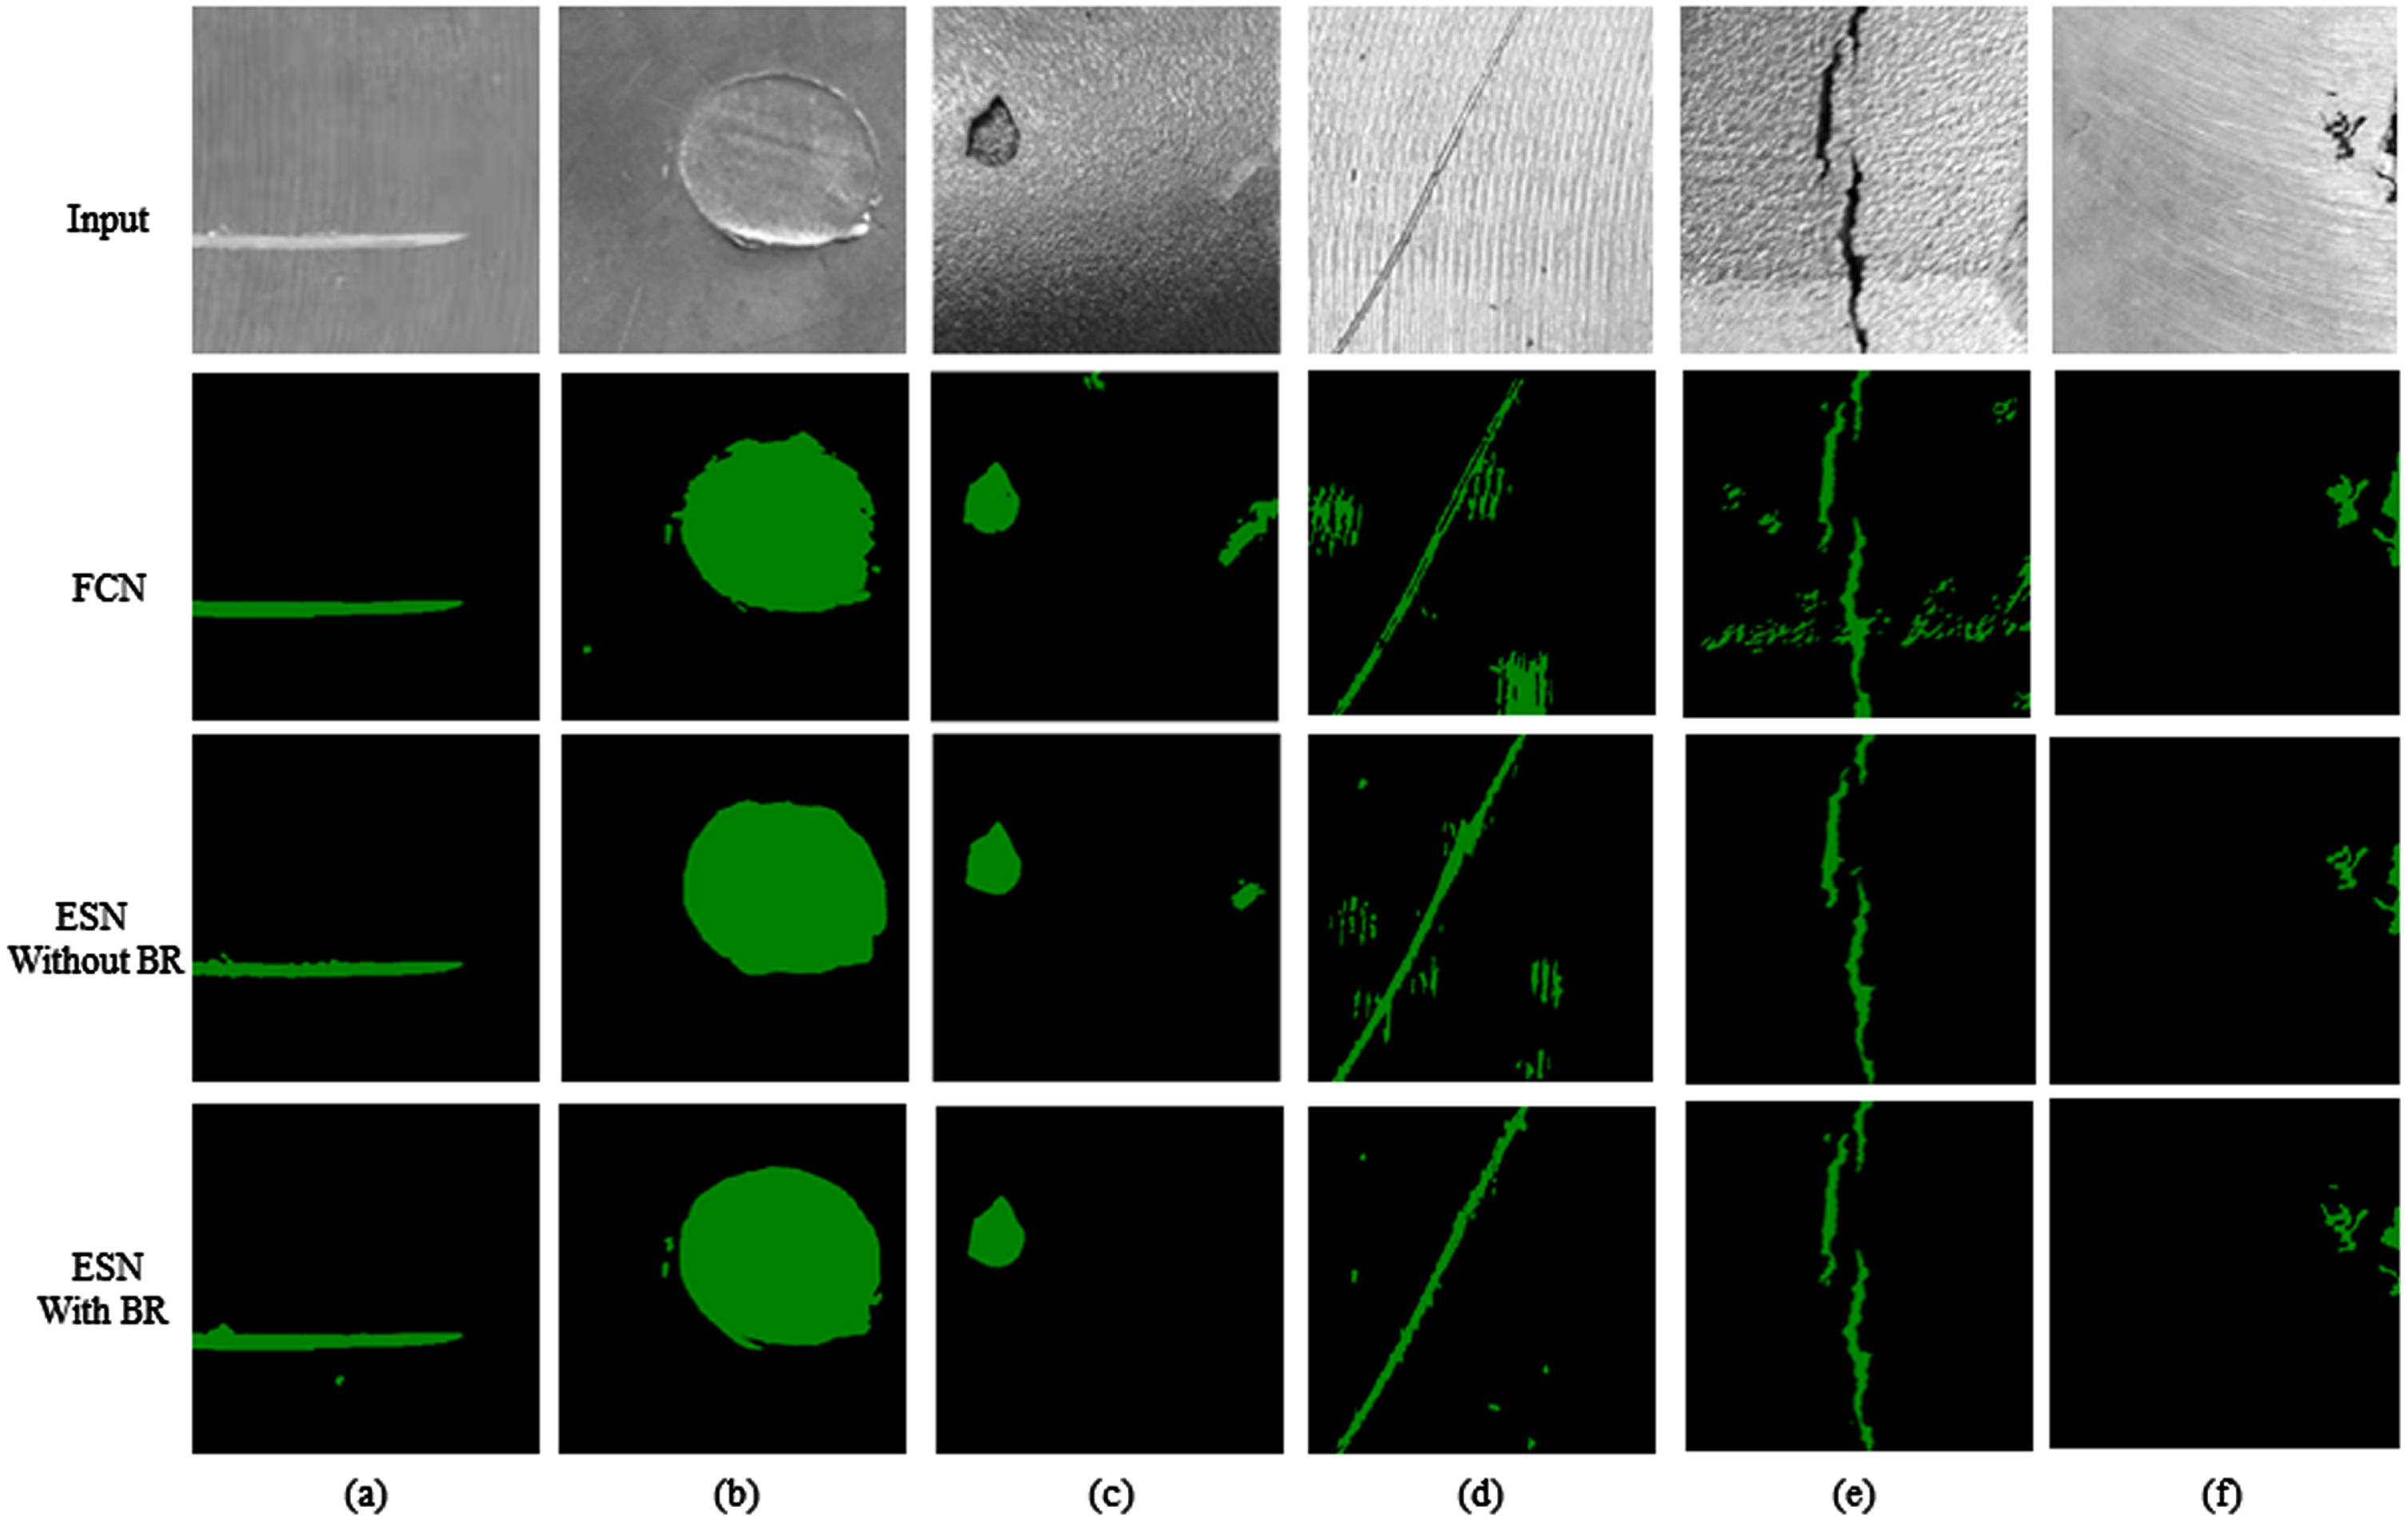
Examples of the detection results using FCN, ES-Net without BR module and after adding BR module.
In addition to segmentation performance, it also evaluates whether the inference speed of the models could meet the requirements of real-world applications, so the additional metric FPS is used, which indicates the number of images per second that can be tested by the model, to compare and analyze the actual change in the detection rate of the networks after improvement. Use a workstation with an RTX 3090 GPU to test and evaluate the inference speed of each model, and use 100 images from the dataset with an image input size of 600×600, and Table 5 shows the variation in the inference speed of each model for a given input size and batch size. It can be observed that the inference speed of the FCN reaches 21.11 FPS when the batch size is increased from 1 to 4. Similarly, the deeplab network obtains the highest inference speed of 27.34 FPS when the batch size is increased to 6. The inference speed of our proposed model is 25.14 FPS when the batch size is 1, and when the batch size is increased from 1 to 6 gradually, the inference speed increases to 29.64 FPS, which has a higher running speed compared to FCN and deeplab. It can be seen that the proposed model can improve the detection accuracy without significantly increasing the computational complexity, despite the larger number of parameters. At the same time, the impact of the BR module on the overall speed was also tested. The inference speed without the BR module can reach 31.12 FPS with the same input image size, but with the addition of the BR module the speed decreases by 1.48 FPS and the overall speed is slightly slower. However, in view of the need for more accurate results and the fact that the current rate can still meet the actual detection needs, the model with the BR module is still selected as the final method.
Comparison of inference speed when different batchsize and input size are applied on datasets
Comparison of inference speed when different batchsize and input size are applied on datasets
In addition, according to the investigation and analysis, the manual detection time of each part is about 15s to 90s, and the detection accuracy is about 80%. In comparison, the proposed method takes between 0.3s and 2.7s to inspect each part, with an estimated 10 to 90 images per part depending on size, and an overall accuracy rate of over 95%. This means that compared to manual inspection methods, the proposed method has advantages in terms of efficiency and accuracy, therefore the method is considered suitable for real-time defect detection of aluminium alloy parts.
This section provides a study case of the proposed method, including performance comparison experiments with other networks and ablation experiments with its own improved module. Compared to IPM methods that combine image processing and recognition method to extract features (e.g. Zhang et al. [38] use filtering methods combined with hidden Bayesian classifier feature selection methods for steel strip surface defect detection), our method reduces the high cost and time consumption due to high complexity, and improves effectiveness and generalization; compared to DL-SDD method (e.g. Nguyen et al. [39] use convolutional neural networks to first sub-image segment cast product images before labeling and classifying defects), the proposed method is able to locate and identify precise geometric features of multi-scale defects at the pixel-level. Precise experimental results show that the PL-SS MIoU of the proposed method is 80.1%, which is a 4.9%improvement compared to the classical semantic segmentation network FCN and a 4.1%improvement compared to the U-net, with a significant improvement in both defect localization and defect recognition performance, and better capture and balance of local and global information of the image. Next, in the network’s own ablation experiments, the influence of adding the BR module on the test results was compared. The experimental results showed that it has a small gain in the overall segmentation network, with a MIoU improvement of about 0.6%after adding it, but it can have a smoothing effect on object boundary prediction in terms of visual effect. Finally, the inference rate of the proposed method is tested on a workstation equipped with RTX 3090 GPU, which achieves an inference speed of 29.64 FPS and an accuracy rate of over 95%, giving it an absolute advantage in terms of efficiency and accuracy compared to manual inspection methods under the same experimental conditions. The above experiments have comprehensively verified that the intelligent real-time visual inspection system can generate greater economic and social benefits, and can provide theoretical methods and technical support for the quality control process of the parts manufacturing industry.
Conclusion
In this study, the model ES-Net is proposed in order to achieve multi-size defects detection on the surface of parts at the pixel-level, and build an intelligent real-time detection system for surface defects. The conclusions are as follows:
The method attempts to integrate feature extraction and semantic segmentation knowledge into the detection of surface defects on parts and successfully locates the geometry of the identified defects at the pixel-level. The ES-Net enhances the feature extraction capability of the network while combining the low, midum and high-level content information provided by the image to assist image segmentation for end-to-end multi-scale intelligent detection at the pixel-level. The incorporated BR module enhances edge saliency in terms of visual effect and is also optimized for small patch recognition. The comprehensive test results show that the ES-Net is robust to various defect sizes and shapes, with a segmentation MIoU of 80.1%, a recognition accuracy of over 95%, and an inference speed of 29.64 FPS. It can better locate and classify surface defects of parts compared to manual visual inspection or other inspection methods. The effectiveness and feasibility of the proposed method are verified through experiments. From the perspective of production practice, the proposed method can improve the demand for efficient quality monitoring of intelligent production lines and provide technical support for comprehensive quality control of the engine parts manufacturing industry.
In future research, we will explore defect detection on each surface of parts with more complex geometric shapes, such as elbows, brackets, and others, to provide more intelligent theoretical and methodological support for the quality control process of multiple types of parts in the engine parts manufacturing industry. In addition, various factors that are affected by complex background environments, such as low roughness surface reflection, light difference, etc. will be considered, and more advanced detection methods will be trained and tested to improve the accuracy of defect classification to further enhance the robustness and practicality of the system.
CRediT authorship contribution statement
Footnotes
Acknowledgments
This research is supported by National Social Science Fund of China [20BGL108], Natural Sciences Fund of China [71602181], Natural Science Foundation of Anhui Province [2008085ME150], Anhui Science and technology major special project [18030901023], Anhui Provincial Teaching Team [2019jxtd113], and Key project of natural science research in Universities of Anhui Province [KJ2019a0673].
Declarations
Conflict of interest
The authors declare that they have no known competing financial interests or personal relationships that could have appeared to influence the work reported in this paper.
Data availability statements
The data that support the findings of this study are available on request from the corresponding author XQ W. The data are not publicly available due to them containing information that could compromise the privacy of research participating companies.