






Abstract
In order to analyze the impact of policy effect on carbon efficiency in the Yangtze River Economic Belt, an experimental group, including 11 regions possessing the features of the Yangtze River Economic Belt, was constructed using the synthetic control method for project evaluation with the single-factor carbon efficiency value as the core study variable in this paper. Several regions were selected from the control group as synthetic objects through a data-driven approach to construct synthetic regions that meet basic requirements before the implementation of the policy by weight ratio and evaluate the policy’s impact on the implementation of carbon efficiency in the Yangtze River Economic Belt. The study shows that the single-factor carbon efficiency is relatively robust. But since 2013, the tail of the Yangtze River Economic Belt has seen an improvement. Sichuan, Hunan, Chongqing and Hubei have exceeded other provinces and cities in the growth of carbon efficiency and Shanghai has also witnessed a significant increase. Upon the inception of the synthetic Yangtze River Economic Belt, there’s a discernible divergence between the curves of the real and the synthetic Yangtze River Economic Belt. Specifically, policy interventions in the Yangtze River Economic Belt didn’t work well in earlier years and even restrained the economic growth of the whole region.
Introduction
The comprehensive report on climate change assessment given by the United Nations government clearly pointed out that the total amount of CO2 generated in the process of industrial production and the combustion of fossil products and fuels in the past decades accounted for about 78% of the total greenhouse gas emissions. The United Nations Climate Change Assessment Committee clearly pointed out in the comprehensive assessment report on climate change released in 2014 that the average surface temperature of the global land and other oceans in the comprehensive temperature assessment increased by 0.85 °C from 1880 to 2012, which is 0.11 percentage points higher than the global average of 0.74 °C published by the United Nations [1]. Therefore, how to effectively deal with the excessive burning of fossil fuels and greenhouse gas emissions and control the change rate of global average temperature has become a focus of worldwide attention in recent years.
At present, China is the largest developing country in the world and the largest CO2 emitter in the world. China’s rapid economic growth over the years has attracted international attention. At the same time, a large number of greenhouse gases generated by China have also attracted world attention. Therefore, how China should develop a low-carbon economy in the future has become an important issue. The Yangtze River Economic Belt is an important economic growth point in China in the coming decades. How to effectively promote the Yangtze River economy to take the road of green and high-quality economic development is a challenge in China’s economic development.
The Yangtze River Economic Belt is a huge comprehensive inland river economic belt with global and international influence. It can effectively promote the coordinated and balanced economic development of the eastern, central and western regions and the opening up of border areas and cities, and is known as the “backbone of China’s economy” in the future. Over the past 40 years of China’s reform and opening up, the economy of provinces along the Yangtze River has grown steadily and rapidly, supporting more than 45% of the total national economy with about 20% of the population and land area, covering more than 40% of the population [2–4]. The Yangtze River Economic Belt covers a number of national key industrial projects, such as steel, petrochemical, automobile, electromechanical, etc. However, these mainstay industrial enterprises are also the key to environmental pollution. The extensive industrial economic development model has greatly aggravated the structural pollution of the Yangtze River basin. In particular, the consumption of a large amount of fossil energy has resulted in excessive carbon dioxide emissions, which has brought great difficulties and pressure to China’s carbon dioxide emission reduction and governance.
With the rapid development of industrialization and urbanization, it has brought many dividends to economic development and social progress, However, the problems brought by it also hinder the sustainable economic development, such as the intensification of ecological environment pollution, serious waste of resources, unreasonable layout of urban population, etc. among them, the problems of ecology and resources have become a major issue to be solved in all countries in the world. It is necessary to deal with the relationship between economic development and ecology and resources, and find a green and sustainable development model, which has become the focus of all countries, This also directly determines the strategic choice of each country’s future economic development. Facing the current global environmental and resource problems, green development has gradually become an important program for countries to achieve sustainable development.
Since the reform and opening up, China’s economic development has achieved remarkable results, but it still faces a serious ecological environment Environmental pollution, excessive energy consumption and resource shortage, especially the severe environmental crisis and energy crisis, have become important obstacles to China’s economy moving to a new level and achieving new development. In 2015, at the Fifth Plenary Session of the 18th CPC Central Committee, it was first proposed to take green development as the concept of national development and green development as a major strategy and concept for the development of the party and the country, affirming the importance of green development to China’s current economic and social development. In 2017, the 19th CPC National Congress proposed to vigorously promote green development, build a beautiful China, actively promote the development of green industries, accelerate the construction of green economic system, build a green technology innovation system, advocate a green and low-carbon lifestyle and many other requirements, and carry out the construction of comprehensive green development.
In the context of growing ecological challenges and green and sustainable development, China has fulfilled its responsibilities as a major country, proposing a green development initiative, and called on all countries to strengthen cooperation in ecological and environmental protection and build a community with a shared future for mankind. General Secretary Xi Jinping noted that “We need to uphold ecological conservation as a priority and pursue green development for the development of the Yangtze River Economic Belt. We need to give overwhelming priority to restoring the ecological environment of the Yangtze River and advance well-coordinated environmental conservation instead of excessive development. But this doesn’t mean we don’t develop. We should pursue green development and prosperity from ecological conservation and turn lucid waters and lush mountains into invaluable assets.” Encouraged by the state president and central ministries and commissions, the philosophy of green development has continued to improve. China has shown to the world its determination to develop the ecological economy and seek green growth. Ecological and environmental resource sustainability is taken as a new indicator of development. In order to achieve green development, we need to address ecological challenges of “ecological crushed area and ecological depressed area”, vigorously develop ecological innovation, and also embrace low-carbon governance, enhance low-carbon development efficiency and pursue green growth. How to achieve green development against the background of “advancing well-coordinated environmental conservation and avoiding excessive development”? What are the requirements? What is the mechanism? What institutional assurance is needed? In particular, what is the role of government in that process? All of these need to be further explored. In light of this, this paper is expected to probe into the impact of fluctuations in policy on carbon efficiency in the Yangtze River Economic Belt by studying the impact of environmental policies on carbon efficiency in the Yangtze River Economic Belt, so as to provide a theoretical foundation for decision-makers in government to resolve environmental problems in the Yangtze River Economic Belt.
Materials & method
Model introduction
Carbon emission efficiency has become the focus of study by overseas and domestic scholars as the global air quality changes. Sun et al. considered that carbon efficiency can be defined as the ratio of carbon emissions to economic output [5]. Ang and Mielnik et al. proposed the carbon index, a ratio of carbon emissions to energy consumption, to analyze the contribution of a country or region to energy conservation and emissions reduction [6, 7]. However, the single-factor carbon emission efficiency can only explain the carbon emission efficiency in terms of economic growth. Therefore, a majority of scholars have paid close attention to carbon emission efficiency from the view of total factor. Zofío and Prieto considered the DEA model with undesirable output, where carbon emission was deemed as an undesirable output to analyze the carbon emission efficiency of OECD member countries [8]. Färe et al. analyzed the carbon emission efficiency of power enterprises from the perspective of total-factor carbon emission efficiency [9]. Li et al. used the directional distance function and adjusted the input-output ratio to measure the carbon emission efficiency of China [10]. Liu et al. measured the provincial data from 2005 to 2014 based on the cross efficiency DEA model [11]. The research shows that the provincial carbon emission efficiency shows a slow growth trend. Jin and Kim used SFA method to calculate and compare the energy efficiency and carbon emission efficiency of 21 emerging countries from 1995 to 2016 [12]. The average carbon emission efficiency of Beijing Tianjin Hebei in 2016 is 770, which is based on the average carbon emission efficiency of Beijing Tianjin Hebei (sfa-2019). Zhou et al. used carbon emissions per unit of GDP (i.e. carbon emission intensity) to measure carbon emission efficiency, and then evaluated the low-carbon development of low-carbon pilot provinces and cities [13]. Li et al. respectively used the Three-stage DEA model and the Malmquist index model based on the model to study the regional differences in carbon emission efficiency of China’s eight comprehensive economic zones from 2000 to 2017 from the static and dynamic perspectives [14]. Yang et al. used the MSBM model to investigate China’s provincial industrial data from 1998 to 2015, and came to the conclusion that there are differences between regions and the mean value is high in the East and low in the West [15].
The Synthetic Control Method, first introduced by Abdi and Gardeazabal, is a method used to evaluate the effect of policies [16]. They used it to evaluate the impact of terrorist conflict on the Basque economy, with the Basque Country as the treatment group and the other two synthetic regions of Spain as the control group. They found that GDP in the Basque Country declined 10% due to terrorist attack. Abadie et al. studied the policy effect of the California Tobacco Control Program on per capita tobacco consumption with the synthetic control method to approximate the tobacco consumption that California would have experienced in the absence of tobacco control program in other states of the US [17]. They found that per capita cigarette sales in California were about 25 packs lower than what they would have been in the absence of the tobacco control program. Wang et al. used the synthetic control method to analyze the impact of adjusting Chongqing as a provincial-level administrative region on the economic growth of the Sichuan region [18]. They approximated the economic growth that Greater Sichuan (Chongqing included) would have experienced without performing the adjustment of administrative division by taking the weighted average of other 30 provinces and cities of China, and estimated the impact of adjustment of administrative division on Greater Sichuan’s economic growth by comparing the real data and the synthetic values of Greater Sichuan. They found that administrative division to some extent contributed to Chongqing’s economic growth, but had little impact on the economic growth of the new Sichuan region. Liu et al. chose Chongqing, where was going to implement property tax reform as the treatment group and simulated the potential housing price that Chongqing and Shanghai would have experienced in the absence of property tax reform by taking the weighted average of 33 medium and large-sized cities to estimate the policy effect of property tax reform on housing price by comparing the real value and the synthetic value of Chongqing and Shanghai [19]. They found that the impact of collection of property tax varied significantly on industrial relocation due to different property tax policy designs and locations at different levels of economic development and conditions. Wang et al. used provincial panel data and the synthetic control method to examine and measure the economic growth effect generated by policy changes and evolution in the coordinated development of the Beijing-Tianjin-Hebei region [20]. The study found that policy interventions in the early phase failed to release the potential for economic growth of the Beijing-Tianjin-Hebei region, while the subsequent plans and integration as well as reasonable relief conducted within the region positively promoted the overall regional development. As a result, the policy maker should understand the features of regional development at the current stage and stay on top of the trend, and carry out well-timed improvement of policy designs to make policy adjustment better follow the rules of regional development and achieve close coordination within and between regions [21].
To sum up, good strides have been made in studies relating to carbon efficiency of the Yangtze River Economic Belt, but shortcomings can also be identified: (1) Now studies on carbon efficiency are still insufficient, so are the studies on its driving factors; (2) the Yangtze River Economic Belt has become a key region for energy conservation and emissions reduction. However, most existing studies relating to carbon efficiency are carried out on a national or provincial level due to the availability of energy consumption data of the Yangtze River Economic Belt. Cross-regional study is rare. Usually, the method of policy evaluation is the double difference method, but the double difference method requires the assumption of parallel trend. In reality, if such a parallel control group can not be found, the composite control method is undoubtedly a solution. The composite control method provides a new idea for policy evaluation, which is to make causal inference by synthesizing a hypothetical target variable.
Therefore, this paper uses the composite control method to quantitatively evaluate the policy changes and their effects of the coordinated development of the Yangtze River Economic Belt, which has made breakthroughs in three aspects compared with the existing literature. First, the empirical method uses the composite control method for simulation research. The typical advantage is that it overcomes a variety of errors in the traditional estimation model, and the simulated counterfacts are more consistent with the experimental requirements and more objective than other methods. Second, the selection of research objects stands in the perspective of the whole region, complements the policy performance evaluation taking the region as a unit, breaks the traditional idea of division between provinces in the existing literature, and provides technical reference for China’s regional development. Third, the policy of regional coordinated development itself is characterized by systematic and dynamic changes. Unlike previous studies, which only treated the policy as a time node, the article combed it over time to build a “counterfactual” relative to the changes of a series of policies, so as to explore the dynamic changes of policy effects.
Model specification
This paper selects a recently developed non experimental evaluation method-composite control method [16], which uses the original statistical principles and constructs counterfacts to measure the results of policy experiments, so as to achieve the empirical effect of natural experiments. According to this idea, the core of the method is to find regions that are not subject to policy intervention to form a “potential control group”, and select the best weight to make the weighted composite control region as close as possible to the processing region before the implementation of the experiment in terms of economic characteristics, and then compare the difference between the implementation of the policy and the implementation of the policy, and calculate the role of the policy.
It is first necessary to decide the object of study when using the synthetic control method to evaluate the effect of a macro-policy in a certain region. Generally, the object of study is the region and a collection of other regions not exposed to the policy. In this paper, the object of study contains p + 1 regions, including one region exposed to the policy and p regions not exposed to the policy. Secondly, the variables of the object of study are defined as those embodying the economic characteristics of the p + 1 regions, combined with the time dimension defined as T-period panel data. Of course, the policy is implemented only in the i-the region from period T0 to the end of the observation period (1 < T0 < T, to ensure the confidence level of synthetic control, T0 should be 10 periods); but the remaining p regions are not exposed to the policy and can be the control regions of the i-th region. If these assumptions are true, we can estimate the effect of the policy implemented in the i-the region:
Where, t is time, i is a region unit, φ it is the economic growth of the i-th region at time t, and value 1 taken in the brackets means a natural experiment has been conducted, i.e., the policy intervention; and value 0 otherwise, i.e., the counterfactual of the object of study. It is not hard to find that if T0 ≤ t ≤ T, i.e., after the policy intervention, their difference Δ it is the policy effect. But the counterfactual φ it (0) cannot be observed in reality (i.e., no data available). In this case, the p control regions not exposed to policy interventions become data sources for our simulation.
We assumed that φ
jt
(0) is fit for the Equation [17]:
Where, αt is “time fixed effects”, X j is an observable vector of region j that is not exposed to policy interventions and will not change over time; u j is an unobserved common factor, which can be interpreted as the common impact confronted by different regions and their response to the shock varies from region to region, which is represented by vector γ t . Their product γ t × u j is “interactive fixed effects”; ɛ jt represents unobserved interventions and fluctuations in region j at time t with zero mean.
If 1≤j≤1 + P, the following equation can be derived according to Equation (2) after including the dummy variable D
jt
for experiment or not:
Among,
Besides, regions in the control group are not exposed to policy interventions, which is mathematically expressed as:
According to the synthetic control method, it is unnecessary to consider the independence of u j or ɛ jt for the selection of variable X j . It is only required to be policy-independent. Therefore, the factor selected just needs to be consistent with the interpretation of regional economic growth. As a result, the most central problem is about the “counterfactual” estimation.
We used a data-driven approach to simulate the counterfactual of natural experiments by taking weights of other control units that are not exposed to policy interventions to construct a synthetic substitute for the object of observation (the Yangtze River Economic Belt) not exposed to policy interventions. Of course, the synthetic region and the real region should be highly identical before the execution of policy, but may differ from each other afterward. If there’s a significant difference between the simulated region and the real one, it may indicate that the policy has produced significant effects. In line with the above approach, we first need to select weight vectors for control regions. The object of study in this paper is the effect of the Yangtze River Economic Belt policies for coordinated development. As the other 11 regions are not exposed to these policies, they become the potential control group’s “donor pool” of the Yangtze River Economic Belt. Let W = (ω2, ·· · , ωP+1) be a weight vector, where w
j
is non-negative, representing the weights of region j in the synthetic Yangtze River Economic Belt that sum to 1. Different values of W will lead to different “synthetic Yangtze River Economic Belt”, that is, the “simulation region”. The outcome variable is a weighted average of different units in the control group with W as the weight:
Suppose that there is W* = (ω2, ·· · , ωP+1) in Equation (5) such that and
The next focus is to acquire the value of W*. This paper constructed objects in the control group with a weighted combination of W* in order to simulate the counterfactual. And such a method is called the synthetic control method. Before the implementation of coordinated development in the Yangtze River Economic Belt, let the predictor variable describing economic development as vector Z1 (z×1 dimensional column vector; the subscript 1 means treatment group); denote the predictor variable of each of other 11 regions as matrix Z0(z×p dimensional matrix; the subscript 0 means “control group”; including corresponding values of 11 regions). We can choose weight W to make Z0W as close as possible to Z1, so that the synthetic Yangtze River Economic Belt can be as close as possible to the real Yangtze River Economic Belt in terms of economic characteristics. The degree of approximation can be measured by the following equation:
However, each predictor variable of the control region in Z1 has a different ability to predict the outcome variable, thus they should be assigned different weights. And the process of choosing different weights is actually a constrained minimization problem.
V is a (z×z) dimensional diagonal matrix where all the diagonal elements are non-negative, showing the relative importance of corresponding predictor variables to the outcome variables. The optimal V is chosen, so that, before the all-round initiation of policy interventions, the per capita GDP (or growth rate) of the synthetic Yangtze River Economic Belt is as close as possible to the real one. Y1 is denoted as a (12×1) a dimensional column vector, that is, the real per capita GDP of the Yangtze River Economic Belt from 2006 to 2017 (12 years). Y0 is a (12×P) dimensional matrix, each column of which lists the real per capita GDP of the corresponding control region from 2006 to 2017. We used Y0W * (V) to predict Y1 and considered minimizing the mean squared prediction error.
We chose the optimal solution W*(V), that is, the optimal weight to construct the synthetic Yangtze River Economic Belt, and put it into Equation (10) to assess the effect of coordinated development interventions in the Yangtze River Economic Belt.
Descriptive analysis of carbon efficiency
According to the calculation method of Kaya and Yokobori [22], the involved input indicators are capital stock, labor, energy input and carbon emissions. The capital stock (K) is measured by the single hero method; Labor force (L) is expressed by the number of employees at the end of the year; Energy input (E) is expressed in terms of total energy consumption, in 10000 tons of standard coal; The carbon emission is calculated by IPCC algorithm, and the unit is 10000 tons of carbon. The output index is measured by GDP at the constant price in 2006, with the unit of 100 million yuan. Data from 2006 to 2017 are selected for the sample, and the data is from China Energy Statistics Yearbook.
We can see from Table 1, the single-factor carbon efficiency is overall robust. But since 2013, the tail of the Yangtze River Economic Belt has seen an improvement. Sichuan, Hunan, Chongqing and Hubei have exceeded other cities in the growth of carbon efficiency and Shanghai has also witnessed a significant increase. This would be not possible without the initiation of the Yangtze River Economic Belt in 2013, that is, the strategic position of the Yangtze River Economic Belt to “advance development of regions on the upper and middle reaches of the Yangtze River and accelerate development and opening-up of the head and the tail”.
Single-factor carbon efficiency of each region in the Yangtze River Economic Belt
Single-factor carbon efficiency of each region in the Yangtze River Economic Belt
The prerequisite and constraints of the synthetic control method are further explored, according to Abadie et al. [12]. Thus, particular attention should be made to the construction of control regions. Firstly, the region that is also exposed to the policy should be removed from potential control regions. Secondly, the region that is greatly affected in the sample period should be removed from potential control regions. Finally, to avoid “interpolation bias”, potential control regions shall be limited to those sharing similar characteristics with treated regions. Therefore, we chose 11 provinces and cities, such as Beijing, Tianjin, Hebei and Gansu, which are similar to regions in the Yangtze River Economic Belt as control regions in this paper. We used the Synth package developed by Abadie et al. to measure the effect of coordinated development policies. On the one hand, this can overcome the endogeneity problem that tends to occur when evaluating policies. On the other hand, we can measure the measurable policy performance of synergistic policy interventions. In this paper, carbon efficiency and per capita GDP from 2006 to 2013 are used to simulate the object of synthetic control in the Yangtze River Economic Belt. In synthetic control, it is critical to obtain weights. We minimized the mean squared error of the real per capita output growth rate of the control group and the intervention group prior to 2013 and the results are shown in Table 2.
Synthetic control method indicator weights
Synthetic control method indicator weights
According to Figs. 1 and 2, upon the inception of the synthetic Yangtze River Economic Belt, there’s a discernible divergence between the curves of the real and the synthetic Yangtze River Economic Belt. This indicates that the initiation of the Yangtze River Economic Belt has an effect on the economic growth of this region. Specifically, policy interventions in the Yangtze River Economic Belt didn’t work well in earlier years and even restrained the economic growth of the whole region. The Yangtze River Economic Belt policy was implemented in July 2013. But since 2014, the carbon efficiency of the Economic Belt has been significantly lower than the counterfactual (the synthetic Yangtze River Economic Belt). It is evident that there’s a lag in the effect of the Yangtze River Economic Belt policy. This is about detailed policies for the Yangtze River Economic Belt, including putting large amounts of resources to build an integrated multidimensional transportation corridor along the Yangtze golden waterway, and intensifying efforts in protecting the Yangtze River Economic Belt, i.e., the green development. These measures to some extent restrained the increase of carbon efficiency across the Yangtze River Economic Belt in the initial period of these policies. But since 2015, detailed policies for the Yangtze River Economic Belt have significantly paid off [23].
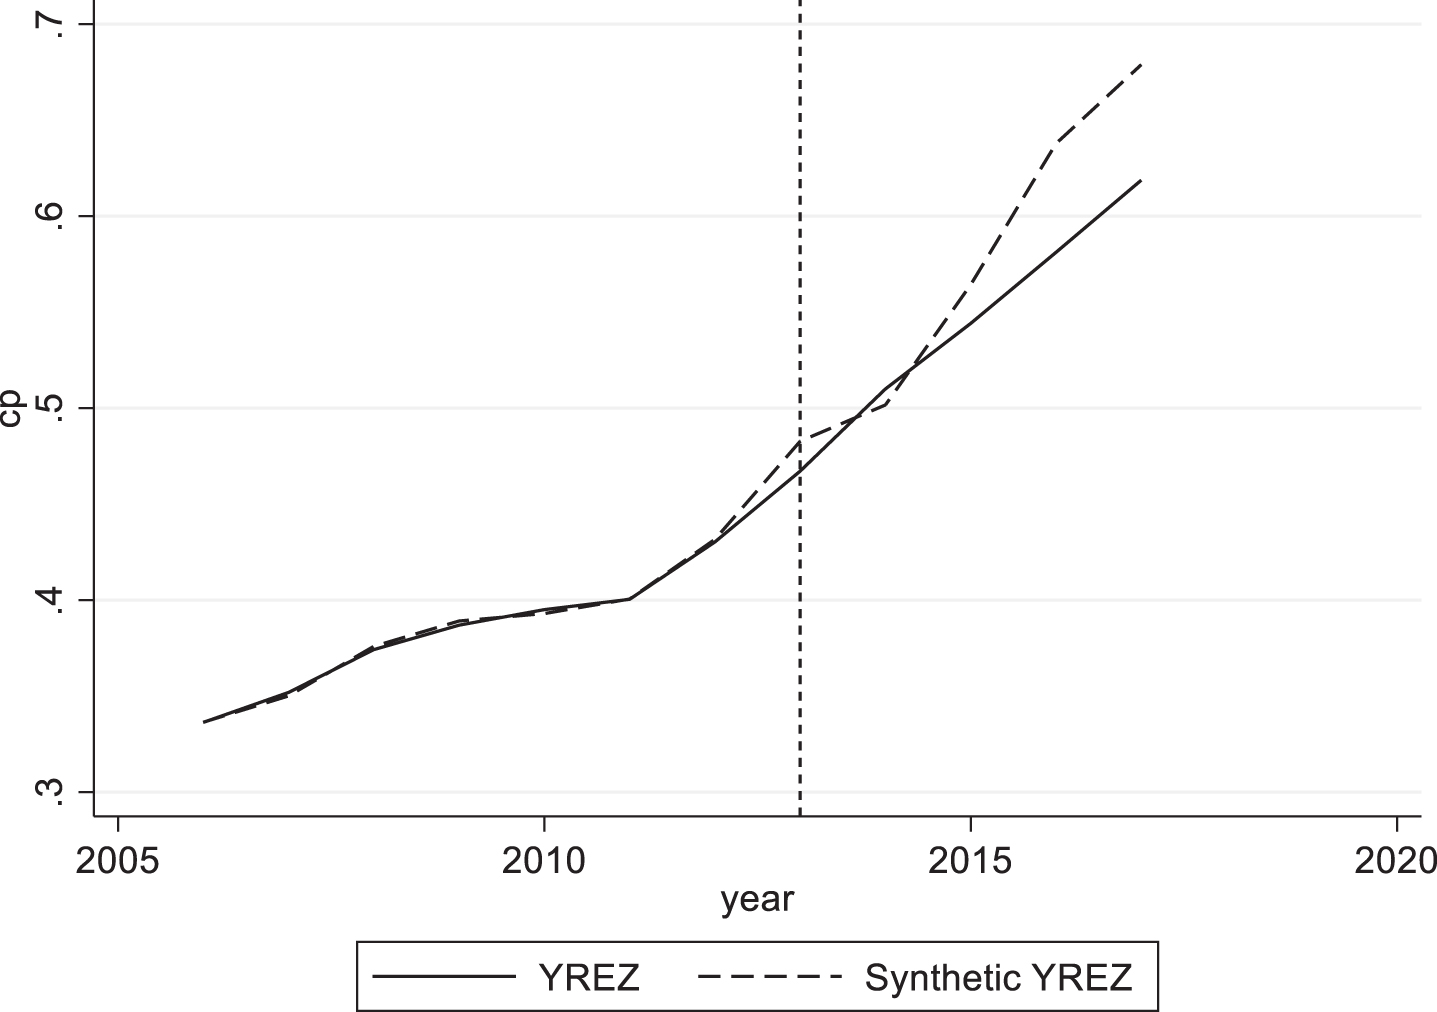
Carbon efficiencies of the real and the synthetic Yangtze River Economic Belt from 2006 to 2017 with carbon efficiency weight.
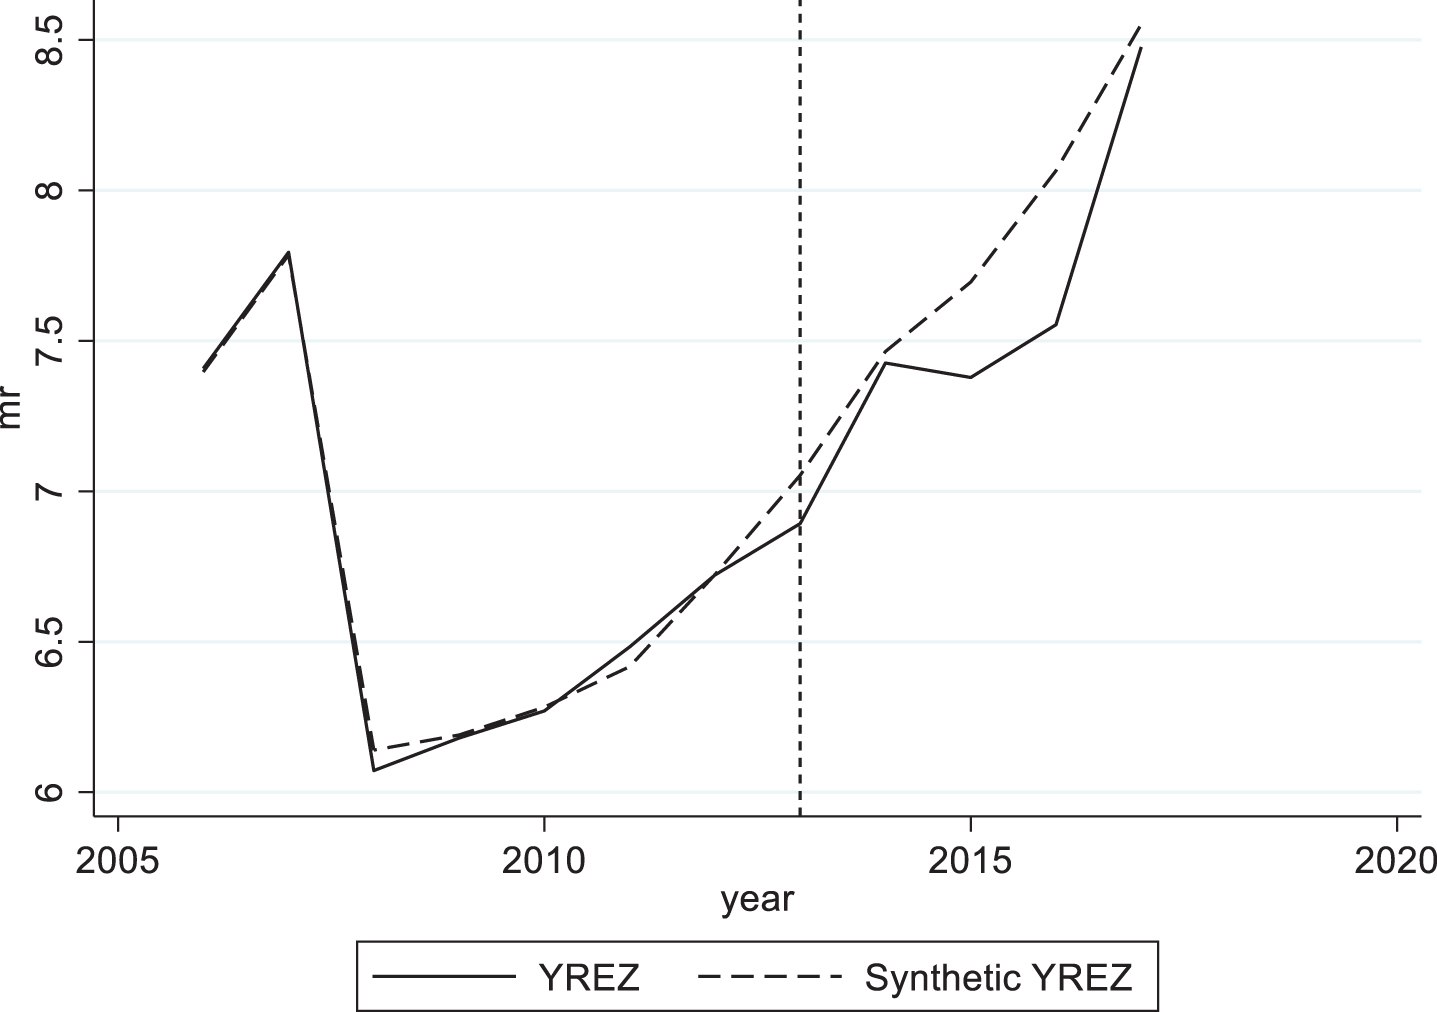
Carbon efficiencies of the real and the synthetic Yangtze River Economic Belt from 2006 to 2017 with marketization level weight.
In order to improve the robustness of our conclusion, we used placebo tests to directly compare the “post-intervention RMSPE” with the “pre-intervention RMSPE” of each region, that is, to calculate the ratio of them by the following basic logic that, for the treated Yangtze River Economic Belt, the synthetic control will not be able to predict post-intervention outcome variables of the real Yangtze River Economic Belt if policy interventions produce effects, thus leading to a greater post-intervention RMSPE. However, if the synthetic Yangtze River Economic Belt is unable to predict outcome variables of the real Yangtze River Economic Belt before interventions (a greater pre-intervention RMSPE), the post-intervention RMSPE will increase. As a result, Beijing shall be removed as its RMSPE is about 80 times that of the Yangtze River Economic Belt. If the policy indeed produces greater treatment effects, and the placebo effects of other regions are small, the value should be greater than that of other regions. According to the Fig. 3 and Table 3 below, the ratio of the Yangtze River Economic Belt is significantly larger than that of other regions. So, if the Yangtze River Economic Belt policy is completely ineffective, but due to chance factors, the probability of obtaining the maximum ratio among all provinces and cities is 0/11 = 0, which approximates the significance level in statistical inference. Therefore, the increase in single-factor carbon efficiency of the Yangtze River Economic Belt is deemed significant at the 0% level, and the results are credible.
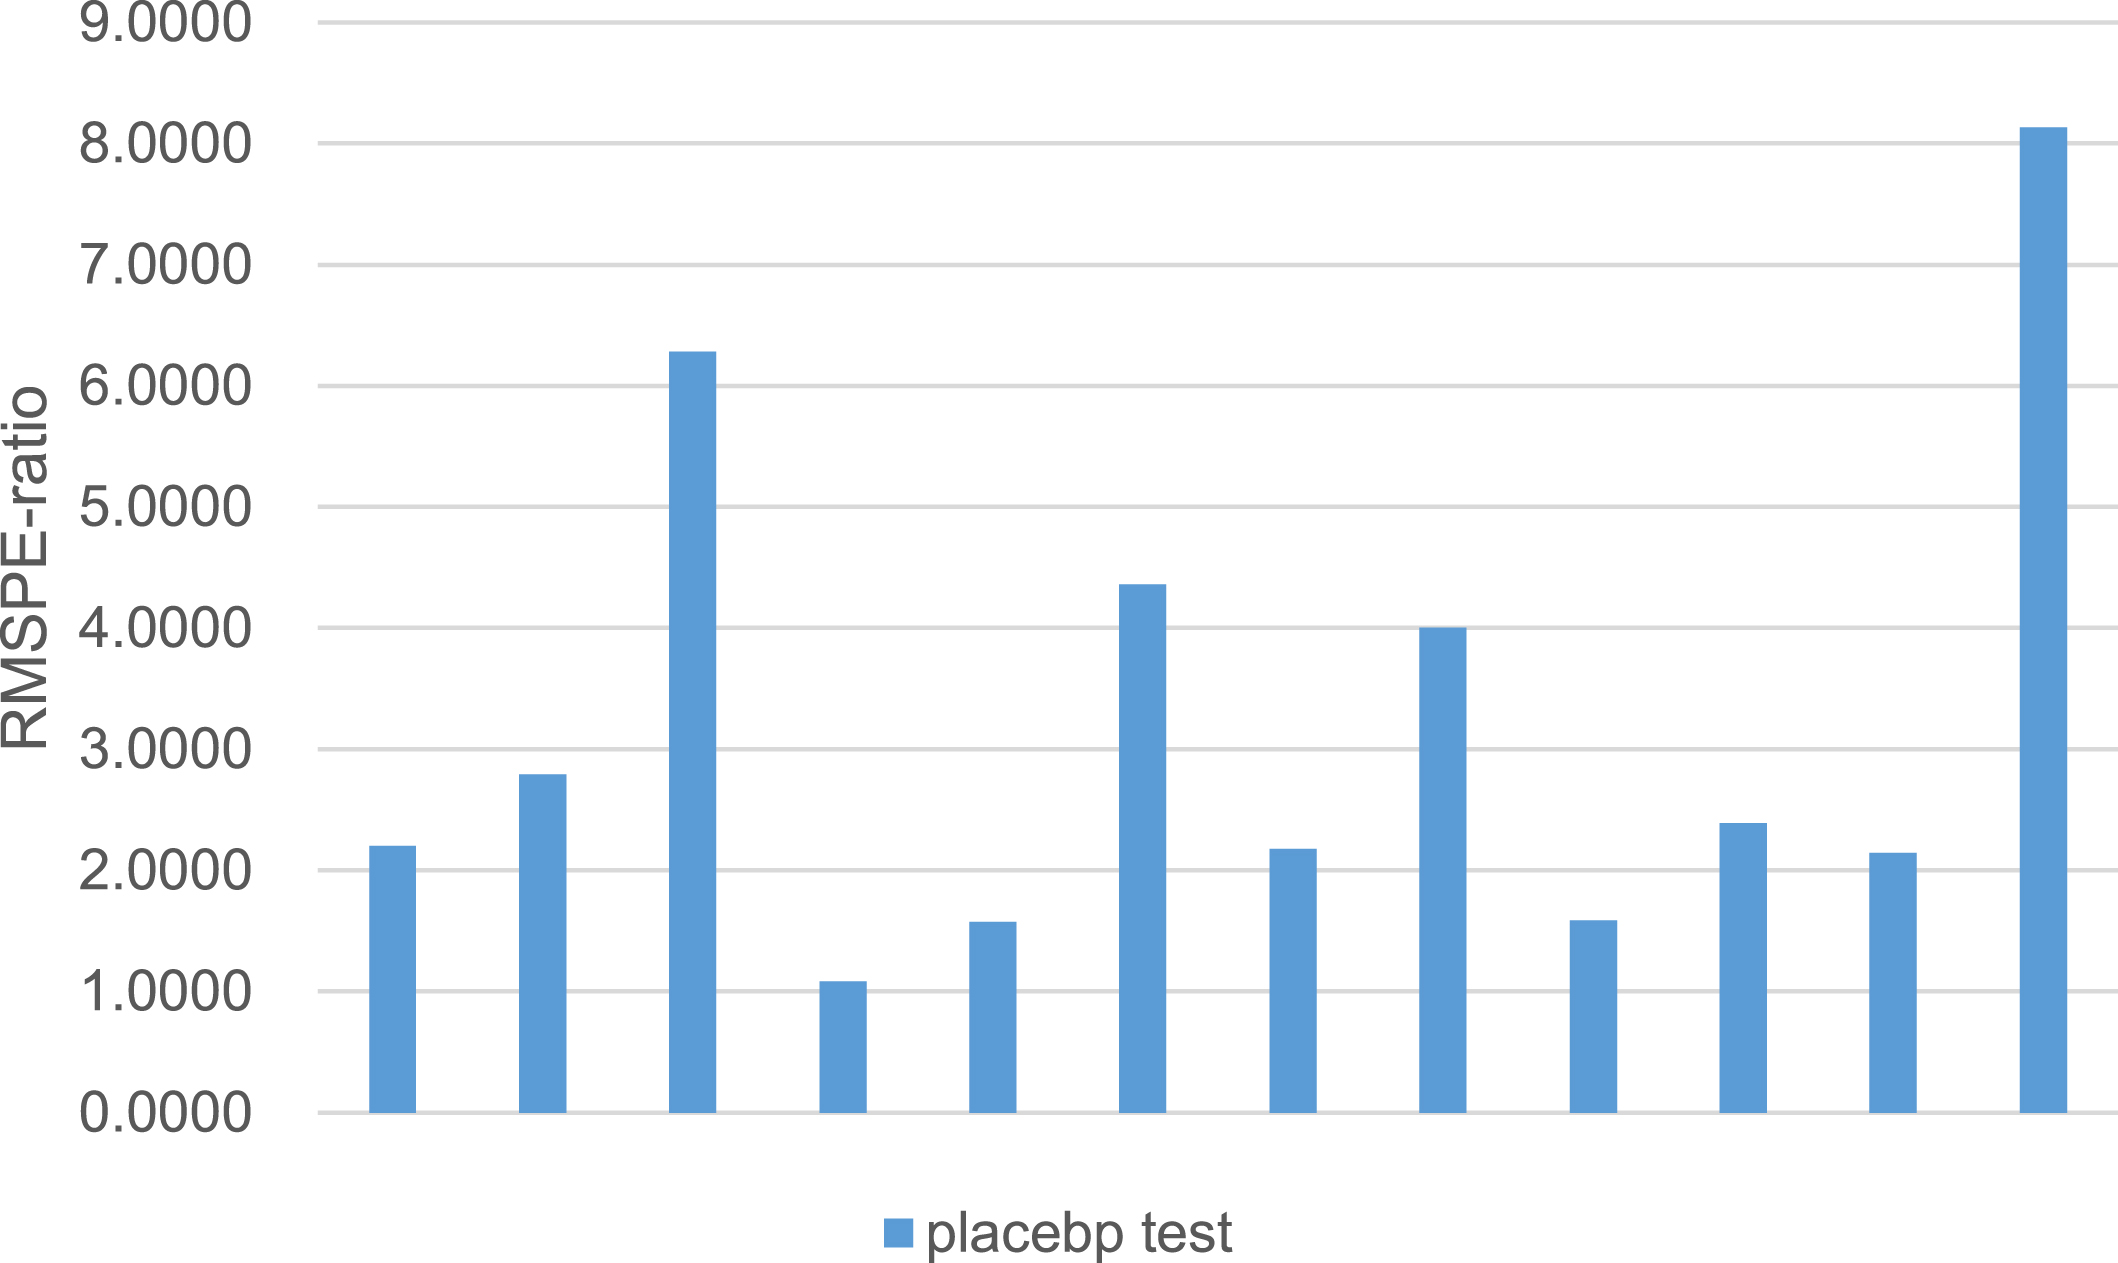
Placebo test diagram of synthetic control method.
Placebo test results of synthetic control method
This paper uses the single factor carbon efficiency model to calculate the carbon efficiency of each region of the Yangtze River economic belt, and then uses the synthetic control method to study the impact of environmental policies on the Yangtze River economic belt, so as to provide a scientific reference for the Yangtze River economic belt to formulate emission reduction policies and realize regional low-carbon and high-quality development. The research shows that the single factor carbon efficiency is relatively stable, but since about 2013, the tail development of the Yangtze River economic belt has gradually improved. The carbon efficiency of Sichuan, Hunan, Chongqing and Hubei has increased more than that of other cities, and Shanghai has also improved significantly; After the beginning of the synthetic Yangtze River economic belt, the two curves of the real Yangtze River economic belt and the synthetic Yangtze River Economic Belt deviated significantly. The specific performance is that the effect of the policy intervention of the Yangtze River Economic Belt in the first few years is not ideal, and even inhibited the economic growth of the whole region.
It can be seen that, with the adjustment and change of a series of policies in the Yangtze River Economic Belt, although the initial policy intervention is not conducive to the regional growth of the Yangtze River Economic Belt, the policy framework has been improved in the late period for the integration and relief policies within the region, which has a strong correction effect. It can be seen that in a series of policy changes, especially the introduction of the policy of “only engaging in major protection, not major development”, has greatly promoted the improvement of the overall carbon efficiency of the Yangtze River Economic Belt, which indicates that the timely matching of regional synergy and agglomeration effects is of positive significance for optimizing the overall development of the region. Therefore, the policy design of regional coordinated development must fully consider the adaptability of economic laws and reality, balance the matching degree with regional development opportunities, and systematically promote the timely adjustment and real-time follow-up of policies.
Of course, this paper only provides an empirical answer for the evaluation of the effect of regional carbon efficiency coordinated development policies, and more rigorous suggestions for policy adjustment and improvement need to be further studied. Faced with such a vast territory, China’s regional development and innovation are extremely necessary. The Yangtze River Economic Belt, as a pilot of regional coordinated development, has a prominent strategic position, but also faces such thorny problems as population concentration, imbalance in regional development, and fragile ecological environment. The central government has carried out systematic coordinated promotion at multiple levels and angles. This paper aims to measure the dynamic effects of this series of policy changes. At the same time, it is believed that the coordinated development of carbon efficiency in the Beijing Tianjin Hebei region must establish a measurable indicator system and measure it in a timely manner, accurately measure the degree of coordinated development of regional carbon efficiency, grasp the development stage and change trend, and constantly optimize the policy design to make policy adjustment more consistent with the opportunity of coordinated development of regional carbon efficiency.
It’s worth noting that, this paper used a new developed synthetic control method for project evaluation and empirically analyzed the impact of policies on carbon efficiency of the Yangtze River Economic Belt, providing the theoretical foundation and empirical evidence for national carbon efficiency policies. Nevertheless, the implementation of environmental protection policies affect every aspect of the economic life and our paper only emphasizes the impact of policies on carbon efficiency. In the process of policy design, a wide variety of factors should be considered to ensure the environmental protection policy system is science-based and proper for effective functioning, In particular, the further connotation of the policy effect and its far-reaching significance for the improvement of carbon efficiency in China and the world have not been further discussed. Future research prospects: further collect and sort out the data on the industry level. On the basis of the industry level data, subdivide the impact of policies into various industries, and deeply identify the transmission path of carbon efficiency. At the same time, in the research process, it is necessary to reasonably solve the identification of localization characteristic variables unique to each country and the definition of the transmission effect. It is necessary to improve the research method, relax the weight requirements of the composite control method, and allow the situation where the weight ratio is greater than 1 to occur. This expands the research field and scope of the composite control method, and can reasonably analyze some extreme situations in regions. Moreover, the composite control method is a simple optimization problem. From its target formula, we can see that when the value of the target variable is outside the convex hull of the control variable, using the composite control method will bring some problems, which will also be solved in the future
Data availability
The data used to support the findings of this study are available from the corresponding author upon request.
Conflicts of interest
The authors declare that there is no conflict of interest regarding the publication of this paper.
Footnotes
Acknowledgment
The study is supported by the funds of Chongqing Social Science Planning Project (No. 2019WT12) and Science and Technology Project of Chongqing Education Commission (No. KJQN202000506 and No. KJQN201800503). This paper is grateful to the reviewers for helpful comments.
Author’s contribution
Jun Duan contributed to the motivation, the interpretation of the methods, the data analysis and results, and provided the draft versions and revised versions, references. Qi Ren provided the data and results, the revised versions and references. Baoshuai Zhang provided the related concepts and minor recommendations, extracted the conclusion and discussion.