
Abstract
The paper focuses on how to improve the prediction accuracy of time series and the interpretability of prediction results. First, a novel Prophet model based on Gaussian linear fuzzy approximate representation (GF-Prophet) is proposed for long-term prediction, which uniformly predicts the data with consistent trend characteristics. By taking Gaussian linear fuzzy information granules as inputs and outputs, GF-Prophet predicts with significantly smaller cumulative error. Second, noticing that trend extraction affects prediction accuracy seriously, a novel granulation modification algorithm is proposed to merge adjacent information granules that do not have significant differences. This is the first attempt to establish Prophet based on fuzzy information granules to predict trend characteristics. Experiments on public datasets show that the introduction of Gaussian linear fuzzy information granules significantly improves prediction performance of traditional Prophet model. Compared with other classical models, GF-Prophet has not only higher prediction accuracy, but also better interpretability, which can clearly give the change information, fluctuation amplitude and duration of a certain trend in the future that investors actually pay attention to.
Introduction
Over the years, classical statistics flourished [1, 37]. However, with the advent of the era of big data and the wide use of the Internet of Things [12], current time series present new characteristics, which are difficult to meet any stationary assumptions required in traditional time series modeling [8] and due to the massive and high-dimensional nature, direct modeling on such series is not only costly but also inefficiently. As a result, machine learning methods emerged [6, 39], which generally have problems such as poor interpretation, complex parameter tuning and high data dependence.
To improve efficiency and accuracy, many scholars turn to replace original time series with various approximate representations. The main works include Fourier transforms [25], Wavelet transforms [4, 36], Landmarks [23], singular value decomposition (SVD) [10, 16], piecewise linear representation (PLR) [2, 14], symbolic aggregate approximation (SAX) [18, 19], non-parametric symbolic approximate representation (NSAR) [9] and so on [13, 39], which provide references and guidance for mining knowledge efficiently from large-scaled time series, and have achieved remarkable results. However, some problems cannot be ignored. First, most of these involve numerous input parameters, then users are forced to adjust settings to get the best performance. The tuning process is unlikely to be explicit, and incorrect settings often lead to serious deviations. Second, plenty of approximate representations are based on real number perspective, compared with approximate representations under fuzzy number perspective with fuzzy characteristics, more critical information will inevitably be lost.
To solve this, Pedrycz and Yu et al. [29, 33] proposed the Gaussian linear fuzzy information granule in 2017, which was inspired by Zadeh’s pioneering works on information granules and granule computing in the 1990s [21, 35]. Compared with other approximate representations based on real number perspective, Gaussian linear fuzzy approximate representation is derived from Gaussian linear fuzzy information granules and preserves fuzzy boundaries of the object. Besides, it has a unique ability to approximate time series with certain trends compared with other fuzzy information granules. In summary, Gaussian linear fuzzy approximate representation not only avoids the dilemma of parameter optimization, but also gets the approximate representation in fuzzy sense with less critical information loss.
In recent years, hybrid methods combined fuzzy approximate representations (or fuzzy ideas) and machine learning techniques surged for time series prediction. Yang et al. [33] proposed a fuzzy inference system based on Gaussian fuzzy information granules for long-term prediction; Tang et al. [29] improved Long-Short Term Memory (LSTM) by using Gaussian linear fuzzy information granules; Luo et al. [20] further optimized previous works by introducing type-2 fuzzy sets and nonlinear kernel lines; Li et al. [17] proposed a multi-linear trend fuzzy information granule to attenuate redundant trend information and effectively reflect the trend pattern of data; Wang et al. [31] improved back-propagation neural network (BP) by using Gaussian linear fuzzy information granules, which is proved to be effective and feasible; Guo et al. [7] proposed an equalization algorithm using dynamic time warping (DTW) to adjust the length of fuzzy information granules, and introduced it into the hidden Markov model to improve the prediction accuracy.
All above works have been proved to improve prediction performance and interpretation of original models, suggesting that combining fuzzy approximate representations and machine learning techniques to form a hybrid approach seems to be a promising idea. However, a problem cannot be ignored. After fuzzy granulation, data are often compressed into dozens or hundreds of pieces, or even less, which is far from enough for data-driven machine learning models, resulting in serious overfitting of the model.
In view of above considerations, main contributions of this paper are summarized as follows:
(1) A granulation modification algorithm is proposed to extract trends more accurately, which corrects approximate results with a simple and intuitive logic.
(2) A novel Prophet model based on Gaussian linear fuzzy approximate representation is proposed, which is a perfect combination of statistics, fuzzy mathematics and information granulation.
(3) Both inputs and outputs are in granule form, which not only reduces the data dimension and saves computational costs, but also enables long-term prediction (a granule contains multiple numerical data) and is highly interpretable (a granule is essentially a compact and meaningful entity).
(4) It can accurately predict the direction, amplitude and time point of significant changes in the trend. Compared with prior works, it has better practical value and provides more useful reference for investors.
The paper is organized as follows. In Section 2, some basic concepts involved are introduced. In Section 3, a granulation modification algorithm is proposed and then the Prophet model based on Gaussian linear fuzzy information granule is constructed. Empirical analysis is carried out in Section 4. Our conclusions are given in Section 5.
Preliminaries
Some basic concepts involved in this paper are briefly introduced in this section, which is divided into two subsections, one for ℓ1 trend filtering and the other for Gaussian linear fuzzy information granule.
ℓ1 trend filtering
Changepoint refers to the point where the trend of time series changes significantly. In this paper, ℓ1 trend filtering is used to identify the possible number and location of changepoints, which is an effective method for trend extraction and the calculation amount shows a linear growth trend with the increase of samples.
Assuming that a real time series y
t
can be decomposed as follows [15]:
The first item in Equation (1) is used to measure the residual, then the second item is the second-order difference of x t . A nonnegative parameter λ is introduced to control the tradeoff between the smoothness of x t and the size of ɛ t . When λ → 0, x t converges to y t .
It has been proved that Equation (1) has a unique minimum denoted as x lt , which is called the ℓ1 trend filtering of y t (see Equation (2)).
Different from traditional fuzzy information granules, which only contain the size information of data (such as “small” or “very large”), Gaussian linear fuzzy information granule proposed by Yang et al. [33] introduces the time dimension to reveal both amplitude and trend changes in time series simultaneously, so that it expresses such meanings as “slowly declining from a high level” and “rapidly rising from a low level”, which is defined as follows.
In order to measure the difference between granule time series and original time series, the trend mismatch score ρ (LG) is defined as follows.
In this section, a Prophet model based on Gaussian linear fuzzy information granule (GF-Prophet) is proposed. Before this, the modeling process of Gaussian linear fuzzy approximate representation is elaborated and a novel granulation modification algorithm is proposed to prepare for the subsequent modeling.
Gaussian linear fuzzy approximate representation
Consider a one-dimensional real-valued time series Y=(y1, y2, ⋯, y n ). Assuming that there are m changepoints with coordinates {(t1, y t 1 ), (t2, y t 2 ),⋯,(t m , y t m )} (excluding the start point and the end point) in Y. x lt is fitted first according to Equation (2) and turning points in x lt are extracted as the changepoints t′ = {t1, t2, ⋯ , t m } that we actually need. Then, the original time series is divided into m + 1 non-overlapping ordered subsequences by t′, so that data in each subsequence have the same or highly similar trend and data in adjacent subsequences show significantly different trends.
After that, LG(k, b, σ, T) is used to approximate the data in each subsequence, where the time span T is determined with T
i
= t
i
- ti - 1 (i = 1, 2, ⋯ , m + 1) and linear regression y = kt + b + ɛ is performed to estimate k, b, σ respectively, where ɛ ∼ N (0, σ2). Then, m + 1 LGs are obtained to constitute an initial granular time series, which can be expressed as follows:
However, sometimes we are surprised to find that two adjacent LGs in Y LG have highly similar trends. This may be because changepoint identification depends on the deviation degree of a certain point, while the granulation process takes into account all data in a subsequence. The phenomenon is not serious in datasets with obvious trend fluctuations, but exists in large amounts in more real datasets, which will significantly affect the model performance.
In order to optimize granulation results, three parameters, namely γ,
First, LG
i
that meets following conditions is selected from Y
LG
: (1) T
i
< γ; (2) k
i
ki-1 ≥ 0 or k
i
ki+1 ≥ 0. Second, LG
i
that meets the condition
Then an example is given to understand the above modeling process intuitively, which also verifies that compared with the initial granule time series, the modified one does have better performance.
Before that, the trend mismatch score ρ defined in Definition 2.2 is corrected in Equation (5) to solve the dilemma that ρ will fail when parameters in LG (k, b, σ, T) are pretty large.
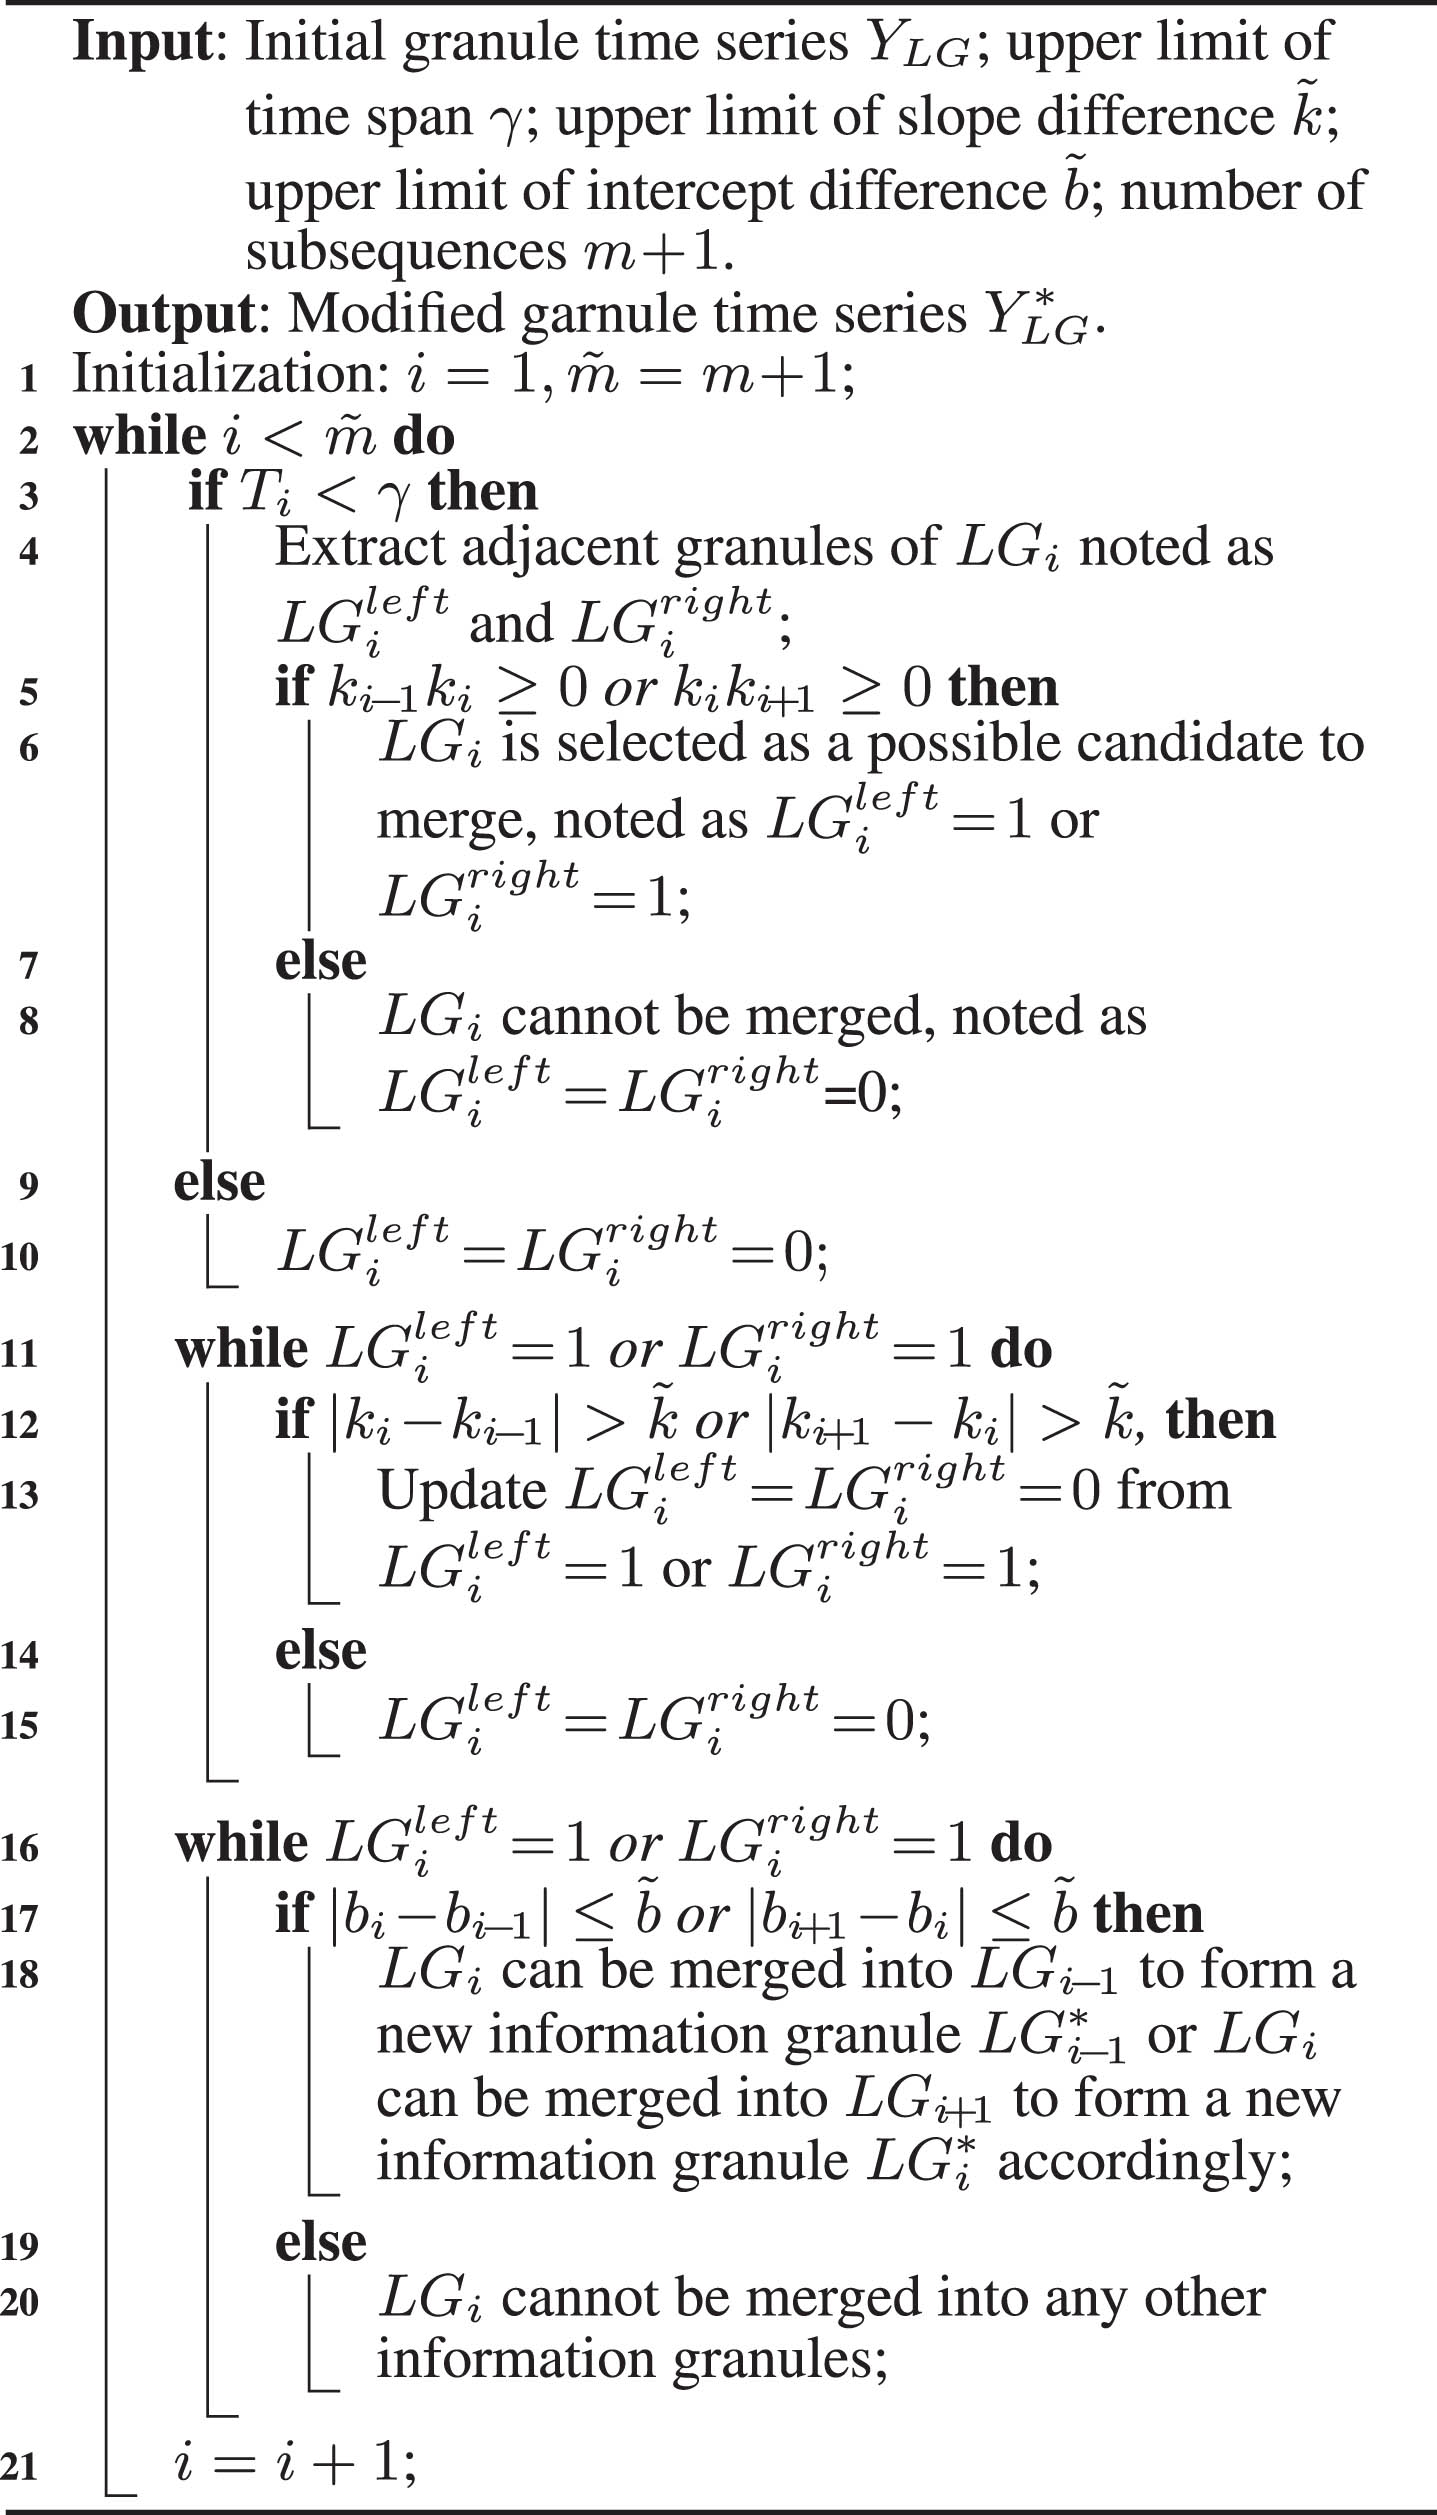
First, a time sequence diagram (see the upper half of Fig. 1) is fitted to roughly understand the trend, which shows a rapid downward trend after slight fluctuations.
Original time series (the upper half) and subsquences divided by changepoints (the lower half).
Second, five changepoints t′ = { 57, 287, 363, 559, 621 } are identified by ℓ1 trend filtering to divide the original time series into 6 subsequences as shown in the lower half of Fig. 1, which are:
Then, Gaussian linear fuzzy information granule is constructed for each subsequence according to Definition 2.1 to form an initial granule time series Y
LG
.
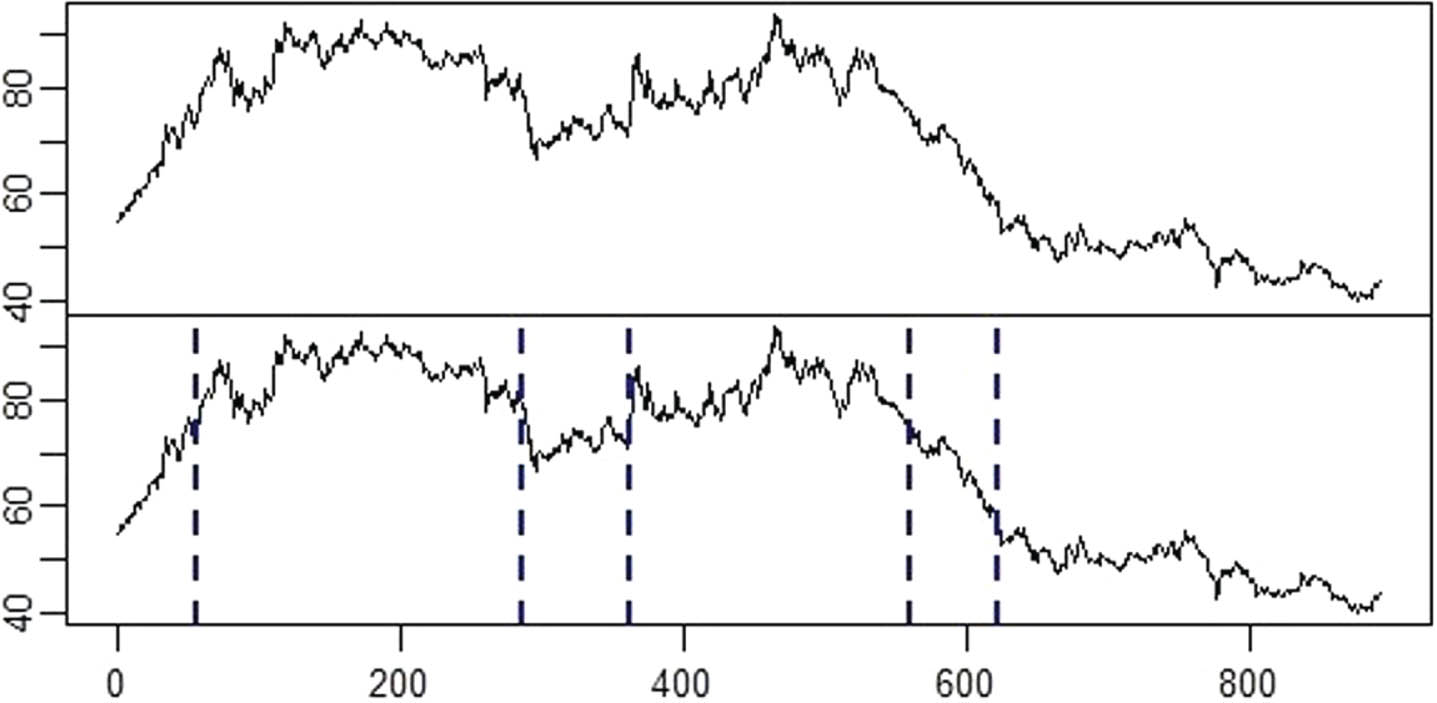
Time series granulation and modification.
After that, we find from the upper half of Fig. 2 (A red dashed line represents a Gaussian linear fuzzy information granule) that the trend difference of some adjacent information granules is not obvious, which suggests us to modify Y
LG
through Algorithm 1. First, LG3 and LG5 are selected, which satisfy conditions: (1) T
i
< γ; (2) k
i
∗ ki - 1 ≥ 0 or k
i
∗ ki + 1 ≥ 0, where γ = 91.0. Then, trend differences are calculated:
Obviously, LG3 is selected as a candidate when
In order to verify the modification effect, ρ∗ defined in Equation (5) is used to compare fitting errors between initial granule time series Y
LG
and modified granule time series
Obviously, compared with Y
LG
, the modified granule time series
The Prophet model based on Gaussian linear fuzzy approximate representation (GF-Prophet) is proposed in this subsection, principles and the framework involved are described below.
More formally, each Gaussian linear fuzzy information granule
Trend-oriented datasets
Trend-oriented datasets
Then Prophet models are constructed on each trend-oriented dataset presented above.
The Prophet model proposed by Taylor et al. [30] is essentially an additive model of time series, which not only considers the trend term and the seasonal term in traditional additive models, but also introduces the holiday term and the concept of changepoints. The framework is shown below:
Among them, g t is used to extract nonperiodic characteristics to describe how data are growing or falling over a period of time, which can be divided into linear form and nonlinear form. The linear form shown in Equation (6) [30] is suitable for scenarios of steady rise or decline, such as product sales in the growth stage, etc. The nonlinear form shown in Equation (7) [30] is suitable for scenarios where data tend to be saturated, such as global GDP and total population. Noticing that the trend will naturally change over time, changepoints are aslo introduced to help decompose or fit the trend term g t more accurately.
The seasonal term s t is used to extract periodic changes for each month, each season or each year, which is usually approximated in terms of Fourier series as shown in Equation (8) [30].
The holiday term h t shown in Equation (9) [30] is used to consider that time series may have great fluctuations in some specific festivals, for example, passenger traffic will increase significantly before the Spring Festival and decrease significantly during the Spring Festival.
As is known to all, each model has applicable scenarios. For the Prophet, there are widely applicable scenarios: (1) at least one complete cycle of training data to study the rule of data better; (2) data with normal cycle effect, such as seasonal effect and cycle effect; (3) changepoints in time series are clear; (4) misssing values and outliers are in a reasonable range. Conditions (1) and (2) are easy to meet in the context of big data, condition (4) is also easy to meet in most datasets and if not, it can be achieved through data preprocessing further, condition (3) can be achieved by ℓ1 trend filtering.
Four trend-oriented datasets have been obtained previously and the data in each dataset still meet the above four conditions. We then build Prophet models for four trend-oriented datasets respectively and the modeling flow chart is shown in Fig. 3.
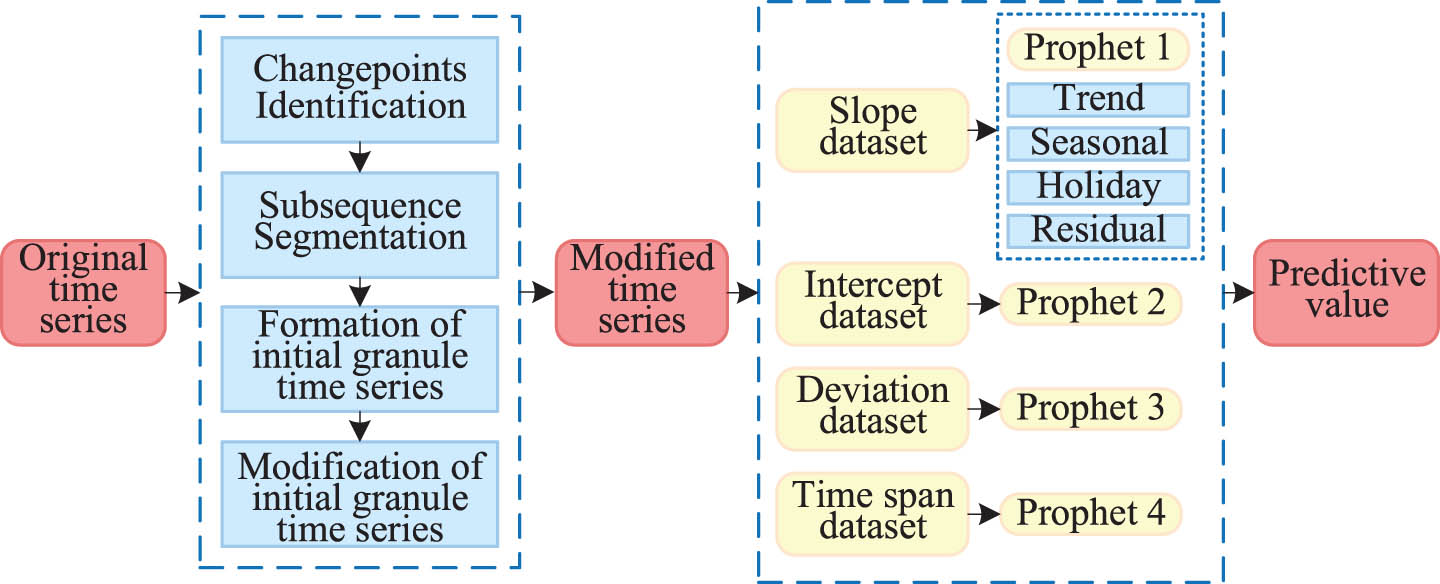
Modeling process, which mainly contains Time series granulation and GF-Prophet construction.
Empirical analysis is carried out in this section on multiple datasets to verify the performance of GF-Prophet, then experimental results are analyzed in combination with the actual situation.
Empirical preparation
The datasets, comparison models and performance indexs involved in empirical analysis are briefly introduced here.
(1) Datasets introduction
Five real-world datasets 1 , 2 are selected to assess the performance of GF-Prophet, which cover a commodities dataset, a cryptocurrency dataset, two stock closing price datasets and a non-economic dataset, and time sequence diagrams (see Fig. 4) are fitted to roughly understand the trend of these datasets.
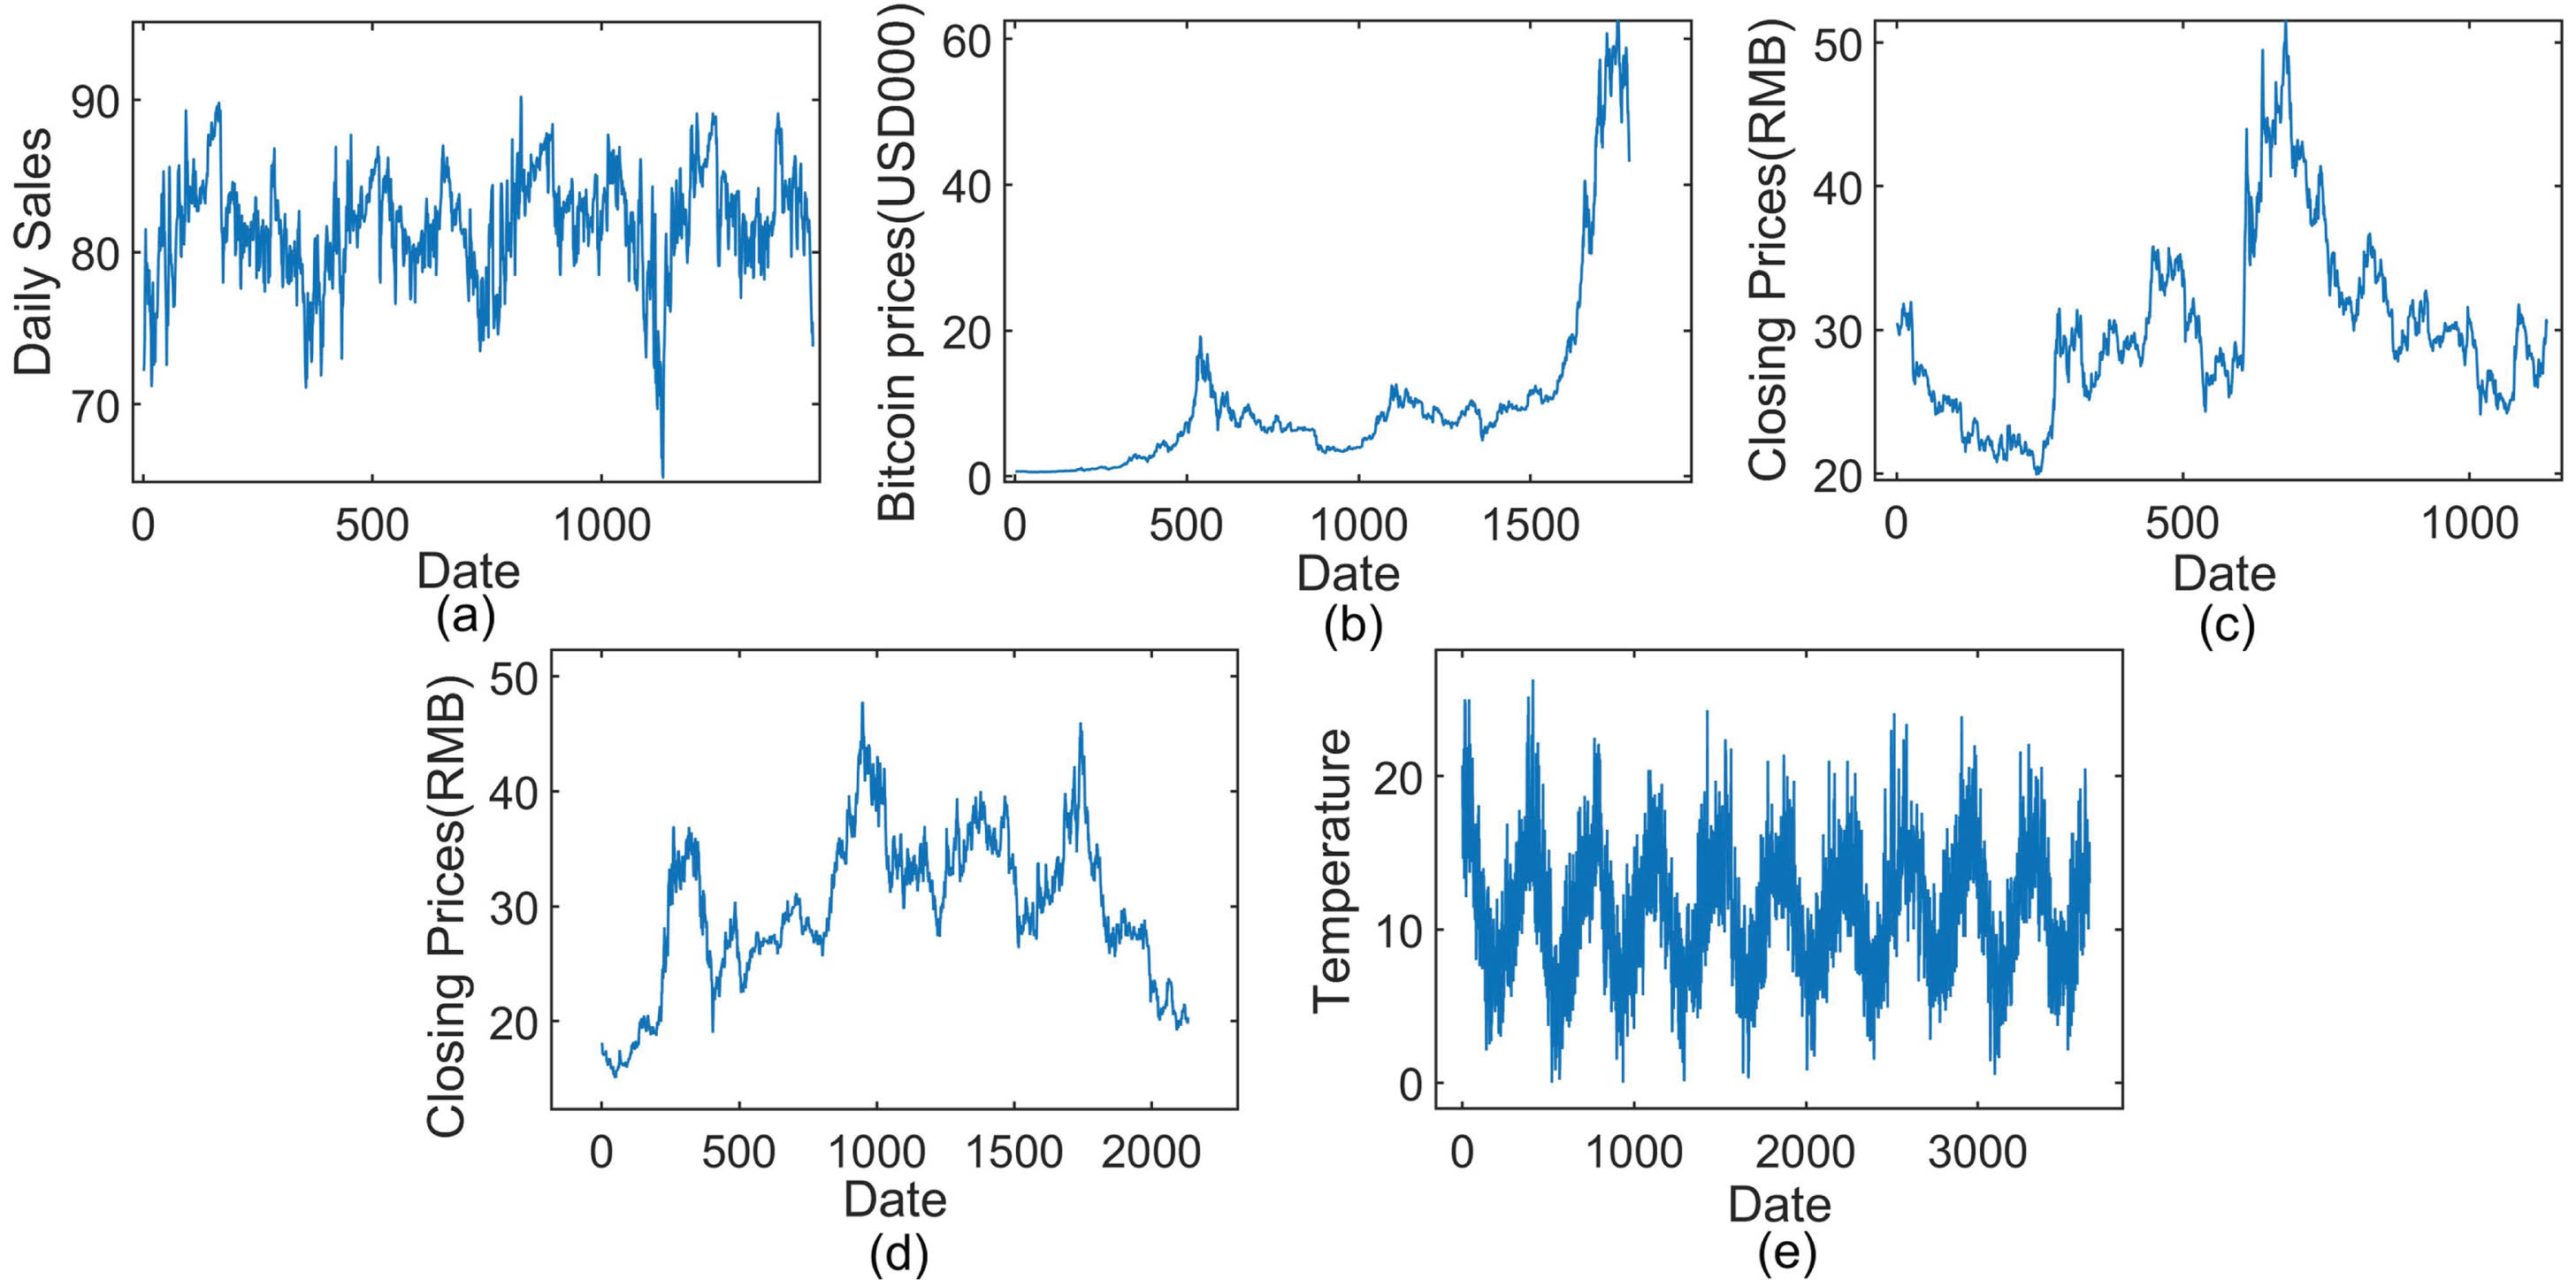
Illustration of five time series.
(a) Product daily sales at a Mumbai branch of an Indian company, Jan. 2005-Dec. 2008, with 1461 pieces of data;
(b) Bitcoin prices dataset [5], Dec. 2016-Nov. 2021, with 1787 pieces of data;
(c) China Life’s daily closing price dataset, Jan. 2018-Sept. 2022, with 1,135 pieces of data;
(d) China Pacific Insurance’s daily closing price dataset, Jan. 2014-Sept. 2022, with 2,132 pieces of data;
(e) Melbourne daily minimum temperature dataset, Jan. 1981-Dec. 1990, with 3650 pieces of data.
(2) Comparison models
(a) MA: Moving average (MA) is essentially a linear combination of historical white noise, which has simple principle and stable prediction performance.
(b) ARIMA: ARIMA (p, d, q) is a widely used method for time series prediction, where p, q, d respectively represent the number of autoregressive terms, moving average terms and the difference order.
(c) ES: Exponential smoothing (ES) can be considered as a special weighted moving average, with a parameter called smoothing factor α (α ∈ [0, 1]).
(d) HW: Holt-Winters (HW) is a cubic exponential smoothing method, introducing treatment for seasonal factors and having addition and multiplication models to choose from.
(e) LSTM: Long Short-Term Memory (LSTM) introduces gating mechanisms and an internal state to solve gradient explosion or disappearance commonly found in RNN, which is recognized as a model with superior performance and strong predictive power, but poor interpretability.
(f) Prophet: Prophet realizes multi-granularity analysis and prediction of year, month, day and hour, supporting cycle effect, holiday effect, additive and multiplicative trend fitting.
(3) Performance indexes
(a) Mean absolute error (MAE):
(b) Root mean square error (RMSE):
(c) Mean absolute percentage error (MAPE):
Extensive comparative experiments are carried out here, experimental parameters are explained and prediction results are analyzed in combination with the actual situation.
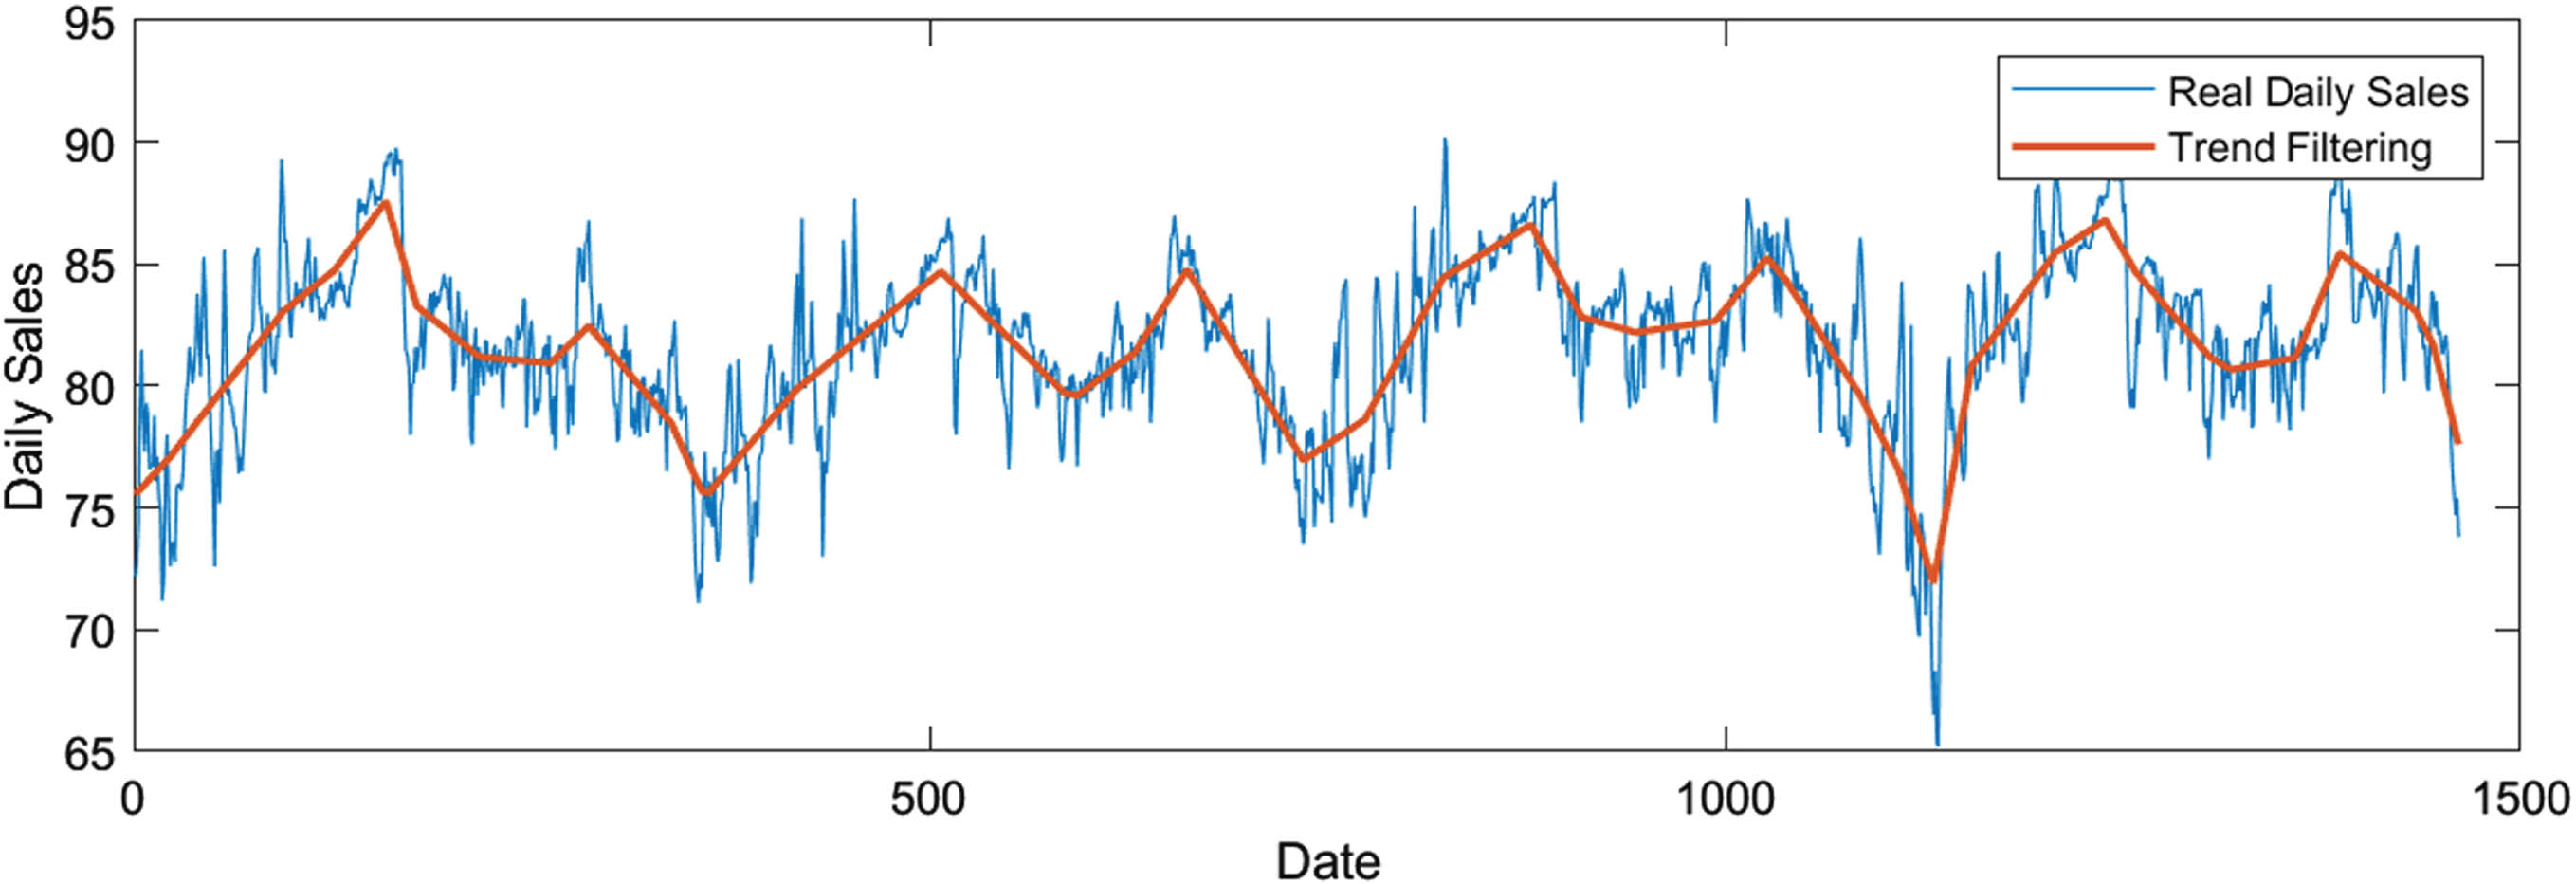
The ℓ1 trend filtering for product daily sales.
Step 1. Changepoints identification and subsequences segmentation.
15 changepoints are identified by ℓ1 trend filtering with λ = 131.72 in time series Y1 = (y1, y2, ⋯ , y1461), as shown in Fig. 5.
Then Y1 is divided into 16 ordered non-overlapping subsequences. Step 2. Formation and modification of granule time series.
Gaussian linear fuzzy information granules are constructed for each subsequence according to Definition 2.1 to form an initial granule time series Y
LG
= {LG1, LG2, ⋯ , LG16}. Then Algorithm 1 is used to merge LG12 and LG13 to form the modified granule time series
Step 3. Formation of trend-oriented datasets.
The trend information is extracted from
Step 4. Prediction based on trend-oriented datasets
According to the ratio of roughly 9:1, the first 1328 data in original time series serve as the train set, and the last 133 serve as the test set. Corresponding to the granule time series, the first 13 information granules serve as the train set, the last 2 serve as the test set.
Prediction results of GF-Prophet is shown in Table 2, from which we can predict that product daily sales in this branch will increase at a rate of 0.076 for the first 72 days in the future, then descend at a faster rate of 0.112917 for the later 86 days. In addition, the information of bias and intercept can also be obtained at the same time.
Prediction results of GF-Prophet for product daily sales
Step 5. Comparative analysis.
Six extra experiments are conducted for each comparison model, then RMSE, MAE and MAPE are calculated to verify the performance of GF-Prophet for product daily sales prediction, as shown inTable 3.
Comparisons of RMSE, MAE, MAPE for product daily sales
It clearly that GF-Prophet and LSTM are closer to the actual trend, which are significantly superior to other classical methods. Compared with LSTM, which is one of the most popular model in recent years, GF-Prophet proposed in this paper can obtain clearer semantic and more interpretable prediction results at the expense of slight accuracy loss.
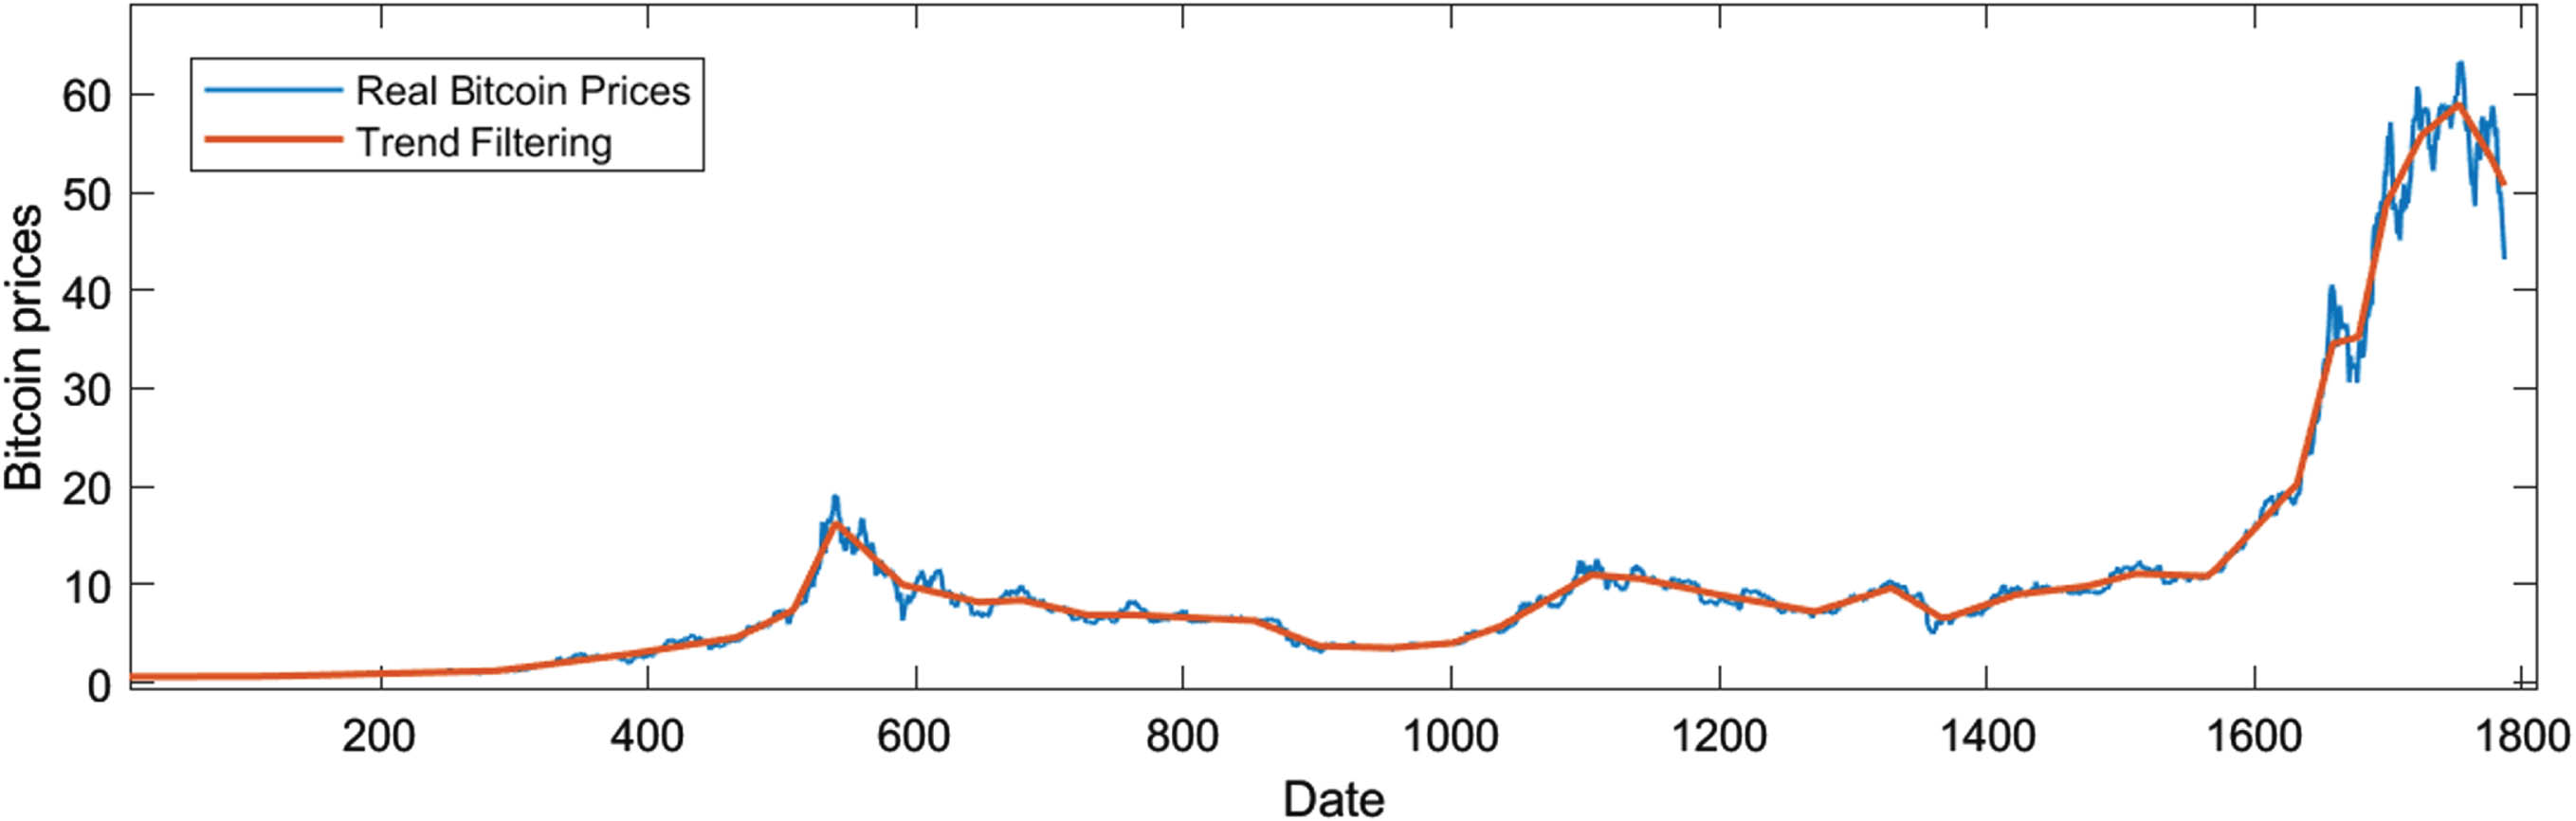
The ℓ1 trend filtering for Bitcoin prices.
Step 1. Changepoints identification and subsequences segmentation.
10 changepoints are identified by ℓ1 trend filtering with λ = 130.79 in time series Y2 = (y1, y2, ⋯ , y1135), as shown in Fig. 6.
Then 11 ordered non-overlapping subsequences {S1, S2, ⋯ , S11 } can be divided.
Step 2. Formation and modification of granule time series.
Definition 2.1 is used for each subsequence to form a granule time series Y
LG
= { LG1, LG2, ⋯ , LG11 }, then Algorithm 1 is used to get the modified granule time series
Step 3. Formation of trend-oriented datasets.
Four trend-oriented datasets extracted from
Step 4. Prediction based on trend-orienteddatasets
The first 1565 data in original time series serve as the train set, and the last 222 serve as the test set. Corresponding to the granule time series, the first 9 information granules are used to train the model, and the last 2 are used to verify the performance.
Prediction results of GF-Prophet is shown in Table 4, from which we can predict that Bitcoin price will increase at a rate of 0.301 for the first 158 days with a deviation of 4.239 in the future, then descend at a faster rate of 0.131 for the later 55 days with a deviation of 3.907.
Prediction results of GF-Prophet for Bitcoin prices
Step 5. Comparative analysis.
Six extra experiments are conducted for each comparison model, then RMSE, MAE and MAPE are calculated to verify the performance of GF-Prophet for Bitcoin prices prediction, as shown in Table 5.
Comparisons of RMSE, MAE, MAPE for Bitcoin prices
It clearly that for the dataset with trend mutation, GF-Prophet has significantly higher prediction accuracy. Meanwhile, due to the introduction of Gaussian fuzzy information granules, prediction results of GF-Prophet are user-oriented.
Step 1. Changepoints identification and subsequences segmentation.
ℓ1 trend filtering is used to identify 18 changepoints in time series Y3 = (y1, y2, ⋯ , y1135):
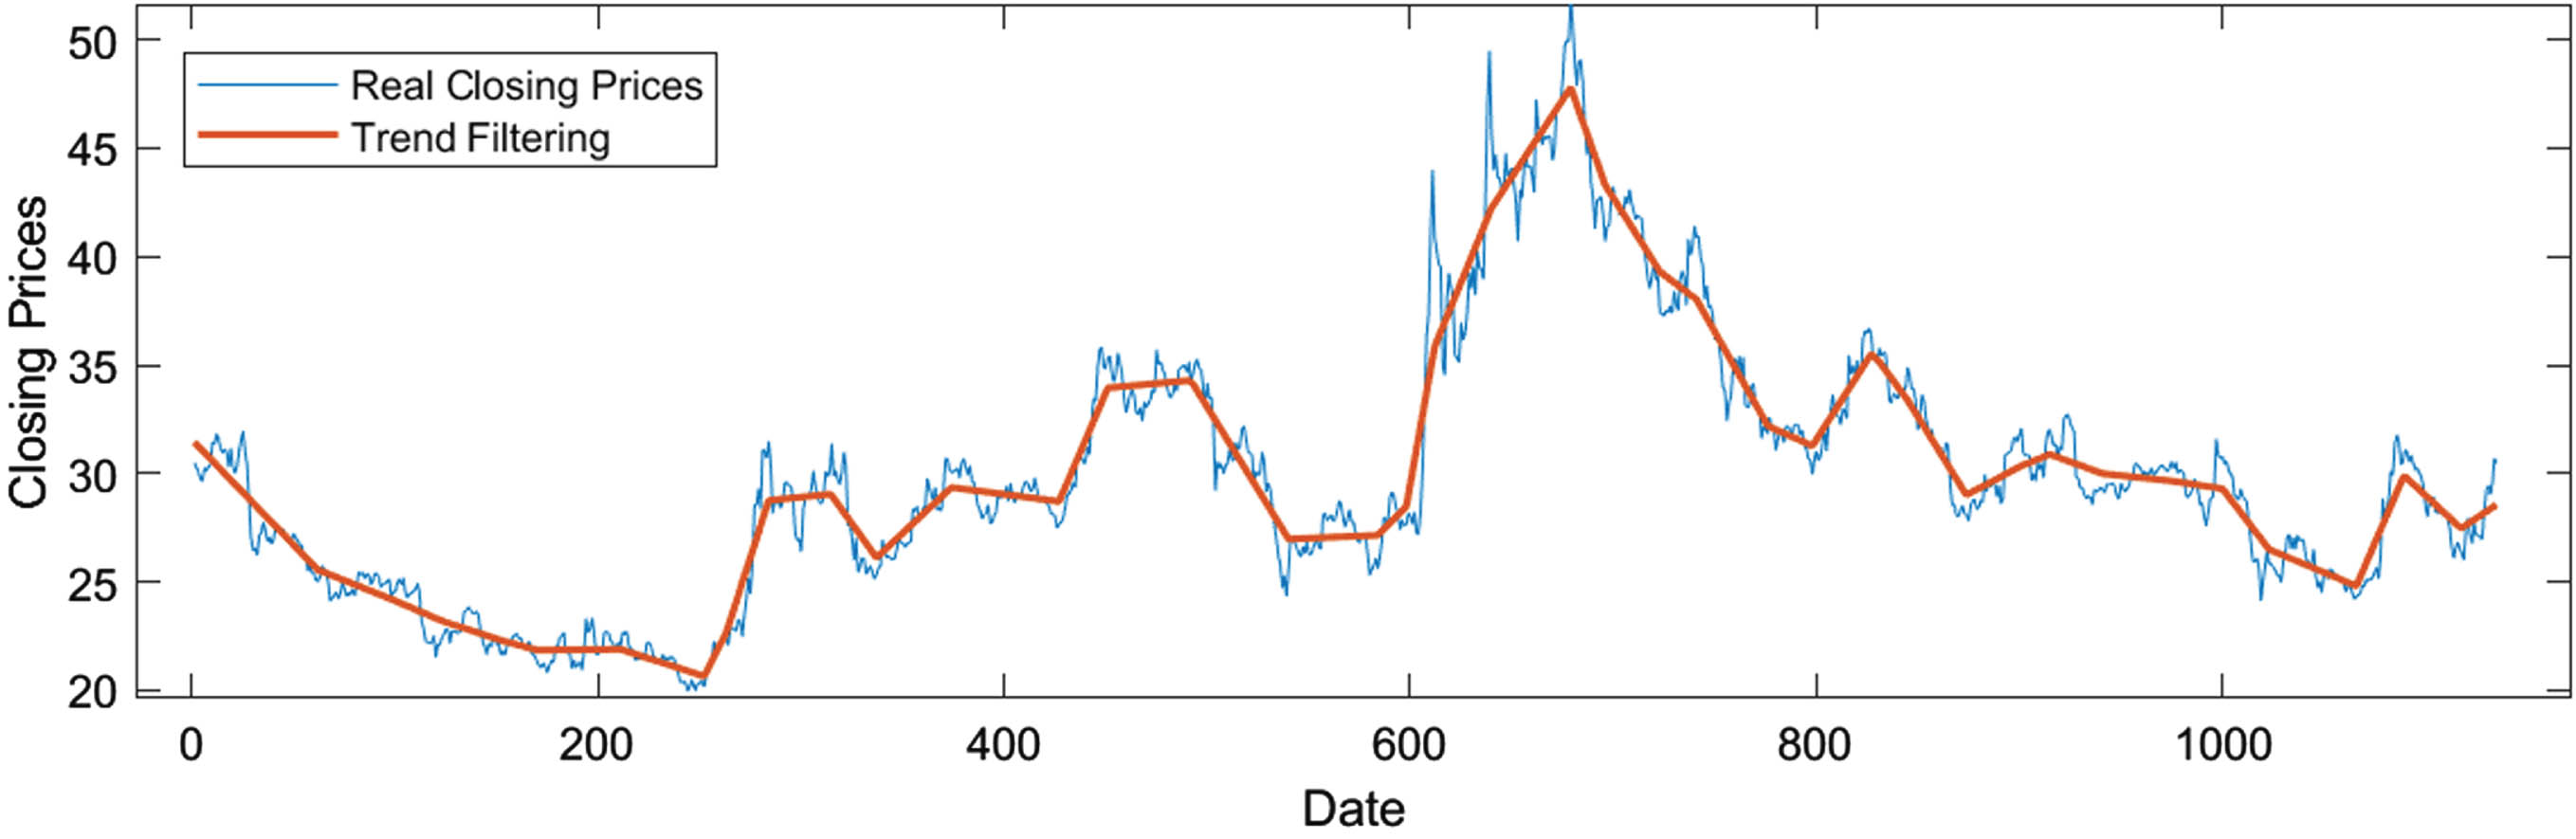
The ℓ1 trend filtering for China Life’s closing prices.
Step 2. Formation and modification of granule time series.
Gaussian linear fuzzy information granules are constructed for each subsequence to form an initial granule time series Y
LG
= {LG1, LG2, ⋯ , LG19}. Then Algorithm 1 is used to get the modified granule time series
Step 3. Formation of trend-oriented datasets.
The trend information is extracted from
Step 4. Prediction based on trend-oriented datasets
According to the ratio of roughly 8:2, the first 1000 data in original time series serve as the train set, and the last 135 serve as the test set. Corresponding to the granule time series, the first 15 information granules serve as the train set, and the last 4 serve as the test set.
Prediction result of GF-Prophet is shown in Table 6, from which we can predict that China Life’s closing prices will descend at a rate of 0.067 for the first 73 days with a deviation of 0.972, increase at a rate of 0.265 for the next 29 days with a deviation of 1.109, then descend at a rate of 0.049 for the next 27 days with a deviation of 0.721, and increase again at a rate of 0.076 for the later 38 days with a deviation of 0.968.
Prediction results of GF-Prophet for China Life’s closing prices
Step 5. Comparative analysis.
Six extra experiments are conducted for each comparison model, then RMSE, MAE and MAPE are calculated to verify the performance of GF-Prophet for China Life’s closing prices, as shown in Table 7.
Comparisons of RMSE, MAE, MAPE for China Life closing prices
In this case, GF-Prophet and LSTM are closer to actual trends, which are significantly superior to other classical methods. Compared with LSTM, GF-Prophet can obtain clearer semantic and more interpretable prediction results at the expense of slight accuracy loss.
Step 1. Changepoints identification and subsequences segmentation.
22 changepoints are identified by ℓ1 trend filtering with λ = 227.5 (see Fig. 8).
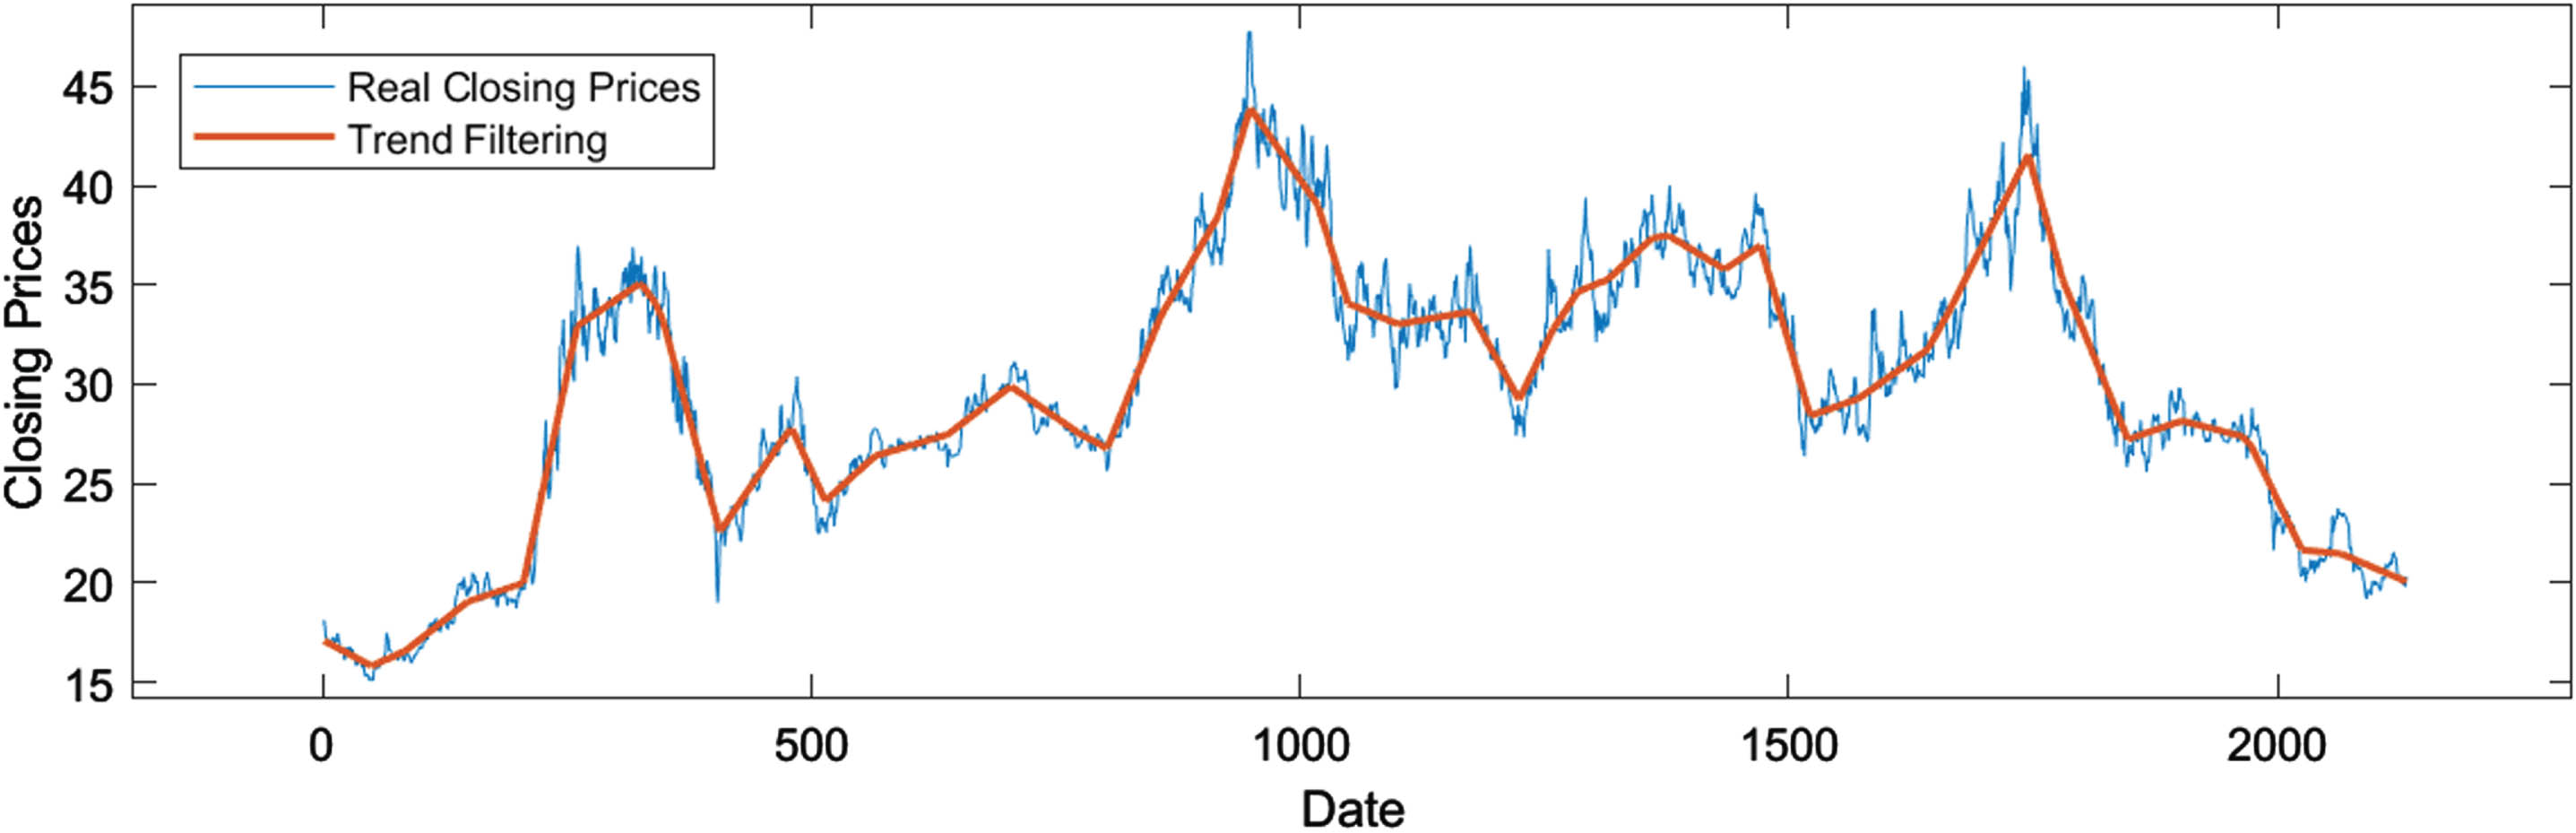
ℓ1 trend filtering for China Pacific Insurance closing prices.
Then the ordered non-overlapping subsequences {S1, S2, ⋯ , S23 } can be divided. Step 2. Formation and modification of granule time series.
Gaussian linear fuzzy information granules are constructed to form an initial granule time series Y
LG
= { LG1, LG2, ⋯ , LG23 }. Then, Algorithm 1 is used to merge LG14 and LG15 to form the modified granule time series
Step 3. Formation of trend-oriented datasets.
Four trend-oriented datasets extracted from the
Step 4. Prediction based on trend-oriented datasets
The first 1968 data in original time series serve as the train set, and the last 164 serve as the test set. Corresponding to the granule time series, the first 20 information granules are used to train the model, the last 2 are used to verify the performance.
Prediction results of GF-Prophet is shown in Table 8, from which we can predict that China Pacific Insurance (CPIC) closing prices will descend at a rate of 2.392 for the first 41 days with a deviation of 1.379, then descend at a gentler rate of 0.705 for the next 107 days with a deviation of 2.969.
Prediction of GF-Prophet for CPIC closing prices
Step 5. Comparative analysis
Six extra experiments are conducted for comparison models, then RMSE, MAE and MAPE are calculated to verify the performance of GF-Prophet for China Pacific Insurance closing prices, as shown in Table 9.
Comparisons of RMSE, MAE, MAPE for CPIC closing prices
It clearly that in this case, GF-Prophet has not only higher prediction accuracy, but also clearer semantics.
Step 1. Changepoints identification and subsequences segmentation.
19 changepoints are identified by ℓ1 trend filtering with λ = 175.16 (see Fig. 9).
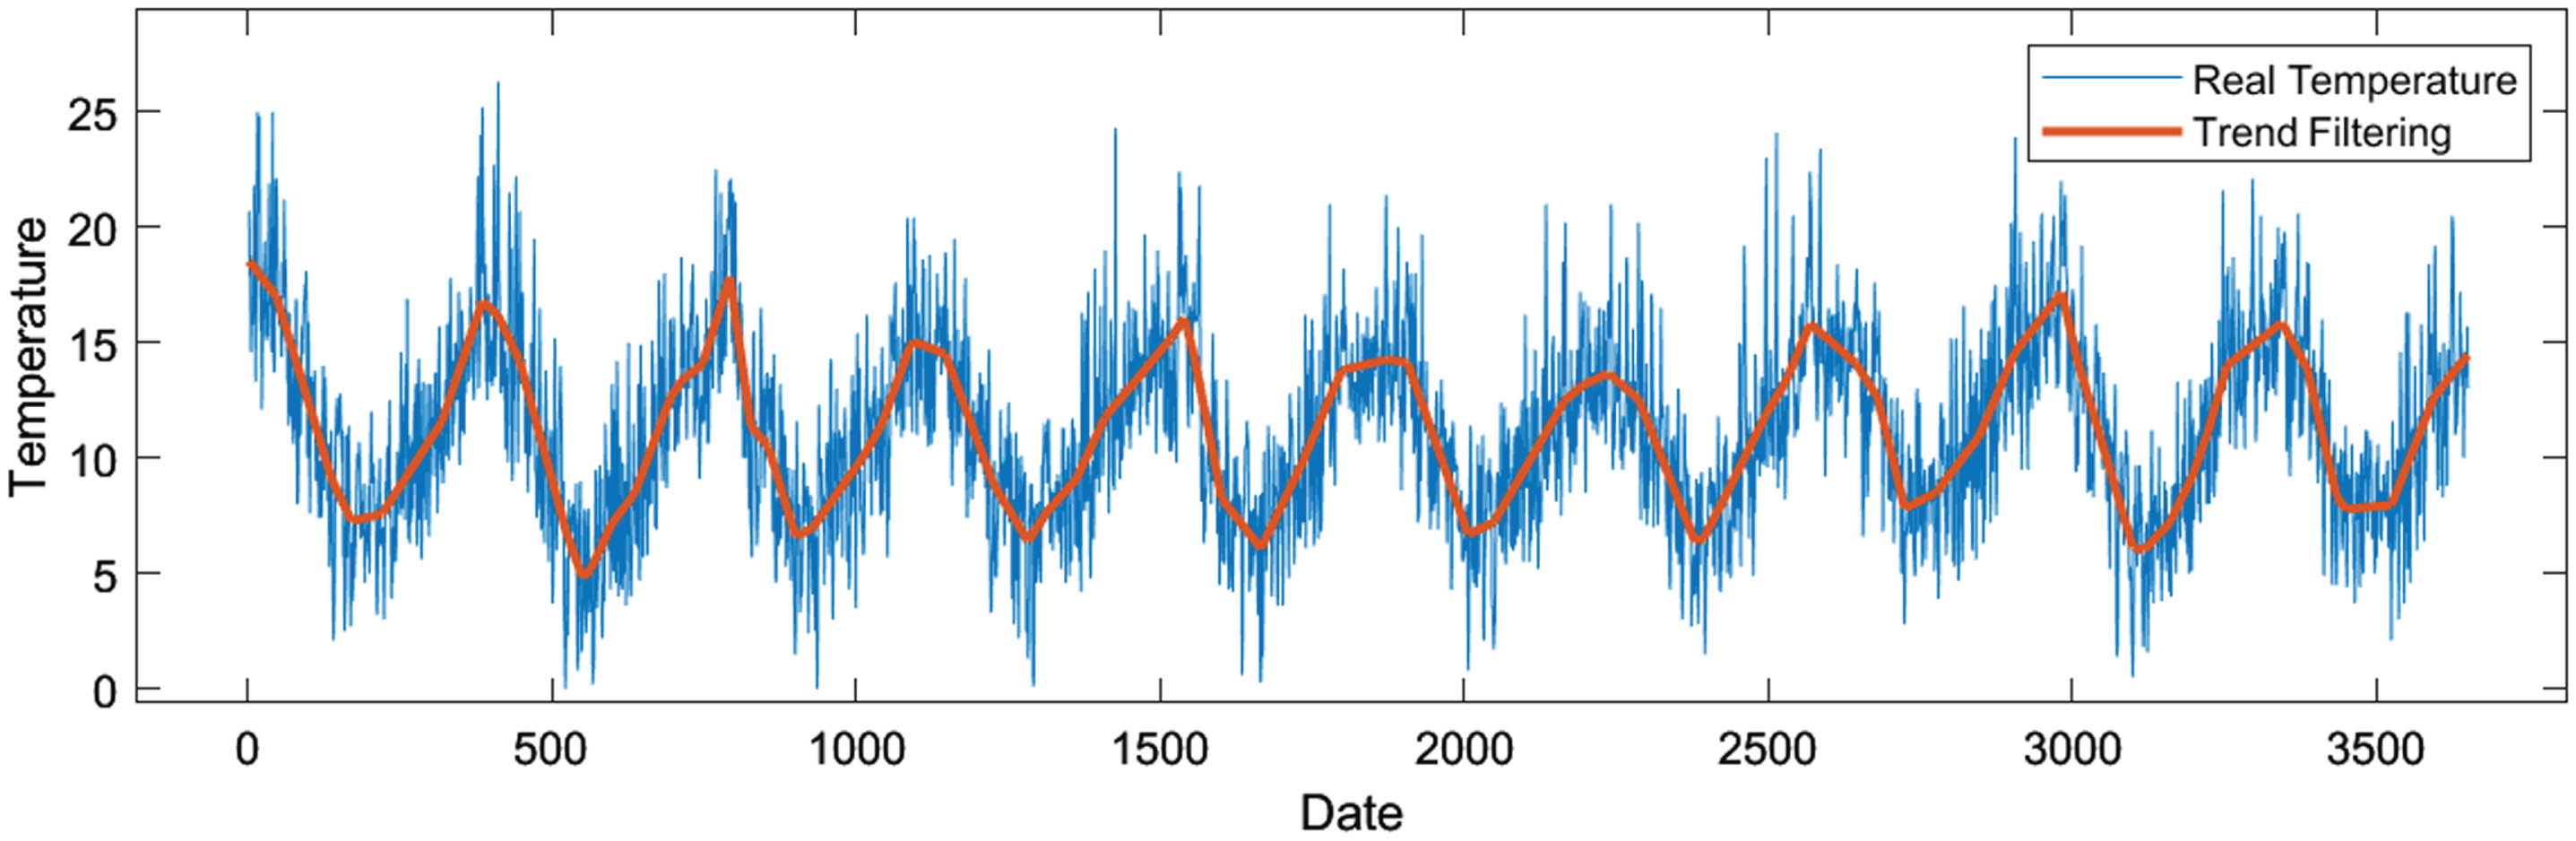
ℓ1 trend filtering for Melbourne daily minimum temperature.
Then the ordered non-overlapping subsequences {S1, S2, ⋯ , S20 } can be divided. Step 2. Formation and modification of granule time series.
Gaussian linear fuzzy information granules are constructed and Algorithm 1 is used to form a granule time series
Step 3. Formation of trend-oriented datasets.
Four trend-oriented datasets extracted from the
Step 4. Prediction based on trend-oriented datasets
The first 3489 data in original time series serve as the train set, and the last 161 serve as the test set. Corresponding to the granule time series, the first 19 information granules are used to train the model, the last 1 information granule is used to verify the performance.
Prediction result of GF-Prophet is shown in Table 10, from which we can predict that Melbourne daily minimum temperature will increase at a rate of 0.0056 for future 164 days with a deviation of 2.957.
Prediction of GF-Prophet for daily minimum temperature
Step 5. Comparative analysis of empirical results
Six extra experiments are conducted for each comparison model, then RMSE, MAE and MAPE are calculated to compare and verify the performance of GF-Prophet for Melbourne daily minimum temperature, as shown in Table 11.
Comparative analysis for Melbourne daily minimum temperature
In this case, GF-Prophet and LSTM are closer to the actual trend, which are significantly superior to other classical methods. Compared with LSTM, GF-Prophet obtains clearer semantic and more interpretable results at the expense of extremly slight accuracy loss.
Figure 10 is presented to visually show the prediction performance of seven models in five experiments under three performance indexes. It can be seen that LSTM and GF-Prophet have significantly lower prediction errors in all experiments. Compared with LSTM, GF-Prophet can not only realize prediction with the same or even higher accuracy, but also has clearer semantics and is easier for investors to understand.
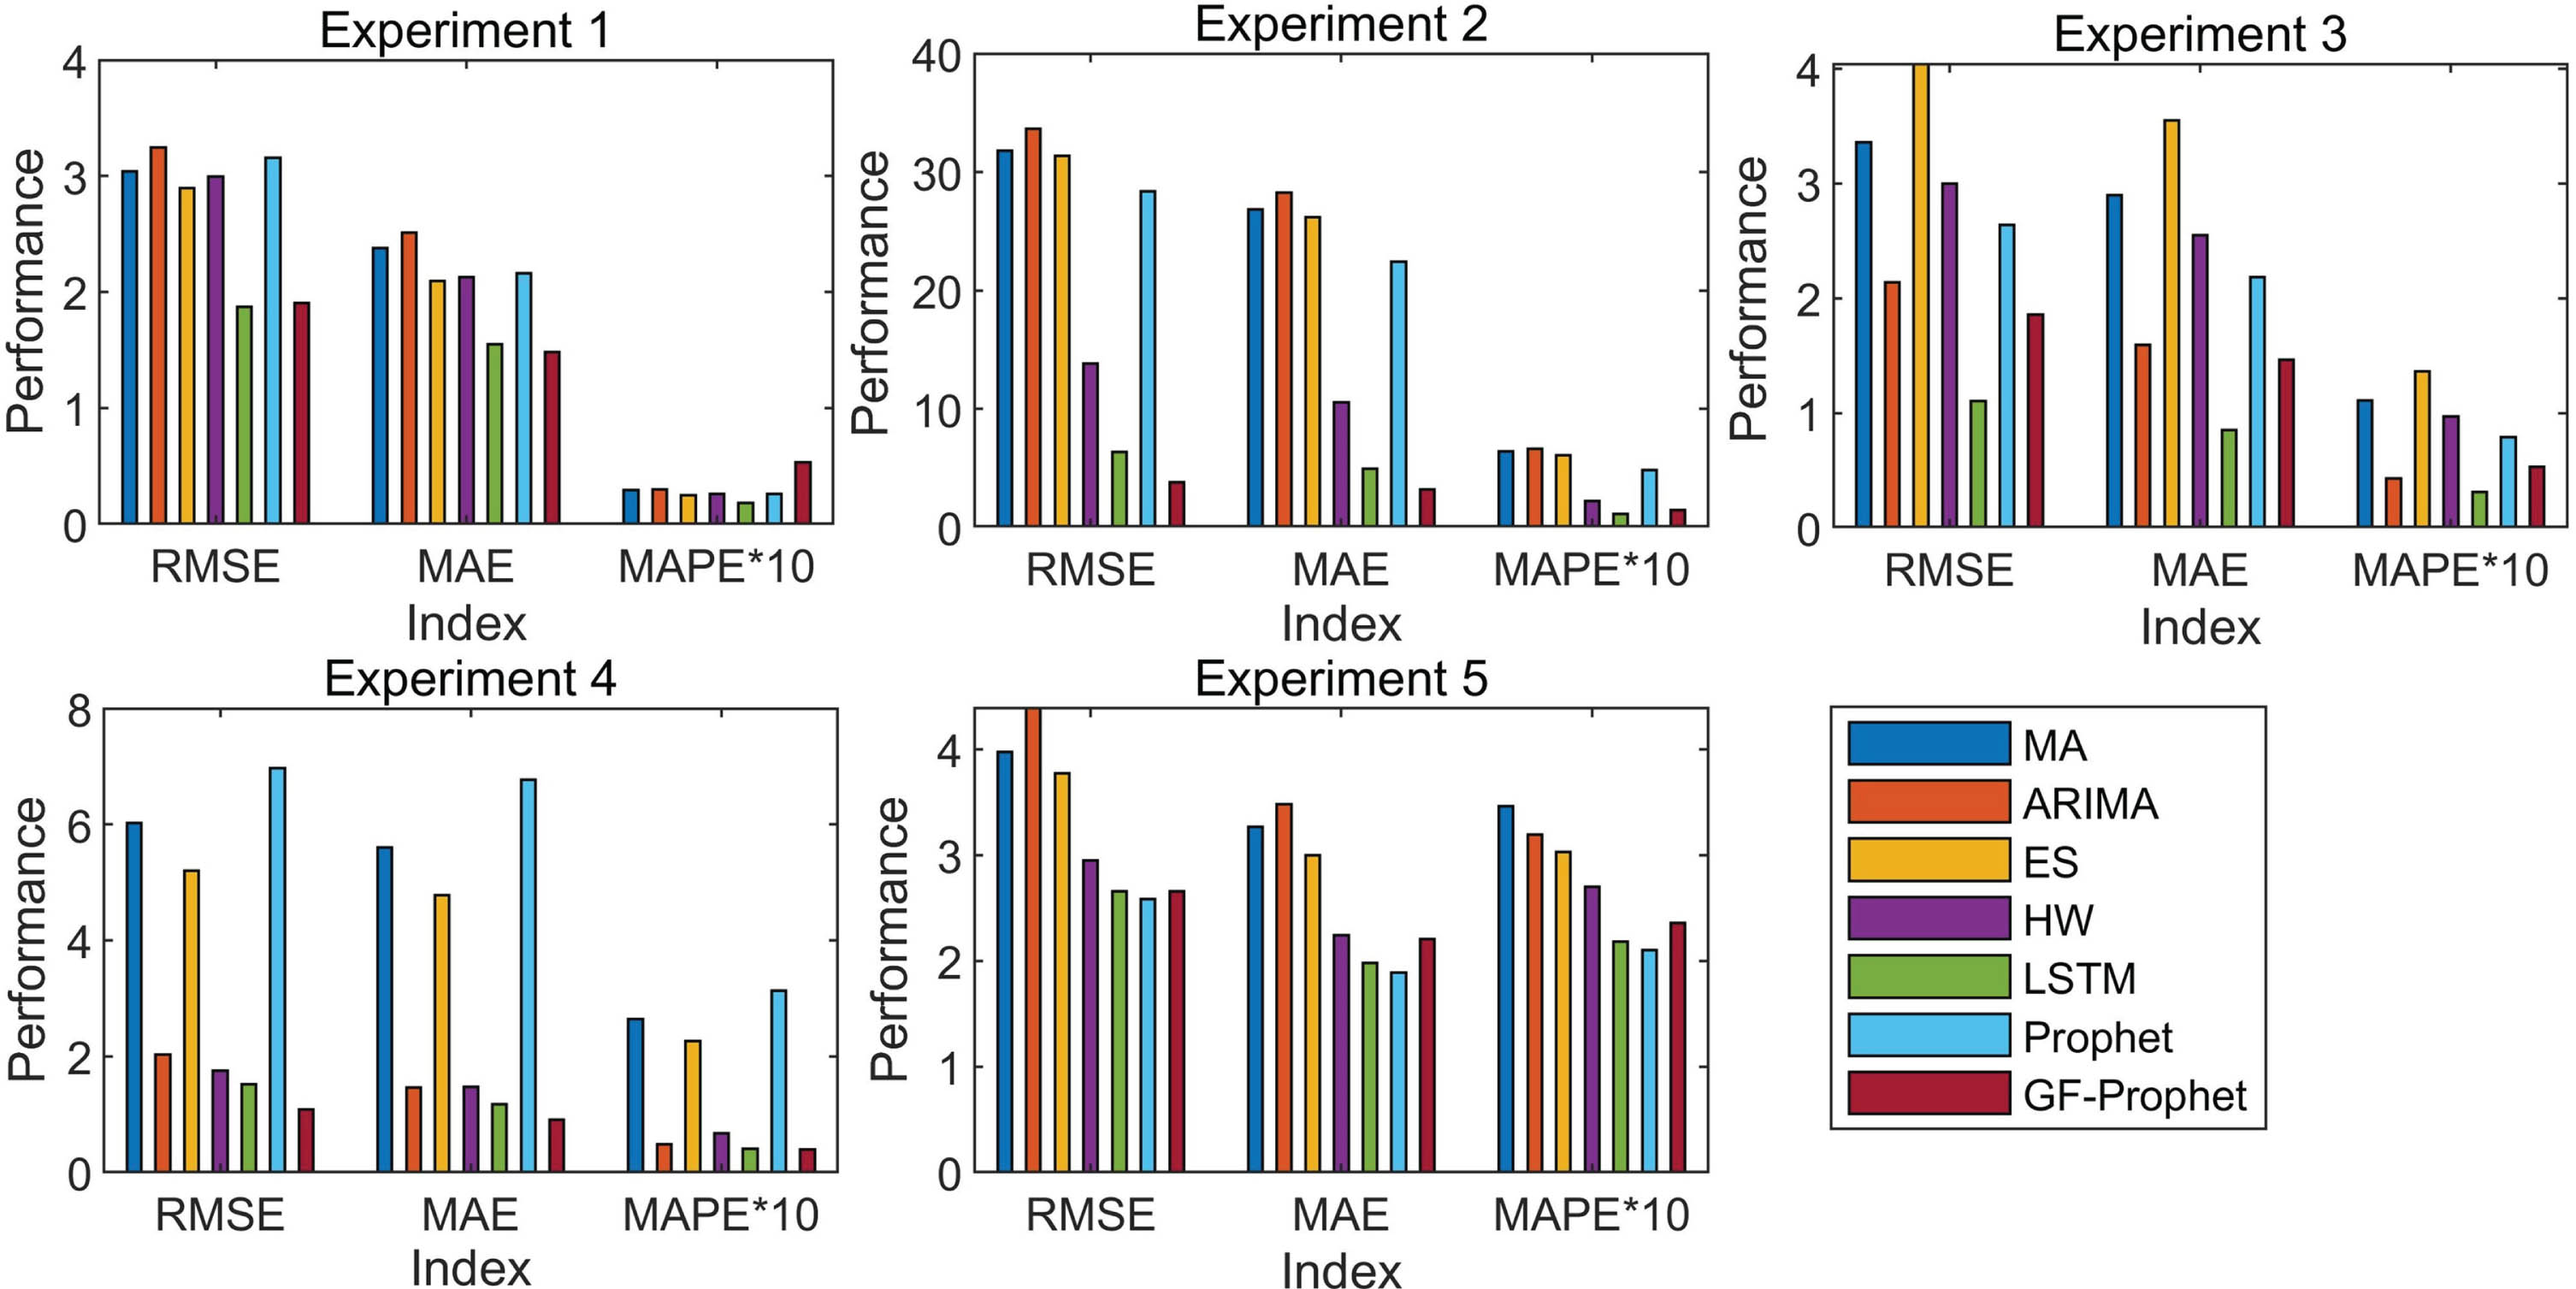
Comparisons of RMSE, MAE, MAPE for five experiments.
Conclusions can be drawn from the above several experiments:
(1) In terms of the prediction accuracy, GF-Prophet can not only accurately predict the direction and magnitude of the trend change of time series, but also accurately predict the time point when the trend will change significantly. Compared with LSTM, the prediction performance of GF-Prophet on datasets with relatively regular fluctuations or local regular fluctuations is slightly lost, and the loss gap is usually no more than 1. In datasets with trend mutation, GF-Prophet has significantly better prediction performance, and the semantics are clearer due to the introduction of Gaussian fuzzy informationgranules.
(2) In terms of the interpretability of prediction results, GF-Prophet can clearly give how long the trend will last, either can it give the time point at which the trend will change significantly. Such prediction results can provide investors with more accurate information to make decisions and have higher practical value.
In this paper, a novel Prophet model based on Gaussian linear fuzzy approximate representation (GF-Prophet) is proposed. By transforming the original time series into granule time series containing several Gaussian fuzzy information granules, the prediction is achieved at granule level rather than numerical level, which not only reduces cumulative errors significantly, but also makes prediction results more comprehensible. Then, a granulation modification algorithm is proposed to merge adjacent information granules with no significant difference, which can avoid incorrect trend extraction.
Several comparative experiments are conducted in empirical analysis. The results show that GF-Prophet can capture the abrupt trend of time series well, and has a good performance in the long-term prediction. In addition, the introduction of fuzzy information granules significantly improves the interpretability and comprehensibility of prediction results, which is an advantage difficult to quantify, and solves the common problems of machine learning models such as low interpretability and semantic ambiguity.
In terms of practical applications, investors usually predict first and make decisions later. The model proposed in this paper is the first combination of Prophet model and fuzzy information granules, and is essentially a univariate time series prediction model, which can be used as a part of decision-making systems to provide reference for investors’ decision. If used alone for decision-making, information carried by other significant indicators may be omitted, resulting in inaccurate conclusions. This is because optimal portfolio selections usually involve a lot of realistic factors, such as investors’ risk appetite, economic strength, national policies and so on. In the future, we will introduce additional variable selection techniques and further construct an integrated model composed of several GF-Prophet models for multivariate time series prediction. In addition, extending the GF-Prophet model into a sound investment system motivates us to pursue further studies.