
Abstract
In the expansive domain of data-driven research, the curse of dimensionality poses challenges such as increased computational complexity, noise sensitivity, and the risk of overfitting models. Dimensionality reduction is vital to handle high-dimensional datasets effectively. The pilot study disease dataset (PSD) with 53 features contains patients with Rheumatoid Arthritis (RA) and Osteoarthritis (OA). Our work aims to reduce the dimension of the features in the PSD dataset, identify a suitable feature selection technique for the reduced-dimensional dataset, analyze an appropriate Machine Learning (ML) model, select significant features to predict the RA and OA disease and reveal significant features that predict the arthritis disease. The proposed study, Progressive Feature Reduction with Varied Missing Data (PFRVMD), was employed to reduce the dimension of features by using PCA loading scores in the random value imputed PSD dataset. Subsequently, notable feature selection methods, such as backward feature selection, the Boruta algorithm, the extra tree classifier, and forward feature selection, were implemented on the reduced-dimensional feature set. The significant features/biomarkers are obtained from the best feature selection technique. ML models such as the K-Nearest Neighbour Classifier (KNNC), Linear Discriminant Analysis (LDA), Logistic Regression (LR), Naïve Bayes Classifier (NBC), Random Forest Classifier (RFC) and Support Vector Classifier (SVC) are used to determine the best feature selection method. The results indicated that the Extra Tree Classifier (ETC) is the promising feature selection method for the PSD dataset because the significant features obtained from ETC depicted the highest accuracy on SVC.
Keywords
Introduction
Autoimmune diseases, a major immune system disorder, can result from chronic, systemic destruction of innate immunity to auto-antigens [1]. Recent global increases in autoimmune diseases are primarily attributed to host genome, infections, environment, drugs, and antigenic events, as identified by research [2].
The pattern of destruction of the bones and joints defines a chronic autoimmune joint disease known as Rheumatoid Arthritis (RA) [3]. RA, a complex disease influenced by genetics and environment, increases mortality risk. Its prevalence and severity vary based on population and definition [4].
Autoimmune disorders, including RA, Crohn’s disease, Type 1 diabetes, multiple sclerosis, lupus, and psoriasis, affect 4% of the global population [5, 6]. The National Institute of Health (NIH) and Health and Human Services (HHS) recognize autoimmunity as a significant health issue for women, ranking as the ninth leading cause of death for those aged 15–64 and the fourth most common cause of disability in the US [7, 8]. Women are three times more likely to develop autoimmune diseases than men. In India, autoimmunity is a major cause of mortality and chronic disease for both genders across nearly all age groups.
Vitamin D deficiency is increasingly linked to the etiology and pathogenesis of RA, which is associated with early mortality due to chronic inflammation’s adverse effects on cardiovascular function [9, 10]. Environmental factors likely trigger RA in genetically predisposed individuals, leading to immune dysfunction and autoimmunity [11, 12].
The primary objective is to reduce the PSD dataset dimensionality by identifying relevant variables and creating a concise dataset. Secondly, to identify best features for diagnosing RA and OA patients using suitable feature selection method. Thirdly, utilize different feature selection algorithms to select optimal features. Finally, assess best features for each feature selection technique using ML algorithms and determine optimal ML algorithm for accurate RA and OA prediction and diagnosis.
The goal is to develop a predictive model to accurately diagnose RA and OA patients using PSD data. Employ machine learning algorithms for dimensionality reduction, feature selection, and predictive model building. Identify best features, feature selection algorithm, and ML algorithm for easy RA and OA prediction and diagnosis. In machine learning, features are variables describing data; in medical terms, independent features are biomarkers in disease datasets. Identifying best features implies finding significant biomarkers in disease datasets.
The remainder of our study is structured as follows: A literature review on imputation methods, dimensionality reduction with PCA, an Extra Tree classifier used as a classifier, and feature selection are emphasized in Section 2. The methodology of the proposed work, with its detailed explanation, is described in Section 3. This section also contains the PSD dataset description and brief content on the machine learning classifier and feature selection applied to it. Section 4 explains the experimental results and discussion obtained before and after using different feature selection methods. Section 5 presents a conclusion highlighting significant biomarkers discovered in the PSD dataset.
Related work
The first literature review explores imputation techniques for handling missing data in clinical research [13]. Selecting an appropriate imputation method is crucial to maintain accuracy in machine learning-based decision-making. The authors applied imputation before executing ML algorithms. In [14], the author examines missing value imputation (MVI) concerning its methods and evaluation schemes. The author examined selected studies from the decade, which show various issues in the literature, and suggests K-Nearest Neighbors (KNN), Random Forest (RF), Support Vector Machine (SVM), BPCA (Bayesian Principal Component Analysis), and Decision Tree (DT) are the top five indirect MVI assessment ML models.
In [15], researchers used Eptesicus fiscus used restriction site-associated DNA sequencing (RADseq) to simulate various demographic models with different percentages of missing data (1%, 10%, 20%) in Eptesicus fiscus. Non-random missing data can distort PCA results in non-model systems due to varying sample quality. High dimensional data affects ML algorithms’ learning, complexity, and accuracy [16]. Reducing dimensionality is a trending research topic to provide reliable, adaptable, and accurate computational tools. PCA is a popular feature extraction technique, with optimized PCA showing better accuracy, time, and space complexity.
Preprocessing generates complete data copies for statistical analysis [17]. Extra Tree Classifier (ETC), DT, and RF classified emails as ham or spam [18]. Metaheuristic feature selection such as particle swarm optimization (PSO), Binary PSO (BPSO), and genetic algorithm identified relevant features. BPSO with ETC achieved the highest accuracy.
In [19], ETC and SVM were combined to predict breast cancer. ETC discovered relevant attributes and ML algorithms such as Logistic Regression (LR), SVM, Multi-Layer Perceptron (MLP), DT, KNN, RF, Naive Bayes (NB), Extreme Gradient Boosting (XGBoost) and Adaptive Boosting (AdaBoost) were implemented using 10-fold stratified cross-validation. SVM with ETC feature selection achieved the highest accuracy. In [20], Parkinson’s disease detection used Boruta, RFE, and RF for feature selection and gradient boosting, XGBoost, bagging, and extra tree classification for prediction. Bagging with RFE outperformed other methods, accurately diagnosing Parkinson’s in 82.35% of cases.
The Kaggle PCOS dataset was evaluated using ensemble classifiers RF, Extra Tree, Adaptive Boosting (AdaBoost) and feature selection techniques such as Chi-square, Pearson, RF, Lasso Regression, sequential forward and backward selection [21]. Feature selection improved ML model accuracy, with Ensemble RF achieving the highest accuracy and sensitivity.
The Cleveland Heart dataset (UCI database) 115 cases, 72 variables were used to predict heart disease using NB, RFs, Extra Trees, and LR classifiers. LASSO and Ridge Regression feature selection significantly improved accuracy, with Lasso outperforming Ridge by 33.3% versus 30.73% [22].
In [23], white blood cells from three datasets were classified into four subtypes using transfer learning with ResNet50, DenseNet121, MobileNetv2, Inceptionv3, and Xception models. Extra trees classifier selected important features at an intermediate stage. Multi-class SVM classified ResNet50 features with 90.76% accuracy based on recall, precision, F-measure, and accuracy metrics.
In [24], Extra Tree SVM-RBF (ET-SVMRBF) was proposed for diagnosing coronary artery disease (CAD). Synthetic Minority Oversampling addressed class imbalance. SVM-Linear, K-NN (K-Nearest Neighbor), XGBoost, and SVM-Radial Basis Function were the main methods. Extra Tree selected relevant features, and GridSearch optimized hyperparameters. ET-SVMRBF achieved 95.16% accuracy.
In [25], ensemble methods such as Bagging, AdaBoost, and Gradient Boosting were applied to Radius Neighbors Classifier (RNC), Bernoulli Naïve Bayesian (BNB), Gaussian Naïve Bayesian (NB), Extra Tree Classifier (ETC), Passive aggressive classifier (PAC), and Linear Discriminant Analysis (LDA) classifiers, and feature importance was used for attribute selection. Experiments on UCI Skin Disease Center data (34 features, 366 cases) showed Gradient Boosting with RNC and feature importance achieved the highest precision of 99.68%.
Methodology
The proposed research framework (in Fig. 1) involves Feature Engineering techniques (imputation, oversampling, feature scaling) on the PSD dataset, a retrospective dataset with missing values. Random value imputer [26], used in real-time datasets [27], handles missing data. Oversampling addresses target variable imbalance, and feature scaling normalizes the dataset. PFRVMD (Progressive Feature Reduction with Varied Missing Data) reduces feature dimensionality by splitting the imputed PSD dataset into four scenarios based on missing value percentages (0–70%, 0–60%, 0–50%, all variables). PCA [28] extracts essential features for each scenario using PCA loading score [29], resulting in the best half of the features per scenario.
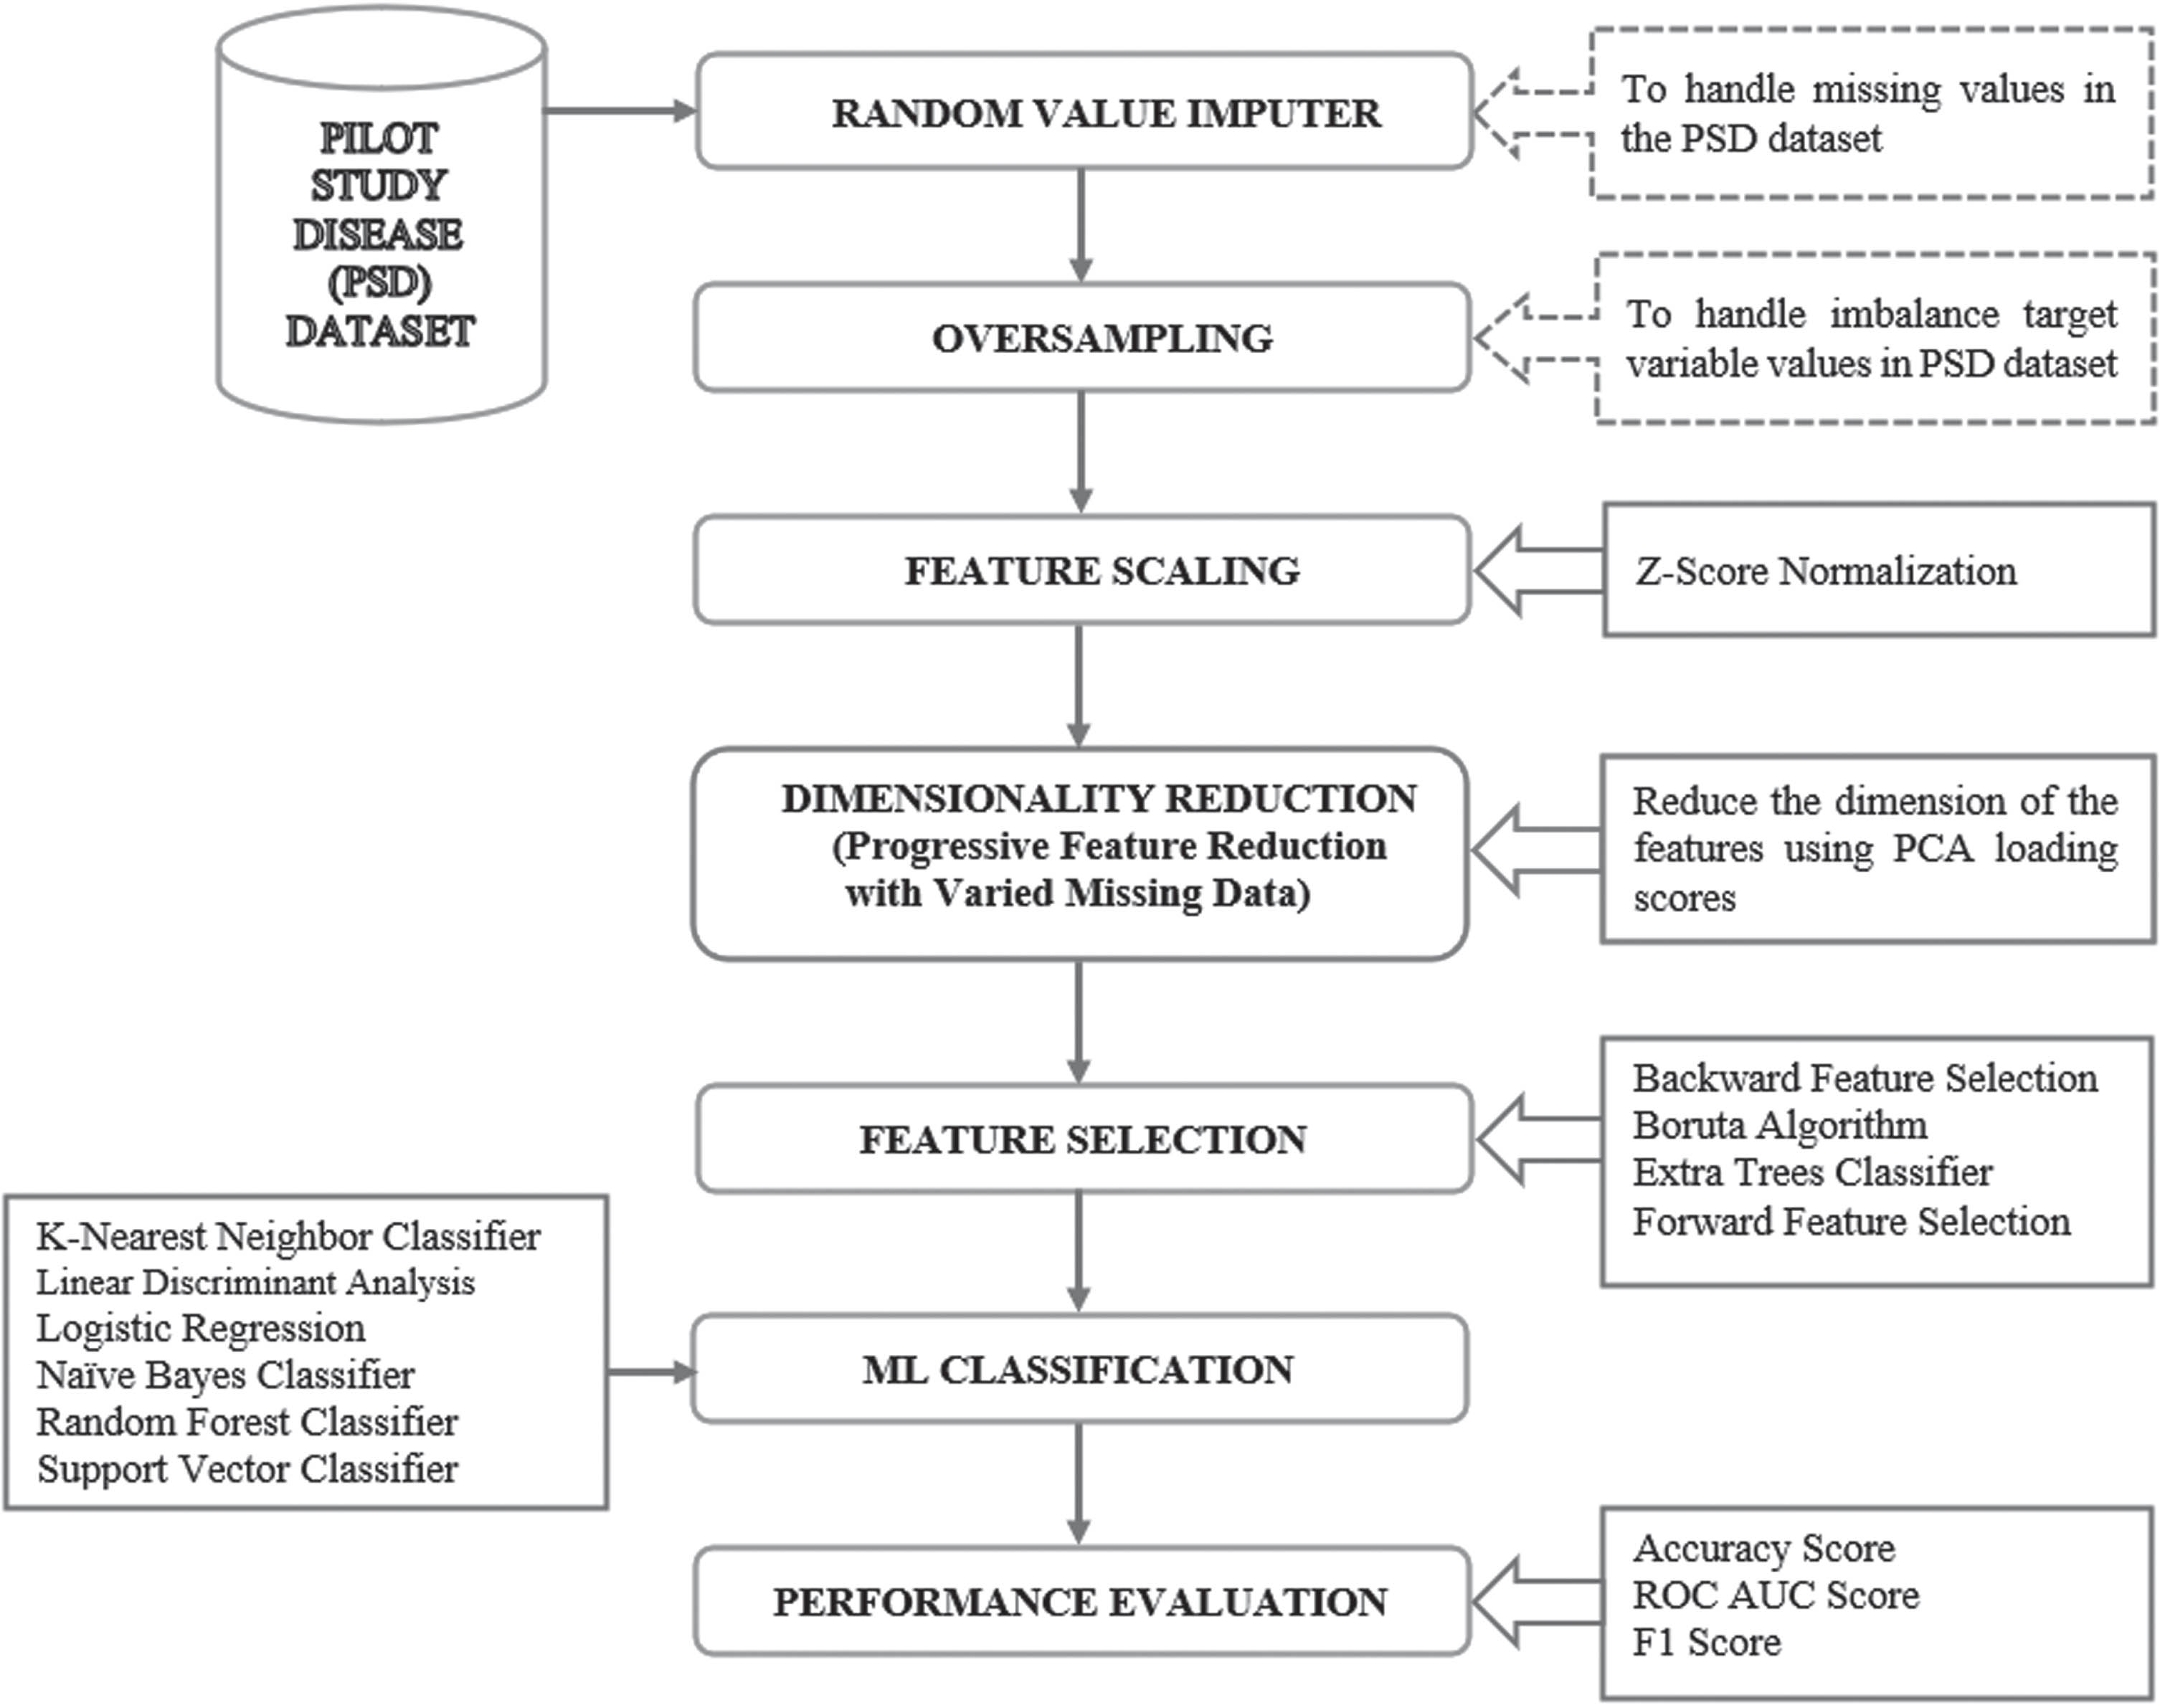
The overall framework of the proposed research
The set Union (∪) operation combines each scenario’s best half features, ultimately achieving the reduced-dimensional feature set. The reduced-dimensional feature set contains relevant PSD dataset features. This progressive approach achieves dimensionality reduction by removing irrelevant features, followed by feature selection. Various feature selection techniques, such as backward feature selection (BFS) [21], the Boruta algorithm (BoA) [30], ETC [31], and forward feature selection (FFS) [20], were applied to the reduced-dimensional feature set.
Feature selection techniques provide lists of significant features. The best technique is determined by executing these features through supervised ML models such as KNNC [32], LDA [33], LR [34], NBC [35], RFC [31], and SVC [36]. Models are assessed using accuracy, F1 score, and ROC AUC score. Results show ETC optimally selects important PSD dataset features when applied to SVC.
The PSD dataset comprises 16 RA patients (experimental group) and 9 OA patients (control group). With conditional approval from the ethical committee, 25 patient records were collected from Apollo Reach Hospital, Karaikudi, for the pilot study. This research aims to identify significant biomarkers, and predict, and diagnose RA and OA patients. Tables 1 and 2 show the independent variables with their clinical category and index in the PSD dataset, respectively.
Independent features on the PSD dataset with their clinical category
Independent features on the PSD dataset with their clinical category
PSD dataset features and its corresponding index
Demographic data is the patient details like gender and age. History explains the previous diseases. General examination is specific to the patient’s temperature, pulse, and blood pressure. Biochemistry is the chemicals measured in blood, plasma, or urine samples that are compared to healthy individuals. Increases or decreases can identify diseases [37]. Rheumatoid factor (RAF), erythrocyte sedimentation rate (ESR), and C-reactive protein (CRP) [38] are eminent RA biomarkers Coagulation evaluates thrombin deficiency affecting blood clotting. Haematology essential for diagnosing autoimmune diseases affecting the blood. Urine Macroscopic Examination Urine appearance, specific gravity, and potential of hydrogen are selected for diagnosing diseases.
Table 3 displays the proportion of missing values determined in the pilot study disease dataset. The results showed that over 4 % to 76% of data had missing values in the feature. It indicates that the current PSD dataset is relatively incomplete and unreliable for the study. Accordingly, the imputation technique was enforced to convert the incomplete PSD dataset to a complete dataset. Utilizing a Random Value Imputer, the PSD dataset is imputed based on the degree of proximity [26]. After imputation, the PSD dataset was sufficiently comprehensive and acceptable for the research.
Percentage of missing values in the PSD dataset features
Percentage of missing values in the PSD dataset features
The PSD dataset has an imbalanced classification for the target variable, ‘Diagnosis,’ namely RA (1) and non-RA (0) (Osteoarthritis), with 64% and 36%. Oversampling is fulfilled to reduce the overfitting and underfitting problems. In oversampling, the minority class would resample itself to have the exact count as the majority class [39]. Before oversampling, the ‘Diagnosis’ had two distinct values, ‘osteoarthritis’ and ‘rheumatoid arthritis,’ with counts of 9 and 16. Oversampling increased the minority class count from 9 to 16. As a result, 32 samples were used in the proposed study.
Feature scaling
Feature scaling, a preprocessing method in ML and data analysis standardizes the range of independent variables or features within the dataset. The PSD dataset contains both discrete and continuous features. Normalization is necessary before performing PCA to scale down the feature values between 0 and 1. Gender, Age, HODM, HOH, HOCAD, HOA, SysBP, DiaBP, Pulse, AlPh, ALT, AST, Cl, Chol, Glu, HDLC, LDLC, Na, Trigly, BT, CT, Neu, Lym, Eosin, Mono, PCV, PC, RDW, MCV, MCH, MCHC, and ESR are the discrete features in the PSD dataset.
The Z-Score normalization Z = (X - μ)/σ is implemented in the PSD dataset by importing StandardScaler from sklearn.preprocessing in Python. Where X are the input values of each feature, μ is the mean, and σ is the standard deviation of the input values of each feature.
Progressive feature reduction with varied missing data
Dimensionality reduction
Insufficient training samples and limited computational resources can lead to model overfitting by incorrectly learning relevant and redundant features, known as the curse of dimensionality. High-dimensional datasets make learning less efficient and more time-consuming. Feature reduction techniques, like dimensionality reduction, can address this challenge [27].
PCA, an unsupervised learning algorithm, transforms record samples into orthogonal principal components [41]. While PCA doesn’t directly select important features, it identifies and emphasizes them by transforming the original feature space. PCA loading scores, the coefficients used to construct principal components, signify the correlation between variables and principal components. Those are crucial for feature selection within PCA, helping identify important features, remove redundancy, and ensure feature independence [28, 41].
Random value imputation (RVI) substitutes missing data with available values from the same feature. However, RVI may not accurately represent true underlying patterns and can alter statistical properties like means, variances, and correlations. The PFRVMD approach addresses these limitations. The PSD dataset has Missing Completely at Random (MCAR) missingness [26]. Although RVI with > 5% missing values does not modify data variance or distribution [42], the PSD dataset has features with 4–76% missing values. Despite its implementation, RVI has the following limitations: The original value of the missing data may be the minimum value. When using random value imputation, the missing value can be filled using the maximum value of the respective feature, causing significant distortion and potentially impacting predictions for the target variable. Conversely, if the original missing value is the maximum value, random imputation may assign the minimum value of the feature, leading to potential misinterpretations that can affect predictive modelling. Random value imputation introduces the probability of estimation bias, impacting the calculation of confidence intervals. It is a critical concern for researchers relying on accurate estimates. Using random value imputation tends to skew the probability towards available values, potentially affecting the integrity of the dataset. Instead of using the whole RVI imputed data for dimensionality reduction, it is divided into four scenarios to respond to these challenges.
The PFRVMD approach addresses RVI limitations by dividing the imputed data into four scenarios based on the percentage of missing values in independent variables: 0–70%, 0–60%, 0–50%, and all variables. PCA is applied to each scenario to identify essential features using loading scores. Figure 2 shows the input and output features for each scenario before and after PCA and loadings.
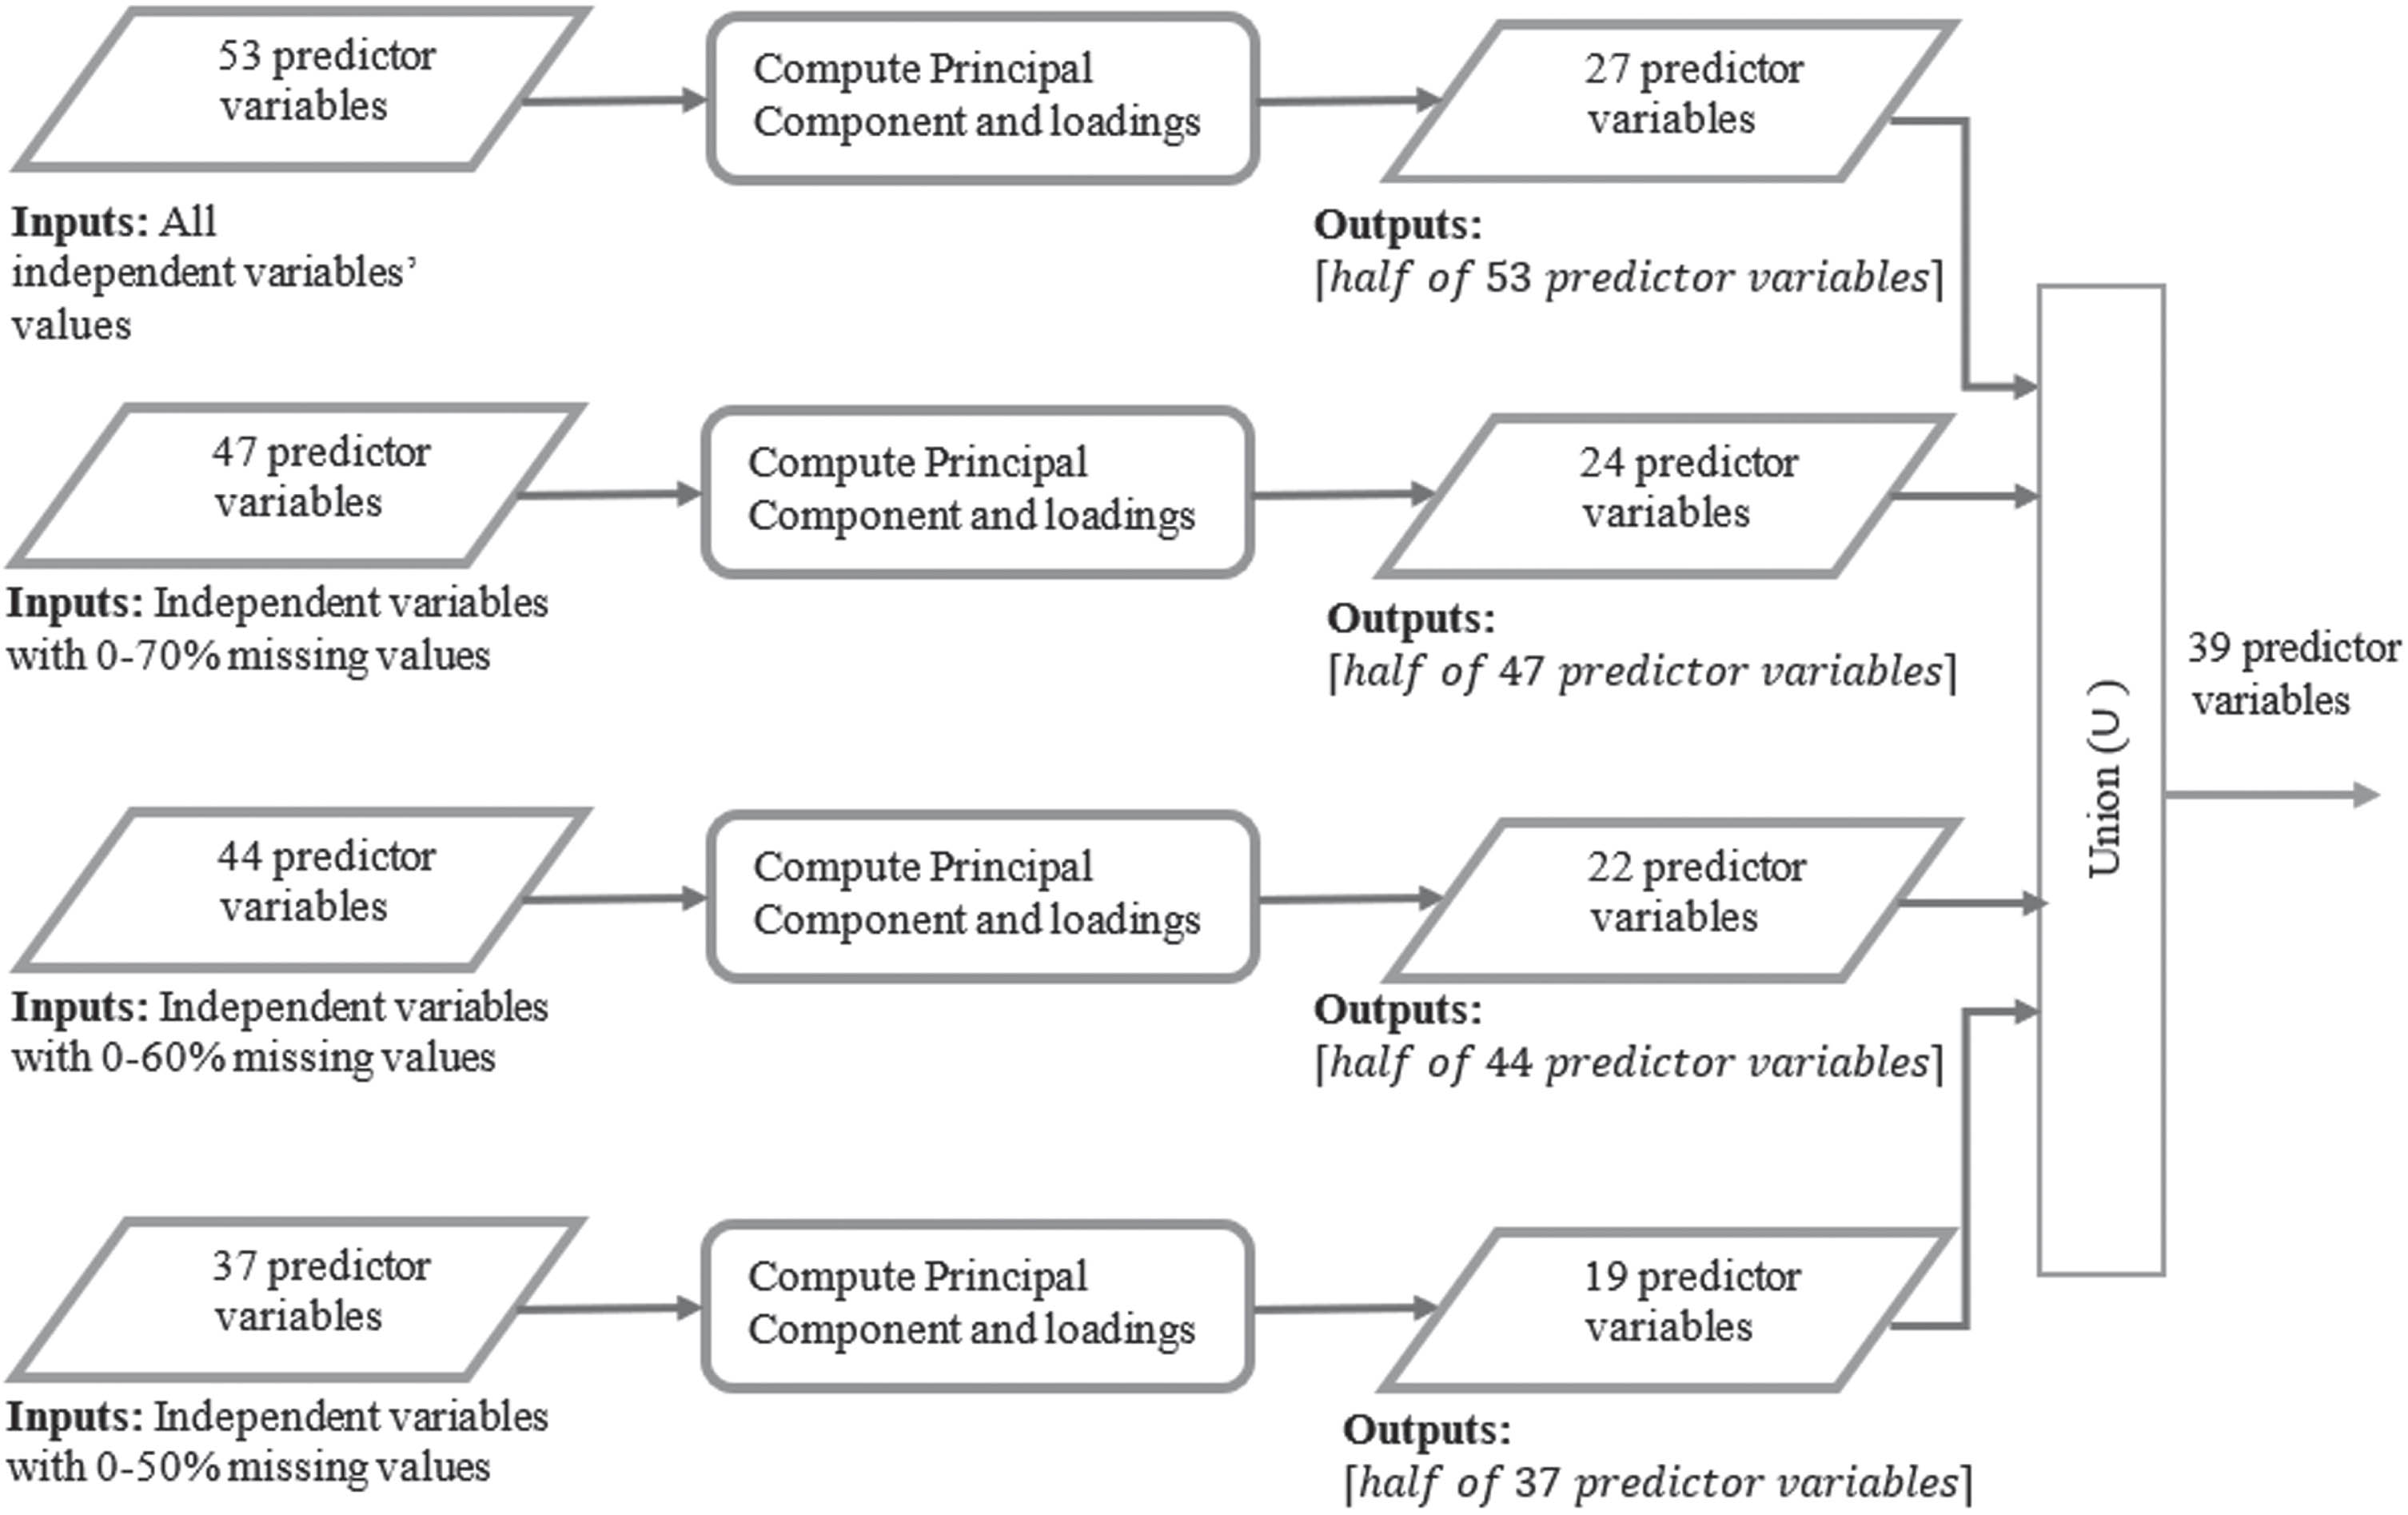
Proposed Model on Progressive Feature Reduction with Varied Missing Data (PFRVMD).
For each scenario, PCA is executed to identify the essential features using PCA loading score, and the outputs are the best half of the significant features of each scenario. The first PCA component loading score in each scenario is used to identify the best half of the important variables, as shown in Table 5. Finally, the Union (∪) operation combines each scenario’s best half features, ultimately achieving the reduced-dimensional feature set. The reduced-dimensional feature set contains the relevant features in the PSD dataset. This progressive approach accomplishes dimensional reduction on the PSD dataset by removing irrelevant features.
Loading Scores [28] for Predictor Variables in Four Scenarios
Performance Evaluation using ML Algorithms for different feature selection techniques
Feature selection
Feature selection constitutes a vital stage in the data science life cycle, focusing on acquiring a subset of pertinent features for model training [43]. In feature selection, given an initial set of features, where F ={ X1, X2, X3, …, X
n
},
With the main goal of improving classification accuracy, feature selection involves choosing the relevant attributes and discarding those irrelevant or redundant [44]. There are three categories of feature selection: filter methods, wrapper methods, and embedded methods. The wrapper and embedded methods are used to select features for the PSD dataset. Three feature selections are performed using the wrapper method: Backward feature selection, Boruta Algorithm, and Forward feature selection. Additionally, a single feature selection from the embedded method, called ETC, is implemented in the proposed work.
Wrapper method
Backward feature selection starts with the complete feature set and iteratively removes features that provide the smallest improvement or impact on accuracy, while maintaining ML model metrics. Boruta Algorithm (BoA), an RF-based feature selection method, iteratively removes statistically less relevant features by comparing real feature Z-scores to randomized shadow feature Z-scores, resulting in a stable selection of important and unimportant attributes [45]. Forward feature selection adds features one by one to an empty set until model metrics are no longer affected, stopping when no significant improvement is observed. Correlation analysis can also identify relevant features.
Embedded method
Extra Tree Classifier (Extremely Randomized Trees) is an ensemble method that improves accuracy by combining multiple Decision Trees (DTs) constructed on random subsets of data and features, making them uncorrelated. ETC assigns feature importance scores to indicate relevance to the target variable. Unlike Random Forest (RF), ETC uses all data records and selects features randomly at each node for splitting. ETC outperforms well with noisy features, such as those from the random value imputer used in the PSD dataset. ETCs use random split points, increasing algorithm variance, which grows as the ensemble size increases [24].
Machine learning classification algorithms
Machine learning algorithms are divided into parametric and non-parametric methods. Parametric methods make large assumptions about mapping input features to output attributes, are easier to train, and use less data, but may have reduced robustness [46]. This includes simple neural networks, LR, LDA, Perceptron, and NB. Our proposed work uses LR, LDA, and NB parametric methods.
Non-parametric methods make few assumptions about the objective function, require large amounts of data, and can produce more effective but complex models with slower trained data [45]. Our proposed work uses KNN, RF, and SVM non-parametric methods.
K-Nearest neighbours classifier
KNN is one of the earliest supervised learning models for classification and regression [32]. The number of nearest neighbours considered for making a prediction was five. The weight function utilized to calculate the distance between samples was ‘uniform’, implying that all neighbours were assigned equal weightage. Minkowski distance (p) was assigned its default value of two. Lastly, the distance metric employed for calculating the distance between samples was the Minkowski distance.
Linear discriminant analysis
LDA is a supervised technique to find a linear combination of features that characterize or separate two or more classes of objects or events. [33]. The default parameter used in LDA () in Python is ‘solver’, which specifies the algorithm for computing the Fisher Linear Discriminant. The default solver is Singular Value Decomposition (SVD). It functions by decomposing the covariance matrix of the data into a matrix of singular values and a matrix of singular vectors. The linear discriminants are then calculated as a linear combination of the singular vectors.
Logistic regression
As a supervised learning model, LR relies upon a labelled data set. LR is the most appropriate model for solving problems of binary classification [34]. The parameters used for LR are as follows: penalty: L2 regularization, inverse of regularization strength (C): 1.0, solver: Limited-memory Broyden–Fletcher–Goldfarb–Shanno (L-BFGS) algorithm, maximum number of iterations: 100, and class weight assigned as no class weight.
Naïve bayes classifier
The Naïve Bayes classifier is an effective and simple ML algorithm for building fast models with quick predictions. This is a probabilistic classifier that predicts based on the probability of an object [35]. The default parameters were used for the Gaussian Naive Bayes (NB) classifier to highlight a few parameters’ prior probabilities, and the weight of individual samples was assigned none.
Random forest classifier
The RF belongs to the ensemble technique’s bagging category [31]. The number of estimators was 100. The function used to measure the quality of a split was the Gini impurity. The number of jobs to run in parallel was assigned as –1, which means parallelization was used. These were used as the parameters for RFC.
Support vector classifier
SVM is a supervised, kernel-based ML model. It is designed for classification and regression algorithms. It is primarily used for binary categorization. The hyperplane and the support vector define SVM models [36]. Setting ‘probability‘ to True enables the platt scaling heuristic, which estimates probabilities based on the SVM decision function. The kernel function for computing the similarity between data points was the radial basis function (RBF) kernel.
Performance evaluation
Accuracy
The evaluation metric for classification is the accuracy score. In classification, the accuracy score is the ratio of correct predictions to the total number of input data points [47].
The accuracy score is unreliable when the dataset has an uneven distribution of classes. From the Equation (1), the number of correct predictions equals True Positive and False Positive.
Precision refers to the proportion of predicted positive cases that are positive. Recall is a measure of the proportion of actual positive cases that are correctly predicted. Based on Equation (2), the total number of predicted positives equals the total number of True Positives and False Positives.
Recall measures the error caused by false negatives, crucial in evaluating diseases like RA. The total actual positives equal true positives and false negatives as shown in Equation (3). The F1 score is a weighted average of precision and recall, making it a useful metric for imbalanced datasets as shown in Equation (4) [48].
ROC curves plot fallout (FPR) against hit rate (TPR) to evaluate model performance. AUC score, derived from ROC, measures model quality and ranges from 0 to 1. An AUC score of 1 indicates acceptable performance, 0 indicates poor performance, and 0.5 indicates the most ineffective model performance [48].
Experimental results and discussion
Informative features from the PFRVMD approach were further analyzed using wrapper and embedded feature selection techniques (backward feature selection, Boruta algorithm, forward feature selection, ETC) to obtain significant features for easier RA and OA diagnosis. The best features from each technique were evaluated using ML models (KNNC, LDA [33], LR, NBC, RFC, SVC) and compared using accuracy, F1, and ROC AUC scores to determine the best-performing model and most significant predictive features.
Best features obtained from each feature selection technique
In backward feature selection, when ‘accuracy’ is the scoring parameter for the SequentialFeatureSelector class, the highest accuracy was obtained for the significant features, namely ‘Gender’, ‘Age’, ‘Tmp’, ‘HOH’, ‘Glob’, ‘Alph’, ‘BilUC’, ‘Cl’, ‘HDLC’, ‘LDLC’, ‘Pr’, ‘APTT’, ‘BT’, ‘PT’, and ‘Lym’. Similarly, when ‘F1 Score’ is the scoring parameter the following are the highest F1 score significant features ‘Gender’, ‘Age’, ‘Tmp’, ‘HODM’, ‘HOH’, ‘HOA’, ‘Glob’, ‘Alph’, ‘BilUC’, ‘Cl’, ‘HDLC’, ‘LDLC’, ‘Pr’, ‘APTT’, ‘BT’, ‘CT’, ‘PT’, and ‘Lym’, Using’ ROC AUC Score’ as the scoring parameter ‘Gender’, ‘HOCAD’, and ‘AST’ are the important features identified with highest ROC AUC Score.
The feature selector ranking of the Boruta algorithm is as follows for the 39 reduced-dimensional feature set: Ranking w.r.t index: [10 20 34 28 27 5 15 20 10 33 31 12 7 22 1 23 7 18 13 9 23 26 4 32 25 15 1 1 28 30 1 13 2 3 1 1 18 17 5]. The best features derived from the Boruta algorithm are ‘MCH’,’ MCV’, ‘PCV’, ‘Lym’, ‘Neu’, and ‘LDLC’.
The best features obtained from ETC are ‘Gender’, ‘MCH’,’ APTT’, ‘Lym’, ‘Glu’, ‘PC’, ‘pH’, ‘LDLC’, ‘RBC’ and ‘Pr’ as shown in Fig. 3.
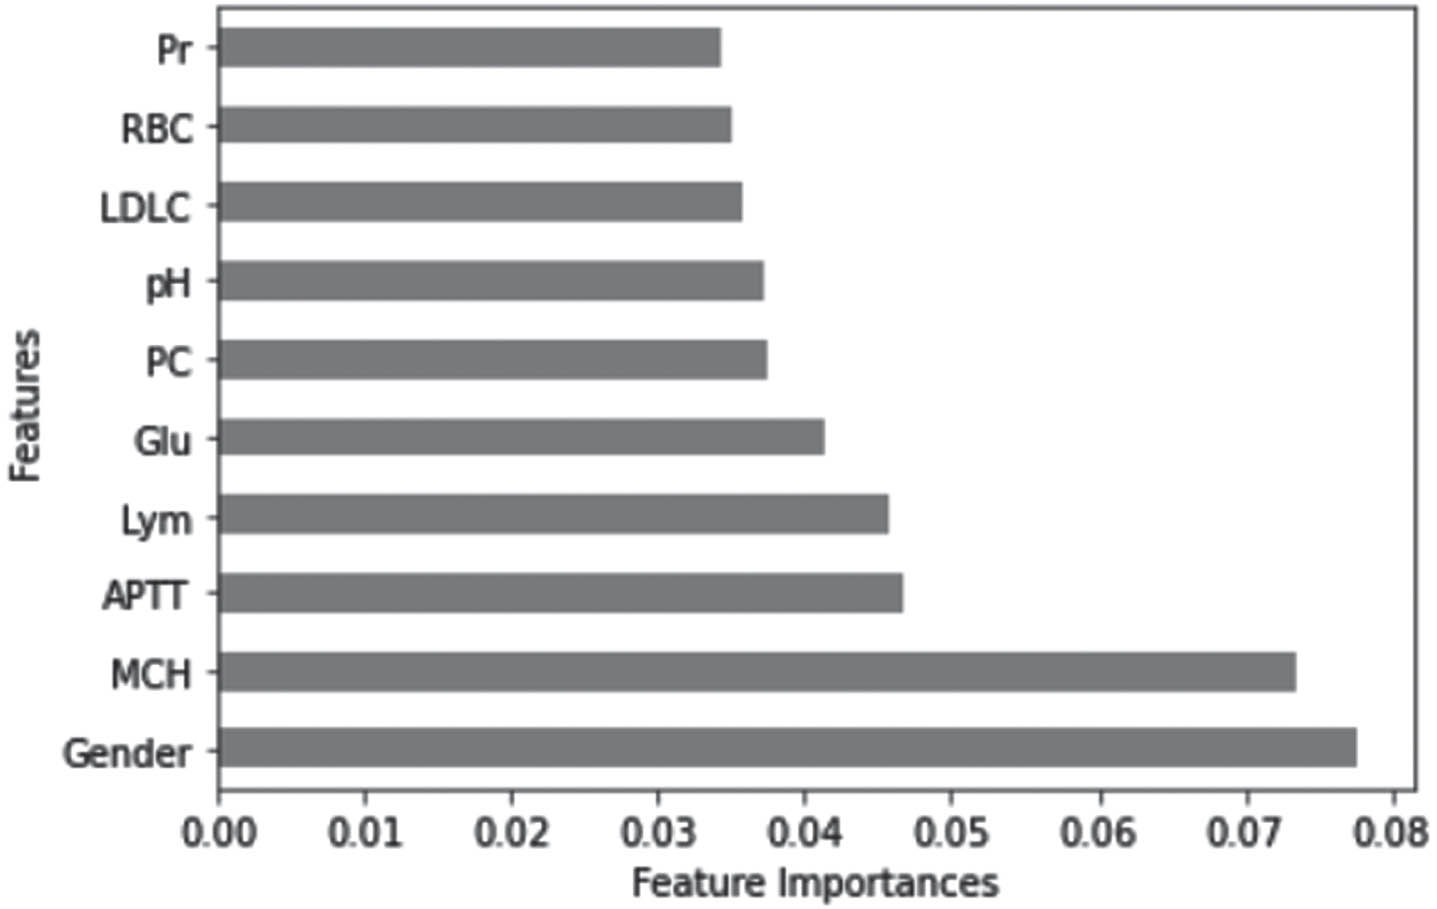
The best features obtained from Extra Tree Classifier.
Forward feature selection identified significant features based on different scoring parameters. For ‘accuracy’, ‘Gender’, ‘Trigly’, and ‘Neu’ yielded the highest accuracy. For ‘F1 Score’, ‘Gender’, ‘Tbil’, and ‘Neu’ achieved the highest F1 score. Using ‘ROC AUC Score’, ‘Gender’, ‘BilUC’, ‘Urea’, and ‘APTT’ were identified as important features. When multiple ML algorithms produced the same highest scores, the minimum significant features were considered optimum.
The reduced-dimensional feature set, consisting of 39 attributes, was trained and tested using machine learning (ML) algorithms. The testing dataset produced the following results: LR presented the highest accuracy of 90%.
The elite features obtained using the BFS depicted LDA and LR as the optimal classifier models with the highest accuracy of 96%. The quality features obtained from the BoA FS signified LDA as a good classifier model with an exalted accuracy of 90%. The prominent features derived from the ETC FS indicated the SVC as the dominant model with the highest accuracy of 99.9%, as depicted in Fig. 4. Using the best features of FFS, LDA and SVC achieved the highest accuracy of 96%.
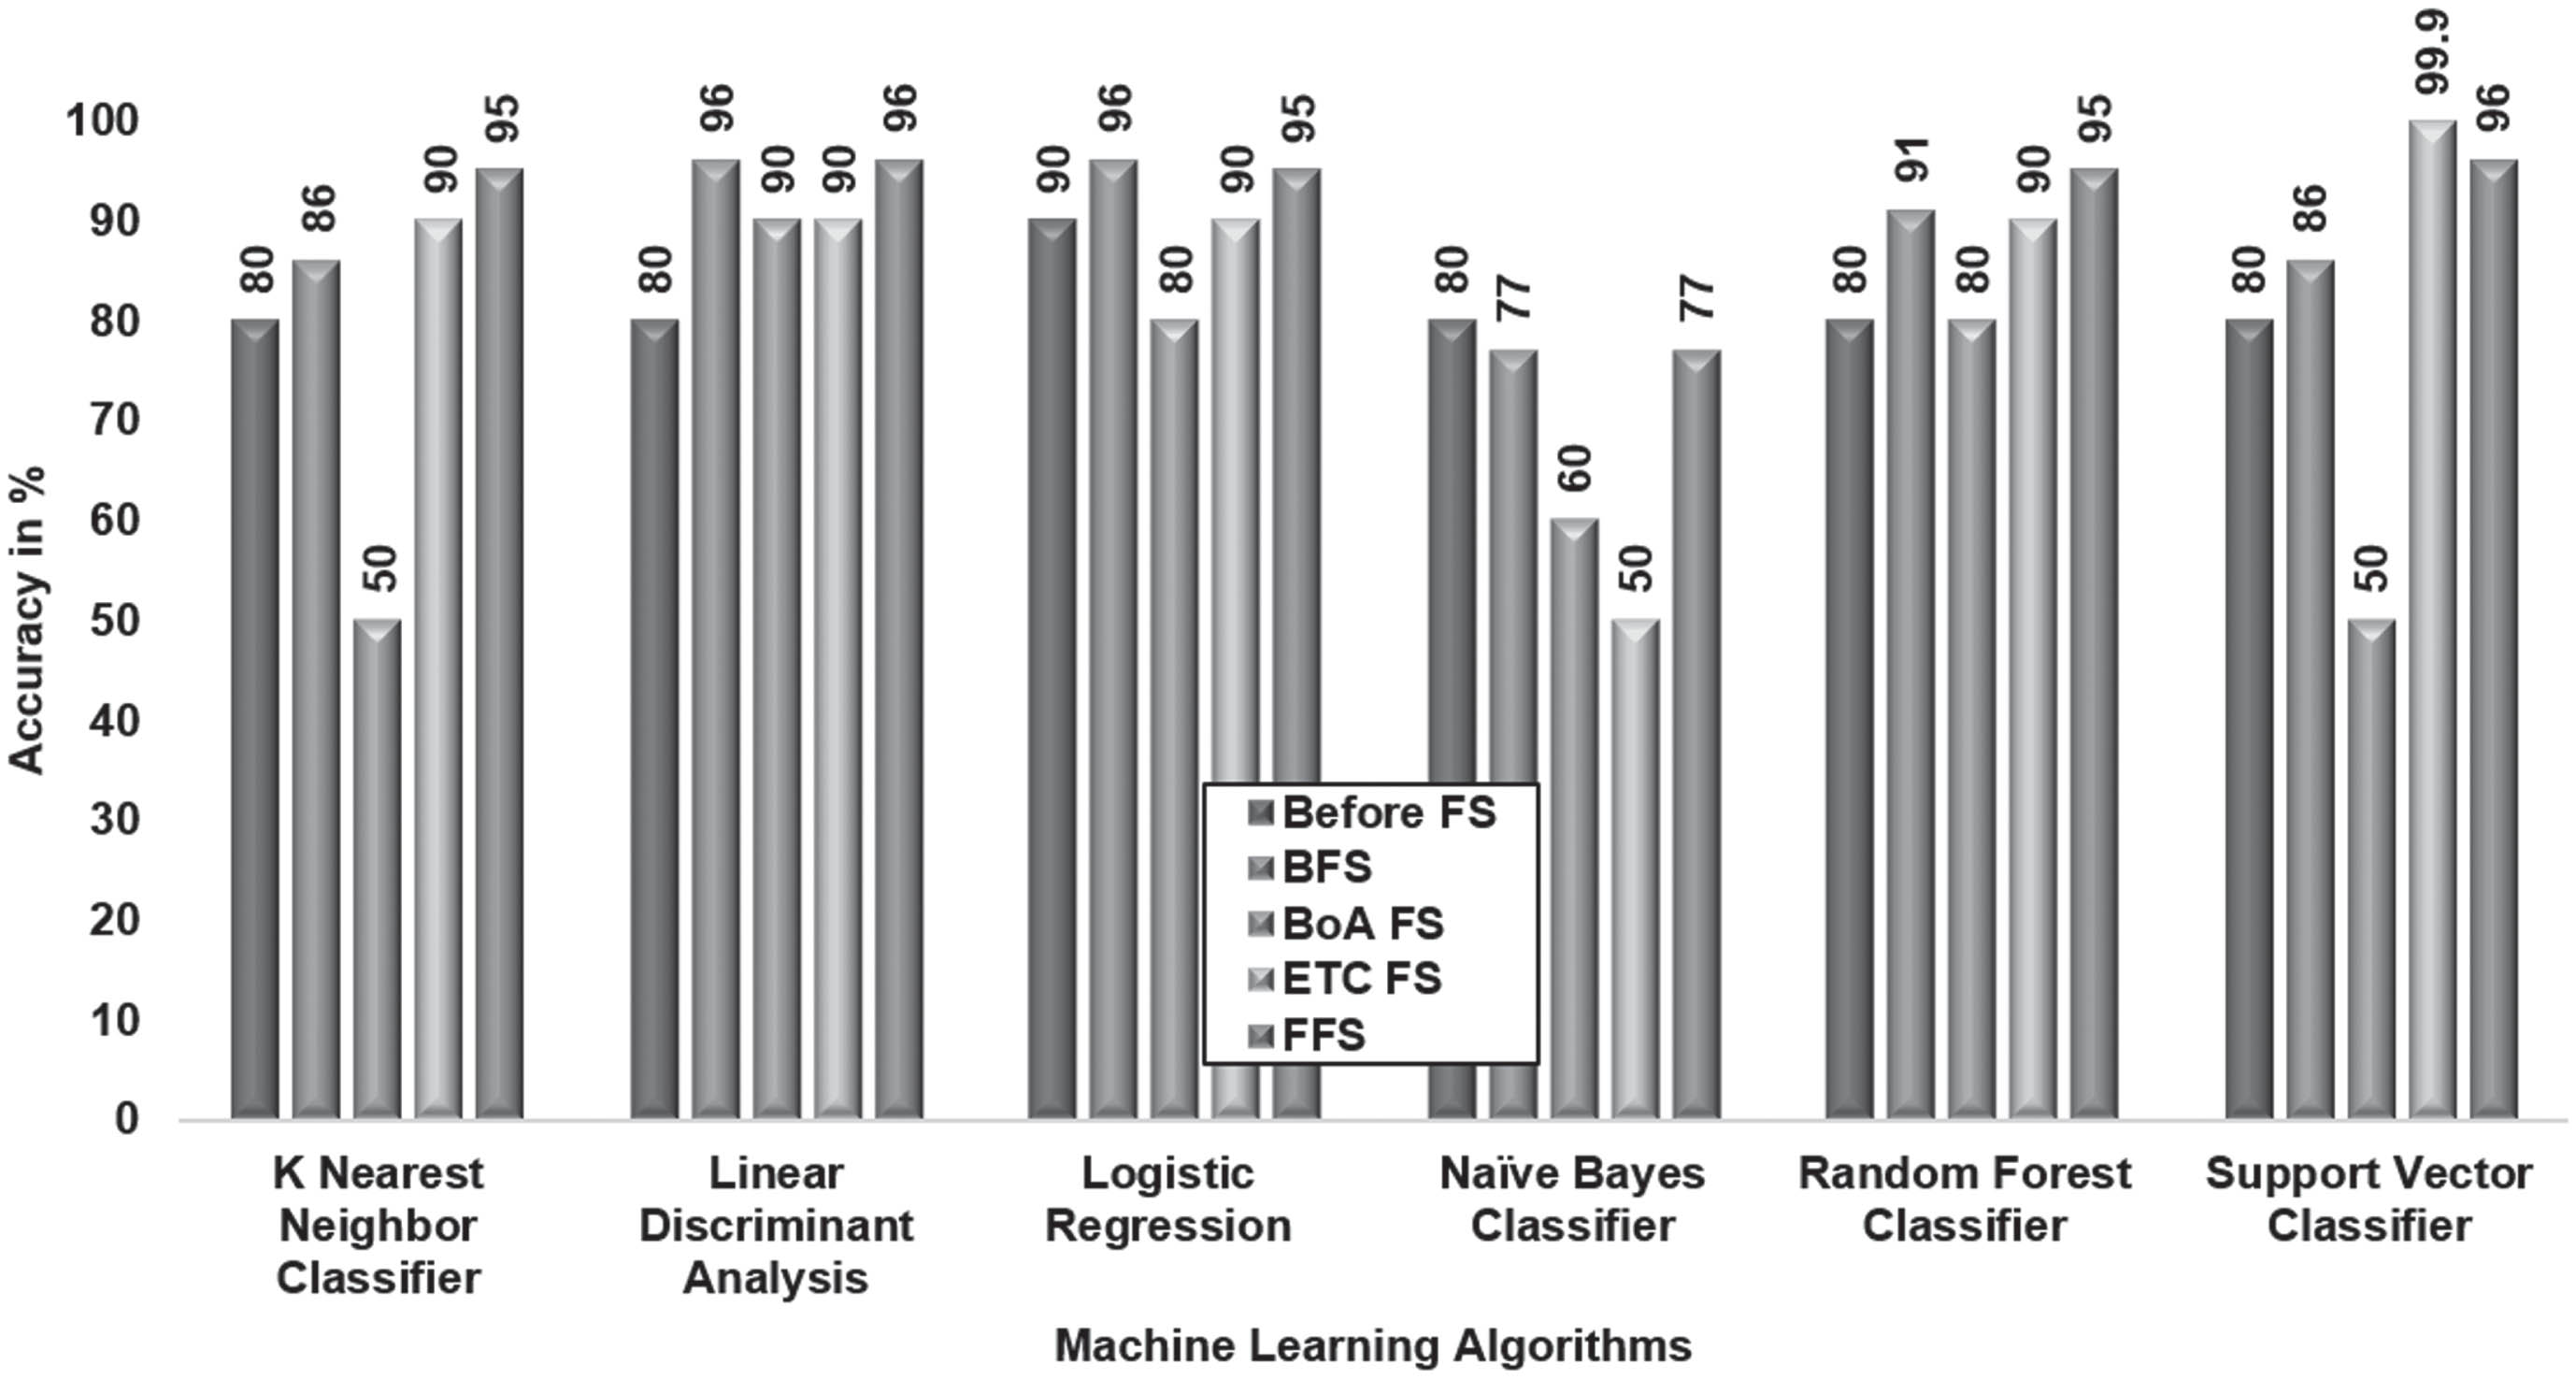
Comparison of Feature Selection Techniques in enhancing ML Algorithms accuracy.
Among the evaluation of different feature selection techniques with respect to ML algorithms based on accuracy metrics, SVC emerged as the best classifier using the ETC FS.
Through analysis of 39 attributes, LR and RFC yielded the highest F1 score of 89%, demonstrating their effectiveness in classification tasks.
BFS-best selected features proved optimal for LDA and LR, achieving a remarkable F1 score of 96%. Similarly, the best features selected from BoA FS identified LDA, LR, and RFC as suitable classifiers, obtaining an F1 score of 96%. The best features achieved from ETC FS identified SVC as the dominant model, producing the highest F1 score of 99.9%. Additionally, FFS-best selected features enabled LR and SVC to obtain the highest F1 score of 96%, as represented in Fig. 5.
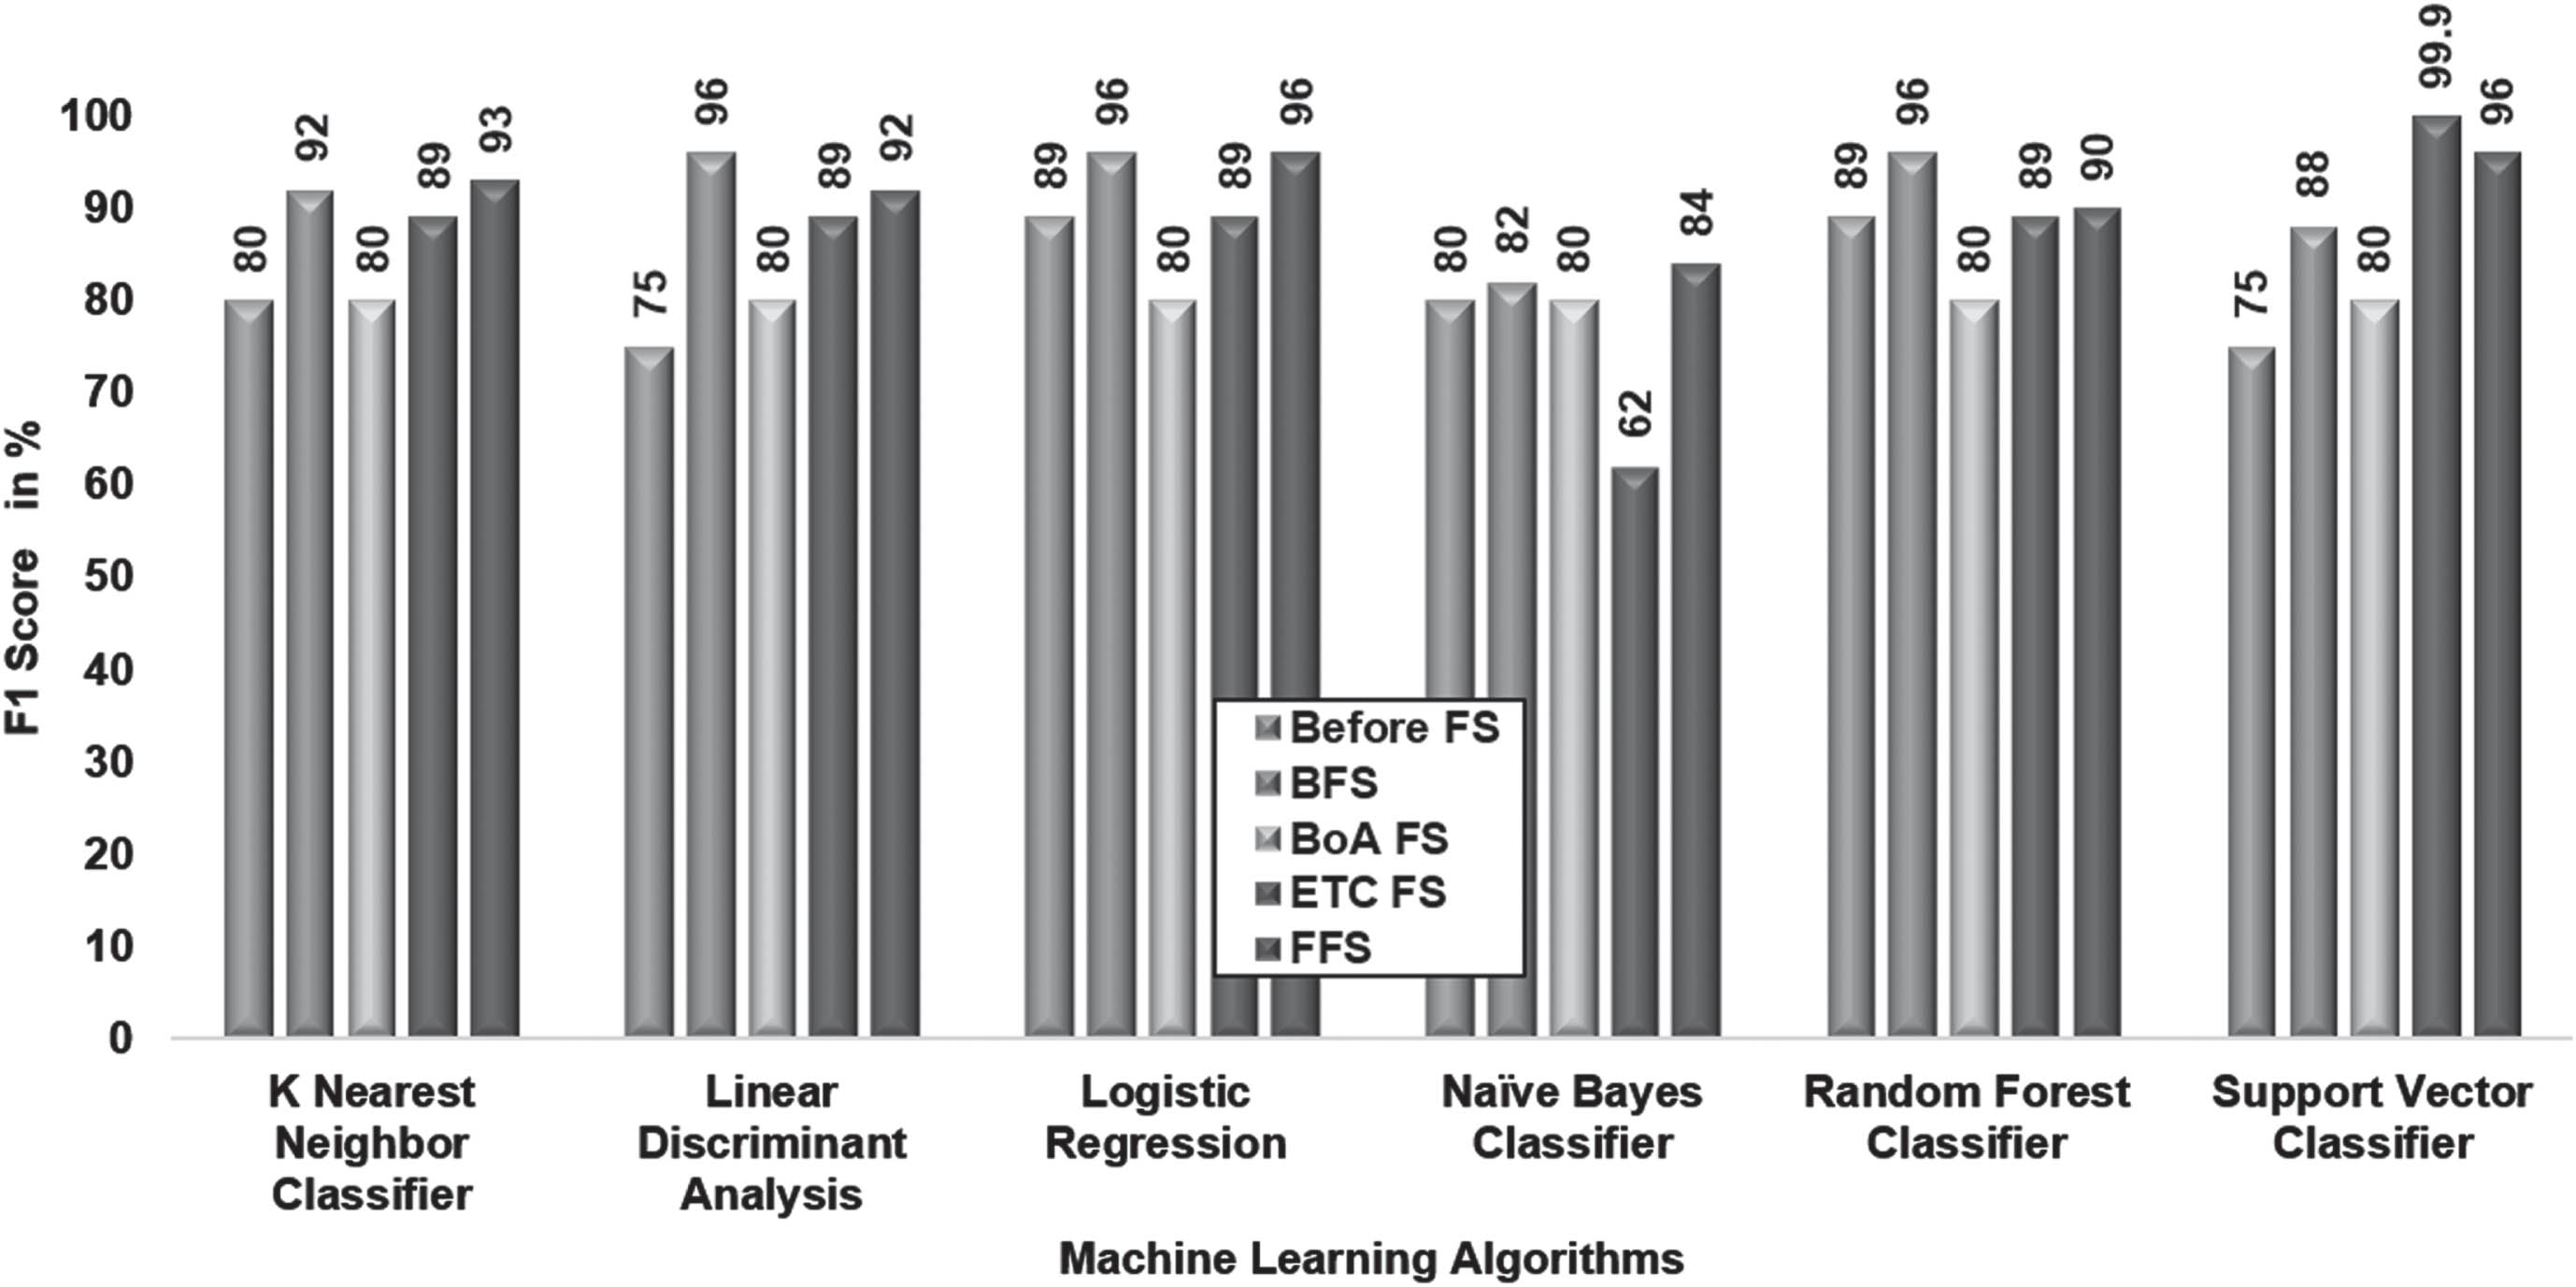
Comparison of Feature Selection Methods based on F1 Score.
When evaluating different feature selection techniques using the F1 score metric, SVC emerged as the superior classifier in conjunction with ETC FS.
Among the models evaluated, SVC achieved the highest ROC AUC score of 99% using 39 attributes before applying feature selection techniques.
Except for SVC, all other classifier models exhibited the highest ROC AUC score of 99% for the optimal features obtained using the BFS. Using the optimal features obtained from the BoA FS, RFC emerged as the best classifier model, achieving a ROC AUC score of 95%. The prominent features selected by the ETC FS yielded SVC as the superior model, with the highest ROC AUC score of 99.9%, as highlighted in Fig. 6. When employing the optimal features from the FFS, KNNC, LDA, LR, and RFC, all achieved the highest ROC AUC score of 99%.
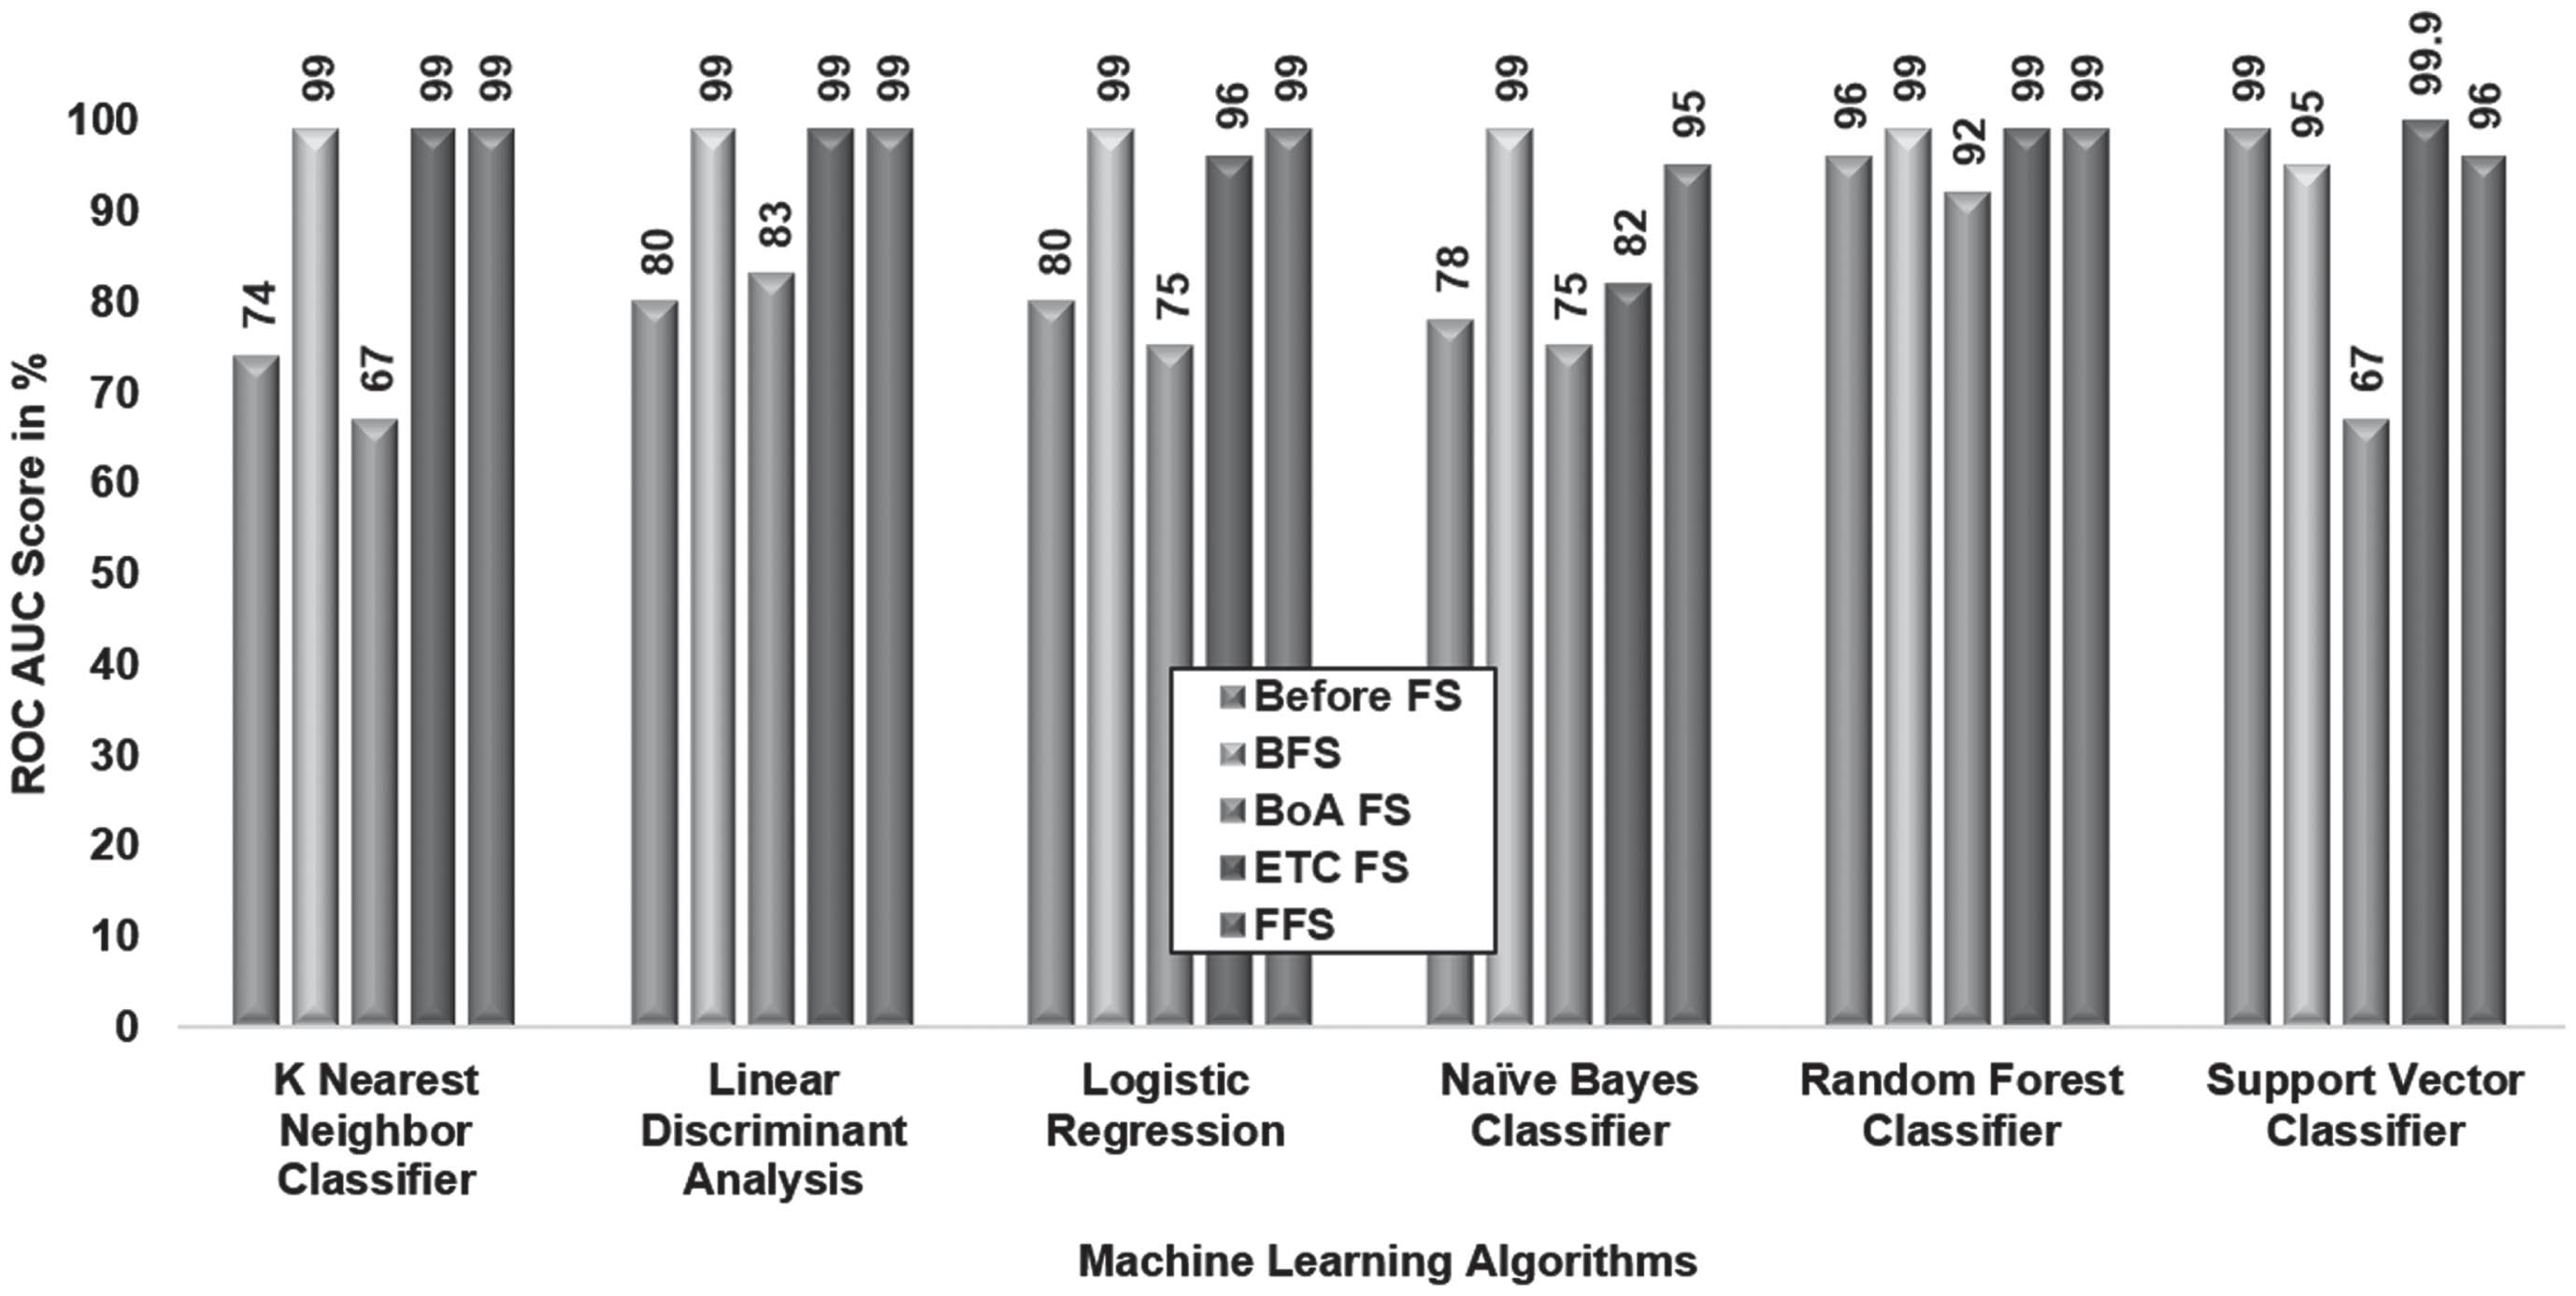
Comparison of Feature Selection Methods based on ROC AUC Score.
In evaluating different feature selection techniques against machine learning algorithms based on ROC AUC score metrics, SVC emerged as the best classifier when utilizing the ETC FS.
The proffered research work suggests that ETC feature selection performs best along with the Support Vector Classifier algorithm for the clinical dataset (obtained from Apollo Reach Hospital, Karaikudi) after performing progressive feature reduction with varied missing data using PCA. The accuracy, F1, and ROC AUC scores reached the maximum of 99.9% for the SVC classifier. This proposed work has identified ten relevant biomarkers to predict and classify RA and OA patients for any given data point from the PSD dataset. Moreover, the significant biomarkers have been determined based on their clinical category and are depicted in Table 6. Furthermore, the dimensionality reduction achieved using the proposed work PFRVMD reduced the pilot dataset from 53 Independent to 39 Independent features. Without compromising the quality of the result, the PFRVMD has reduced the computational complexity by minimizing the number of features. The findings suggest that PFRVMD might decrease feature dimensions while retaining essential data.
Significant features/biomarkers identified from the PSD dataset
The future scope of this research lies in deploying the SVC model for predicting rheumatoid arthritis. This would have significant implications in assisting healthcare professionals in identifying individuals at risk of developing arthritis, thereby enabling early diagnosis and timely intervention.
Data Availability Statement
Footnotes
Acknowledgments
This article has been published under AURF Seed Money Grant –2018 grant sanctioned vide letter No.
ALU: AURF Start-up Grant: 2018, Dt. 23.03.2018.
This article has been published under RUSA Phase 2.0 (II Installment) grant sanctioned vide letter No. F. 24-51/2014-U, Policy (TN Multi-Gen), Dept. of Edn. Govt. of India, Dt. 09.10.2018.
Department of Science and Technology, New Delhi, for the financial support in general and infrastructure facilities sponsored under PURSE 2nd Phase Programme (Order No. SR/PURSE phase 2/38 (G) dated: 21.02.2017)
Conflict of Interest
The authors declare that they have no conflict of interest