
Abstract
In the last decades, Tuberculosis (TB) can be considered a serious illness affecting people over the globe and it leads to mortality when left untreated. Chest X-Ray (CXR) is the topmost selection for the recognition of pulmonary diseases in hospitals since it can be cost-efficient and easily available in many nations. But, manual CXR image screening is a huge load for radiologists, which results in a maximum inter-observer discrepancy rate. At present, Computer-Aided Detection (CAD) is a powerful imaging equipment for detecting and screening dangerous ailments. In recent times, Deep Learning (DL) based CAD schemes have demonstrated positive outcomes in the recognition of TB diseases. This study introduces an Egret Swarm Optimization Algorithm with Deep Feature Fusion based Tuberculosis Classification (ESOA-DFFTC) technique on CXR Images. The presented ESOA-DFFTC technique utilizes feature fusion and tuning processes for the classification of TB. To accomplish this, the ESOA-DFFTC model first exploits the Gaussian Filtering (GF) approach for image denoising purposes. Next, the ESOA-DFFTC model performs a feature fusion process using three DL models namely ResNeXt-50, MobileNetv2, and Xception. To enhance the achievement of the DL models, the ESOA-based hyperparameter optimizer is implemented in the study. For TB classification, the ESOA-DFFTC methodology uses an Arithmetic Optimization Algorithm (AOA) with Weight-Dropped Long Short-Term Memory (WDLSTM) methodology. The investigational output of the ESOA-DFFTC system was examined on a benchmark medical imaging dataset. A wide comparative investigation stated the greater achievement of the ESOA-DFFTC system over other current algorithms.
Keywords
Introduction
Tuberculosis (TB) is a transmissible ailment majorly transmitted by the bacteria type “Mycobacterium TB” that can be transmitted from an individual to another through the air via sneezing, coughing, and spitting water [1]. TB affects the lungs, which can be named pulmonary TB; and affects other human parts like the bones and spine that are known as extrapulmonary TB. Precise diagnoses of TB need a reliable and precise interpreting of the testing outcomes [2]. Thus, WHO suggested utilizing CXR for detecting pulmonary malformations because of their low cost, availability, and high sensitivity [3]. Diagnosis related to CXR images needs wide practice, is labour-intensive, and is vulnerable to an individual’s casual mistake. In spite of limited medical resources and the lack of skilled radiologists, this recommendation was made [4]. Thus, with the advance of computer vision technologies, Artificial Intelligence (AI)-assisted diagnoses of disease, and digital imaging systems, those problems have been tackled. This technology has been assessed for the diagnosis of biomedical images [5]. In the healthcare sector, AI technology has been more commonly utilized for supporting physicians and radiologists in enhancing their diagnosis decision for various diseases [6]. AI methods were implemented with several techniques to rise the diagnosis precision. The AI method aims to study from the inputted data to forecast the upcoming unseen cases.
CAD tool was a promising support to radiotherapists and an advantage in medical imaging in TB detection [7]. Several studies were performed to frame a powerful diagnosis mechanism [8]. For instance, a CAD method has been constructed for diagnosing the TB cavity that finds areas of interest in CXR images. It addressed the disadvantages of the prevailing CAD mechanism that fails to detect TB cavities because of the superimposed anatomic part in the pulmonary region. Likewise, a CAD method was formulated that straightly identifies TB [9]. This growth has paved way for a clear image of the pulmonary surface to detect opaque or mass lesions, resulting in a greater targeted TB diagnosis. Current developments in AI technology have resulted in the expansion of methods that could identify more TB features [10]. Various DL mechanisms were advanced in recent times for analyzing digital CXR for TB-oriented abnormality that could address current shortcomings, minimalizing human inter-reader variabilities and reproducibility and providing radiologic services where medical specialists are unavailable.
This study introduces an Egret Swarm Optimization Algorithm with Deep Feature Fusion based Tuberculosis Classification (ESOA-DFFTC) technique on Chest X-Ray Images. The presented ESOA-DFFTC method utilizes feature fusion and tuning processes for the classification of TB. Next, the ESOA-DFFTC method performs a feature fusion process using three DL models namely ResNeXt-50, MobileNetv2, and Xception with the ESOA-based hyperparameter optimizer. For TB classification, the ESOA-DFFTC methodology uses an Arithmetic Optimization Algorithm (AOA) with Weight-Dropped Long Short-Term Memory (WDLSTM) methodology. The investigational output of the ESOA-DFFTC method is examined on a benchmark medical imaging data.
Related works
Xu and Yuan [11] presented an automatic and low-cost detection technique of pulmonary TB images on CXR to assist primary radiologists. A pulmonary TB classification technique based on CNN has been introduced that makes use of DL to categorize CXR scans. The study presents a coordinate attention module into CNN (VGG16), in such a way that the algorithm could capture direction sensing and position sensing information along with cross-channel information, to classify and identify pulmonary TB images. In [12], the study aims to design a robust TB detection technique that relies upon stochastic learning with Artificial Neural Network (ANN) by a randomized variation utilizing CXR image. This method is capable of incorporating random functions into the networking, whether by allocating stochastic transfer functions or weight into the networking.
Rahman et al. [13] focus on detecting and diagnosing TB in CXR by integrating a pretrained Deep Convolutional Neural Network (DCNN) with the Machine Learning (ML) technique. Incorporated the deep pretrained DenseNet201 model with the ML XGBoost technique for creating a hybrid method to classify patients as TB patients and normal. The presented method categorizes them using the XGBoost classifier and extracts features with the use of the pre-trained DenseNet201 neural network. In [14], the effects of the Transfer Learning (TL) method on the CXR databases for TB recognition are compared and explored with the presented Deep Neural Network (DNN) model. Unlike the complicated TL methods, the presented method has a standard structure with a dropout of some layers, and batch normalization for dealing with model overfitting and limited parameters.
Raju et al. [15] introduced a DL-oriented method for the automated recognition of TB screening from CXR imaging. India ranks first in TB cases. For active TB diagnosis, a chest radiograph in symptomatic patients was utilized. This screening technique can be preferably done at the primary healthcare centres where a doctor is available and occasionally through mobile CXR units. The main difficulty of this technique of screening was the further follow-up of patients and timely reporting for treatment initiation. The authors built many CNNs, the existing DL techniques, to construct the method for automated TB diagnosis. Singh and Hamde [16] presented an automated TB detection technique which utilizes standard digital chest radiographs. The technique contains 3 main phases. By morphological techniques and using the log Gabor filtering technique, the authors initially extracted the pulmonary regions from the CXR. A shape and texture feature set of the segmented database is calculated. For classifying the input CXR into TB-infected and healthy, the feature vector computed allows the Support Vector Machines (SVM).
Ignatius et al. [17] presented a deep CNN method relevant to histogram-matched CXR images that are not necessarily needed for object interest segmenting, and this paired technique of histogram matching with the CXRs enhances the detection performance and precision of CNN methods for TB diagnosis. Moreover, this study includes 2 discrete experimentations that leveraged the images of CXR without and with histogram matching for classifying non-TB and TB from CXRs utilizing DCNNs. It could precisely identify TB from CXR images utilizing deep CNN models pre-processing, and data augmentation. Iqbal et al. [18] presented a potential and direct DL network named TBXNet, which precisely categorizes an enormous quantity of TB from CXR images. The dual convolutional blocks were integrated with a pretrained layer in the networking’s fusion layer. Also, the pretrained layer was implemented for moving pretrained data into the fusion layer.
The proposed model
In the current research, a novel ESOA-DFFTC methodology is presented for automated TB classification on CXR images. This ESOA-DFFTC methodology exploited the concepts of feature fusion and hyperparameter tuning process for TB classification. It comprises a series of subprocesses namely the fusion-based feature extraction, GF-based preprocessing, AOA and ESOA based tuning and optimization, and WDLSTM classification processes. Figure 1 portrays the work flow of the ESOA-DFFTC model.
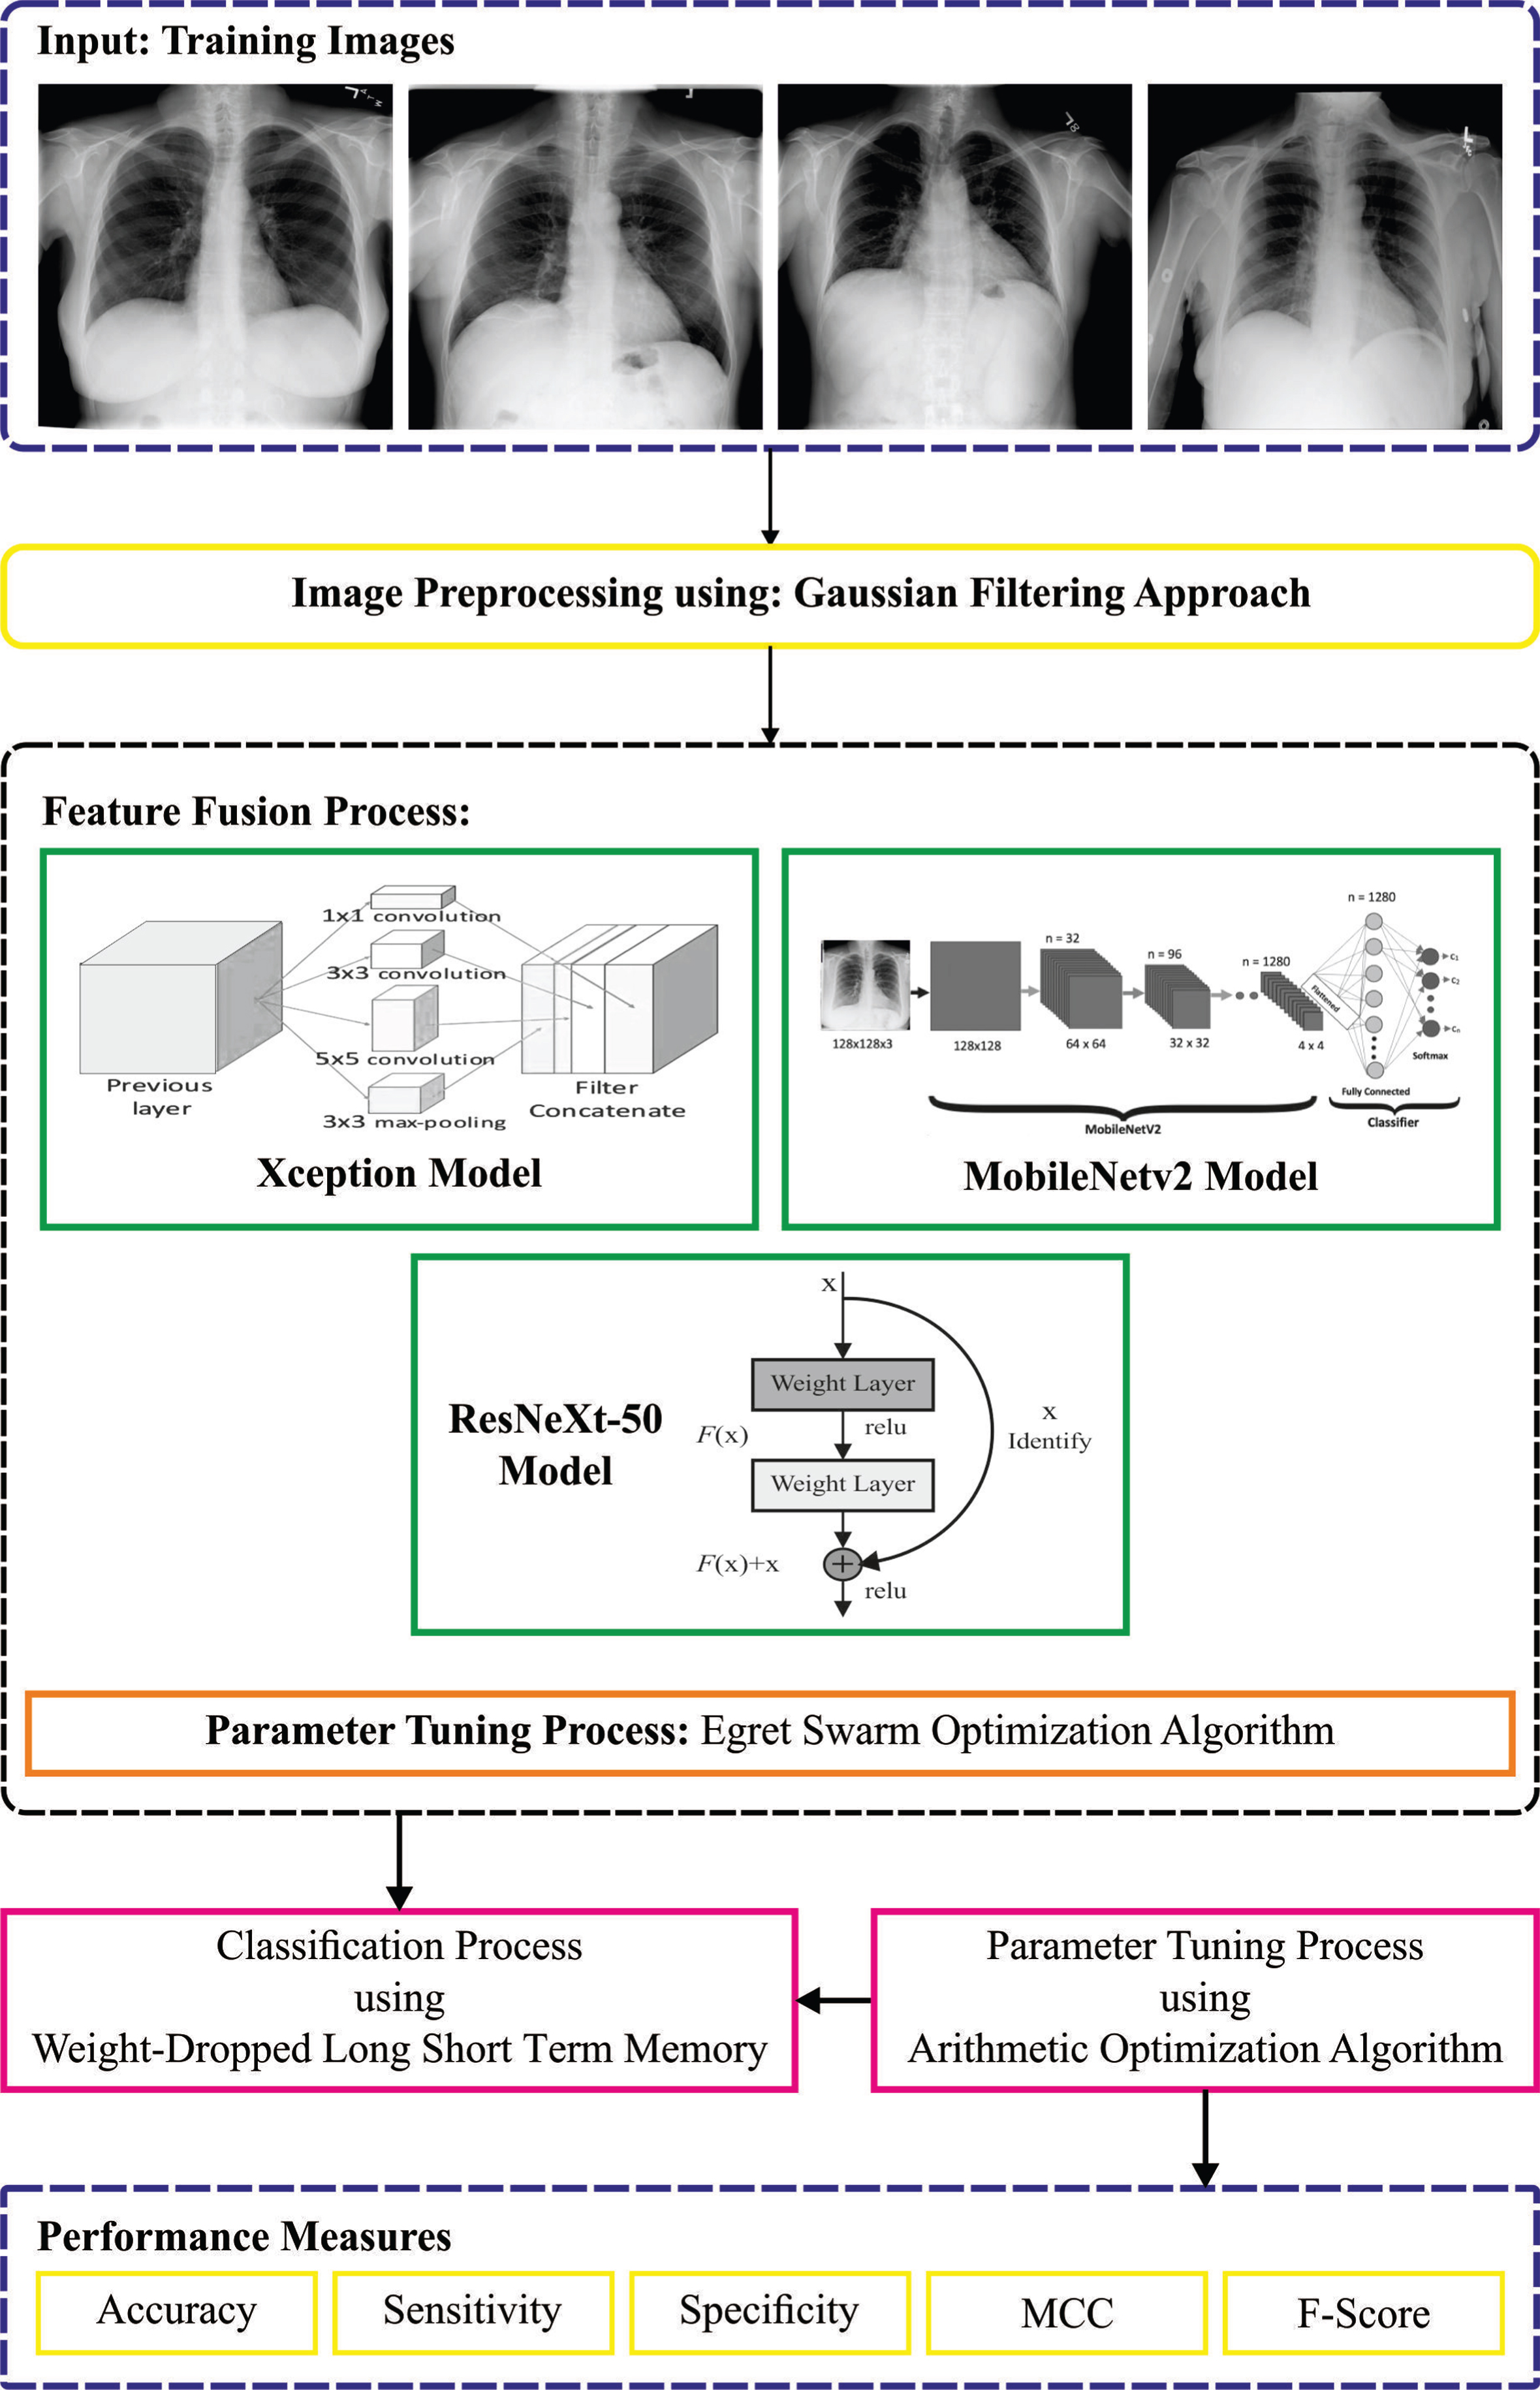
Overall process of ESOA-DFFTC system.
Image denoising is the crucial image pre-processing phase for removing the image noise [19]. Generally, the conventional denoising approach focuses on smoothing images by allocating equivalent weights to each pixel in the image. But the best denoising technique allocates unequal weights to the pixel. Especially, the GF is a sequential smoothing filtering technique that decreases the weight allocated to the pixel by increasing the distance from the central pixels based on the Gaussian function. The input pixel in GF is weighted based on the following expression:
Where,
The feature fusion process uses three DL models namely ResNeXt-50, MobileNetv2, and Xception. Data fusion was utilized in several applications like ML and CV approaches. Feature fusion is an essential function, which combines many feature vectors [20]. The presented technique depends on feature fusion utilizing entropy defined by:
Additionally, the extraction feature was fused in individual vectors.
Which, f represents the fused vector (1x1186). The entropy was utilized on the feature vector for choosing better features based on the score. The FS system was arithmetically labelled in Equations (2)– (5). Entropy was executed for choosing 1186 score-based features in 7835 features.
In Equations (6) & (7), p implies the feature probability and He denotes the entropy. At last, the chosen feature can be given to the classifier in order to differentiate the TB and healthy images.
Residual Networks (ResNet) bypass the input dataset and retain the reliability of the input dataset during the entire process [21]. The depth and rate of learning of the network will be affecting the deep layer by losing gradient; the rate of learning issues could be resolved by supplementing layers to the network which optimizes the functioning of the network.
In Equation (8), f denotes the activation function; the output will be anywhere the networks take the shortcut way.
The convolution blocks and amount of deep layers and the networking’s that uses those two identities are the major difference among the ResNet varieties. ResNet block significantly improves the achievement. The 18 layers of the ResNet are put under training by using 1.8 billion flops and 11.17 million parameters. The total filters have 64-512 output channels, from the convolution layers 2 through 5. Similarly, the ResNet have 3.8 and 4 flops and ResNet50 and ResNet152 employ 23.52 and 25.5 million trainable neurons, subsequently. The key difference between ResNet152 and ResNeXt50 is that ResNeXt50 applies 32 paths for cardinality, on the other hand ResNet152 does not. ResNeXt50 applies 128-2048 output channels for each filter, on the other hand ResNet152 uses 64-5102 the output of the filter channels.
MobileNet is a DNN which is best known for its use in lightweight applications [22]. In the study, the depthwise convolution concept has been used assist to reduce the fewer related parameters. Also, MobileNetV2 follow nearly a similar structure as V1, however, in the MobileBlock of V2 and the final 11 layers are engaged with somewhat different functions. In MobileNetV1, the function of the pointwise convolutional layer is to retain the channel number unchanged or double them, while, in V2, it is widely called a projection layer that assists to decrease the number of channels. Meanwhile, the projection layer assists to reduce the data all over the network, such layer is called a BottleNeck layer. A further concept supplemented in V2 is the residual connection of ResNet.
Xception model
Based on the inspiration of Inception network architecture, Google researcher workers have coined these DNN models with the addition of a novel concept named depthwise convolution operation. The depthwise convolution is a revised version of the prior depthwise convolutional layer. The prior version of the depthwise function initially performs channel-wise spatial convolutional after 11 convolutional operations. The recently developed depthwise convolution, initially, implements the 11 convolutions after the channelwise spatial convolution operation. During the Inception module, note the non-linearity followed by the initial operation is disregarded in the Xception module by presenting the depthwise convolution layer.
Hyperparameter tuning
The ESOA is used for adjusting the hyperparameters of the three DL models. Based on the Great Egret’s aggressive and the Snowy Egret’s sit-and-wait strategies [23], ESOA has integrated the benefits of the abovementioned strategies and constructs corresponding mathematical modelling to enumerate the behaviour. The ESOA is a parallel process with three building blocks: the discriminant condition, the sit-and-wait and the aggressive strategies. There exist 3 Egrets in a single Egret Squad (ES), Egret A uses a guiding forward method whereas Egret B and C correspondingly adapt encircling and random walking models as follows:
Assume that the location of thei
th
ES is
Then the estimated technique is parameterized by,
Where
In the meantime,
Where Egrets represent best Egrets during prey behaviour, based on the practice of approximating prey behaviours and integrating their ideas.
The incorporated gradient
The adaptive weight update technique is used, β1 is 0.9 and β2 is 0.99:
Based on Egret A judgement of the present condition, the next sample position xa,i is defined by,
Where t and t m ax indicate the existing and maximal duration of iteration, whereas hop denotes the gap between the lower and upper boundaries of solution space. step a ∈ (0, 1] represents the step size factors of Egret A. ya,i represent the fitness of xa,i.
Egret B attend to hunt for prey randomly and its behaviors are portrayed in the following:
In Equation (20), rb,i denotes the random value within (- π/2, π/2) , xb,i represent the expected next location of Egret B and yb,i shows fitness. Egret C represents the pursuit of prey aggressively hence the encircling model can be utilized as the update technique of its location:
Where D h indicates the gap matrix between the present and optimum location of the ES, D g compared to the better position of each ES. xc,i indicates the expected position of Egret C. step b ∈ (0, 1] denotes the step size factor of Egret B. r h and r g are randomly generated integers within [0, 0.5).
The squad chooses an optimum choice and together takes action once every ES member has decided on its plan. xs,i denotes the solution matrix of i
th
ES:
When the least value of ys,i is more efficient than present fitness y i , then Egret’s squad accept the choice. When the random integer r ∈ (0, 1) is lesser than 0.3, that implies there exists a 30% probability to be accepted as the worst plan.
The ESOA method presents a Fitness Function (FF) for managing increased efficiency of the classifier. It decides a positive integer to signify the improved effectiveness of the candidate outputs. In such cases, the lessening of the error rate of the classifier is assumed that FF is represented in Equation (28).
The WDLSTM in this study is exploited for the classification of automated TB. LSTM is an alternative kind of ANNs with feedback connection, especially, a kind of Recurrent Neural Network (RNN) [24]. LSTM network is frequently employed for processing voice, video, or images. For instance, the LSTM network has been applied in human activity recognition, speech recognition, handwriting recognition, and language processing. In this work, LSTM networks comprise a memory cell and three gates or regulators for controlling the data flow inside the LSTM units comprised of input, output and forget gates. In another variant, the LSTM is a Gated Recurrent Unit (GRU) that has other gates. The LSTM process is equated as:
From the expression, σ represents the activation function, W and U denote the weight matrices, x
t
shows the input vector at theT time step, c
t
indicates the memory cell state, h
t
denotes the existing hidden layer, and × signifies the component-wise multiplication. The memory cells keep the dependency between input features. Sigmoid and Tangent functions are the activation function of LSTM. WDLSTM is an LSTM-NN standardized through the drop-connect method, a conventional form of dropout where all the connections are dropped with probability 1 - p rather than dropping all the output units. In other words, drop-connect presents the dynamic sparsity to the network on the weight W, while dropout presents sparsity on the activation or the output vector of the network units. In WDLSTM, the hidden-to-hidden weight matrices (U
i
, U
f
, U
o
, andU
c
) of the LSTMs are randomly dropped during the training to avoid over-fitting. The output of the LSTM gate is formulated by:
In Equation (35), M indicates the binary matrix mask encoded connection data. All the elements in mask M are altered to demonstrate various connectivity across iterations during the training.
Finally, the AOA is used for the optimum parameter alteration of the WDLSTM approach. The AOA metaheuristic model is based on the population for optimizing solutions and adopting the arithmetical operator in mathematics and resolving issues without considering the derivative [25]. It should be noted that the optimization technique of a population-based model is inspired by the inspection and manipulation stages. The AOA summary is given as follows: initially, a set of candidate solutions attained randomly as X = [x1, 1, x2, 1, … xN,n-1, xN,n]. Next, Equation (36) is used to accelerate the local search for the optimum solution:
Next, the AOA represent the multiple convergences to attain a broad range of the searching range for avoiding local solution by using the function of Metaheuristic Optimization Probability (MOP) and two arithmetical operators, Multiplication Operator (×) (MO) and Division Operator (÷) (DO) as follows:
The integer μ, and MOP represents the control parameter to adjust the searching phase, and the optimization probability function.
α represents the sensitive parameter which determines the accuracy of the operation stage.
It should be noted, if r2 < 0.5, then the initial DO initiate the inspection stage, and the MO stay insignificant until the DO completes its present task. Or else, the MO begins the inspection stage.
Lastly, during the manipulation stage, the AOA technique represents the accurate convergence to attain the enhancement of the solution attained in the inspection stage, at the same time, on the MOP function and the two arithmetical operators, Addition Operator (+) (AO) and Subtraction Operator (-) (SO).
It should be noted, if r3 < 0.5, then (-) initial SO begins the inspection stage, and (+) the AO stays insignificant until (-) the SO completes the present task. Or else, (+) the AO begins the inspection stage.
The selection of FF is one of a crucial factor of the AOA scheme. Solution encoding was implemented to assess the ability of the candidate solution. In this stage, the value of accuracy is the major cause exploited for scheming a FF.
In the above expression, TP and FP represents the true and false positive value.
In this segment, the TB classification outputs of the ESOA-DFFTC model is investigated using the TB CXR data from the Kaggle dataset [26, 27]. This repository comprises 4200 instances with 3500 normal instances and 700 TB instances as illustrated in the Table 1. Figure 2 illustrates the instance images of normal and tuberculosis.
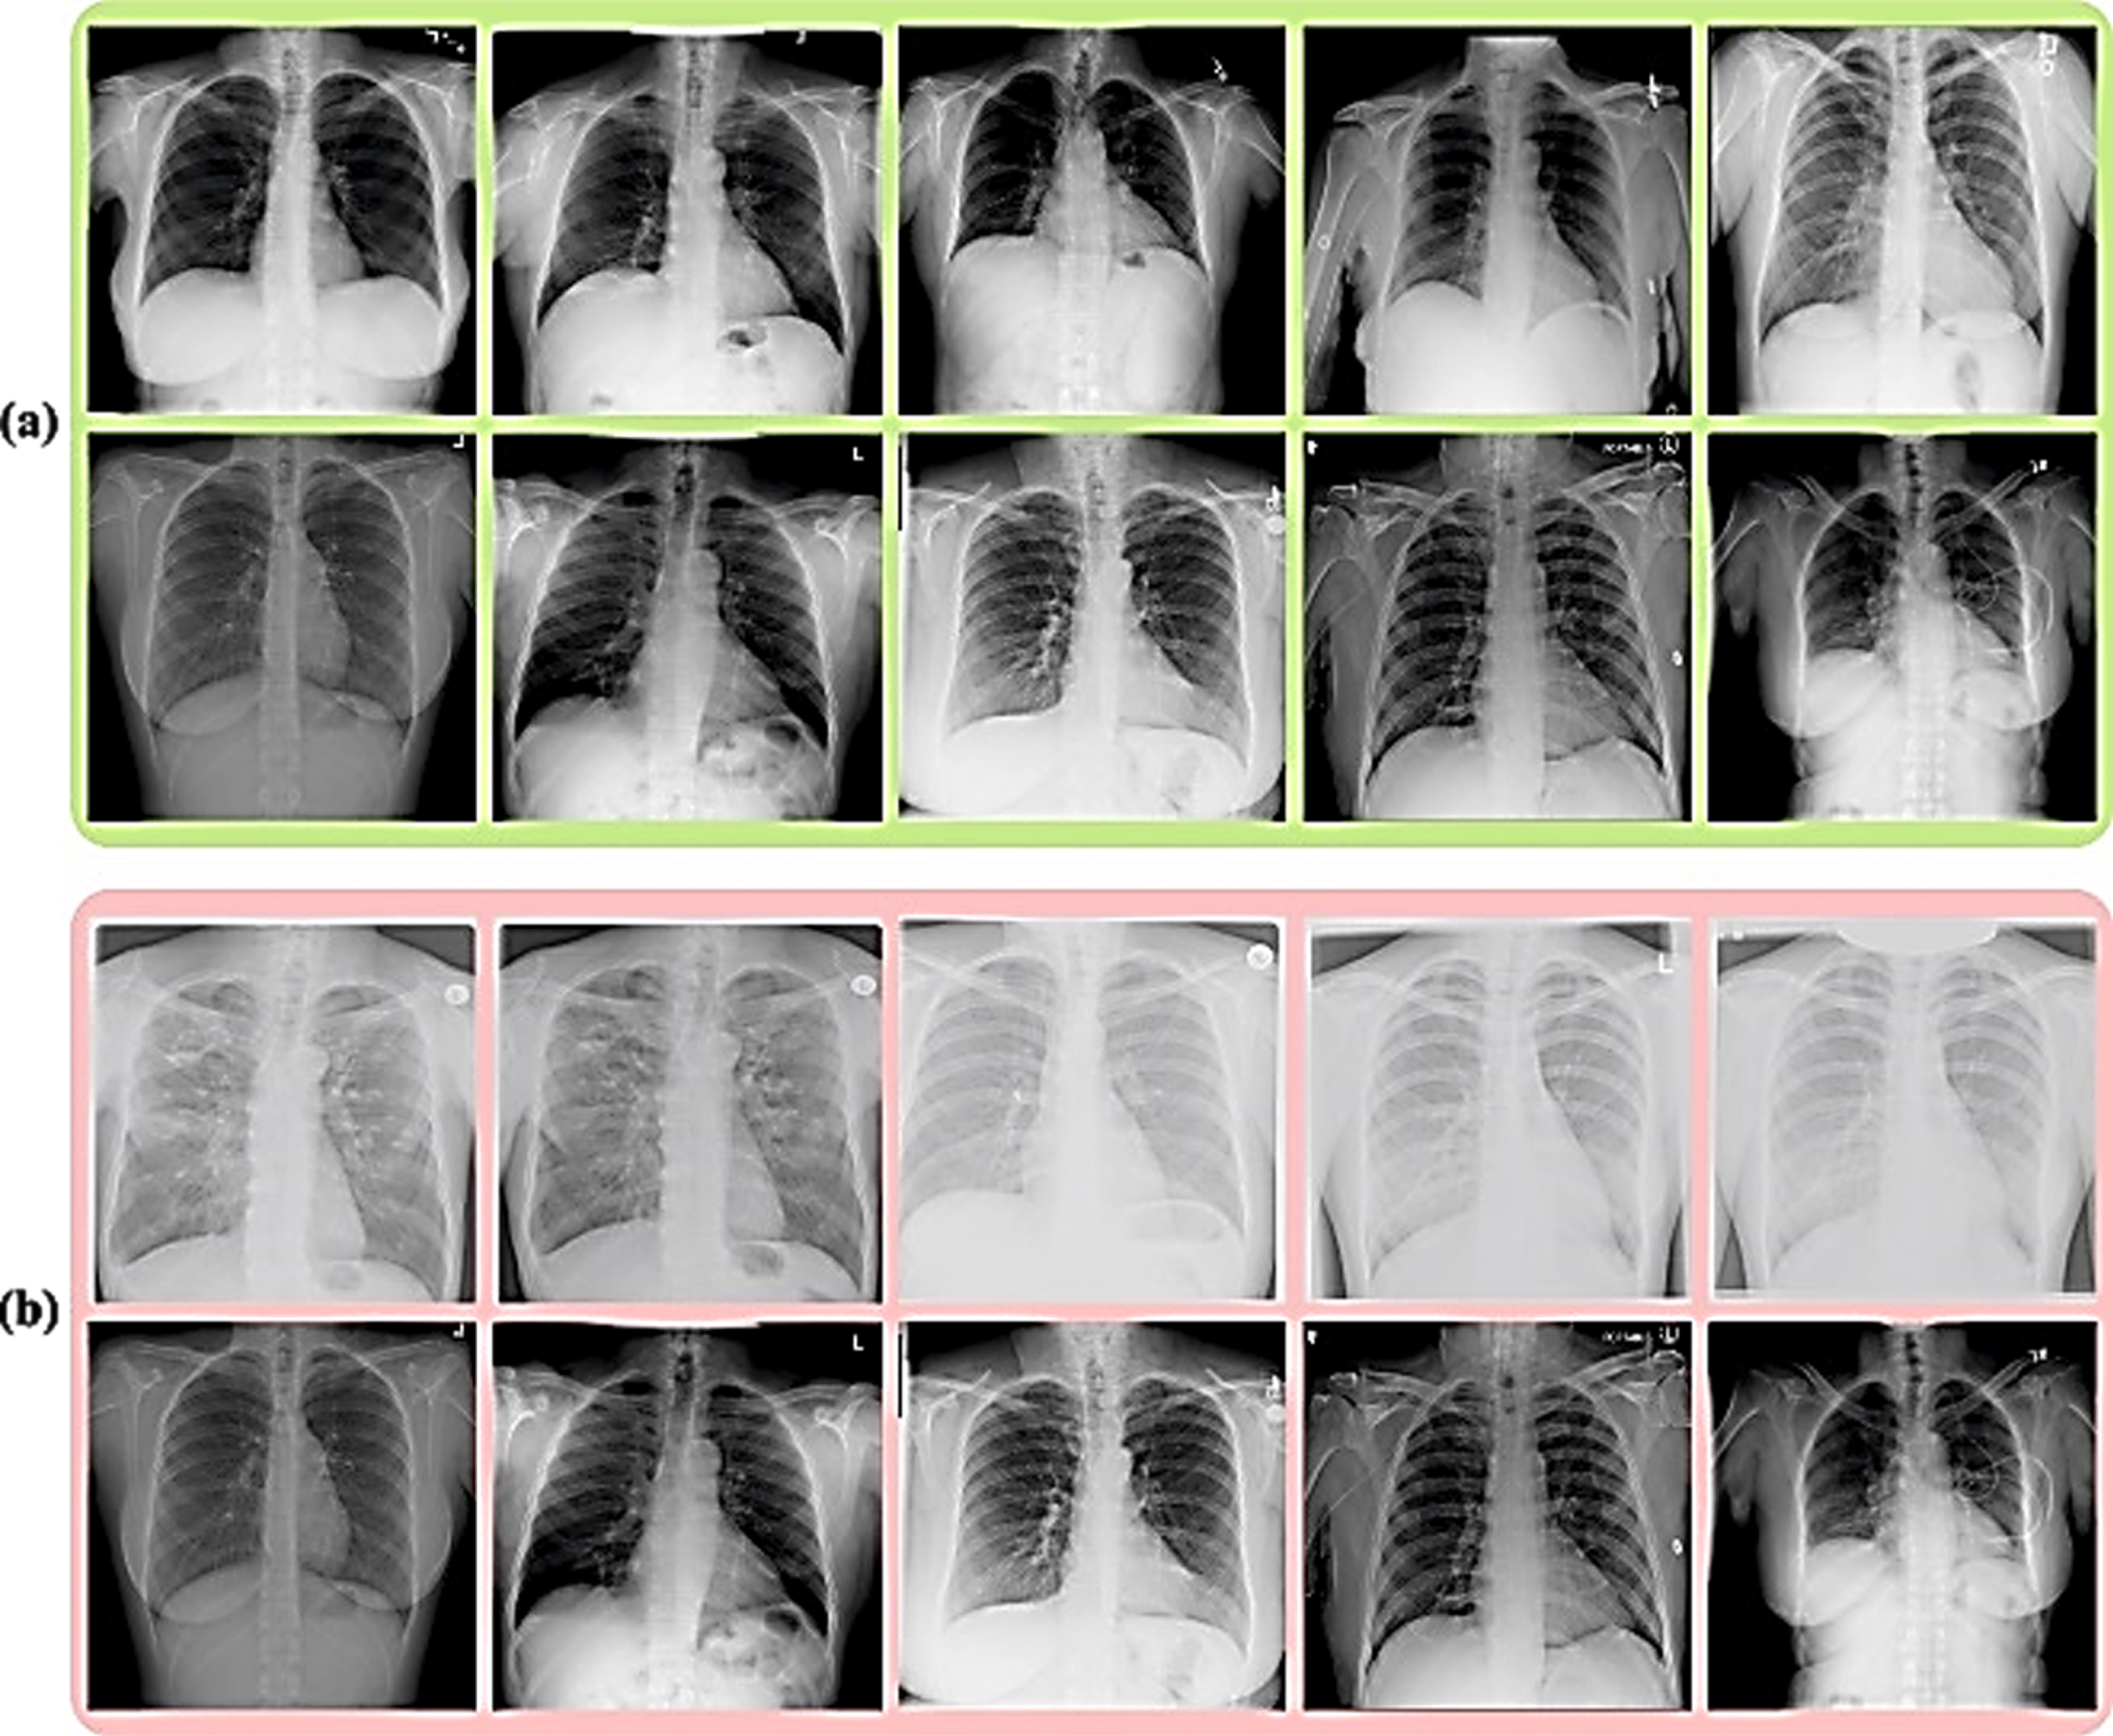
Sample Images a) Normal b) Tuberculosis.
Dataset specifics
The confusion matrix of the ESOA-DFFTC methodology on the TB classification method are illustrated in Fig. 3. The outputs depicted that the ESOA-DFFTC methodology attains effectual identification of TB under the total epochs. As a sample, with 200 epochs, the ESOA-DFFTC technique recognizes 3465 instances into normal and 642 instances into TB class. Simultaneously, with 1000 epochs, the ESOA-DFFTC technique recognizes 3494 instances into normal and 694 instances into TB class. Concurrently, with 2000 epochs, the ESOA-DFFTC method recognizes 3467 instances into normal and 664 instances into TB class.
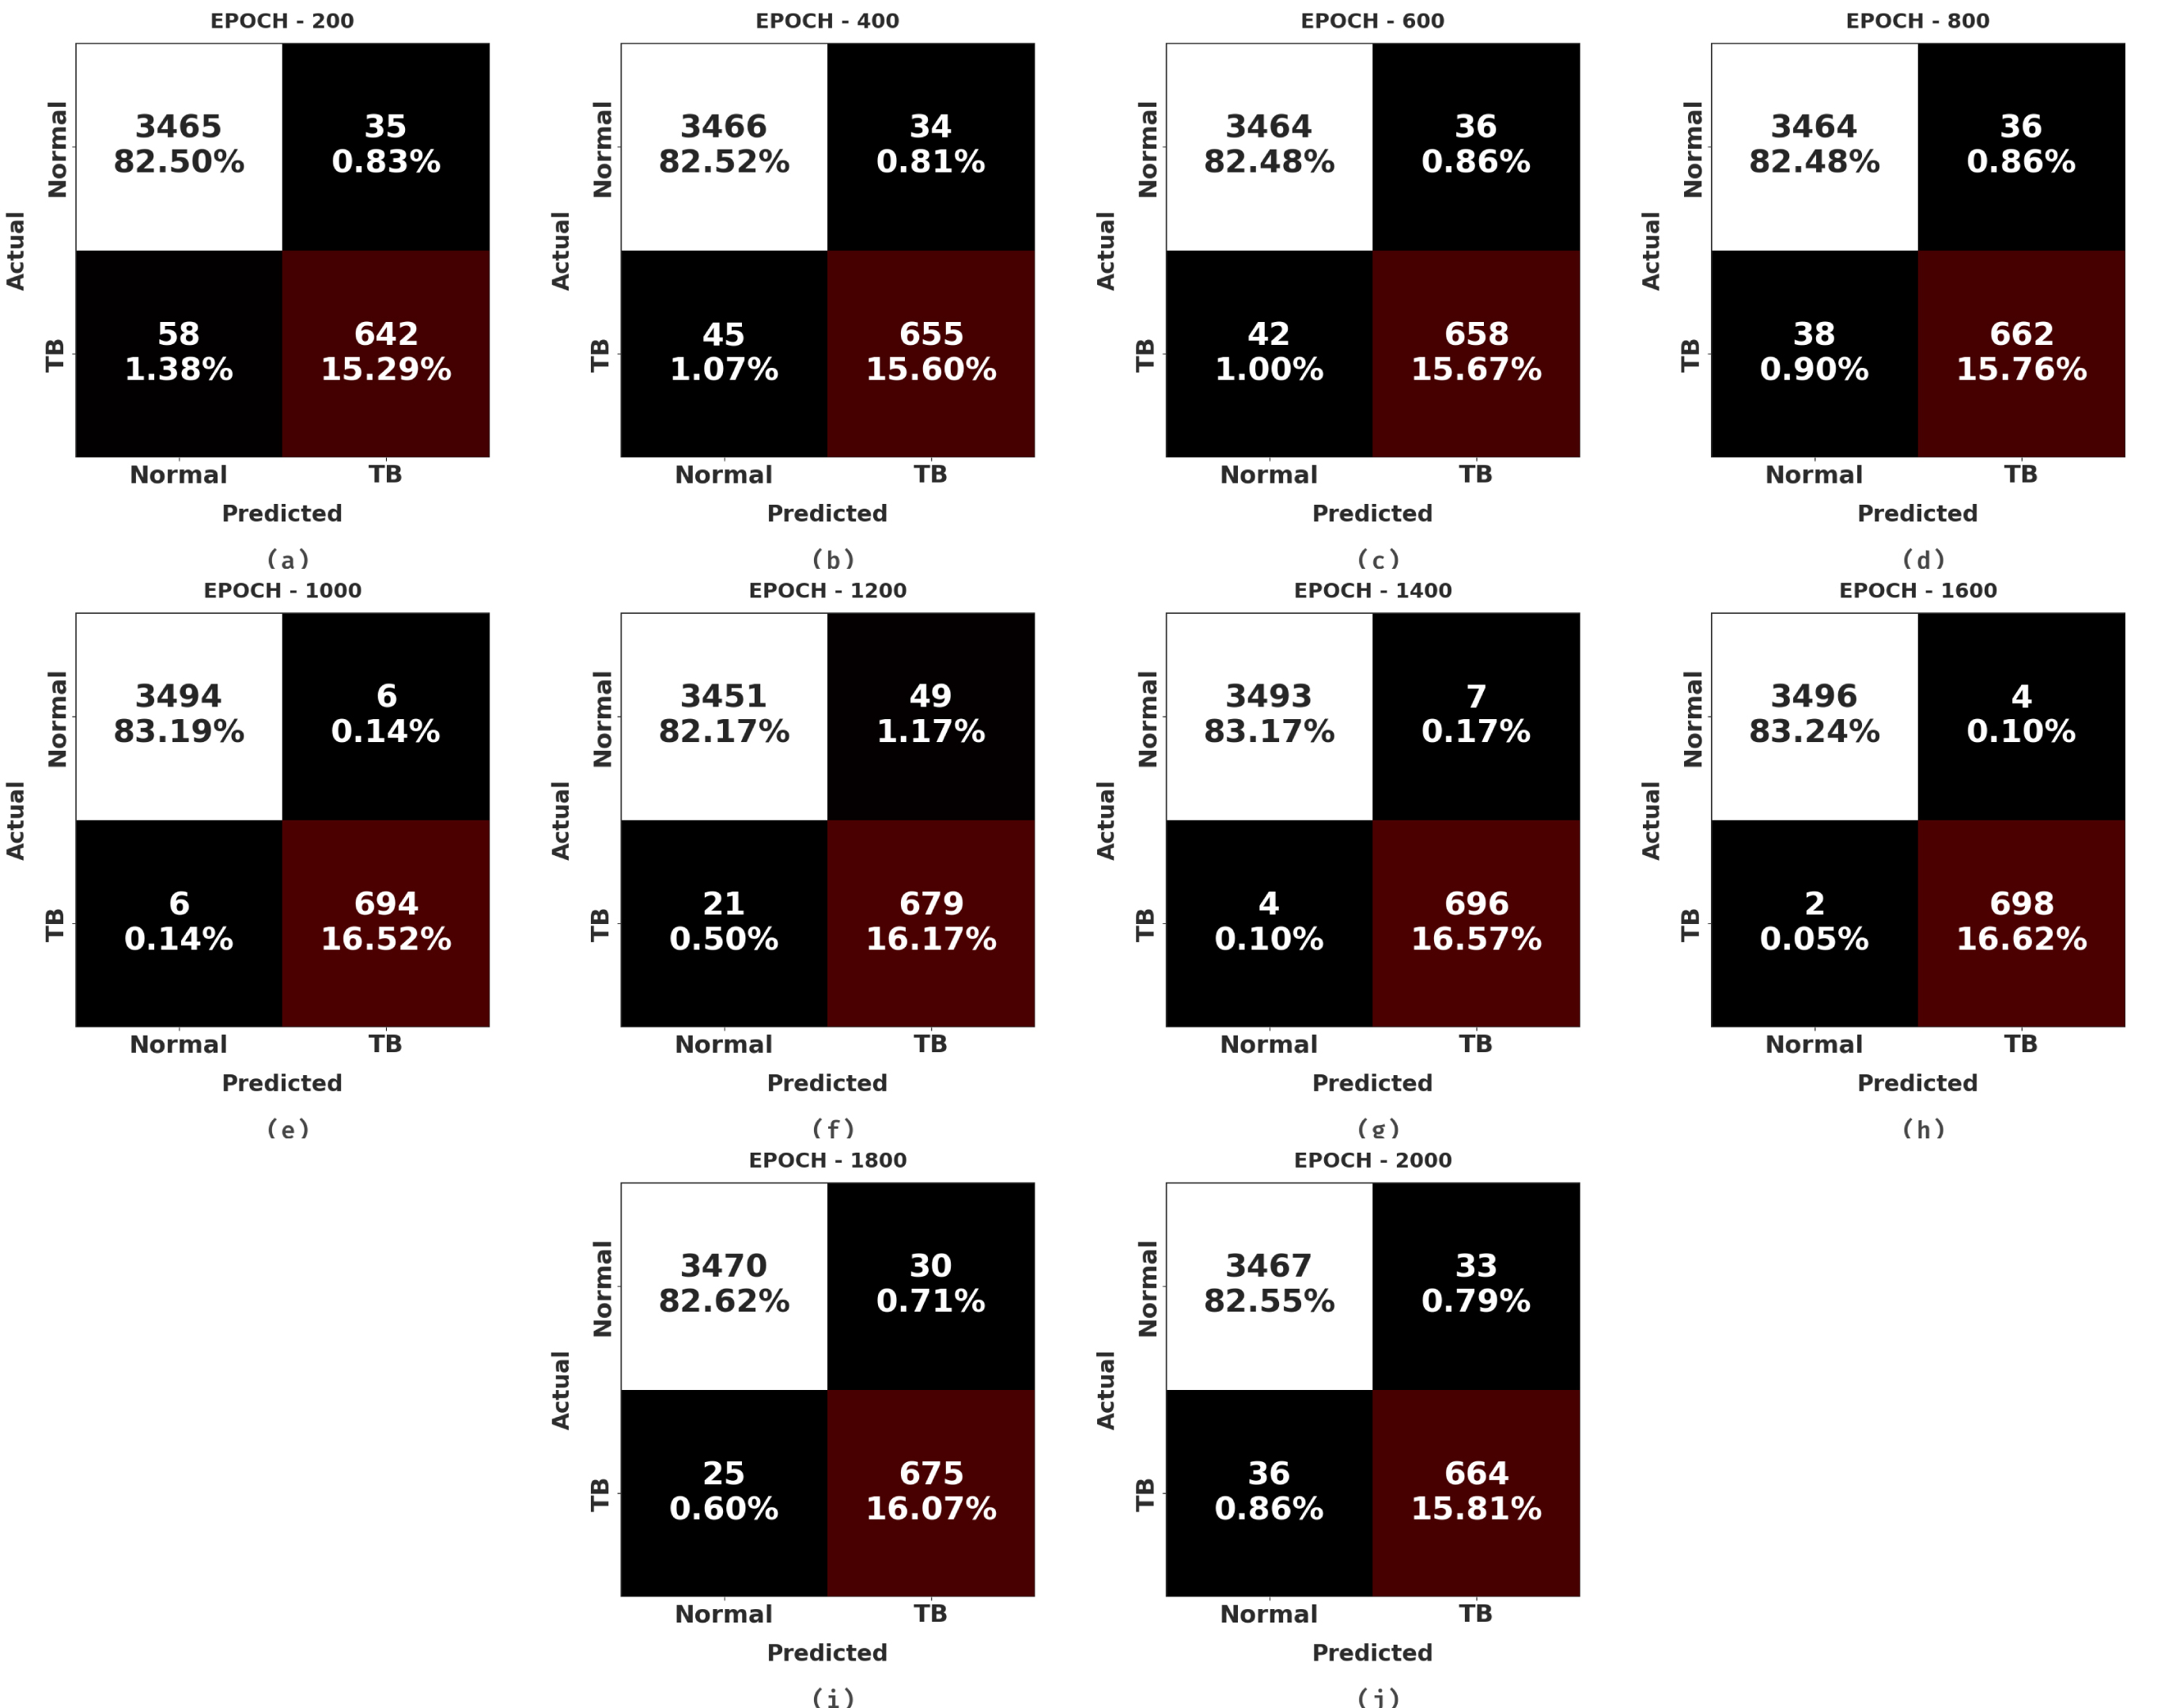
Confusion matrices of ESOA-DFFTC approach (a– j) Epochs 200– 2000.
In Table 2 and Fig. 4, a comprehensive TB classifier performance of the ESOA-DFFTC approach is tester under several epochs. The outputs report that the ESOA-DFFTC model explored TB and normal class.
TB classification output of ESOA-DFFTC method under several epochs
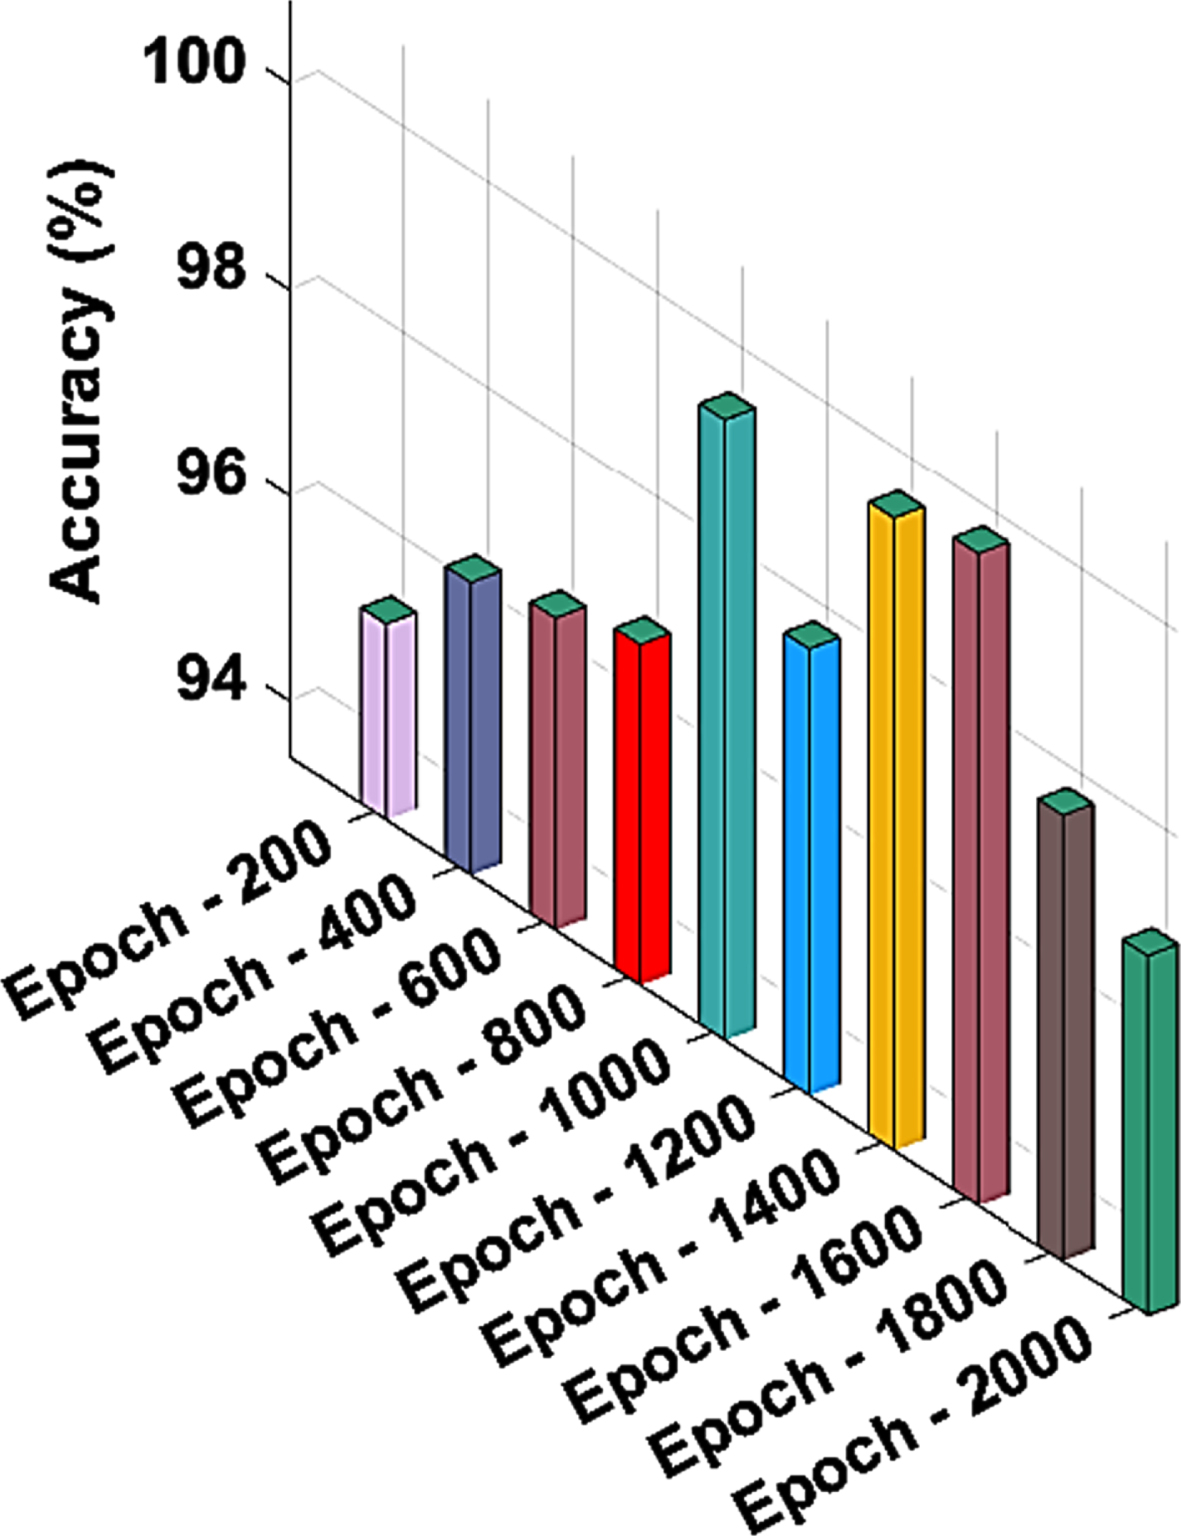
Accu y output of ESOA-DFFTC technique under several epochs.
With 200 epochs, the ESOA-DFFTC method obtains an average accu bal of 95.36%, sens y of 95.36%, spec y of 95.36%, F score of 95.96%, and MCC of 91.94%. Likewise, with 600 epochs, the ESOA-DFFTC method attains average accu bal of 96.49%, sens y of 96.49%, spec y of 96.49%, F score of 96.65%, and MCC of 93.29%. Similarly, with 2000 epochs, the ESOA-DFFTC method attains average accu bal of 96.96%, sens y of 96.96%, spec y of 96.96%, F score of 97.04%, and MCC of 94.08%.
The TLOS value and VLOS value of the ESOA-DFFTC methodology are examined on TB achievement in Fig. 5. The output demonstrates that the ESOA-DFFTC methodology has portrayed an improved achievement with the minimum TLOS value and VLOS value. The ESOA-DFFTC method has given an outcome in decreased VLOS outputs.
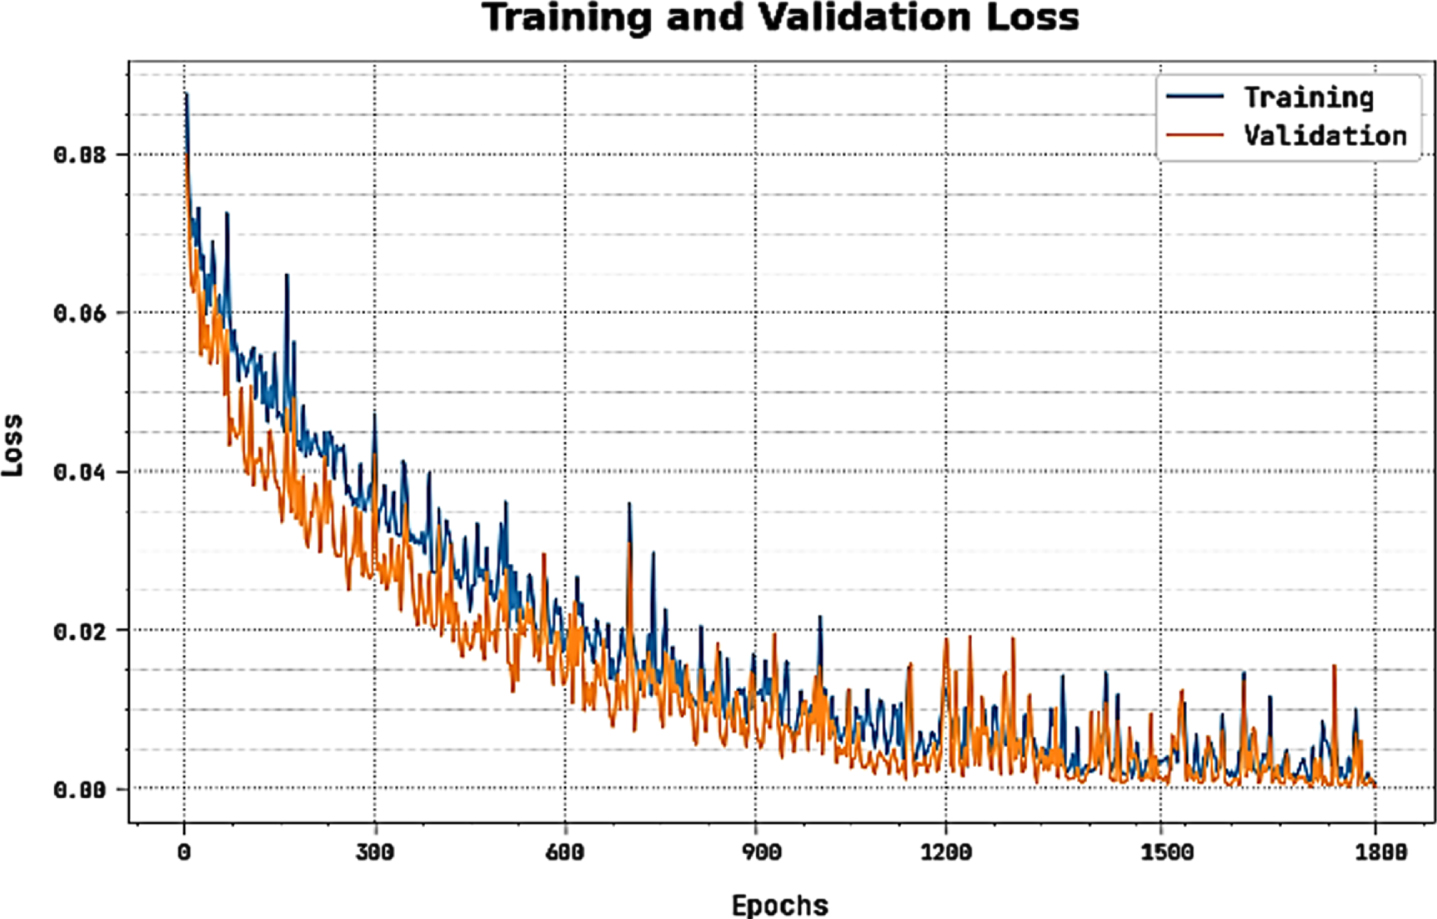
TLOS and VLOS output of ESOA-DFFTC technique.
A precise Prec n - Reca l study of the ESOA-DFFTC technique under the testing dataset is stated in Fig. 6. The outputs depicted that the ESOA-DFFTC technique has given an outcome in improved Prec n - Reca l values under the total classes.
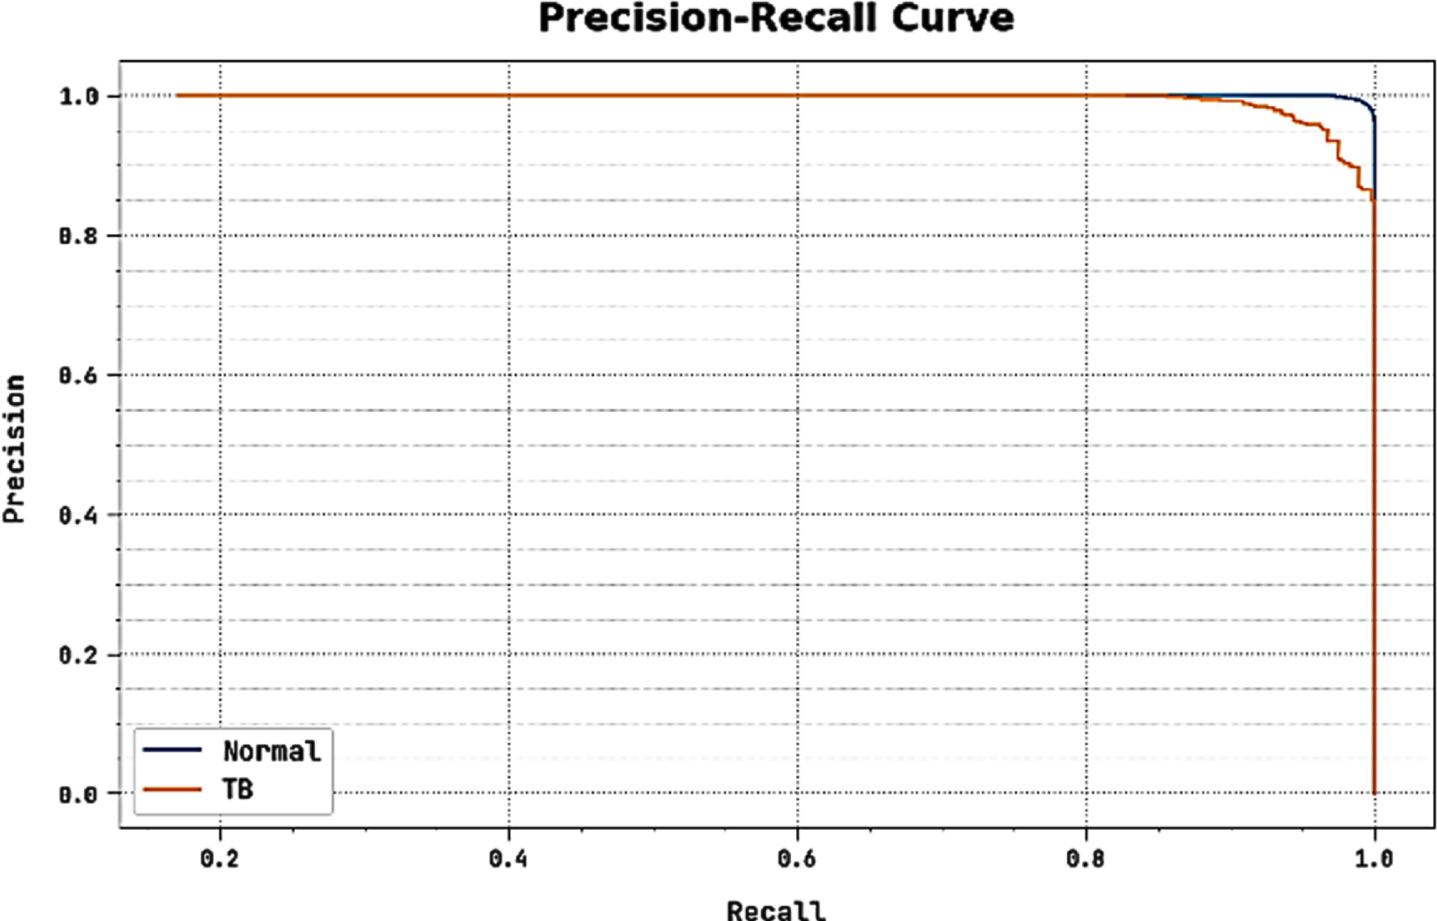
Prec n - Reca l output of ESOA-DFFTC technique.
A short ROC study of the ESOA-DFFTC technique under the testing dataset is depicted in Fig. 7. The outputs depicted the ESOA-DFFTC technique has depicted its capacity in categorizing dissimilar classes.
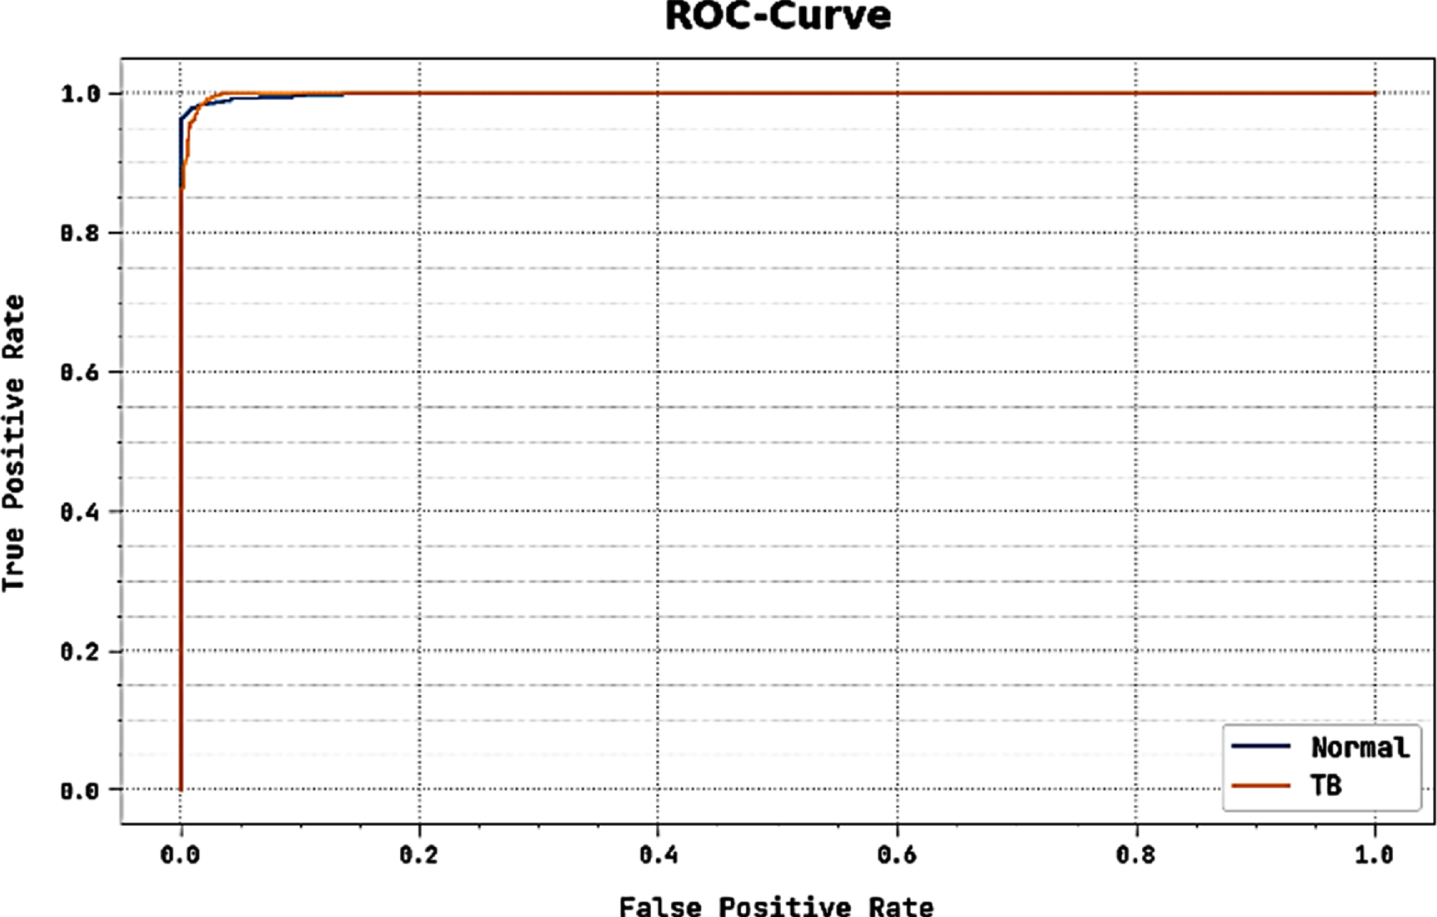
ROC curve output of ESOA-DFFTC methodology.
Table 3 shows relative accu y testing of the ESOA-DFFTC model with recent methods [28]. The investigational values indicate that the ResNet-18 technique attains a lower accu y of 96.53%. Then, the ResNet-50 and ResNet-101 methods accomplish slightly enhanced accu y of 97.63% and 97.98% respectively. Meanwhile, the Inception-v3, VGG-19, and DenseNet-201 methods accomplish closer accu y of 98.91%, 98.60%, and 98.32% respectively. But the ESOA-DFFTC technique gains a maximum accu y of 99.80%.
Accuracy analysis of ESOA-DFFTC methodology with recent systems
Lastly, a brief Computation Time (CT) examination of the ESOA-DFFTC methodology is reported in Table 4. The table values demonstrate that the ESOA-DFFTC methodology reaches effectual outcomes with a minimal CT of 8.17 s. It is noticed that the ESOA-DFFTC method outperforms all the other models which attained increased CT values. The above-mentioned experimental result demonstrates that the ESOA-DFFTC method accomplishes the highest classification performance on TB diagnosis.
CT analysis of ESOA-DFFTC approach\\ with current techniques
In the current research, a novel ESOA-DFFTC method is presented for automated TB classification on CXR images. This ESOA-DFFTC method exploited the concepts of feature fusion and hyperparameter tuning process for TB classification. Primarily, the ESOA-DFFTC technique utilized the GF approach for image-denoising purposes. Followed by, the ESOA-DFFTC technique carried out the feature fusion process using three DL models namely ResNeXt-50, MobileNetv2, and Xception. For enhancing the performance of the DL models, the ESOA-based hyperparameter optimizer is implemented in the study. For TB classification, the ESOA-DFFTC method uses an Arithmetic Optimization Algorithm (AOA) with Weight-Dropped Long Short-Term Memory (WDLSTM) method. The experimental output of the ESOA-DFFTC system is tested on a benchmark medical imaging database. A wide comparative investigation stated the greater achievement of the ESOA-DFFTC system over other current systems.
Declarations
Ethical approval
Not Applicable.
Competing interests
Authors confirm that they have no competing interest.
Authors’ contributions
Manivannan – Data Collection, Conceptualization
Manivannan – Data Curation, Investigation
Sathiamoorthy – Validation, Editing
Sathiamoorthy – Review and Editing
Funding
Not Applicable.
Availability of data and materials
Data can be given upon request.