






Abstract
BACKGROUND:
Insulin sensitizers have been used to treat Type 2 diabetes. However, their non-negligible side effects have led to cardiovascular concerns and the withdrawal of a member, rosiglitazone.
OBJECTIVE:
We combined conjugated linoleic acid (CLA) with rosiglitazone to test for amelioration of side effects posed by rosiglitazone in vivo.
METHODS:
We utilized ApoE null mice fed with Western diet (WD) to test our hypothesis. Mice were fed WD, with or without CLA administration, for 12 weeks. CLA utilized in our study consisted of a 1:1 ratio of 95% pure c9,t11, and t10,c12 isomers at a concentration of 0.1% w/v in fat-free milk. Starting from Week 12, select mice received rosiglitazone.
RESULTS:
It was found that mice receiving CLA from Week 0 and rosiglitazone from Week 12 had the lowest body weight and exacerbated hepatomegaly. Although these mice had attenuated insulin resistance compared to mice receiving only Western diet, they display a marked increase in total plasma cholesterol and low-density lipoprotein (LDL) cholesterol. Mice receiving early CLA administration developed hyperleptinemia, which was not restored by rosiglitazone.
CONCLUSION:
Taken together, against the background of ApoE null genotype and WD feeding, simultaneous administration of 1:1 CLA and rosiglitazone led to dyslipidemic lipoatrophy.
Keywords
Introduction
Insulin is one of the key hormones that tightly regulate blood glucose concentration following food consumption or deprivation. It has been well established that impairments in metabolic functions of insulin cause insulin resistance (IR) and are strongly linked with the progression of chronic metabolic diseases, including obesity and type 2 diabetes mellitus (T2DM). The onset of IR in T2DM is frequently accompanied by diabetic dyslipidemia, potentially leading to atherosclerosis and cardiovascular events [1, 2]. Of note, the risks of cardiovascular death in T2DM are even higher. While the therapeutics available to combat T2DM has evolved positively in recent years, with many novel molecular target-based drugs, the safe use and the management of non-negligible adverse effects of these agents in clinics remains a concern.
Classes of anti-diabetic drugs with distinct mechanisms of actions are available as treatment options [3, 4]. They include insulin sensitizers divided into biguanides and thiazolidinediones; and insulin secretagogues divided into sulfonylureas, meglitinides, incretin mimetics and dipeptityl peptidase-4 inhibitors.
Insulin sensitizers belong to the class of thiazolidinediones, commonly known as glitazones, are one of the most potent anti-diabetics available. They are prescribed to T2DM patients to increase tissue responsiveness to insulin. Mechanistically, insulin sensitizers bind to peroxisome proliferator-activated receptor gamma (PPARγ) in adipose tissues [5]. The activation of PPARγ suppresses lipolysis and decreases plasma-free fatty acid levels, leptin, and tumor necrosis factor-α. Conversely, PPARγ activation induce adiponectin secretion to increase global insulin sensitivity [6]. The major side effects of this class of drugs are increase in low-density lipoprotein (LDL) cholesterol, weight gain, oedema, anaemia, and congestive heart failure [7, 8]. Many clinical investigators have repeatedly questioned the safety of glitazones. Data from a meta-analysis indicated the association of rosiglitazone with an increase in myocardial infarction and other cardiovascular risks [9]. Particularly, rosiglitazone has been shown to exacerbate atherogenicity by increasing circulating LDL concentration [10, 11]. Transcriptional profiling of rosiglitazone treated diabetic heart has dysregulated electrophysiology and plaque rupture and aberrant modulation of endogenous cardiac function [12]. Another group found that rosiglitazone, but not pioglitazone, induced the expression of cardiac stress markers, namely atrial and B-type natriuretic peptides [13]. Furthermore, they have also found that rosiglitazone downregulated PPARα and PGC-1α target genes, leading to a shift from fatty acid to glycolytic metabolism in cardiac muscles for energy, in turn causing pathological heart hypertrophy and failure [13]. With this regard, efforts are underway to improve the cardiovascular safety of glitazones. Thus, medication, nutrition, and functional food-based interventions to manage the adverse effects of antidiabetics, including glitazones have been prescribed, and scientific testing is continuing with several novel approaches.
Conjugated linoleic acids (CLA) are positional isomers of linoleic acid, in which the cis-9, trans-10 (c9,t11) isomer is predominant in nature. The trans-10, cis-12 (t10,c12) isomer is found mainly in artificial preparations. Intriguingly, the findings that CLA binds PPARγ at a much lower affinity than rosiglitazone [14, 15]. It is known that both c9,t11-CLA and t10,c12-CLA are partial agonists of all PPAR subtypes [16]. We have shown that administration of CLA decreased hepatic glucose production in vitro [17] and reduced insulin resistance in vivo [18].
Obesity is associated with metabolic syndrome and diabetes. Since CLA is readily available as an over the counter weight loss supplement, typically as 1:1 mixture of c9,t11 and t10,c12 isomers, we propose to test its safety in conjunction with rosiglitazone, an anti-diabetic medication. Our question was investigated using Apolipoprotein E (ApoE) null mice fed with Western diet.
Materials and methods
Animal care and treatment
Animal work was conducted at Satellite Animal Facility, Department of Pharmacology at University of Malaya under Institutional Animal Care and Use Committee approval number #2015-180908/PHAR/R/DDM dated September 30, 2015. The detailed schematic study design of the study is shown in Fig. 1.
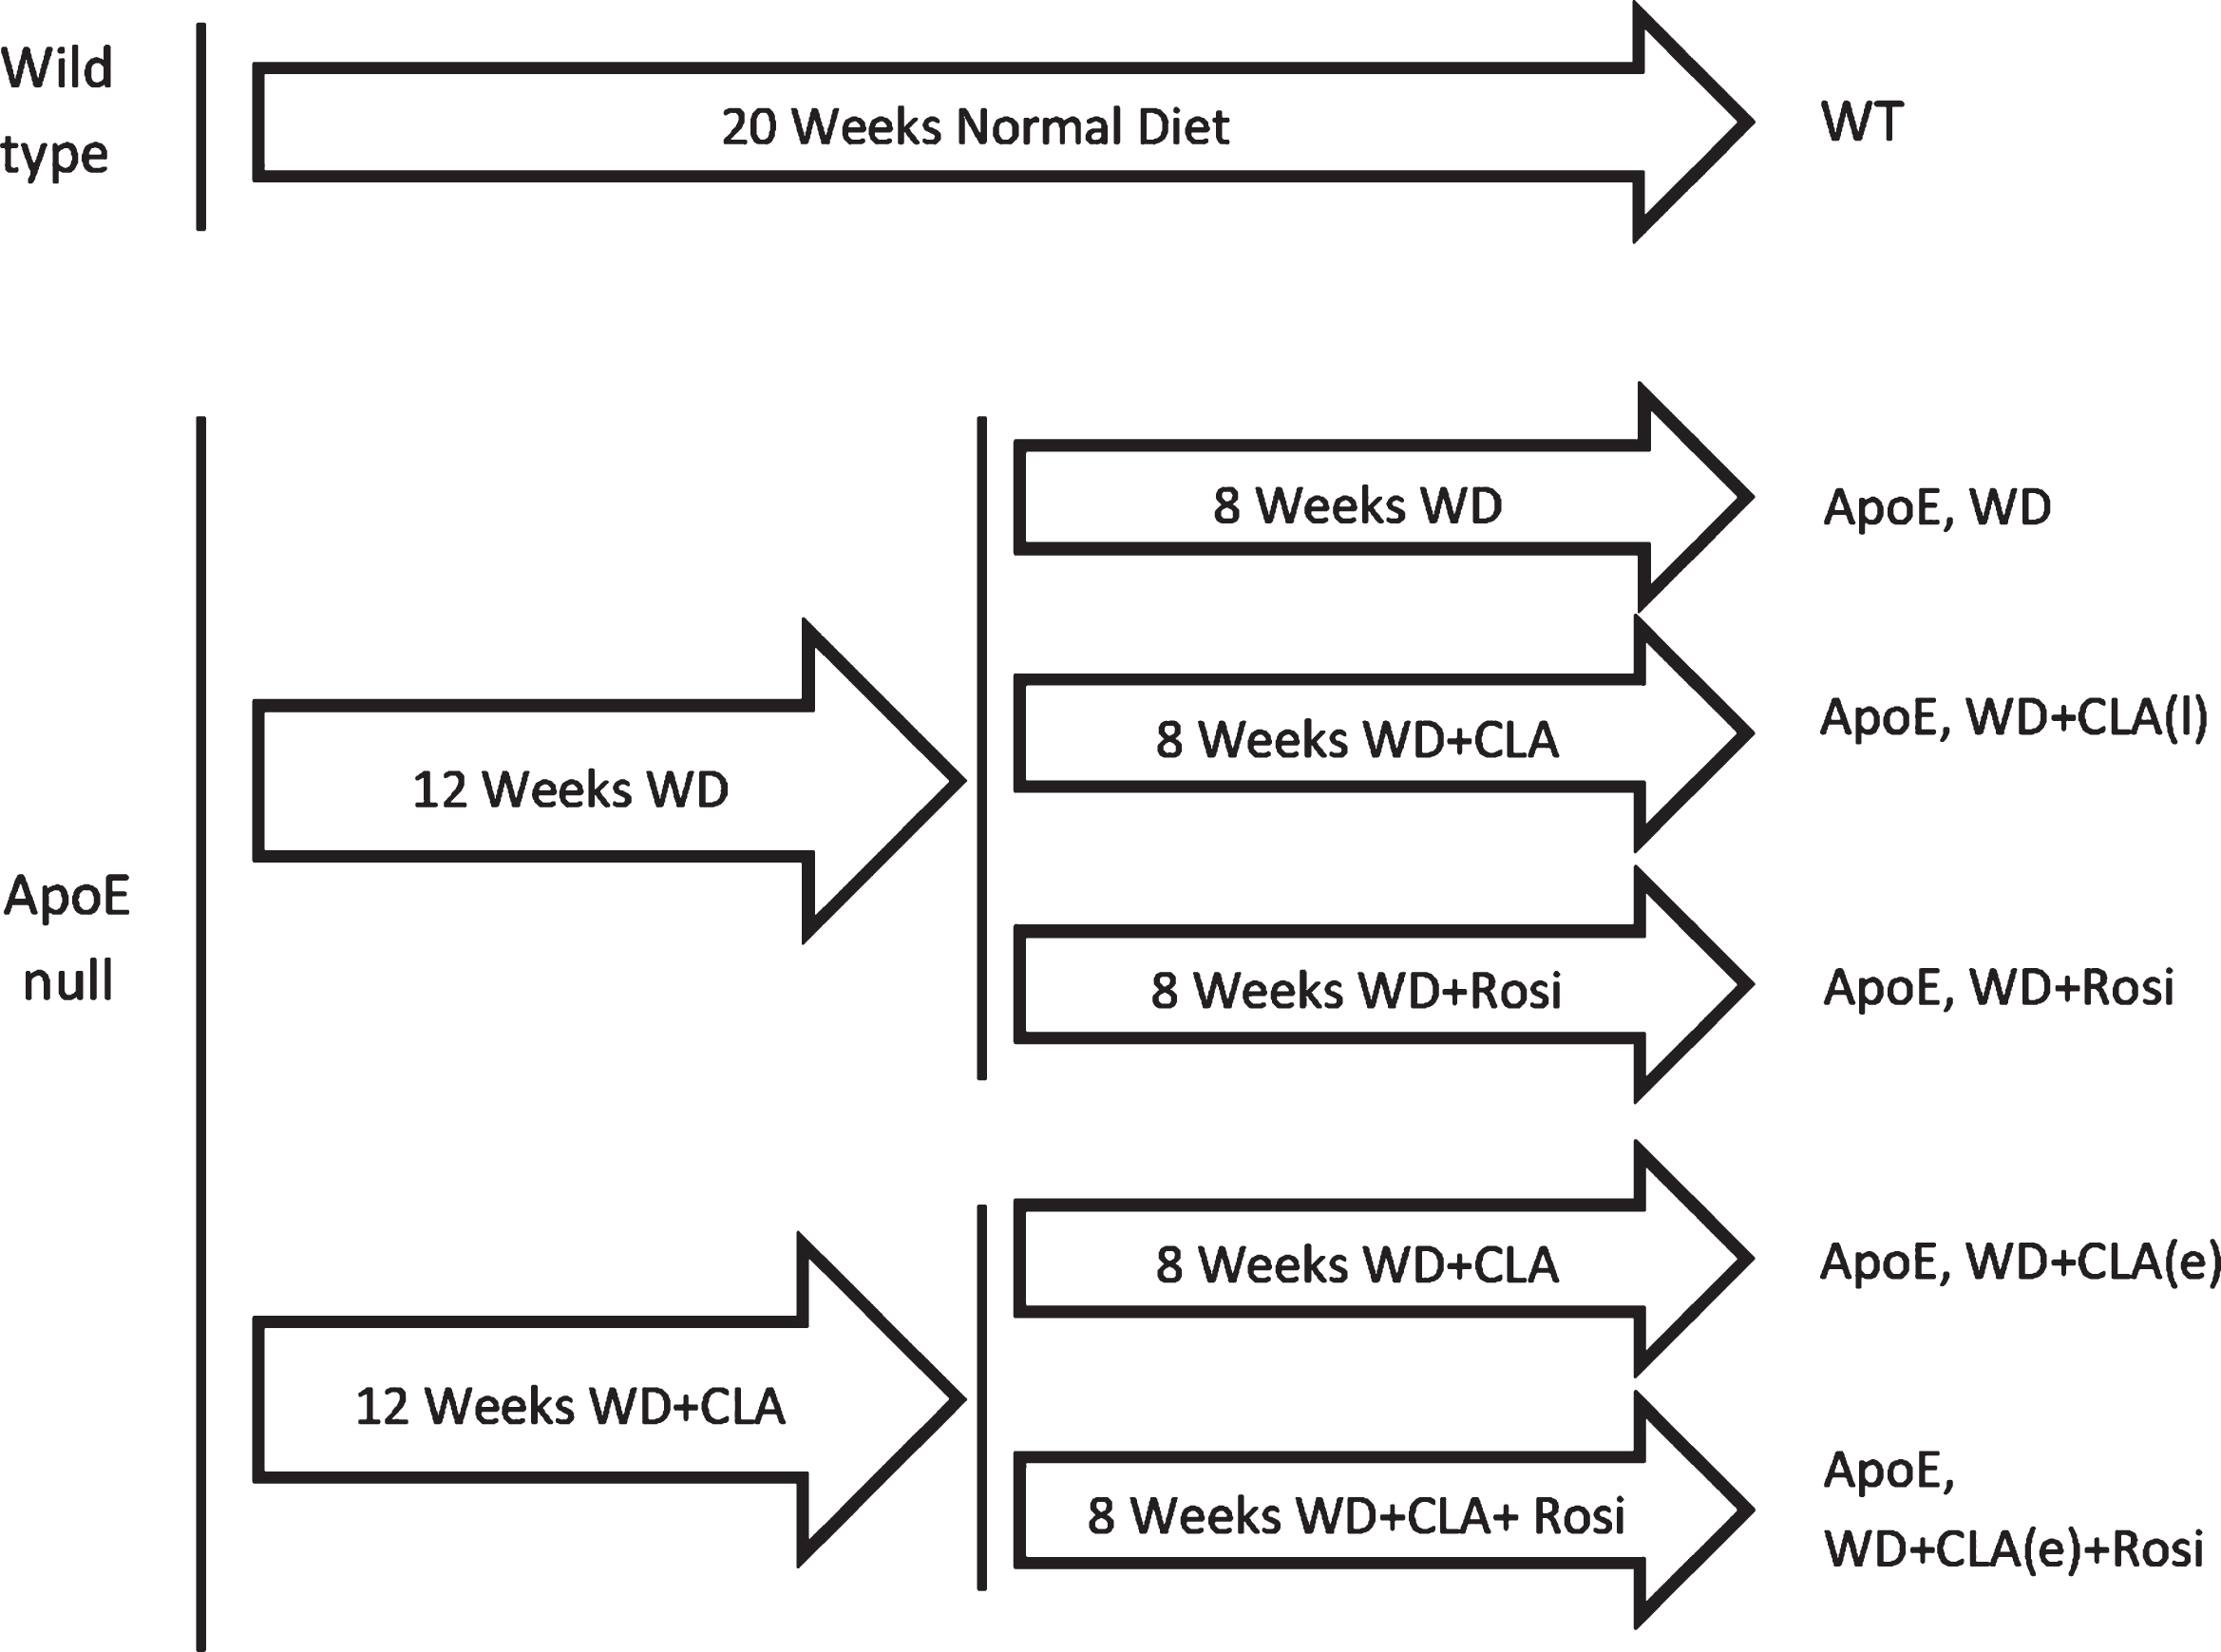
Schematic of the study indicating animal grouping and timing of the study. Wild-type (WT) mice were fed a regular diet throughout the study (WT, ND). ApoE null mice were fed a Western diet (WD), selected mice received CLA by oral gavage from Week 0 for 12 weeks. On Week 12, ApoE null mice fed WD were further divided to continue WD (ApoE + WD), or receive intraperitoneal rosiglitazone injection (ApoE + Rosi) or CLA [ApoE + CLA(l)] for 8 weeks. ApoE null mice receiving CLA from Week 0 (early CLA treatment) were further divided to continue receiving CLA treatment [ApoE + CLA(e)] or receiving rosiglitazone (ApoE + CLA(e) + Rosi) for eight weeks.
ApoE is one of the lipoproteins associated with chylomicron remnants and selects HDL particles that bind to LDL receptors to mediate lipid uptake into target cells [60]. The ablation of ApoE leads to hypercholesterolemia and atherosclerosis. Briefly, ApoE null and wild-type mice on a C57BL6/J background were purchased from Taconic Biosciences, USA. Male mice were used because they were more susceptible to developing metabolic ailments than female mice [19]. Mice were housed in groups of three to four per cage. Eight weeks old mice were acclimatized for one week to minimize stress and stabilize all metabolic conditions. 10 mice were allocated to each treatment group. Wild-type mice were fed a normal diet (Altromin #1324), and ApoE null mice were fed a Western diet (Research Diets, D12079B). The Western diet contains 0.21% cholesterol and differed from other high-fat diets. The composition of diets is listed in Table S1. All mice had access to food and water ad libitum. The ApoE null mice were divided into two groups and administered intragastric (IG) either with 200μL of 0.9% saline (ApoE, WD) or 200μL of 0.1% w/v CLA (Nu Chek Prep, UC-59-AX) mixture (1:1 mixture of c9,t11 and t10,c12 isomers at 95% purity) in 5% fat-free milk (ApoE, WD-CLA) for 12 weeks. The CLA dose was based on the human consumption equivalent, which amounted to 1 –2 % dietary weight. On average, a mouse consumes approximately 2 –3 g of food per day. The dose was adjusted and maintained, not exceeding 3 mg/mouse/day. On the 13th Week, the ApoE, WD was further divided into three groups and treated for eight weeks as follows, ApoE-WD: 200μL of 0.9% saline, IG + 100μL of 0.9% saline, intraperitoneal (IP); ApoE, WD + CLA(l): 200μL of 0.1% w/v CLA in 5% fat-free milk, IG + 100μL of 0.9% saline, IP and ApoE, WD + Rosi: 200μL of 0.9% saline, IG + 0.6 mg/kg rosiglitazone (Tokyo Chemicals, R0106-1 g), IP. Likewise, the ApoE, WD-CLA group further divided in to two groups and treated for 8 weeks as follows, ApoE, WD + CLA(e): 200μL of 0.1% w/v CLA in 5% fat free milk, IG + 100μL of 0.9% saline, IP and ApoE, WD + CLA(e) + Rosi: 200μL of 0.1% w/v CLA in 5% fat free milk, IG + 0.6 mg/kg rosiglitazone, IP. The optimal dose for CLA and rosiglitazone were derived based on previous literature [20, 21].
The body weight and food intake were monitored weekly. An oral glucose tolerance test was performed at Week 19 by delivering 100 mg/mL glucose solution at 2 g/kg body weight via oral gavage [18]. At the end of the study (Week 20), all mice were fasted for one day and sacrificed by carbon dioxide asphyxiation. Blood was collected by intracardiac puncture, processed into serum, and stored at –20°C until further analysis. The excised liver and fat pads were weighed and recorded.
Blood glucose was measured using the tail prick method using Accu Chek Performa test strips (Roche). Mouse serum was assayed for hormone levels with respective kits for insulin (Merck, EZRMI-13K), leptin (Merck, EZMADP-60K), and adiponectin (Merck, EZML-82K). Assays were performed using the manufacturer’s recommendations.
Homeostatic model assessment of insulin resistance (HOMA-IR) was calculated by multiplying blood glucose in mg/dL and insulin concentration in mU/L, and the product divided by 405 [22]. Quantitative insulin sensitivity check index (QUICKI) was calculated by adding the respective logarithms of blood glucose in mg/dL, insulin in mU/L, then taking the reciprocal of the sum of logarithms [23]. Revised quantitative insulin sensitivity check index (QUICKI-FFA) incorporates an additional parameter of free fatty acids (FFA) in nmol/μL [24].
Serum lipid levels
Mouse serum was assayed for total cholesterol, LDL, and HDL with HDL and LDL quantitation kit (BioVision, K613-100). Free fatty acid was assayed with Free Fatty Acid Quantitation Kit (BioVision, K612-100) and total triacylglycerols with Triglyceride Quantitation Kit (K622-100). Assays were performed according to the manufacturer’s recommendations.
Calculations and statistical analysis
The number of samples ranges from four to seven per group (4≤n≤7). All data were presented as mean±SEM. Statistical significance between groups was determined using one-way ANOVA followed by Tukey’s post-hoc tests. Blood glucose data were tested using student’s t-test. Other time series data were tested using repeated measures one-way ANOVA followed by Tukey’s post-hoc tests. For body weight data, statistical significance was determined using two-way ANOVA followed by Tukey’s post-hoc tests. Statistical tests and charts were prepared using Prism 7 (GraphPad Software).
Results
Mice survival
Initially, ten mice were allocated into each treatment group. At Week 12, two mice were sacrificed from the groups of ND; ApoE, WD, and ApoE, WD + CLA(e). At the end of the study, the number of surviving mice in each treatment group were: 5 in ND; 5 from ApoE, WD; 5 in ApoE, WD + Rosi; 7 in ApoE, WD + CLA(l); 7 in ApoE, WD + CLA(e); 5 in ApoE, WD + CLA(e) + Rosi.
Body weight and energy intake
It could be observed that body weight increased due to WD feeding, and supplementation with either CLA or rosiglitazone led to the reduction. The body weight of 8-9 weeks old ApoE null mice was approximately 2 grams lower than their wild-type counterparts of the same age (baseline start week 0, data not shown). However, at the end of the study (week 20), wild-type mice hovered at an average of 28 g (Fig. 2), whereas the average body weight of ApoE, WD mice increased by 1.6 folds at approximately 46 g (Fig. 2a).
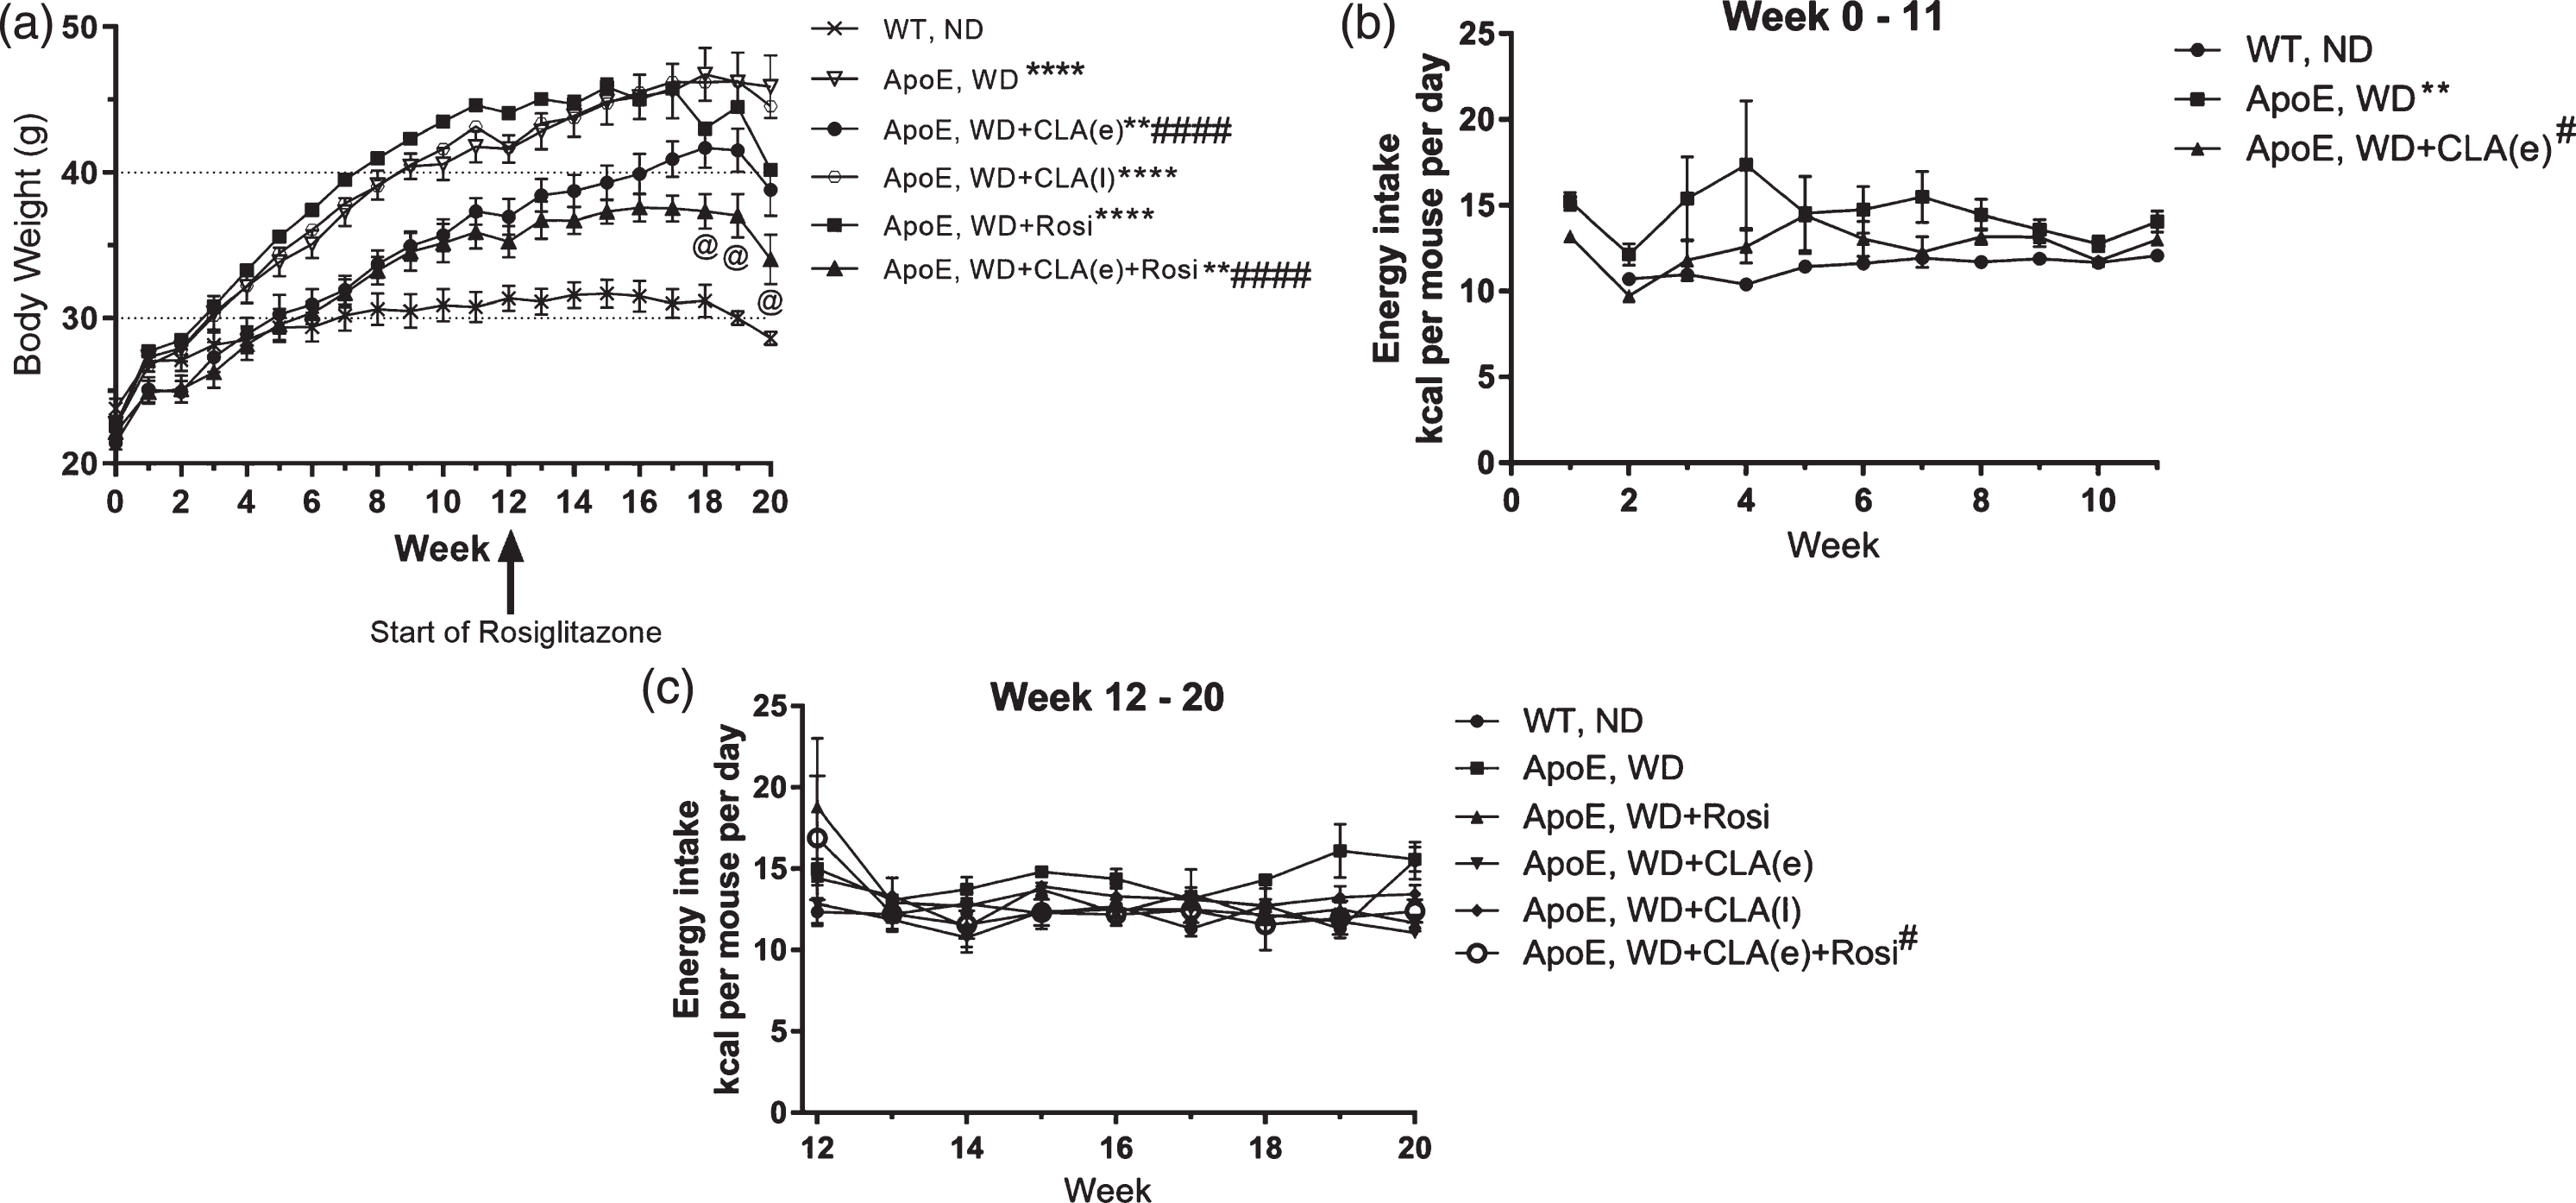
Body weight and energy intake of all mice from Week 0 to Week 20. (a) Body weight of mice. Mice were weighed weekly. Data were presented as mean±SEM and analysed using repeated measure one-way ANOVA. *p < 0.05 vs. WT, ND; #p < 0.05 vs. ApoE, WD; @ p < 0.05 for WD + CLA(e) and ApoE, WD + CLA(e) + Rosi at corresponding time point only, measured using two-way ANOVA. n = 5 –7 per group. (b) Energy intake from Week 0 to Week 11 of study (c) Energy intake from Week 12 to Week 20 of study. At each time point, the Week’s energy intake was obtained for each cage by measuring the weight difference of food and average energy intake per mice calculated. Data were presented as mean±SEM and analysed by one-way ANOVA followed by Tukey’s post-hoc test. **p < 0.01 vs. WT, ND; #p < 0.05 vs. ApoE, WD.
Administering CLA mixture from the beginning in ApoE, WD + CLA(e) group caused 15.5% reduction compared to ApoE, WD and further treatment with rosiglitazone in ApoE, WD + CLA(e) + Rosi from Week 12 onwards caused an additional 14% reduction of body weight (Fig. 2a). When ApoE, WD + CLA(e) + Rosi were compared to ApoE, WD, a 25.9% reduction in body weight was recorded (Fig. 2a). Late administration of CLA or rosiglitazone did not affect body weight in WD-fed ApoE null mice.
Before Week 12, energy intake differed significantly between wild type and ApoE, WD (p < 0.01, Fig. 2b); and between ApoE, WD and ApoE, WD + CLA(e) (p < 0.05, Fig. 2b). ApoE, WD had the most energy intake while wild-type mice had the least energy intake. After Week 12, only ApoE, WD and ApoE, WD + CLA(e) + Rosi differed in energy intake (p < 0.05, Fig. 2c).
Feeding WD diet to ApoE null mice led to hepatomegaly compared to wild-type mice (p < 0.05), but this increase in liver weight was compensated by increased body weight (Table 1). Treatment with any combination of CLA or rosiglitazone led to no change in liver weight compared to ApoE, WD. Representative samples of liver appearance are shown in Fig. S1. The appearance of wild-type mice fed ND was red-brown with no fatty deposition. Feeding WD to ApoE mice, regardless of treatments, led to fatty liver with characteristic light brown with liver enlargement. Fatty liver was the most severe in ApoE, WD + CLA(e) + Rosi group.
Organ weights of mice obtained after sacrifice at Week 20. Data are presented as
mean±SEM
Organ weights of mice obtained after sacrifice at Week 20. Data are presented as mean±SEM
*p < 0.05 vs. Wild type, ND; ***p < 0.001 vs. Wild type, ND; ****p < 0.0001 vs. Wild type, ND; #p < 0.05 vs. ApoE, WD. Wild type, ND: Wild type C57BL6/J fed Altromin 1324 diet. ApoE: Apolipoprotein E null mice. WD: Research Diet D12079B high fat, high cholesterol diet. Rosi: Daily injection of 0.6 mg/kg rosiglitazone from Week 12 to Week 20. CLA(e): Up to 3 mg/mouse of conjugated linoleic acid from Week 0 to Week 20. CLA(l): Up to 3 mg/mouse of conjugated linoleic acid Week 12 to Week 20.
The ApoE null mice fed with a WD had higher epididymal, perirenal, and mesenteric fat pads (Table 1) and increased adipose to body weight ratio than the normal diet-fed wild-type mice (Table 2). Single administration of either CLA or rosiglitazone did not reduce adipose weight caused by WD (Table 1). Nevertheless, simultaneous administration of early CLA and rosiglitazone led to reduced adipose weight, mainly in perirenal fat (Table 1). The difference was also reflected in the perirenal fat to body weight ratio (Table 2).
Organ weight to body weight ratio of mice. Data are presented as mean±SEM.
Organ weight to body weight ratio of mice. Data are presented as mean±SEM.
*p < 0.05 vs. Wild type, ND; **p < 0.01 vs. Wild type, ND; ****p < 0.0001 vs. Wild type, ND; #p < 0.05 vs. ApoE, WD. Wild type, ND: Wild type C57BL6/J fed Altromin 1324 diet. ApoE: Apolipoprotein E null mice. WD: Research Diet D12079B high fat, high cholesterol diet. Rosi: Daily injection of 0.6 mg/kg rosiglitazone from Week 12 to Week 20. CLA(e): Up to 3 mg/mouse of conjugated linoleic acid from Week 0 to Week 20. CLA(l): Up to 3 mg/mouse of conjugated linoleic acid Week 12 to Week 20.
No difference in glucose metabolism was detected across all groups. Administration of CLA and/or rosiglitazone led to no change in glucose homeostasis in WD-fed ApoE null mice. There was no difference in blood glucose at Week 0 and Week 20 across all groups (Fig. 3a). Although it was observed that ApoE, WD + CLA(e) had the greatest AUC for oral glucose tolerance test (OGTT) curve, no statistical significance was detected for oral glucose tolerance (Fig. 3b).
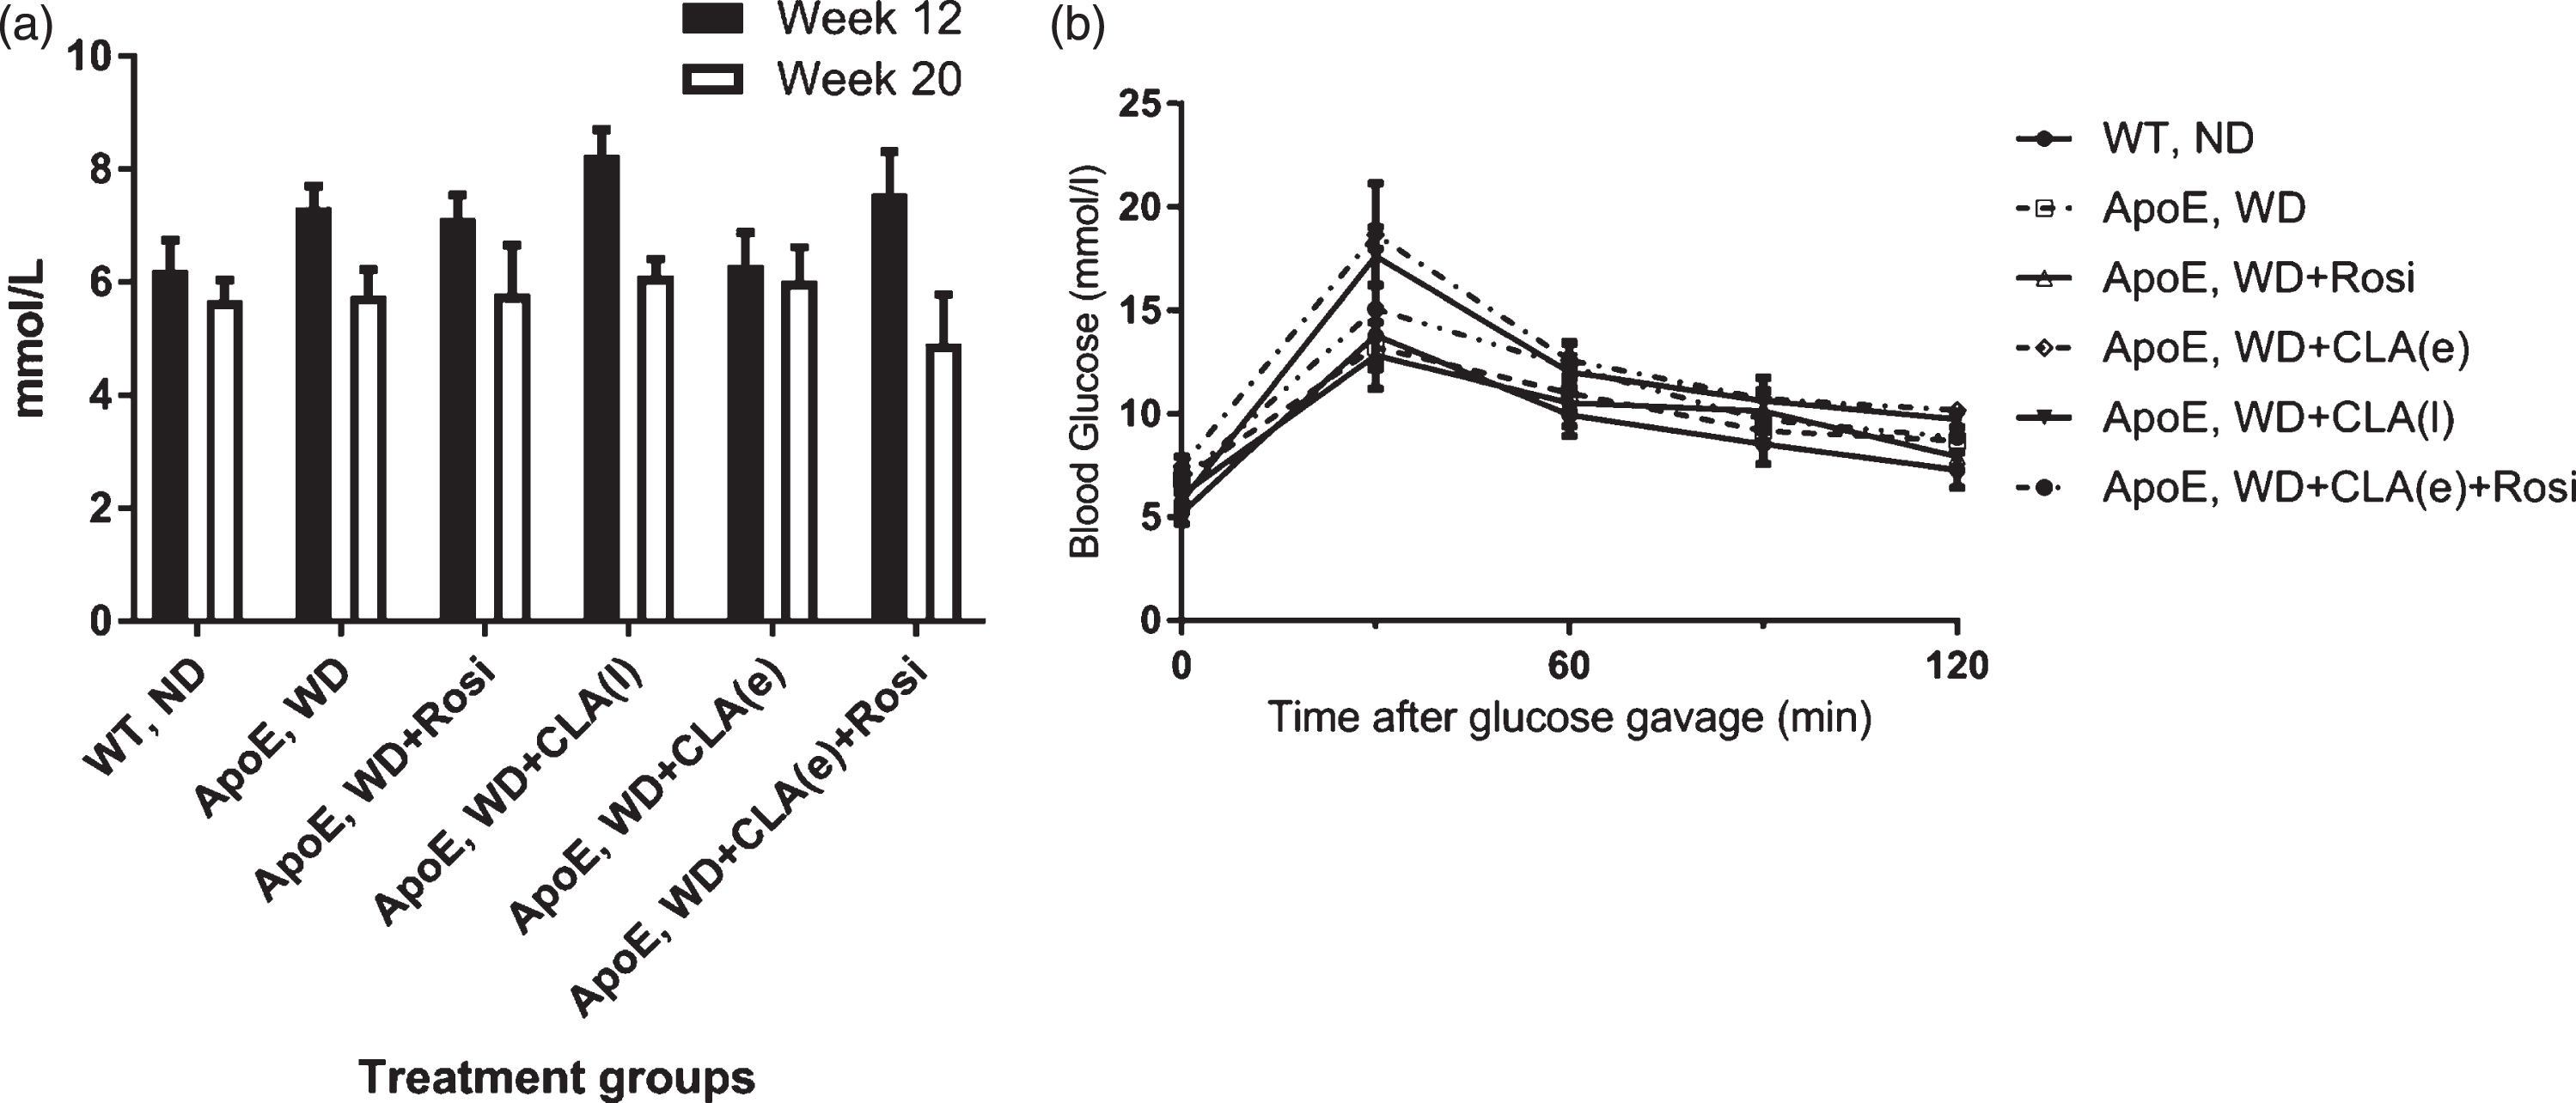
Glycemia of mice. (a) Fasting blood glucose of all groupings at Week 12 and 20. (b) Oral glucose tolerance test; mice received 2 g/kg body weight of 100 mg/ml by oral gavage. n = 5–7. Data were presented as mean±SEM and analysed by repeated measures one-way ANOVA.
A decrease in insulin resistance was observed in all rosiglitazone-treated groups. Feeding WD to ApoE null mice led to hyperinsulinemia, a 9.1-fold increase compared to wild-type mice fed a normal diet (Fig. 4a, p < 0.05). Early CLA administration did not alleviate hyperinsulinemia caused by WD (Fig. 4a). Late administration of CLA slightly reduced insulinemia (n.s. compared to either WT, ND and ApoE, WD, Fig. 4a). Treatment with rosiglitazone from Week 12 onwards relieved hyperinsulinemia caused by WD, a 62% reduction for ApoE, WD + Rosi, and 41.8% reduction for ApoE WD + CLA(e) + Rosi (n.s. vs. ApoE, WD, Fig. 4a).
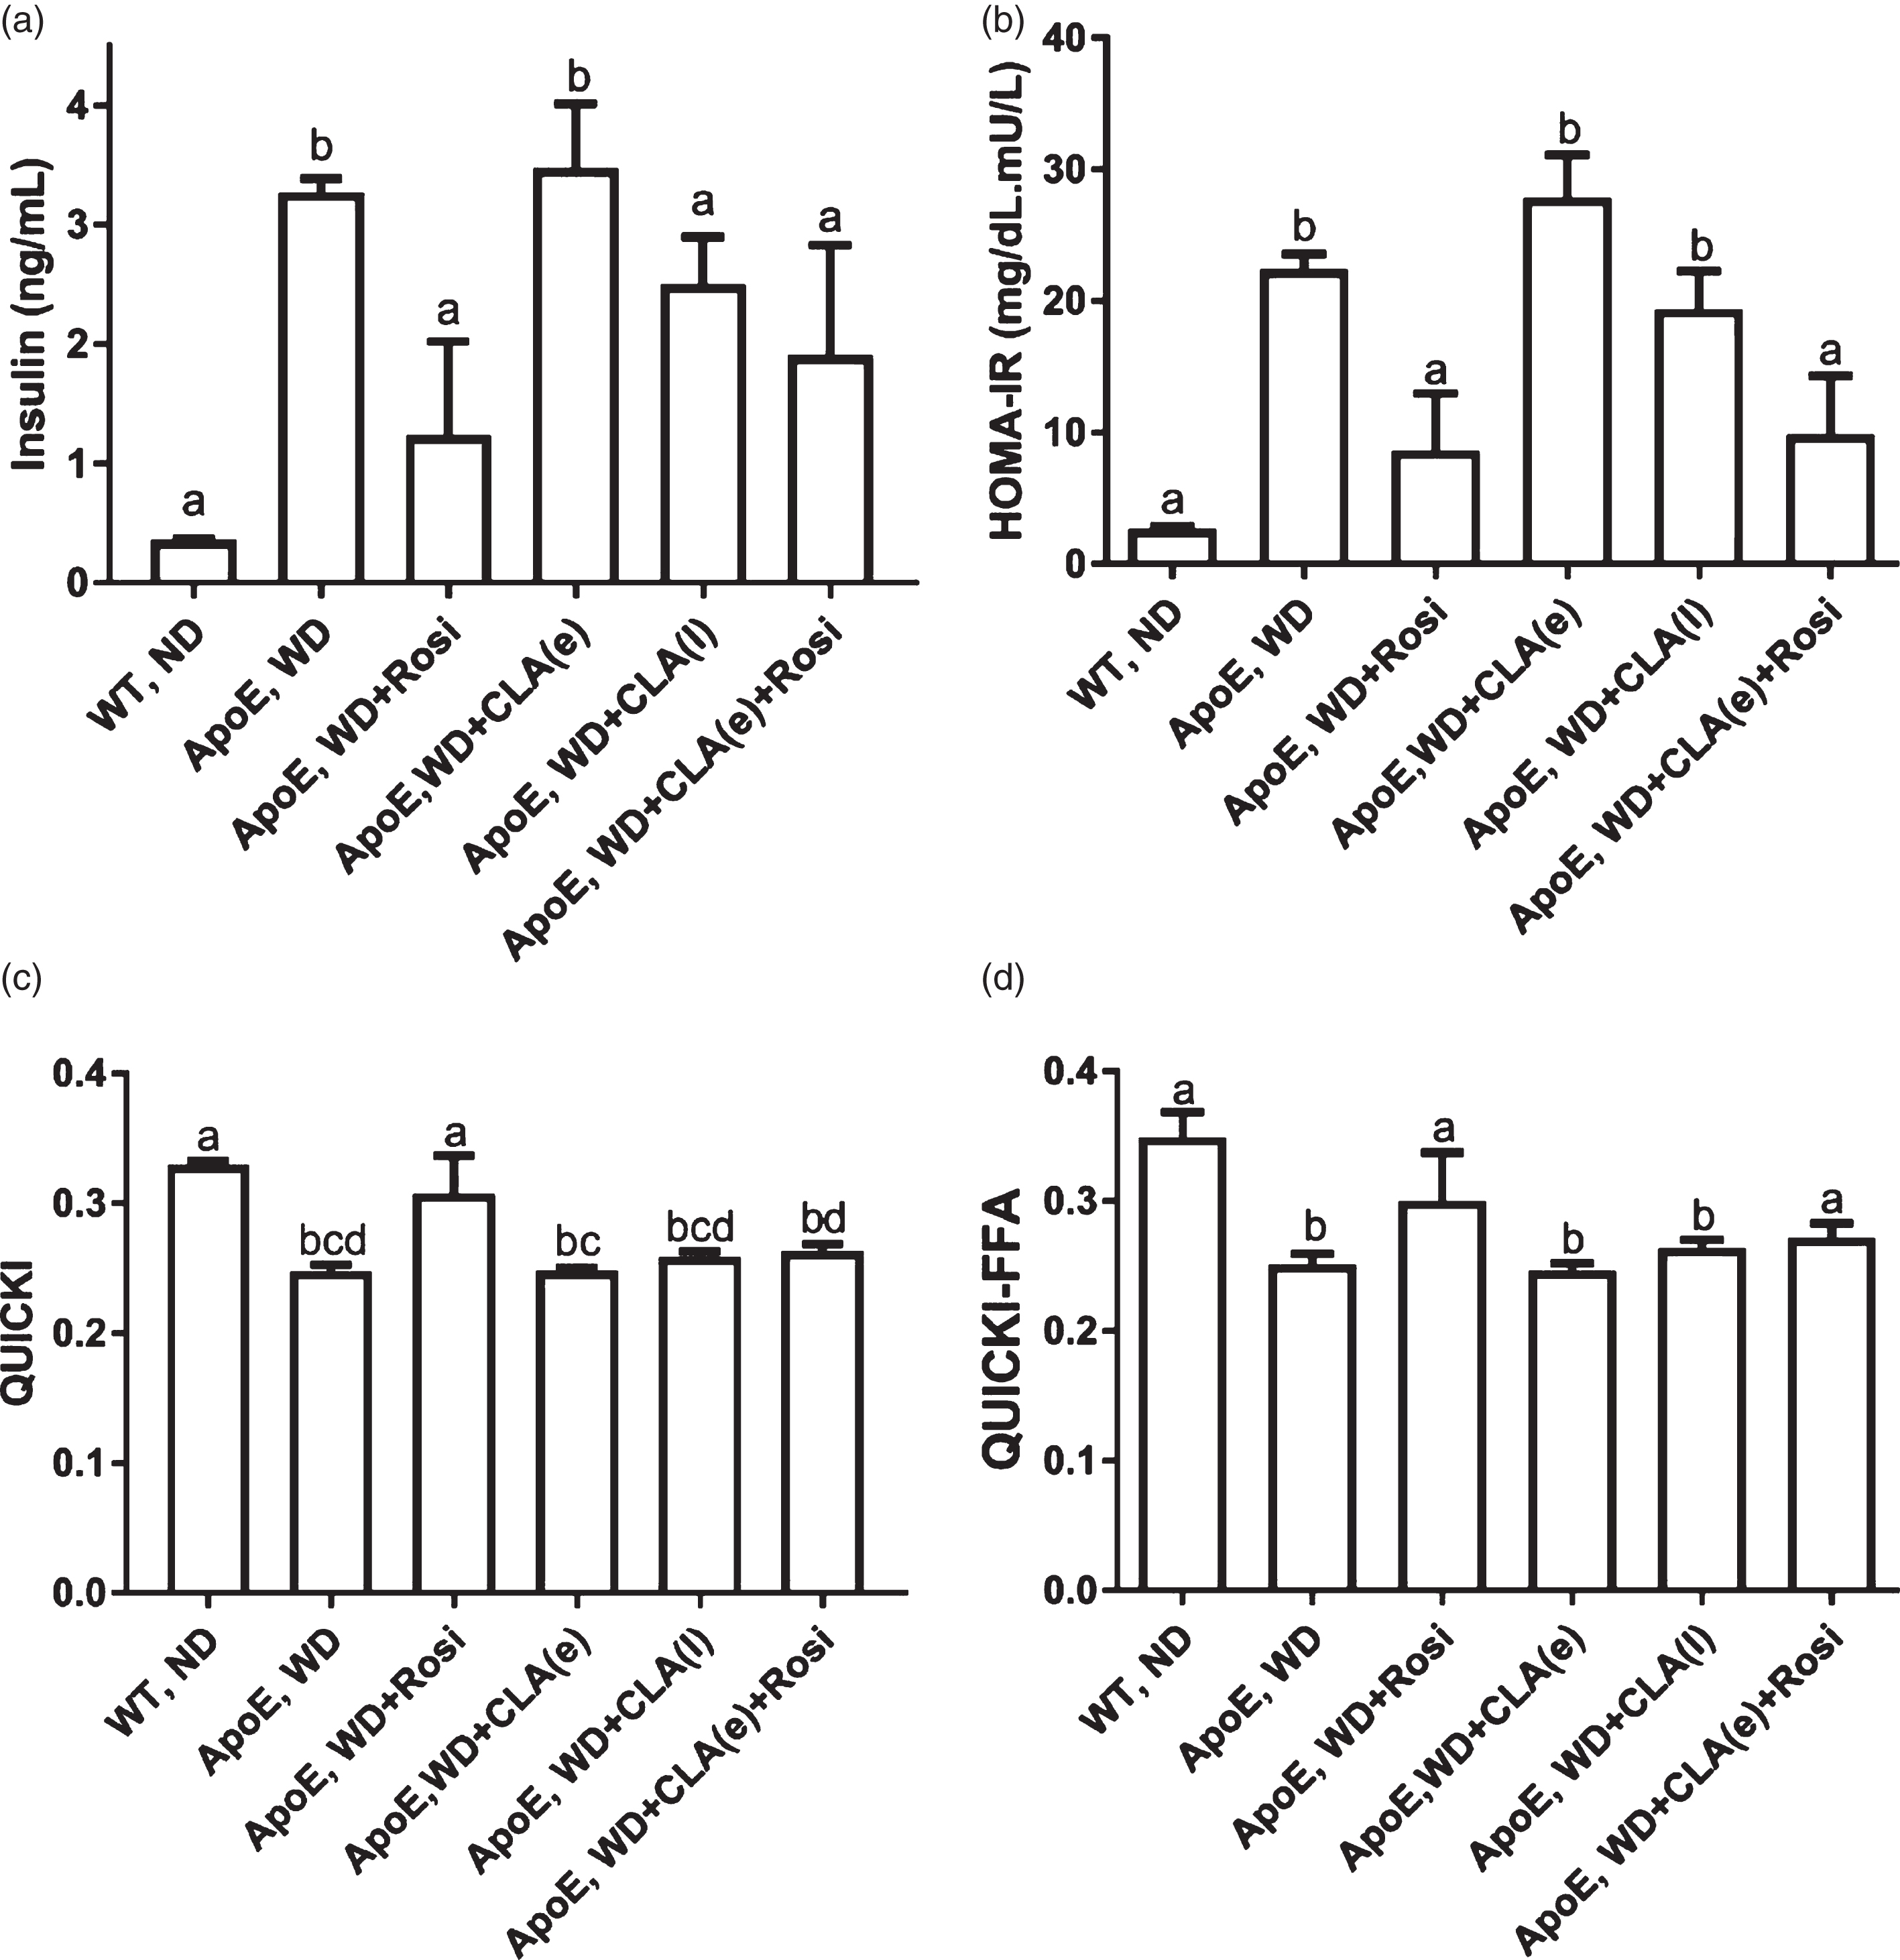
Insulin resistance indices of mice: (a) Plasma insulin concentration. (b) HOMA-IR. (c) QUICKI. (d) QUICKI-FFA. Data were presented as mean±SEM and analysed using ANOVA with Tukey’s post-hoc test. Statistical significance of p < 0.05 is denoted by bars with different letters. n = 3 –6 per group.
Insulin resistance indices were tabulated as HOMA-IR, QUICKI, and QUICKI-FFA. Insulin resistance was detected in all WD-fed mice regardless of treatment compared to wild-type mice (Fig. 4b, 4c and 4d).
Feeding Western diet in ApoE, WD led to an 8.3-fold increase in HOMA-IR (Fig. 4b), 24.9% decrease in QUICKI (Fig. 4c), and 30% decrease in QUICKI-FFA (Fig. 4d). ApoE, WD + CLA(e) was the most insulin resistant of all groups, which had a 9.4-fold increase in HOMA-IR (Fig. 4b), 24.9% decrease in QUICKI (Fig. 4c), and 31.7% decrease in QUICKI-FFA (Fig. 4d) compared to wild type mice. The increase in insulin resistance in ApoE, WD + CLA(l) was also notable with an increase in HOMA-IR at 7.2-fold (Fig. 4b), a decrease of 21.6% in QUICKI (Fig. 4c) and QUICKI-FFA at 26.9% (Fig. 4d). Administration of rosiglitazone in ApoE, WD + Rosi and ApoE, WD + CLA(e) + Rosi groups affects attenuating increase in IR. QUICKI for ApoE, WD + Rosi was increased by 24.2% (p < 0.05) and QUICKI-FFA by 19.5% (n.s.) compared to ApoE, WD (Fig. 4c); Administration of rosiglitazone in ApoE, WD + CLA(e) + Rosi only slightly increased QUICKI and QUICKI-FFA compared to ApoE, WD + CLA(e) (Fig. 4c and 4d).
Neither rosiglitazone nor CLA led to the statistically significant change in lipid parameters in WD-fed mice. Feeding Western diet to ApoE null mice led to a marked increase of 12.1-fold in total plasma cholesterol than wild-type mice (Fig. 5a, p < 0.01). Early administration of CLA caused a further 5.7% increase in total plasma cholesterol (Fig. 5a, n.s. vs. ApoE, WD). Simultaneous administration of early CLA and rosiglitazone led to a 31% increase in total cholesterol than ApoE, WD mice (Fig. 5a, n.s. vs. ApoE, WD). LDL levels were increased in all mice fed WD regardless of treatment (Fig. 5b, p< <0.05 vs. WT, ND).
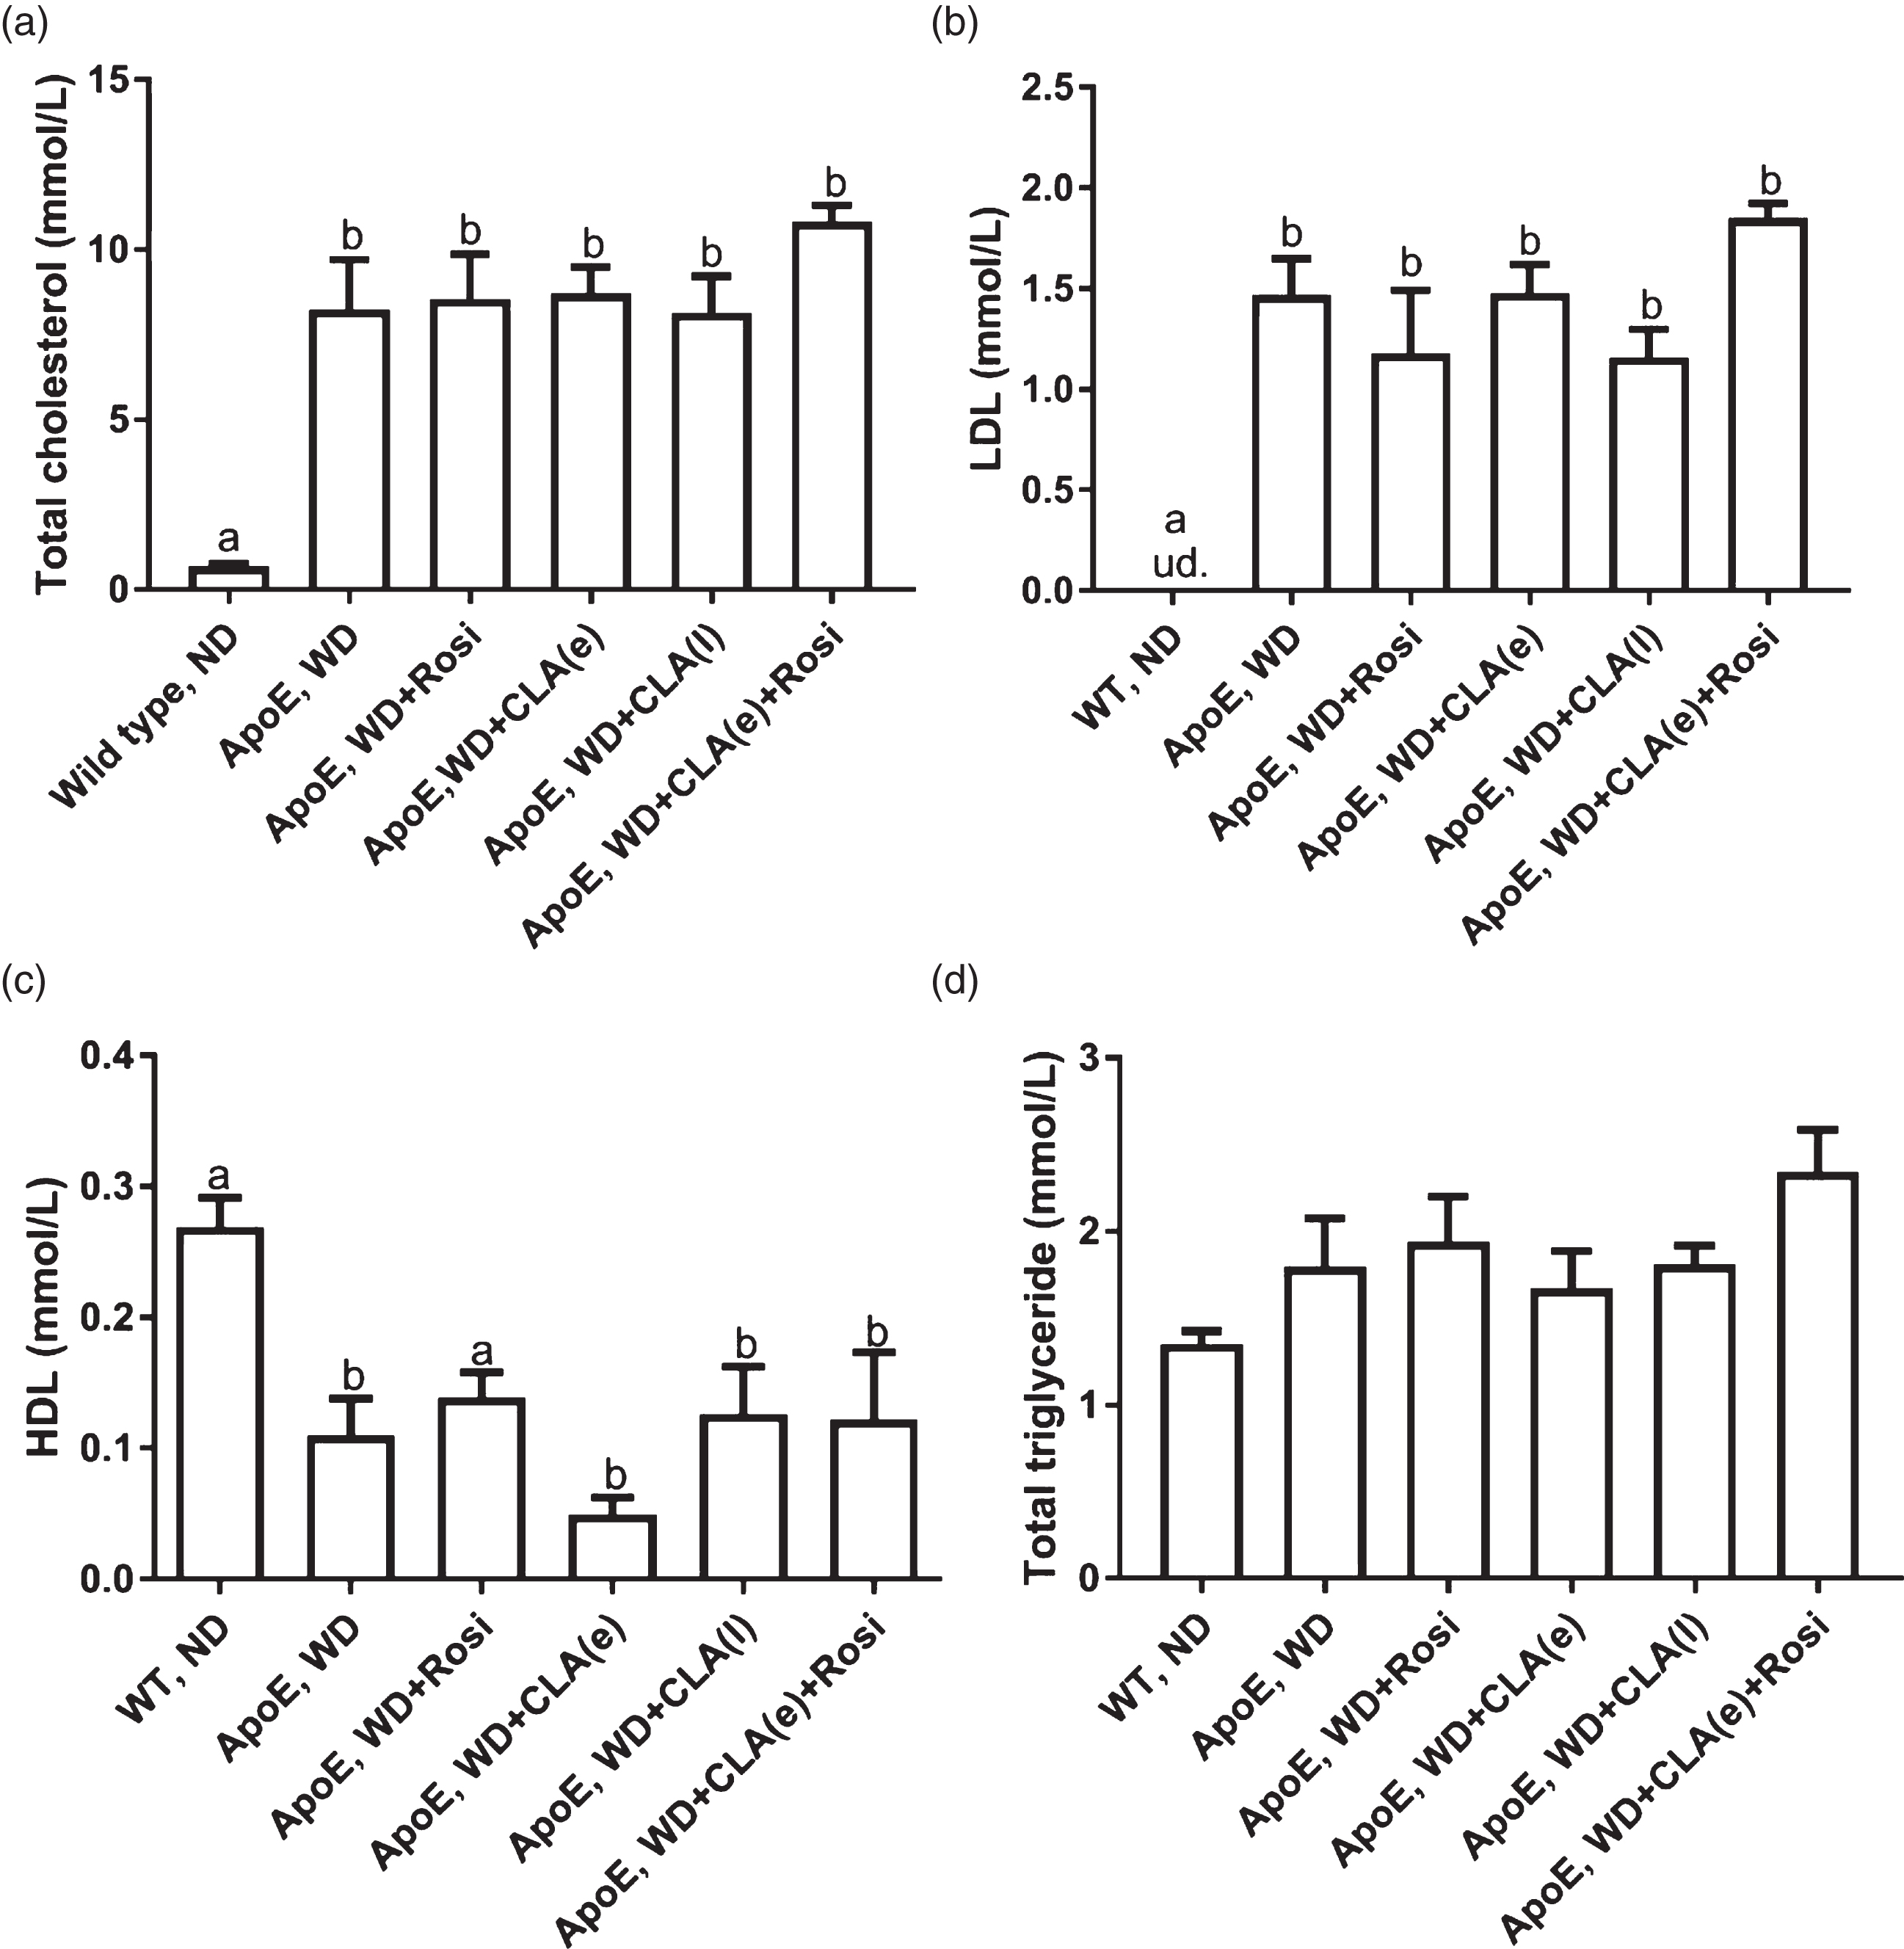
Lipidemia of serum at Week 20: (a) Total plasma cholesterol. (b) Plasma LDL cholesterol. (c) Plasma HDL cholesterol. (d) Plasma triacylglycerols. Data were presented as mean±SEM and analysed by ANOVA with Tukey’s post-hoc test. Statistical significance of p < 0.05 is denoted by bars with different letters. n = 3 –6 per group.
All WD-fed ApoE null mice had, on average, 59.3% lower HDL regardless of treatment than wild-type mice. Still, none of the treated groups were significantly different from ApoE, WD group (Fig. 5c, only ApoE, WD + Rosi n.s. vs. WT, ND, the others p < 0.05 vs. WT, ND). Feeding WD led to a 32.9% increase in triacylglycerol level compared to WT, ND (Fig. 5d). Triacylglycerol level for ApoE, WD + CLA(e) + Rosi was the highest among all treatment groups, with an increase of 30.4% compared to ApoE, WD. Still, none of the treatment groups were significantly different from each other (Fig. 5d).
No difference was detected in adiponectin levels across all groups (Fig. 6a), but early intervention with either rosiglitazone or CLA decreased leptin to the level comparable to wild-type mice. Feeding ApoE null mice with WD led to hyperleptinemia, a 7.46-fold increase compared to wild-type mice (Fig. 6b, p < 0.001). Early administration of CLA or rosiglitazone from Week 12 onwards [in ApoE, WD + CLA(e); ApoE, WD + Rosi and ApoE, WD + CLA(e) + Rosi] alleviated hyperleptinemia but statistical significance was only detected in ApoE, WD + CLA(e) and ApoE, WD + CLA(e) + Rosi (p < 0.05 vs. ApoE, WD, Fig. 6b). Hyperleptinemia persisted in the group with late administration of CLA after obesity has developed [ApoE, WD + CLA(l)] (Fig. 6b).
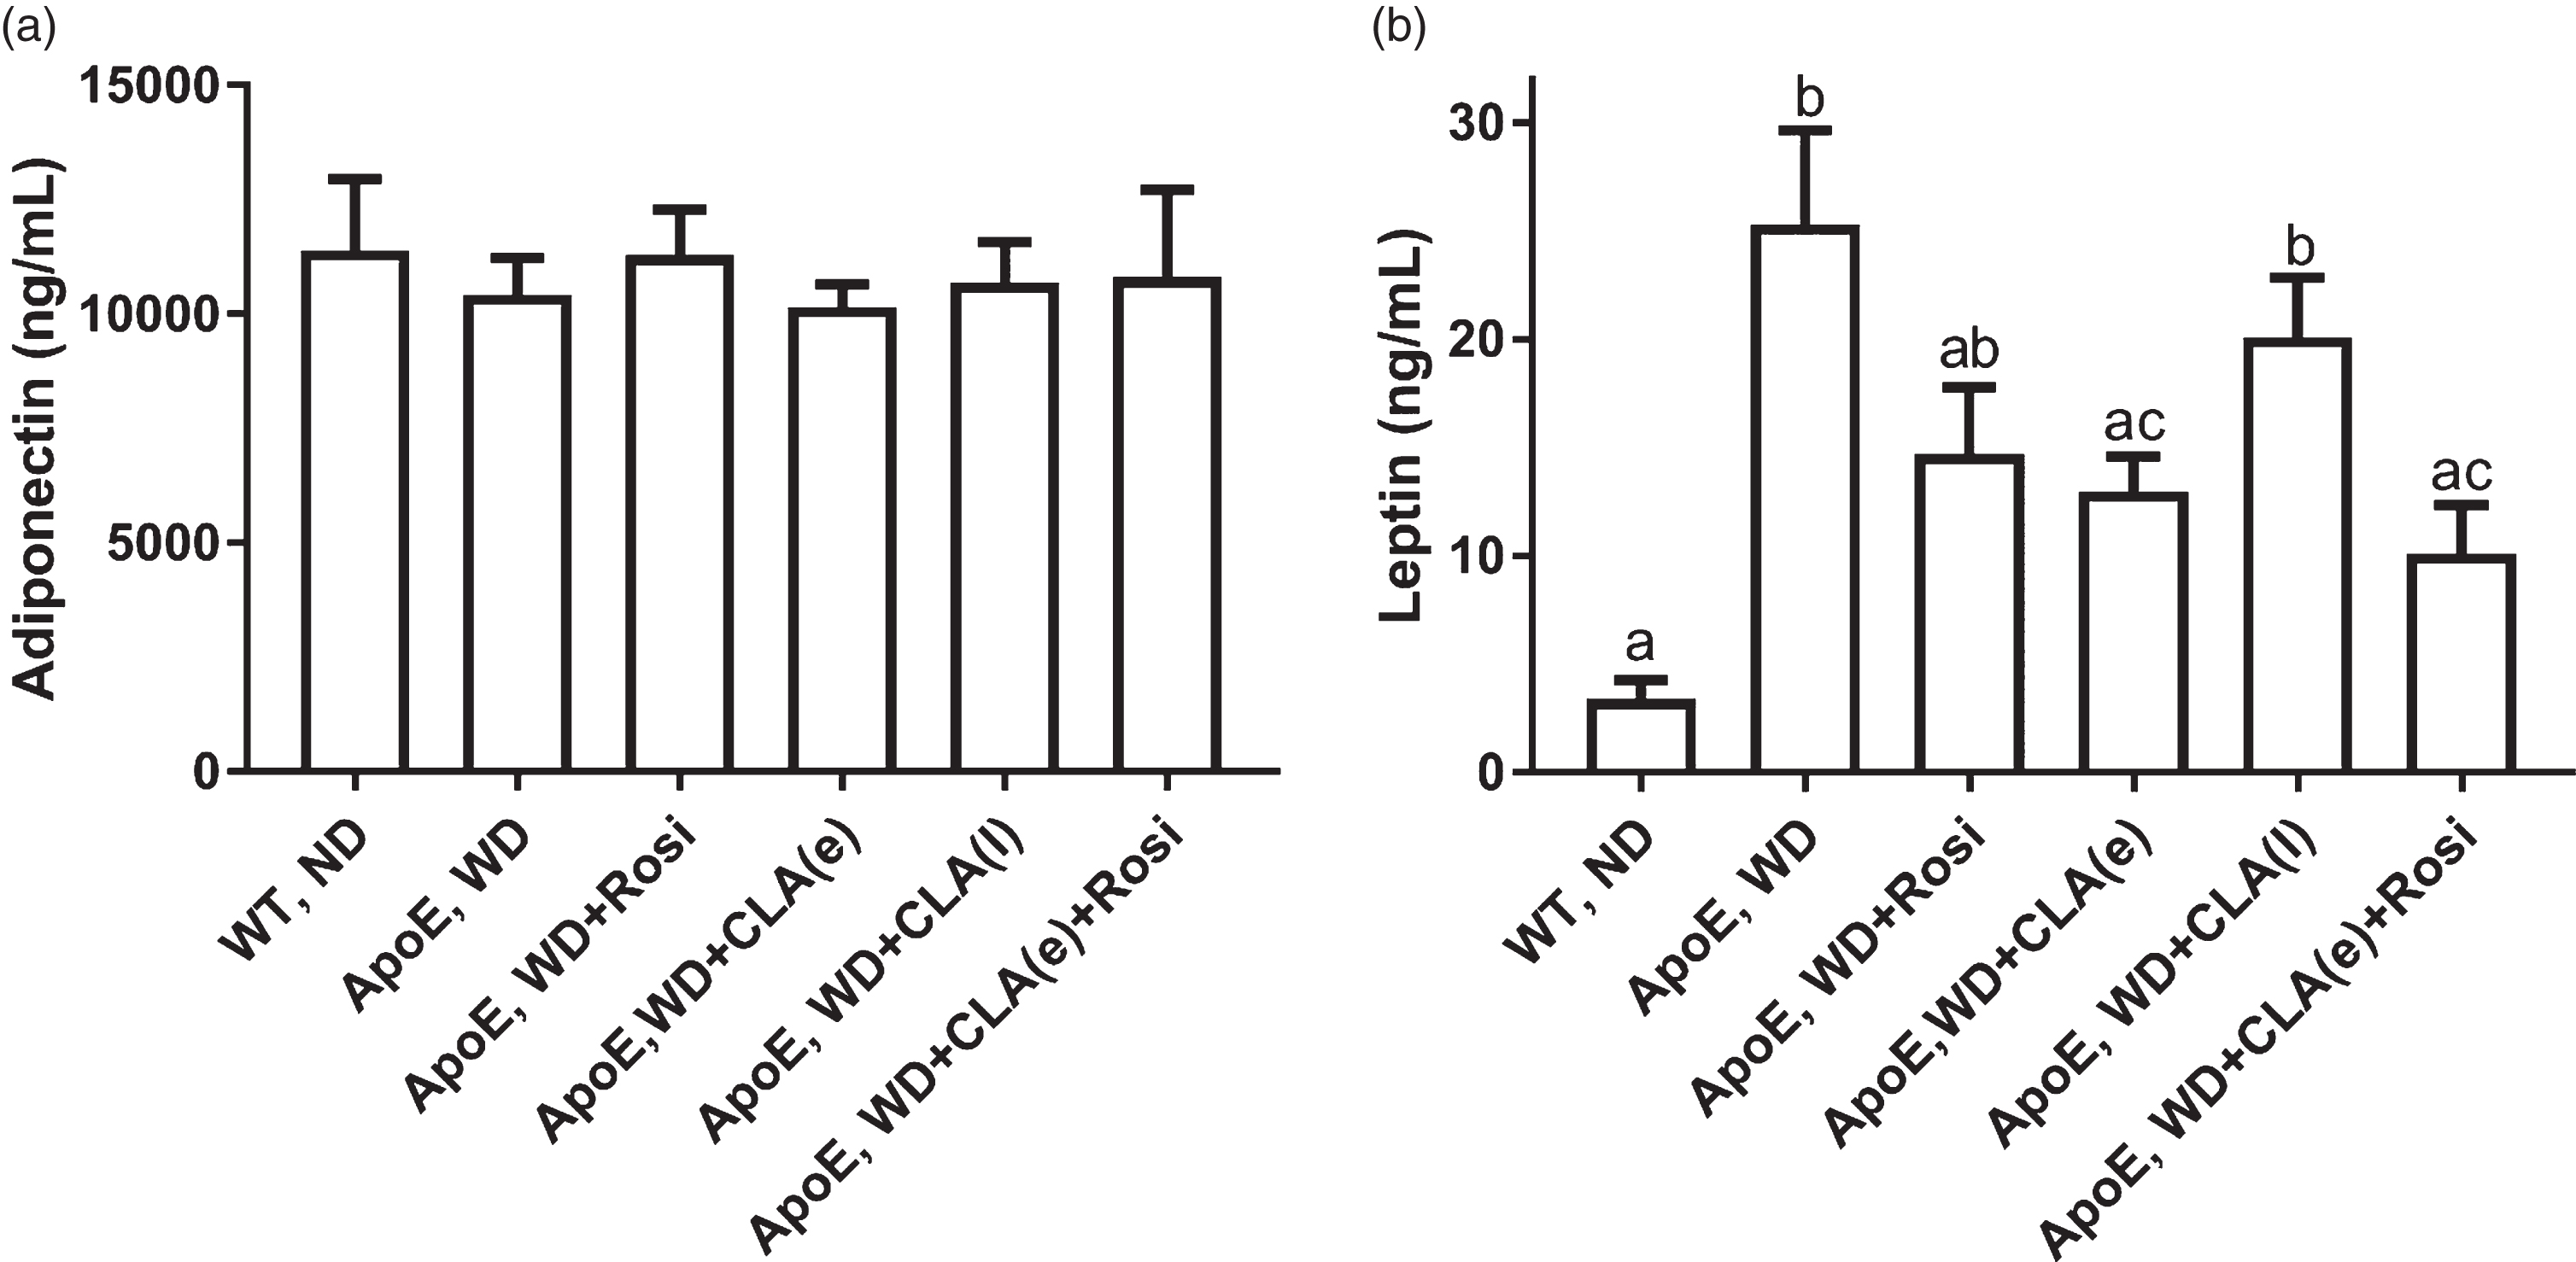
Hormone levels of mice in serum at Week 20: (a) Adiponectin and (b) leptin. Data were presented as mean±SEM and analysed by ANOVA with Tukey’s post-hoc test. Statistical significance of p < 0.05 is denoted by bars with different letters. n = 4 –5 per group.
As rosiglitazone has non-negligible side effects, especially on the cardiovascular system, we sought to ameliorate its side effects without abandoning the usage of this potent PPARγ ligand. We hypothesized that side effects might be ameliorated by any of the three ways: substituting rosiglitazone with alternative PPAR agonists, concurrent activation of PPAR isotypes, or administering competitive ligands to the common PPAR isotype. We have chosen CLA since these fatty acid isomers were demonstrated to confer health benefits. CLA isomers are known to be agonists of PPARα and PPARγ that bind to the latter with lower affinity than glitazones [25, 26].
We attempted to assess the cardiovascular safety of combining rosiglitazone and CLA supplements by examining serum parameters. In humans, much cholesterol circulates in LDL rather than HDL; hence, human beings are prone to dyslipidemia and atherosclerosis, especially in metabolic syndrome and T2DM. In contrast, mice have higher HDL levels than LDL in circulation, rendering them generally resistant to atherosclerosis. To model human diabetic dyslipidemia in mice, we used ApoE null mice fed a Western diet. ApoE null mice develop severe hypercholesterolemia when fed high fat or Western diet [27, 28]. In wild-type mice, feeding a Western diet also increased plasma cholesterol and triacylglycerols, albeit milder than ApoE null mice [27]. In addition, ApoE null on a C57BL6/J background is more prone to atherosclerosis and hyperglycemia than the BALB background [29].
ApoE null mice are leaner than wild-type mice when fed a normal diet [30], due to increased sequestration of lipid in LDL particles and decreased efficiency in incorporating lipids into the subcutaneous tissue. Nevertheless, they develop obesity when fed a fat-rich diet. Our study used male mice because they were more susceptible to insulin resistance when fed a high-fat diet [31].
Health benefits conferred by CLA are isomer dependent. In a study using C57Bl/6J mice, c9,t11-CLA did not lead to insulin resistance, but t10,c12-CLA, and 1:1 CLA mix led to insulin resistance [32]. In another study, 8:2 blend of c9,t11, and t10,c12-CLA led to resolution of early atherosclerosis [33], given that c9,t11 isomer is naturally abundant. A previous study using LDLr null mice fed high fat, high sucrose diet (HFHS) found that t10,c12-CLA led to insulin resistance and slightly reduced plasma cholesterol; that rosiglitazone was able to alleviate insulin resistance caused by t10,c12-CLA, but abrogated slight suppression of plasma cholesterol by t10,c12-CLA, and causes hepatomegaly [31].
Early administration of CLA mixture (WD + CLA(e), WD + CLA(e) + Rosi) led to a significant reduction in body and adipose weight compared to WD mice, which points to lipoatrophy in agreement with a previous study using 1:1 CLA to induce lipoatrophy in mice [34]. Additionally, we observed that mice subjected to lipoatrophy had lowered energy intake. This difference may be due to changes in appetite caused by lipoatrophy induced with early intragastric CLA. The continuous feeding of WD exacerbated lipoatrophy by introducing dyslipidemia that was further compounded by the ApoE null genotype. Since the actions of CLA are isomer specific, this CLA-dependent lipoatrophy is mediated by the t10,c12 isomer [35] by causing apoptosis of white adipose tissue via upregulation of TNFα [34]. Despite similar observations on lipid parameters in our previous study with rats, CLA mixture administered in rats does not lead to lipoatrophy due to the robustness of rat compared to mouse [36]. The adverse effects of 1:1 CLA mixture are espoused in increased total cholesterol, increased LDL and reduced HDL in ApoE, WD + CLA(e) and further increased by rosiglitazone in ApoE, WD + CLA(e) + Rosi, taking consideration that ApoE knockout led to less efficient incorporation of circulating lipids into the adipose tissue. Even though the increase in lipid parameters failed to reach statistical significance, their persistently elevated levels may produce biological effects over time. Previously, we have shown that vasorelaxation in endothelium-denuded aortic rings was severely impaired in CLA + Rosi-treated rats [18].
Leptin is an adipocytokine. The onset of lipoatrophy led to low leptin levels, observed in CLA(e) groups. It can be noted that in our study, rosiglitazone and CLA exert no influence on each other to alleviate hyperleptinemia. It has been shown that leptin infusion in lipoatrophy could correct insulin resistance and hepatic steatosis [37, 38]; transplantation of lipotropic mice with adipose tissue lacking leptin failed to convert insulin resistance and hepatic steatosis [39]. For reference, a case report pointed that administration of pioglitazone (that acts on adipose tissue) has little effect on serum lipoproteins and glucose metabolism in a case of lipoatrophic diabetes induced by juvenile dermatomyositis [40].
It has been reported that rosiglitazone decreases hepatic steatosis, whereas 1:1 CLA increases hepatic steatosis in normal mice fed a high-fat diet [41]. In a human trial, it was reported that rosiglitazone decreased hepatic steatosis. ApoE null mice develop severe hepatosteatosis after being fed WD for seven weeks [42], which is indicated by increased liver weight in all ApoE mice fed WD compared to wild type. The induction of hepatic steatosis has been documented previously for rosiglitazone [43, 44] and t10,c12-CLA [16]. t10,c12-CLA has also been shown to increase liver triacylglycerol content [45]. In this study, it could be observed that administration of 1:1 CLA alone led to a slight reduction in liver weight. Still, co-administering 1:1 CLA with rosiglitazone failed to alleviate hepatic steatosis caused by the latter.
We have chosen to tabulate insulin resistance in three indices owing to their unique characteristics. QUICKI has better reproducibility than HOMA-IR [46]. The method of QUICKI-FFA has been shown to be better correlated with insulin sensitivity measured by the euglycemic hyperinsulinemic clamp in a variety of insulin-resistant states [47] because insulin inhibits lipolysis in adipocytes [48, 49], and the presence of free fatty acids leads to insulin resistance [50].
A plethora of studies have been conducted CLA supplementation on humans, which were reviewed comprehensively by den Hartigh and Benjamin [51, 52]. Many authors discussed that CLA supplementation yielded mixed results. Careful analysis revealed that outcome is influenced by variables such as age, the status of obesity, diabetes, isomer composition, forms of CLA administered (free fatty acid or triacylglycerol), absolute dosage, dosage regimen and study duration, taking into consideration that humans have slower basal metabolic rate than rodents. CLA supplementation skew towards adverse outcome as health condition of subjects become more unfavourable. Typical dose of CLA administered in human studies range from 3 to 6 g per day. In a study involving healthy subjects, CLA supplementation (as free fatty acids) led to improvements in blood lipid profile [53]. It is certain that t10,c12-CLA is associated with detrimental effect of increased LDL cholesterol from a cross-over study involving healthy subjects [54]. High dose of a beneficial isomer does not necessarily translate into a favorable clinical outcome, as demonstrated that 28.9 g of oil per day of 8:2 c9,t11 and t10,c12 in triacylglycerol form to healthy subjects led to increased LDL:HDL ratio [55]. On the effect of CLA on insulin sensitivity, a group demonstrated improvement in insulin sensitivity in young, sedentary subjects supplemented with 1:1 CLA isomeric blend (in free fatty acid form) over 2 months [56]. In contrast, Risérus et al. found that t10,c12-CLA (primarily in free fatty acid form) increased insulin resistance in abdominally obese men from 35 to 65 years of age over 3 months [57]. Interestingly, the same group later demonstrated that c9,t11-CLA (83.3% composition in triacylglycerol form) increased insulin resistance in similar subjects [58]. In subjects with T2DM, Moloney et al. showed that CLA supplementation (1:1 blend as free fatty acid) worsened insulin resistance. Another cross-over study involving obese, diabetic, post-menopausal women on medication showed no change in insulin sensitivity but made no mention on blood lipid profile [59]. These studies warrant clinical attention since commercial CLA supplements are “generally recognized as safe” and marketed as unregulated weight loss product.
Conclusions
We conclude that early administration of 1:1 mixture of CLA and continued feeding of WD led to dyslipidemic lipoatrophy. Further administration with rosiglitazone led to an exacerbation of atherogenic dyslipidemia and hepatic steatosis. Our results warrant that the use of conjugated linoleic acid, perhaps in diabetic patients taking insulin sensitizers, should be cautioned. However, further prospective clinical investigations are warranted to confirm the same.
Footnotes
Acknowledgments
This work was supported by the Fundamental Research Grant Scheme (grant number: 64924), Ministry of Higher Education, Malaysia. Chai was supported by University of Nottingham Malaysia Campus Postgraduate Scholarship and research infrastructure. Animal housing was provided by the Department of Pharmacology, University of Malaya.
Conflict of interest
The authors have no conflict of interest to report
