
Abstract
High fat diet (HFD) predisposes to many metabolic changes; it may disrupt gut barrier integrity and gut microbiota composition. Synbiotic supplementation may promote host’s metabolic health by selective activation of the healthy microorganisms. This study aimed to probe the interaction between synbiotic supplementation, gut microbiota and gut hormones in HFD states. Twenty-seven adult male albino rats, 3 groups, group I: control, group II: HFD received HFD for 12 weeks and group III: synbiotic-supplemented HFD received synbiotic in the last 6 weeks. The anthropometric measurments were measured. Liver transaminases, lipid profile, parameters of insulin resistance, serum serotonin, glucagon like polypeptide-1 (GLP-1), oxidant/antioxidant markers (MDA/GPx), zonulin levels and quantitative cecal short chain fatty acids (SCFA) were assessed. Samples of liver and colon were employed for histopathological studies. Compared to HFD group, synbiotic led to a significant reduction in anthropometric measurements, liver enzymes, atherogenic index, HOMA-IR and MDA denoting improved dyslipidemia, insulin resistance and oxidative state. Moreover, synbiotic supplementation decreased serum zonulin and increased both serum serotonin, GLP-1 and cecal SCFAs. Synbiotic supplementation ameliorated the metabolic derangements and the disturbed integrity of the intestinal barrier induced by HFD. As synbiotics can increase gut hormones (serum GLP-1&serotonin) and SCFAs.
Introduction
High fat diet (HFD) predisposes to a variety of metabolic changes such as obesity, insulin resistance, dyslipidemia and non-alcoholic steatohepatitis (NASH) [1]. Prolonged high fat diet (HFD) induces endoplasmic reticulum (ER)/oxidative stress in intestinal secretory goblet cells, triggering inflammatory signals that disrupt intestinal wall integrity [2].
Gut hormones including glucagon-like peptide-1 (GLP-1), cholecystokinin and serotonin that affect appetite and feeding behavior, influence both glucose homeostasis and body energy metabolism are also plausible candidates for metabolic disturbances associated with high fat diet [3, 4].
The human body contains trillions of microorganisms that inhabit our bodies during and after birth and might play a role in maintaining the integrity of the gut wall and prevent the overgrowth of harmful organisms [5, 6].
Most of gut microbiota populate in the distal colon, where they ferment the major indigestible oligosaccharides and carbohydrates that escaped digestion in the small intestine into short chain fatty acids (SCFA) mainly acetate, propionate and butyrate [7]. Gut microbiota might act as a modulatory signal either directly or through its bioactive metabolites, as propionate and acetate, on intestinal enteroendocrine cells thus affecting the food intake, body weight, adiposity, glucose, lipid metabolism and metabolic syndrome [8].
High fat diet was reported that it is associated with gut dysbiosis [9]. This shift in gut microbial population at the genera and species levels might lead to an increase in the intestinal permeability with increased leakage of microbial products into the systemic circulation [1–10]. In addition, the alterations in the microflora may suppress the production of useful gut hormones such as GLP-1 which will change the body energy balance [11].
Synbiotics are a combination of probiotics (live microorganisms) and prebiotics (food for beneficial gut microbiota) [12, 13]. They might promote host’s metabolic health by selective growth stimulation and activation of healthy microorganism [14]. So, using synbiotics may impose potential therapeutic benefits on obesity and its related metabolic disorders but the mechanisms involved need further research [15].
Therefore, this study aimed to evaluate the impact of synbiotic supplementation on metabolic derangement and intestinal gut barrier integrity in high fat diet states assessing the role of gut hormones and quantity of short chain fatty acid formed by gut microbiota in mediating these effects.
Materials and Methods
This study was carried out on 27 adult male albino rats weighing 180–250 gm at the start of the study. The sample size was decided according to
Inclusion & exclusion criteria
Rats were chosen adult, male, albino and mean of weight was 180±5 gm (SD). The rats which were old, female, overweight and obese or with any chronic disease or any previous procedures were excluded from the start of this study.
Blinding
The researchers were blind during the outcome assessment, biochemical assessment and the data analysis.
Type of our study
Analytical interventional study.
Experimental Protocol
The protocol was officially registered in postgraduate studies, Ain Shams University. The study period was three months during which rats were allocated by simple randomization into 3 equal groups (9 for each group):
Diet Composition and Preparation
Control diet and high fat diet were prepared by calculations which depend upon the analytical composition of different food sources used in animal feeding in animal laboratory [17].
Table (1): Analytical composition of food materials (for each 100gm) as described by [18, 19].
Analytical composition of food materials (for each 100gm)
Analytical composition of food materials (for each 100gm)
The control diet, used in the present study, was provided to group I and constructed according to the normal nutritional dietary requirement described by [20, 21]. Diet was prepared in the laboratory from three main natural sources, bread (Balady bread), pasteurized cow milk and unsalted Karish cheese. Every 100 gm of control diet was prepared by mixing 75 gm bread, 123 ml milk (equivalent to 15 gm dry weight), and 10 gm skimmed (unsalted Karish) cheese. Energy provided by this diet was 284 Kcal /100 gm diet, as shown in the following tables, Table &3).
Composition of the control diet
Composition of the control diet
Energy provided by control diet
While high fat diet (HFD) was provided to group II & III. Every 100 gm of this diet was prepared by mixing butter, bread, milk and unsalted Karish cheese as follows: 123 ml milk (equivalent to 15 gm dry milk powder), 15 gm butter, 60 gm bread, 15 gm dry milk powder and 10 gm skimmed (unsalted Karish) cheese according to [22]. This elevates the fat content to about 16–17% as shown in the following table, Table &5).
Composition of the high fat diet
Composition of the high fat diet
Energy provided by high fat diet
Analytical composition of butter used in the present study as shown in the following table, Table (6).
Analytical composition of butter used in high fat diet
CHO = Carbohydrate; Sat FA = Saturated fatty acid; MUF = Monounsaturated fatty acids; PUF = Polyunsaturated fatty acids; Chol. = Cholesterol.
Synbiotic was given daily in the morning for the last six weeks of the experiment to synbiotic treated group. Each rat was supplied by 1×10¹⁰ colony forming unit (CFU)/g/day for lactobacillus acidophilus [23, 24] through gastric gavage tube. The colonies were cultured in yogurt with addition of inulin fructo-oligosacharides 2% [24]. Synbiotic was prepared by Dairy and Food Microbiology Department of National Research Center, Cairo, Egypt.
Experimental Procedures
On the day of sacrifice, the overnight fasted rats were weighed and anaesthetized by intraperitoneal injection of thiopental sodium, in a dose of 40 mg/kg B. W [25]. The final body weight, naso-anal length (needed to calculate the BMI and the Lee index) were measured for all rats.
•Determination of body mass index (BMI)
Body mass index (BMI) was calculated according to [26], as follows:
Rats in the experimentally-induced obesity group were considered obese when the BMI became above the normal range for adult rats, which is from 0.45 to 0.68 gm/ cm2 [27].
•Determination of Lee index
It was calculated by dividing the cube root of the body weight (in grams) over the naso-anal length (in cm) and multiplying the whole expression by 1000 as follows [26].
With normal body composition in rats, the lee index is in the range of 295 to 310; obesity is indicated by higher values [26].
Then, the blood was collected from the aorta in gel coated non-heparinized tube which were centrifuged at 4000 rpm for 15 min to obtain serum for biochemical assays:
Also, atherogenic index was calculated according to [35] using the following formula:
Histopathological Studies
The liver and the colonic segments were isolated and rapidly immersed in 10% formalin solution for histological examination. It was performed using the image analyzer Leica Q Win V.3 program installed on a computer in the Histology and Cell Biology Department, Faculty of Medicine, Ain Shams University. The computer was connected to a Leica DM2500 microscope (Wetzlar, Germany). Specimens from all groups were subjected to morphometric study. Measurements were taken from three different slides obtained from each animal (40X).
Statistical Analysis
Data were statistically described according to [46] in terms of mean±Standard deviation. Statistical significance of data between different groups was determined using a one-way analysis of variance (ANOVA) with post-hoc test using SPSS (Statistical Program for Social science (SPSS Inc, Chicago, IL, USA) version 20.0. A probability value (p-value) less than 0.05 was considered statistically significant. Parametric tests were used as the data were normally distributed.
Pearson correlation coefficients were calculated by linear regression analysis (ranking data directly or indirectly) using the Least Square Method [47] and correlation of p≤0.05 considered significant.
Results
A. Anthropometric measures: Body weight (BW), body mass index (BMI) and Lee index Table 7, Figs. 1&2
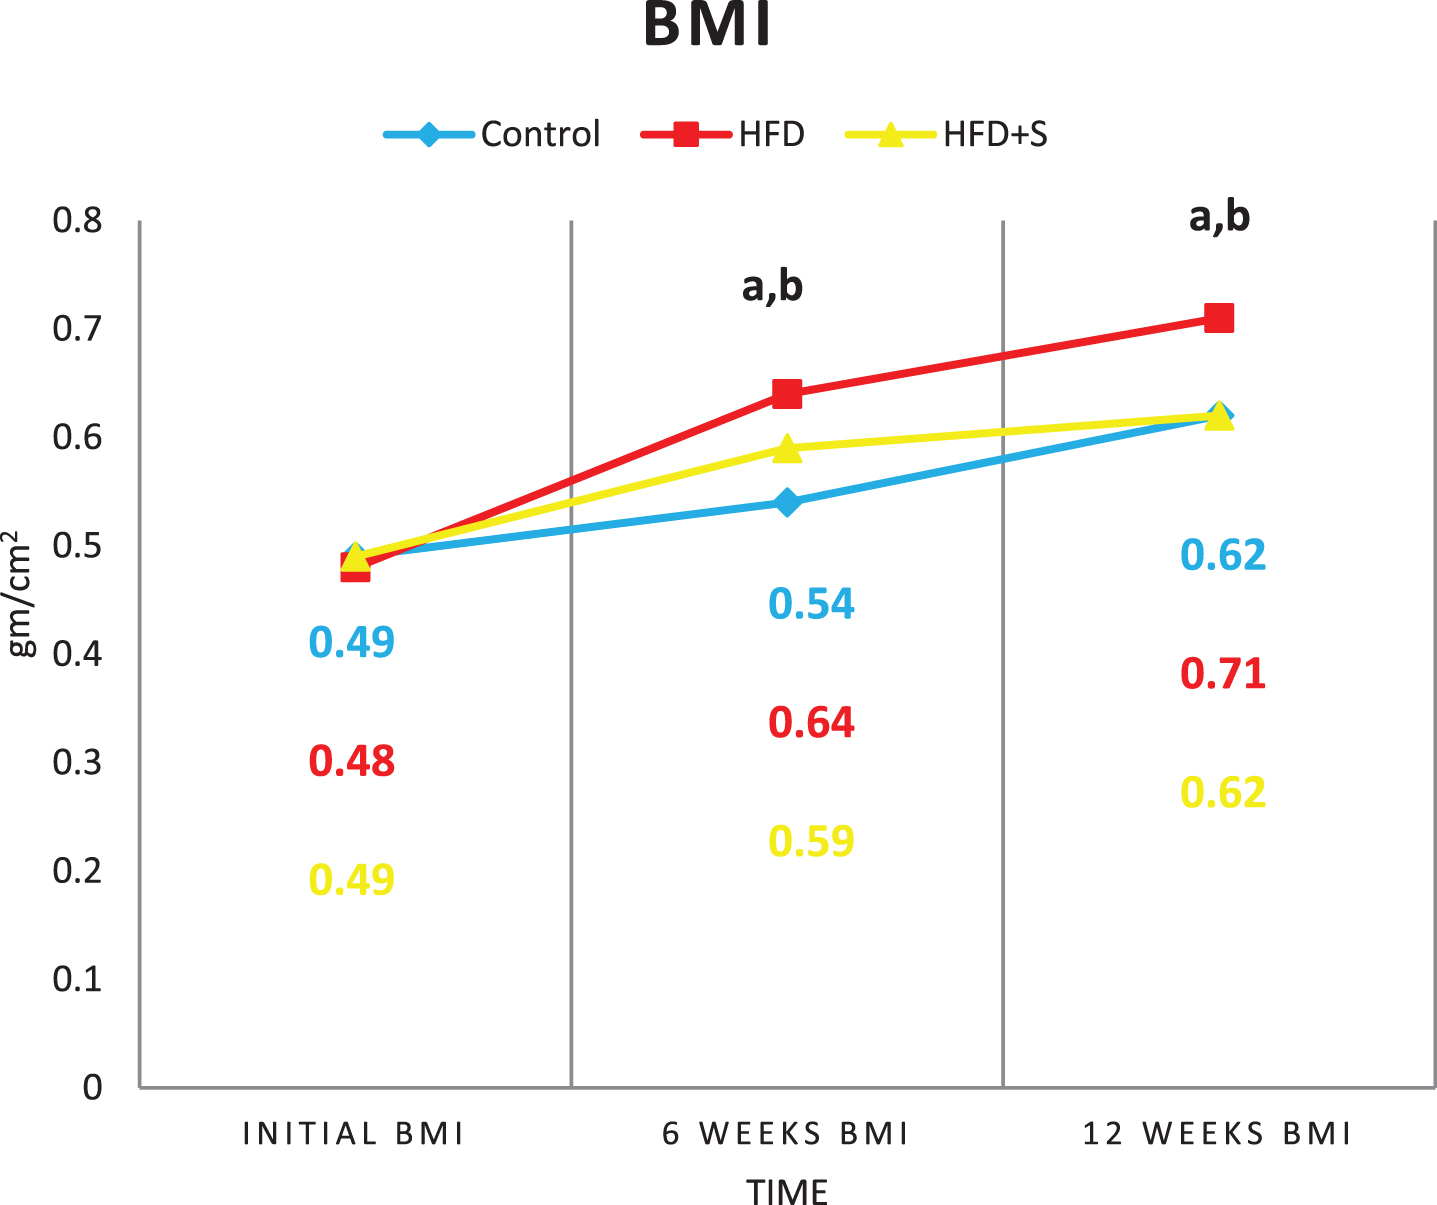
Showing initial, 6weeks and final BMI in the 3 studied groups. a: Significance of difference from the control group calculated by LSD at P < 0.05. b: Significance of difference from HFD fed group calculated by LSD at P < 0.05.
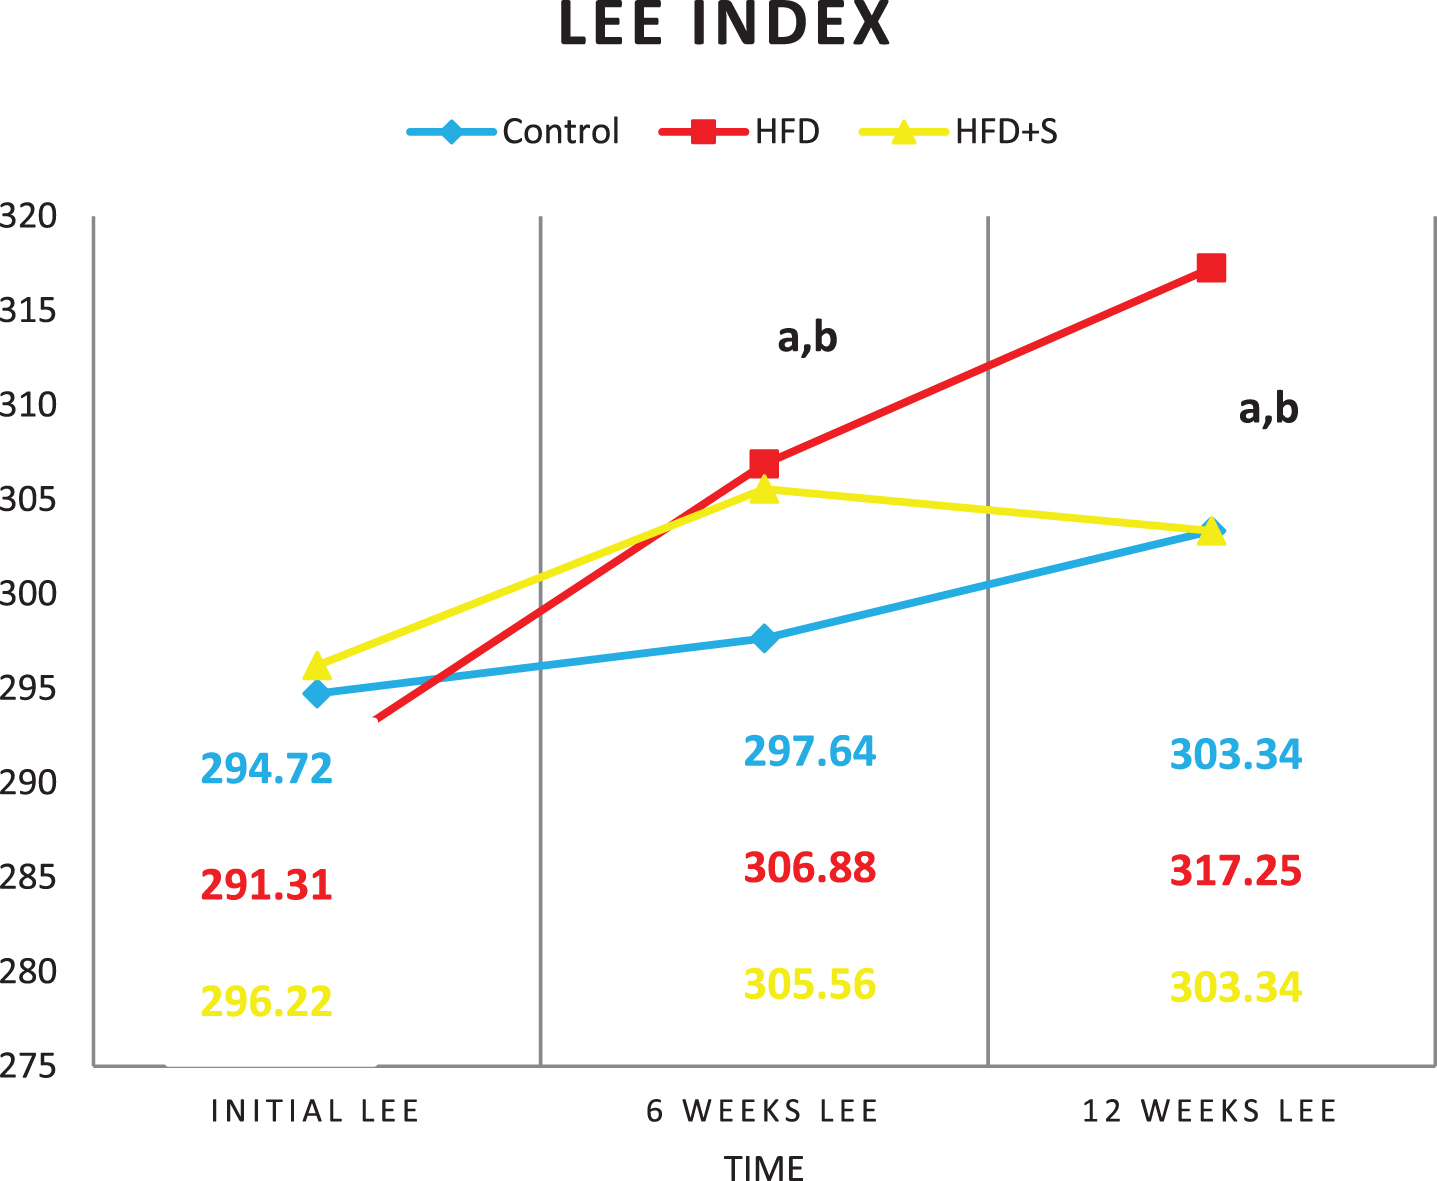
Showing initial, 6weeks and final lee index in the 3 studied groups; a: Significance of difference from the control group calculated by LSD at P < 0.05; b: Significance of difference from HFD fed group calculated by LSD at P < 0.05.
Mean
a: Significance of difference from the control group calculated by LSD at P < 0.05; b: Significance of difference from HFD fed group calculated by LSD at P < 0.05; *: Significance of differences from the initial values, calculated by Student’s t-test for paired data.
The initial body weight (BW), body mass index (BMI) and Lee index were similar in the 3 studied groups (P < 0.05). Compared to their initial values, a significant increase in the final BW, BMI and Lee index were detected in the 3 studied groups (P < 0.001 for all). High fat diet group showed significant increase in weight gain %, BMI gain% and Lee index gain % (P < 0.001) compared to the control group. In synbiotic-supplemented HFD fed group, these values were significantly decreased compared to the HFD fed group being insignificant from the control.
Table (7): Mean±Standard deviation of body weight (gm), BMI (gm/cm2) and Lee index in the 3 studied groups.
Compared to the control group, high fat diet group showed significant increase in serum liver transaminases (alanine aminotransferase (ALT) & aspartate aminotransferase, (AST)), serum triglyceride (TG), cholesterol, low density lipoprotein (LDL-c), the atherogenic index (AI) and fasting blood sugar (FBS), fasting serum insulin and Homeostasis Model Assessment Score (HOMA-IR) (P < 0.001 for all), while serum high density lipoprotein (HDL-c) was significantly decreased (P < 0.001) denoting dyslipidemia and insulin resistance state.
Mean±Standard deviation of serum liver enzymes (alanine transferase enzyme; ALT & aspartate transferase enzyme; AST) (U/L), serum triglycerides (mg/dl), serum total cholesterol (mg/dl), serum high density lipoproteins, (HDL-c) (mg/dl), low density lipoproteins, (LDL-c) (mg/dl), atherogenic index, (AI), fasting blood sugar, (FBS) (mmol/l), fasting serum insulin (μIU/ml), and HOMA-Insulin resistance (HOMA-IR) in the 3 studied groups
Mean±Standard deviation of serum liver enzymes (alanine transferase enzyme; ALT & aspartate transferase enzyme; AST) (U/L), serum triglycerides (mg/dl), serum total cholesterol (mg/dl), serum high density lipoproteins, (HDL-c) (mg/dl), low density lipoproteins, (LDL-c) (mg/dl), atherogenic index, (AI), fasting blood sugar, (FBS) (mmol/l), fasting serum insulin (μIU/ml), and HOMA-Insulin resistance (HOMA-IR) in the 3 studied groups
a: Significance of difference from the control group calculated by LSD at P < 0.05; b: Significance of difference from HFD fed group calculated by LSD at P < 0.05.
Compared to the HFD fed group, ALT, AST, TG, cholesterol, LDL-c, the atherogenic index (AI), FBS, fasting serum insulin and HOMA-IR were significantly decreased, while HDL-c was significantly increased in synbiotic-supplemented HFD fed groups (P < 0.001 for all).
However, the values were still higher and HDL-c value was still significantly lower than the control value in the synbiotic supplemented rats (P < 0.001 for all).
Table (8): Mean±Standard deviation of serum liver enzymes (alanine transferase enzyme; ALT & aspartate transferase enzyme; AST) (U/L), serum triglycerides (mg/dl), serum total cholesterol (mg/dl), serum high density lipoproteins, (HDL-c) (mg/dl), low density lipoproteins, (LDL-c) (mg/dl), atherogenic index, (AI), fasting blood sugar, (FBS) (mmol/l), fasting serum insulin (μIU/ml), and HOMA-Insulin resistance (HOMA-IR) in the 3 studied groups.
Compared to the control group, serum serotonin and glucagon like peptide-1 (GLP-1) levels were significantly decreased in HFD fed group (P < 0.001 for all). Following synbiotic supplementation, compared to the HFD fed group, serum serotonin and GLP-1 levels were significantly increased (P < 0.001 for all). However, their values were still significantly lower than the control group in synbiotic supplementation group (P < 0.001 for all).
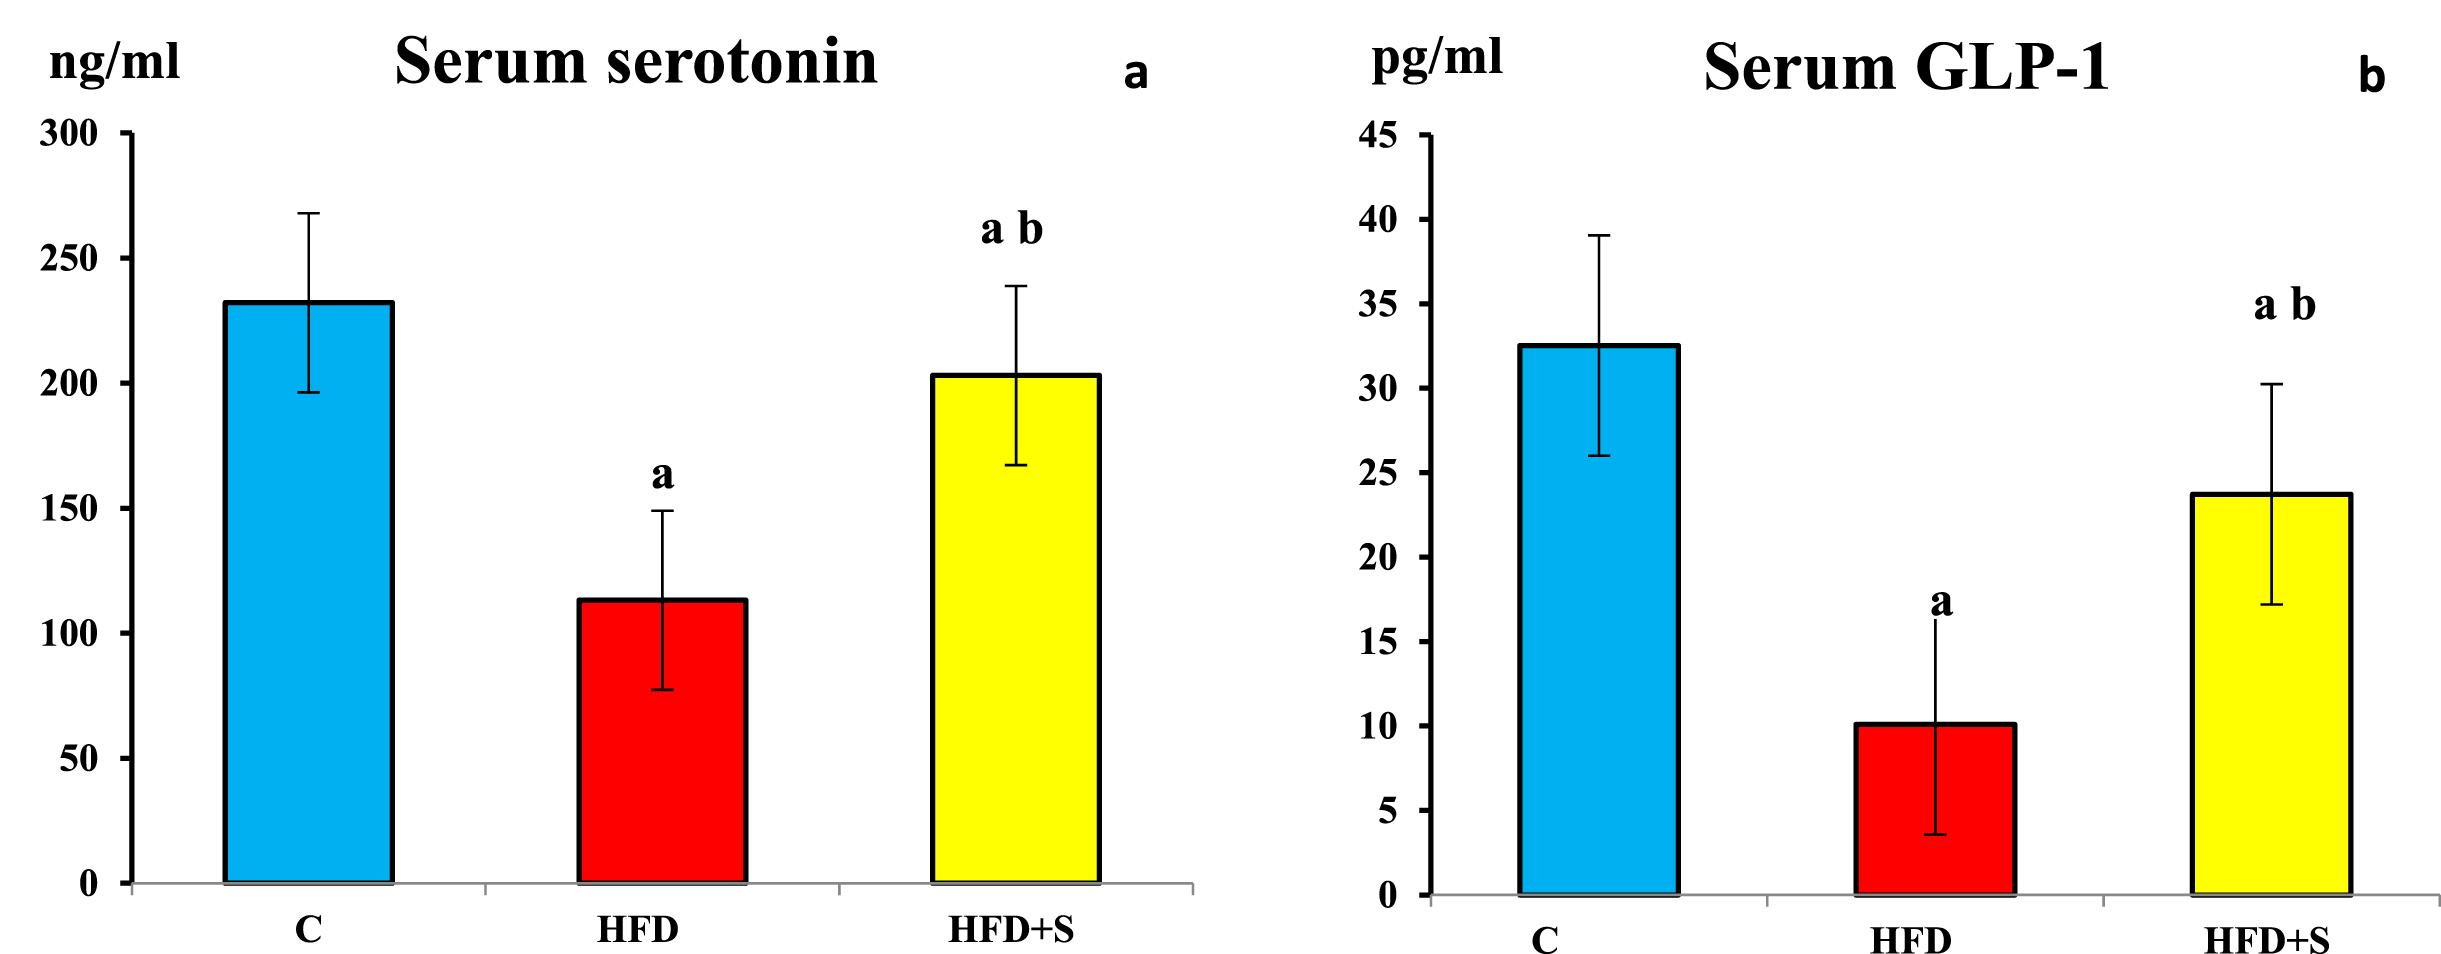
Showing a) serum serotonin b) serum glucagon like peptide -1(GLP-1) in the 3 studied groups. a: Significance of difference from the control group calculated by LSD at P < 0.05. b: Significance of difference from HFD fed group calculated by LSD at P < 0.05.
Compared to the control group, serum malondialdehyde (MDA) levels was significantly increased, while serum glutathione peroxidase (GPx) level was significantly decreased in HFD fed group (P < 0.001 for both). Synbiotic supplemented group showed a significant decrease in serum MDA and a significant increase in serum GPx levels (P < 0.001 for all) compared to HFD group. Meanwhile, serum MDA remained significantly higher and serum GPx remained significantly lower (P < 0.001 for all) in synbiotic supplemented groups compared to the control group.
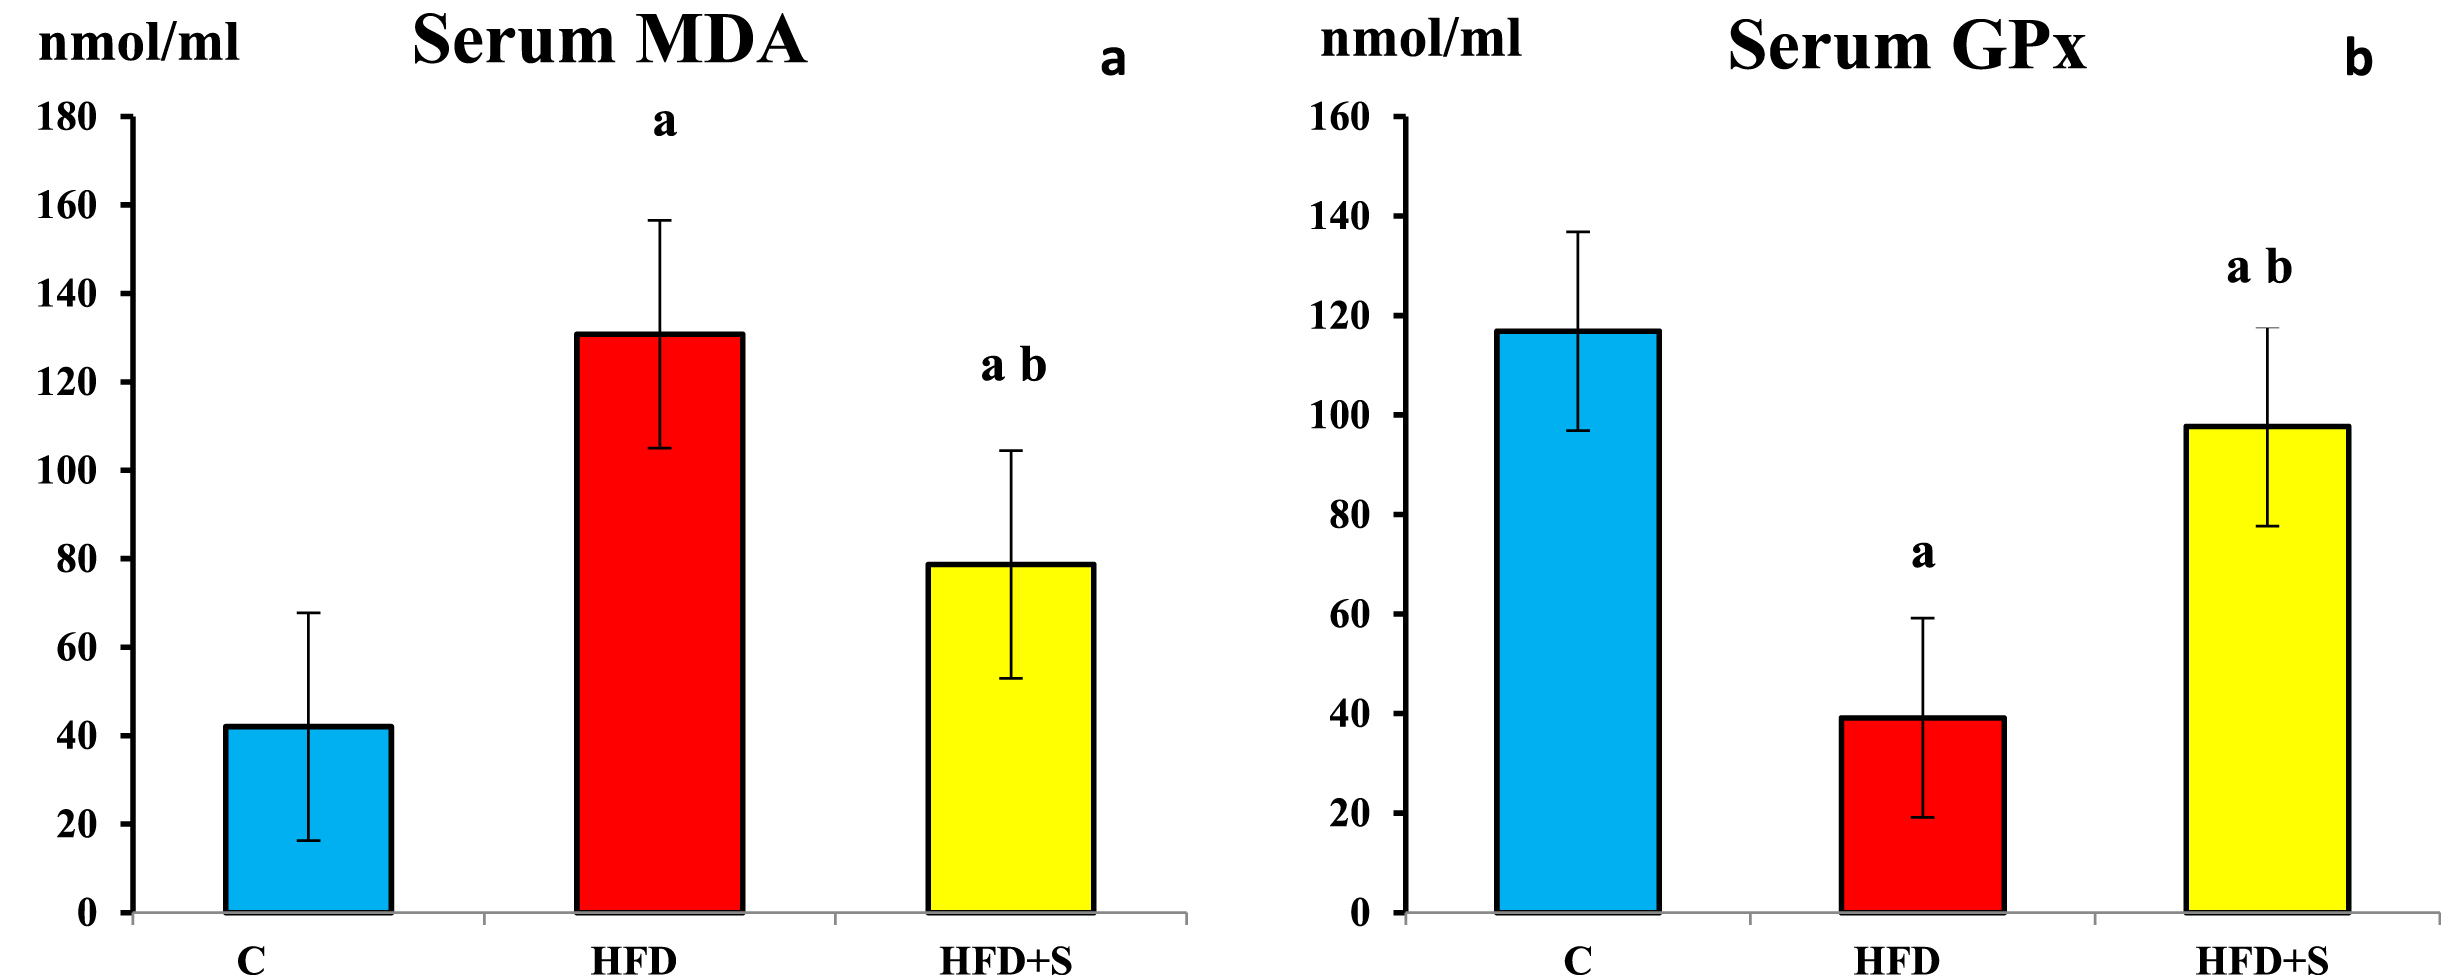
Showing a) serum malondialdehyde (MDA) and b) glutathione peroxidase (GPX) levels in the 3 studied groups. a: Significance of difference from the control group calculated by LSD at P < 0.05. b: Significance of difference from HFD fed group calculated by LSD at P < 0.05.
Compared to the control group, serum zonulin level was significantly increased in HFD fed group (P < 0.001). It showed a significant decrease in the synbiotic supplemented group compared to HFD fed group (P < 0.001). Meanwhile, compared to the control group, serum zonulin remained significantly higher in synbiotic supplemented group.
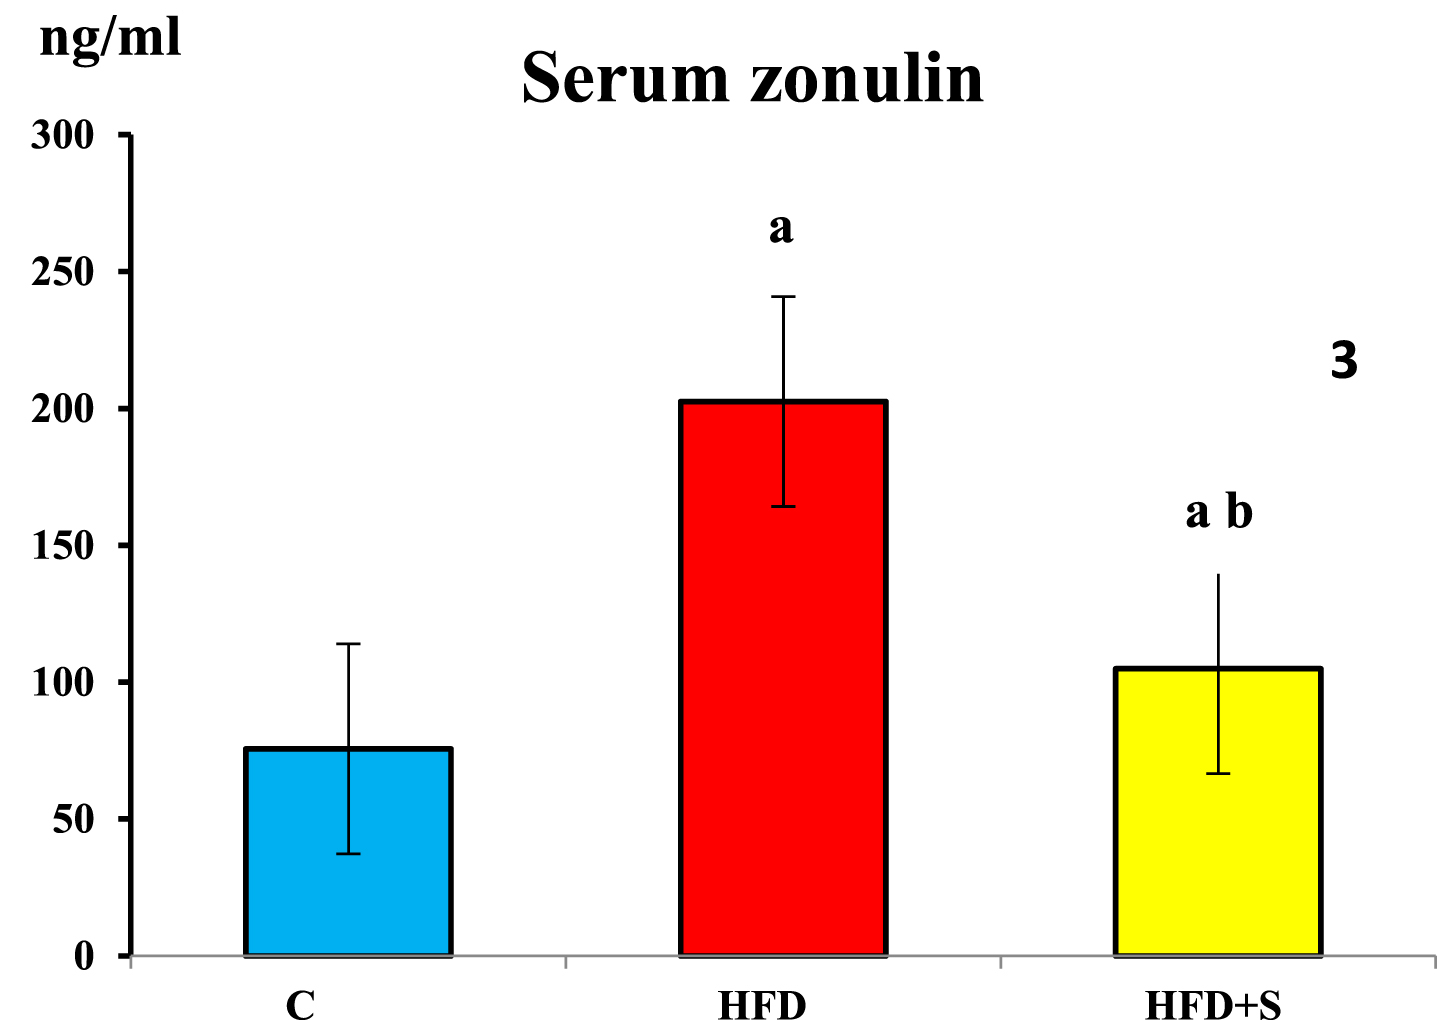
Showing serum zonulin levels in the 3 studied groups. a: Significance of difference from the control group calculated by LSD at P < 0.05. b: Significance of difference from HFD fed group calculated by LSD at P < 0.05.
Compared to the control group, quantitative cecal short chain fatty acids (SCFAs) were significantly decreased in HFD fed group (P < 0.001 for all). Following synbiotic supplementation, compared to the HFD fed group, SCFAs were significantly increased (P < 0.001 for all). However, their values were still significantly lower than the control group in synbiotic supplementation group (P < 0.001 for all).
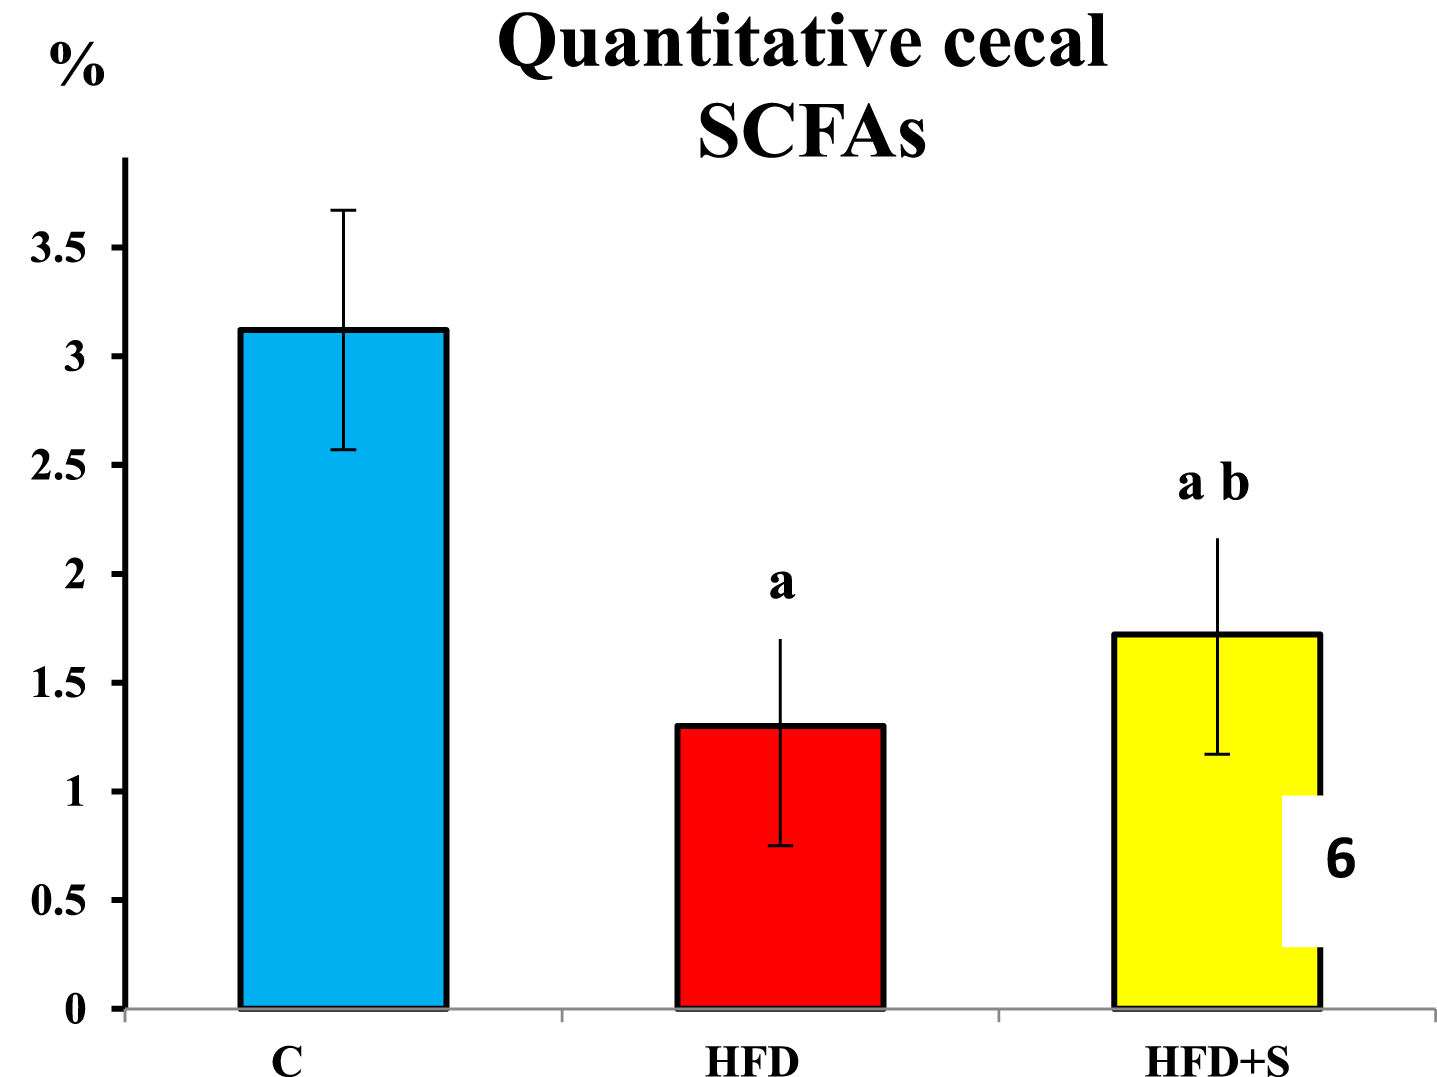
Showing quantitative cecal short chain fatty acids in the 3 studied groups. a: Significance of difference from the control group calculated by LSD at P < 0.05. b: Significance of difference from HFD fed group calculated by LSD at P < 0.05.
Histological changes in the liver:

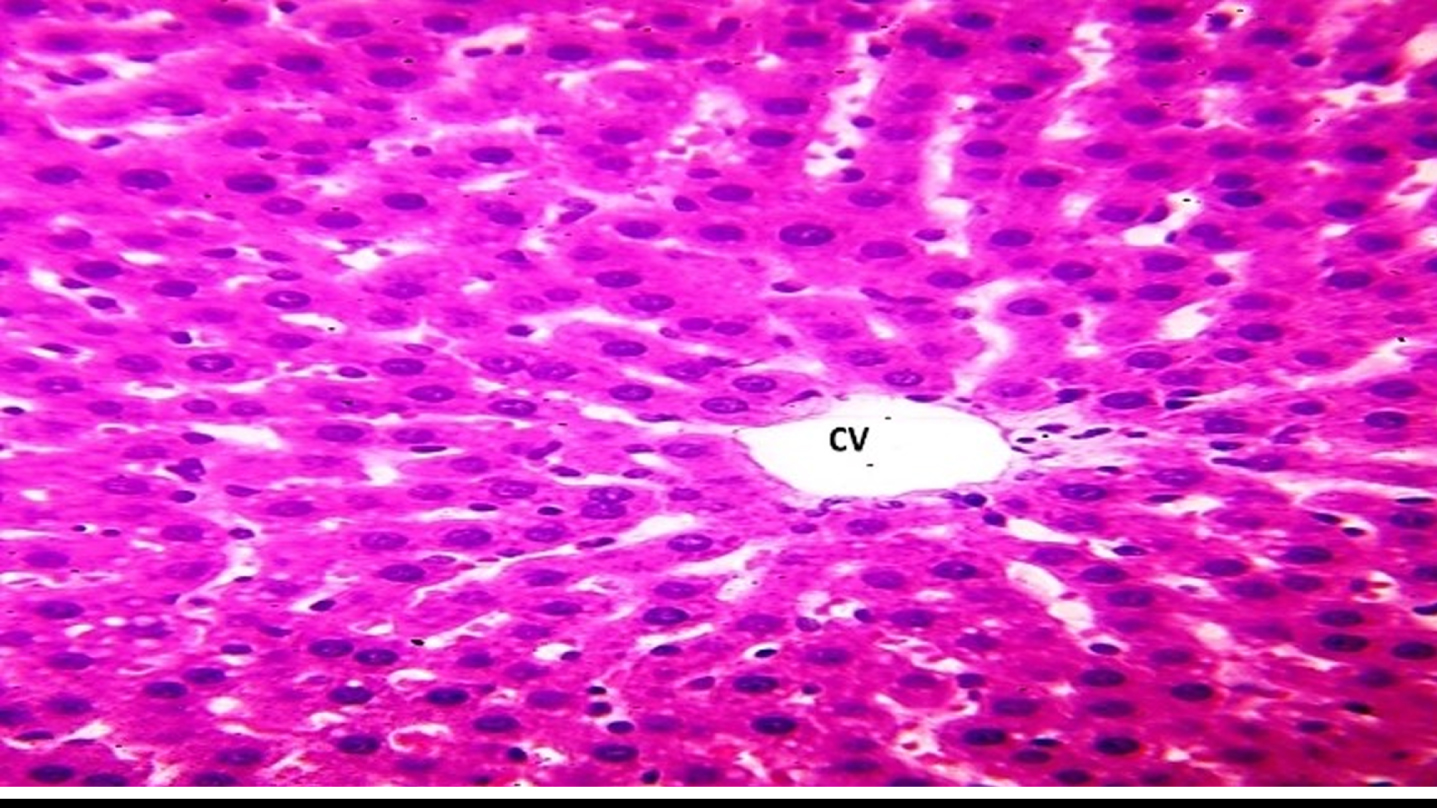
H&E-stained sections of the liver of control rats. a Showing the general appearance of the classic hepatic lobules, traversed by central veins (CV) and peripherally situated portal areas ().  ) were also seen. In-between the hepatic cords, blood sinusoids (
 ) were seen as slit like spaces.
As shown in Figure (8), the liver of high fat diet fed rats (HFD) showed marked affection in both stroma and parenchyma. Thickened septa, inflammatory cells (lymphocytic) infiltration, congestion and dilatation in portal vein and blood sinusoid were seen (c) as well as distorted wall of central vein (CV). The portal areas were seen with thickened congested portal vein. The parenchyma of the liver showed irregular organization of hepatocyte cords with vacuolated hepatocytes containing multiple, large cytoplasmic vacuole and deeply stained nuclei. Moreover, fat cells were seen in between them.

H&E-stained sections of the liver of high fat diet fed rats. a,b Showing Thickened septa and inflammatory cells (lymphocytic) infiltration (), congestion and dilatation in portal vein and blood sinusoid with irregular organization of hepatocyte cords (vacuolated & deeply stained nuclei) Moreover, fat cells are present in between them ( ) (
) (
As shown in Figure (9), the liver of synbiotic supplemented HFD rats showed moderate improvement in hepatic architecture. It showed minimal inflammatory cells (lymphocytic) infiltration, mild congestion, presence of minimal vacuolated hepatocytes foci with disappearance of fat cells.
H&E-stained sections of the liver of symbiotic-treated high fat diet fed rats. Showing moderate improvement in hepatic architecture, minimal inflammatory cells (lymphocytic) infiltration, mild congestion, presence of minimal vacuolated hepatocytes foci with disappearance of fat cells.
As shown in Figure (10), histological examination of H&E-stained sections of the colon of control rats showed that the mucosa forms regular crypt. The surface of the colon and crypt were lined by continuous simple columnar epithelium with goblet cells. Columnar cells alternative with goblet cells in ratio 1:1. The epithelium was resting on loose connective tissue (lamina propria (L.P)) and showed continuous regular thick brush border.
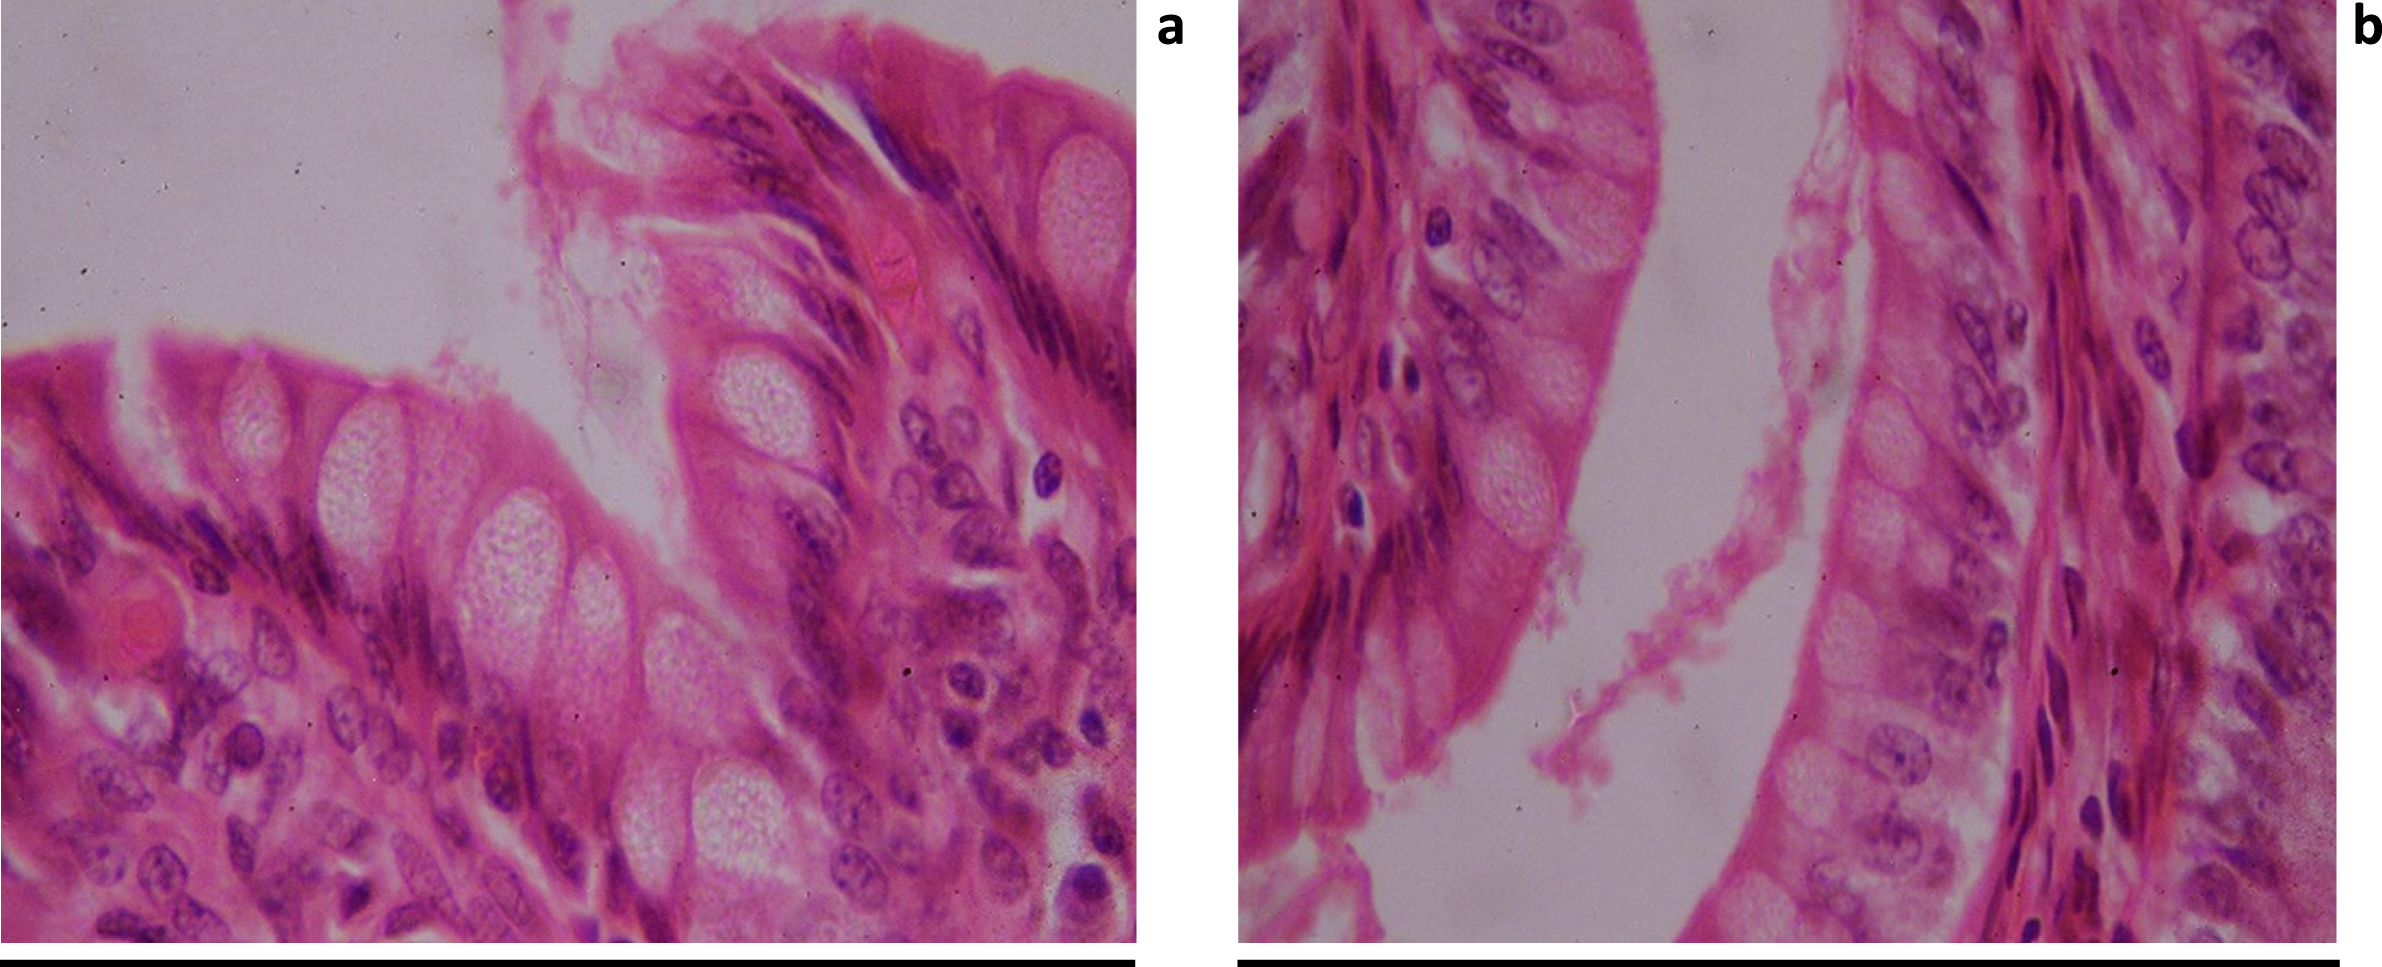
H&E-stained sections of the colon of control rats. Showing the colon mucosa that forms regular crypt. lined by continuous simple columnar epithelium with goblet cells in ratio 1:1. This epithelium showed continuous regular thick brush border. The epithelium resting on loss connective tissue (lamina propria (L.P)).
As shown in Figure (11), the colon of high fat diet fed rats (HFD) showed ulceration and desquamation of epithelial lining the surface and crypt with inflammatory cell infiltration in L.P (denoting loss of intestinal barrier).

H&E-stained sections of the colon of high fat diet fed rats. Showing ulceration () and desquamation (D) of epithelial lining the surface and crypt (i.e. Denoting loss of intestinal barrier). Also, inflammatory cell infiltration in L.P.
As shown in Figure (12), the colon of synbiotic supplemented HFD rats showed lining epithelial cells covering most of the surface with well-developed brush border. However, some cell showed disorganization (i.e intestinal barrier is not well established). There was increased number of goblet cells.

H&E-stained sections of the colon of synbiotic-treated high fat diet fed rats. Showing lining epithelial cells covering most of the surface with well-developed brush border () however some cell showed disorganization (i.e intestinal barrier is not well stablished). There was increased number of goblet cells ( ).
).
Correlation studies were done including all the 3 groups
Correlation between GUT hormones, short fain fatty acids and other parameters:
In Figure (13) Serum glucagon like peptide-1 (GLP-1) showed significant negative correlation with body mass index gain%, serum low density lipoprotien, HOMA and serum zonulin.
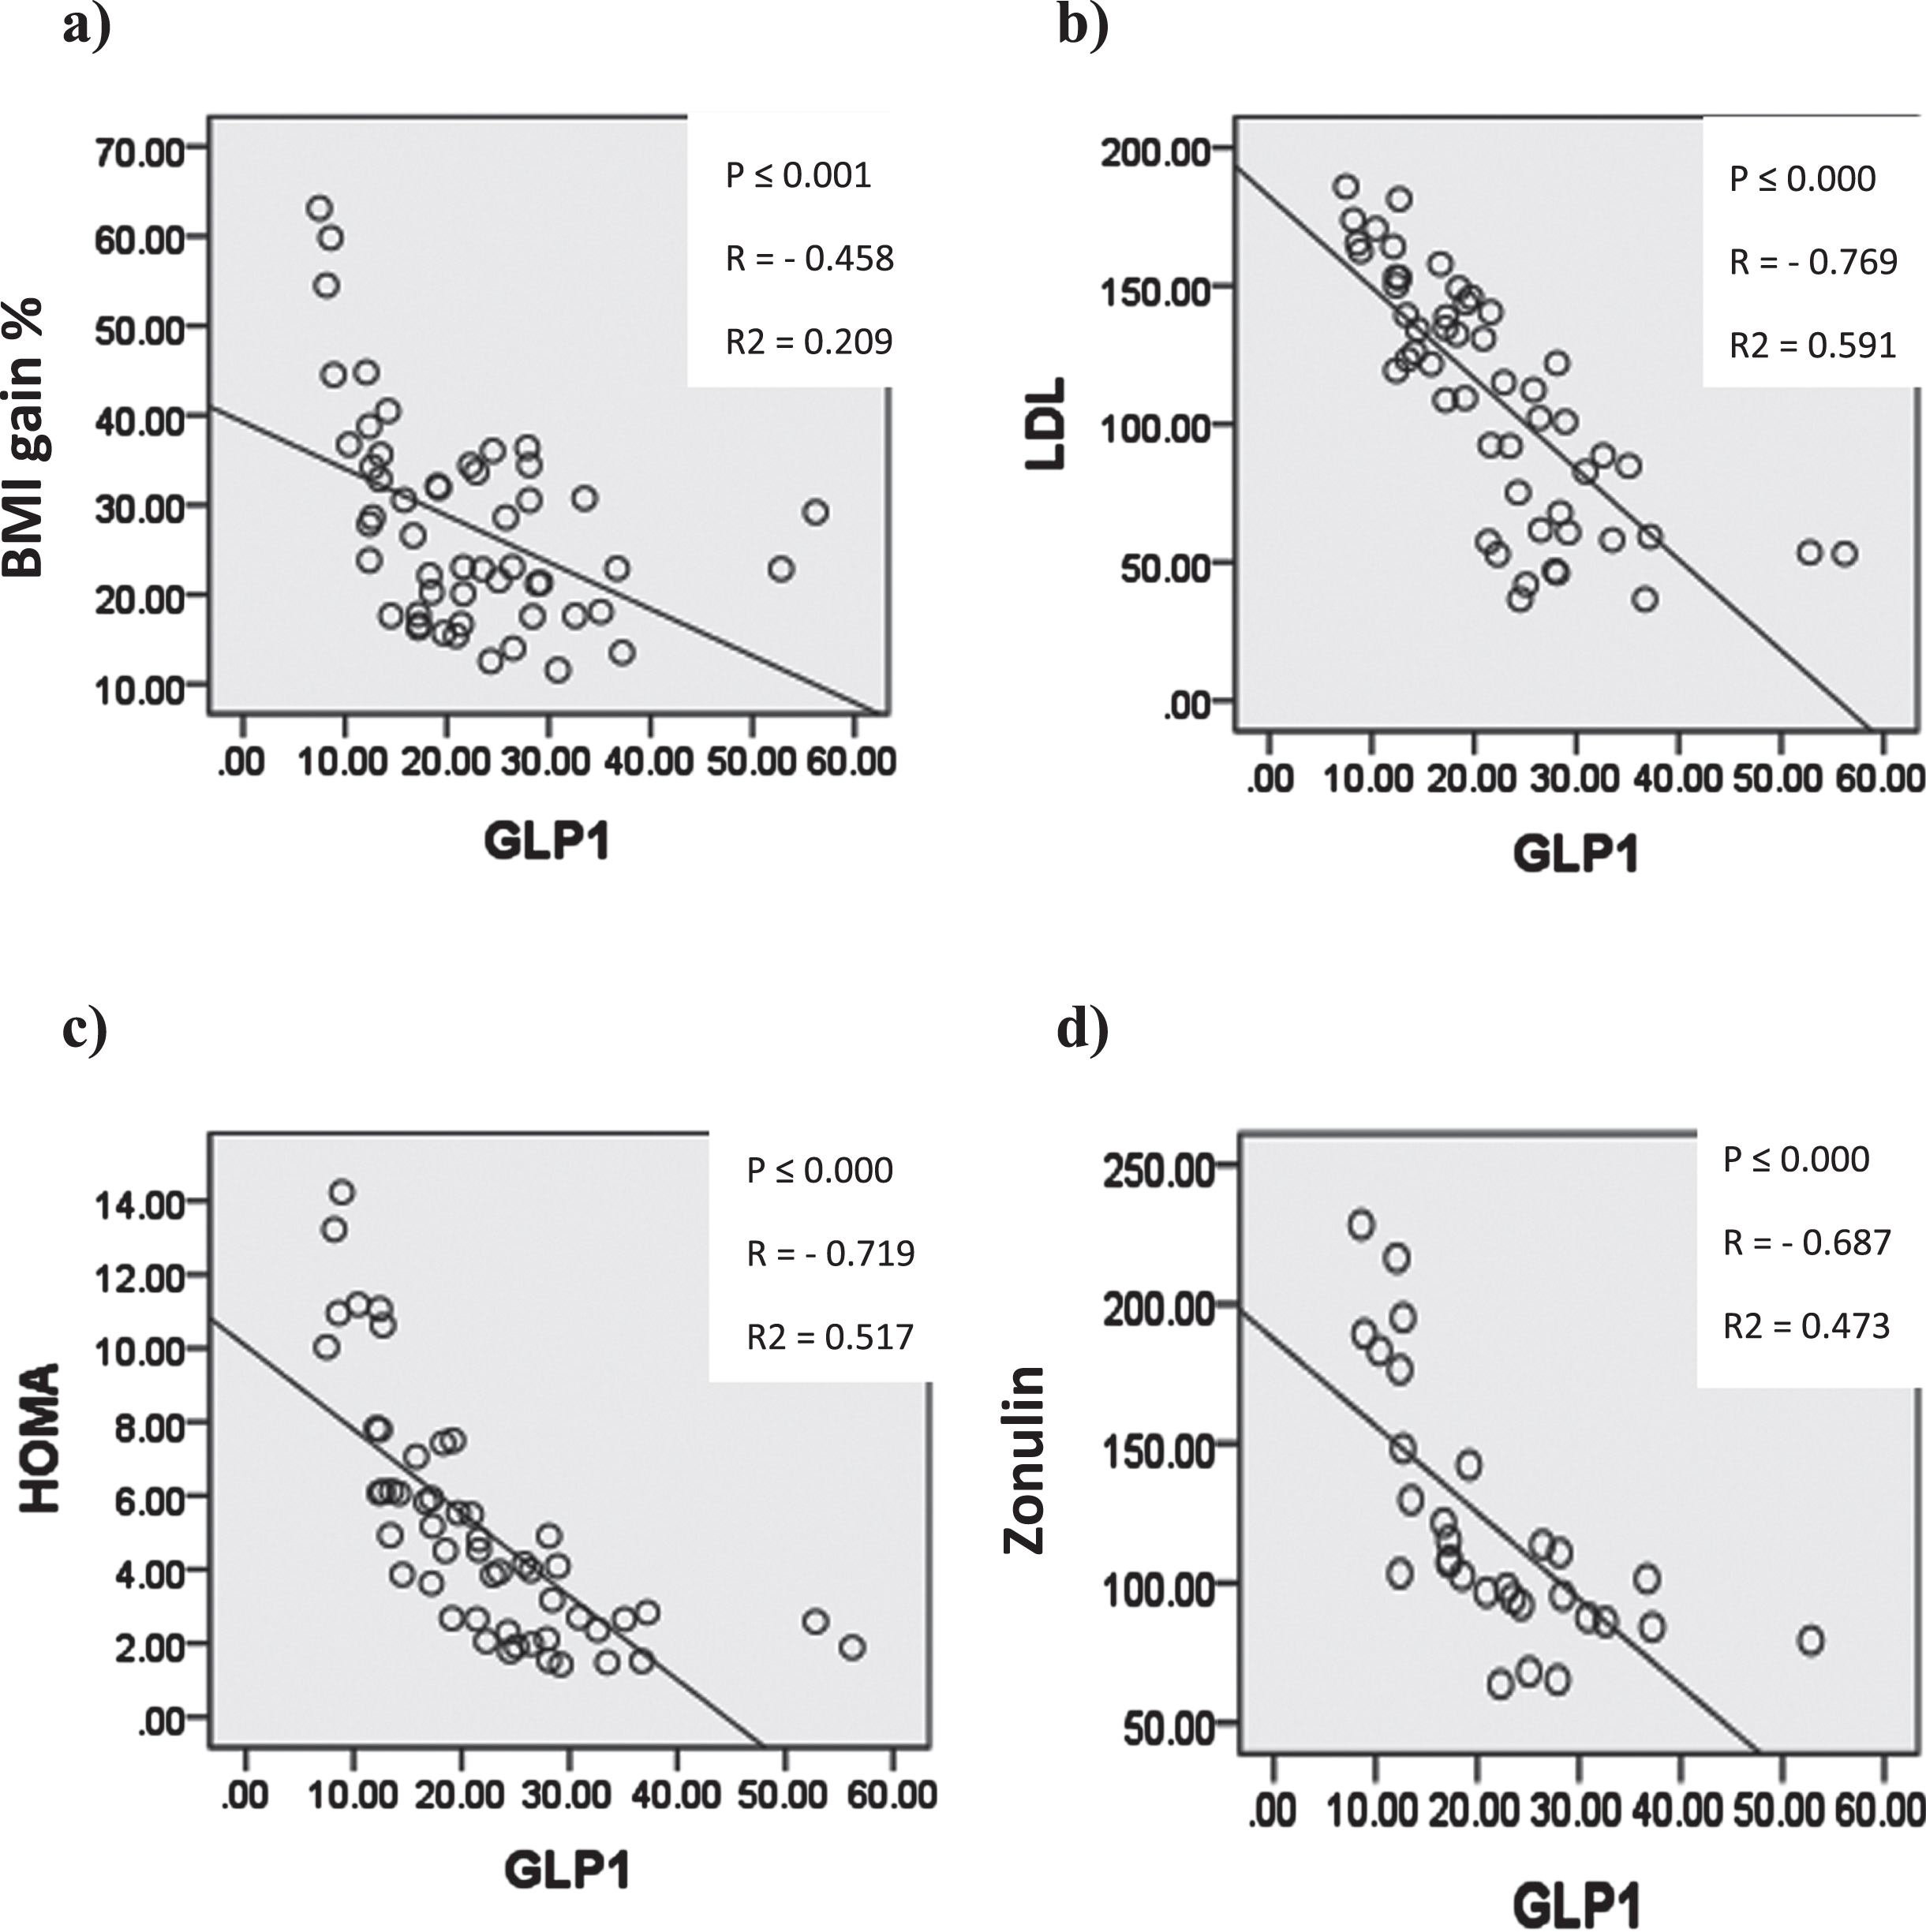
Graphs showing significant correlation coefficient (P), Regression lines and coefficients of determination (R2) between serum GLP-1 and a) BMIg% b) serum LDL c) HOMA d) serum zonulin.
In Figure (14) Serum serotonin showed significant negative correlation with body mass index gain%, serum low density lipoprotien, HOMA and serum zonulin.
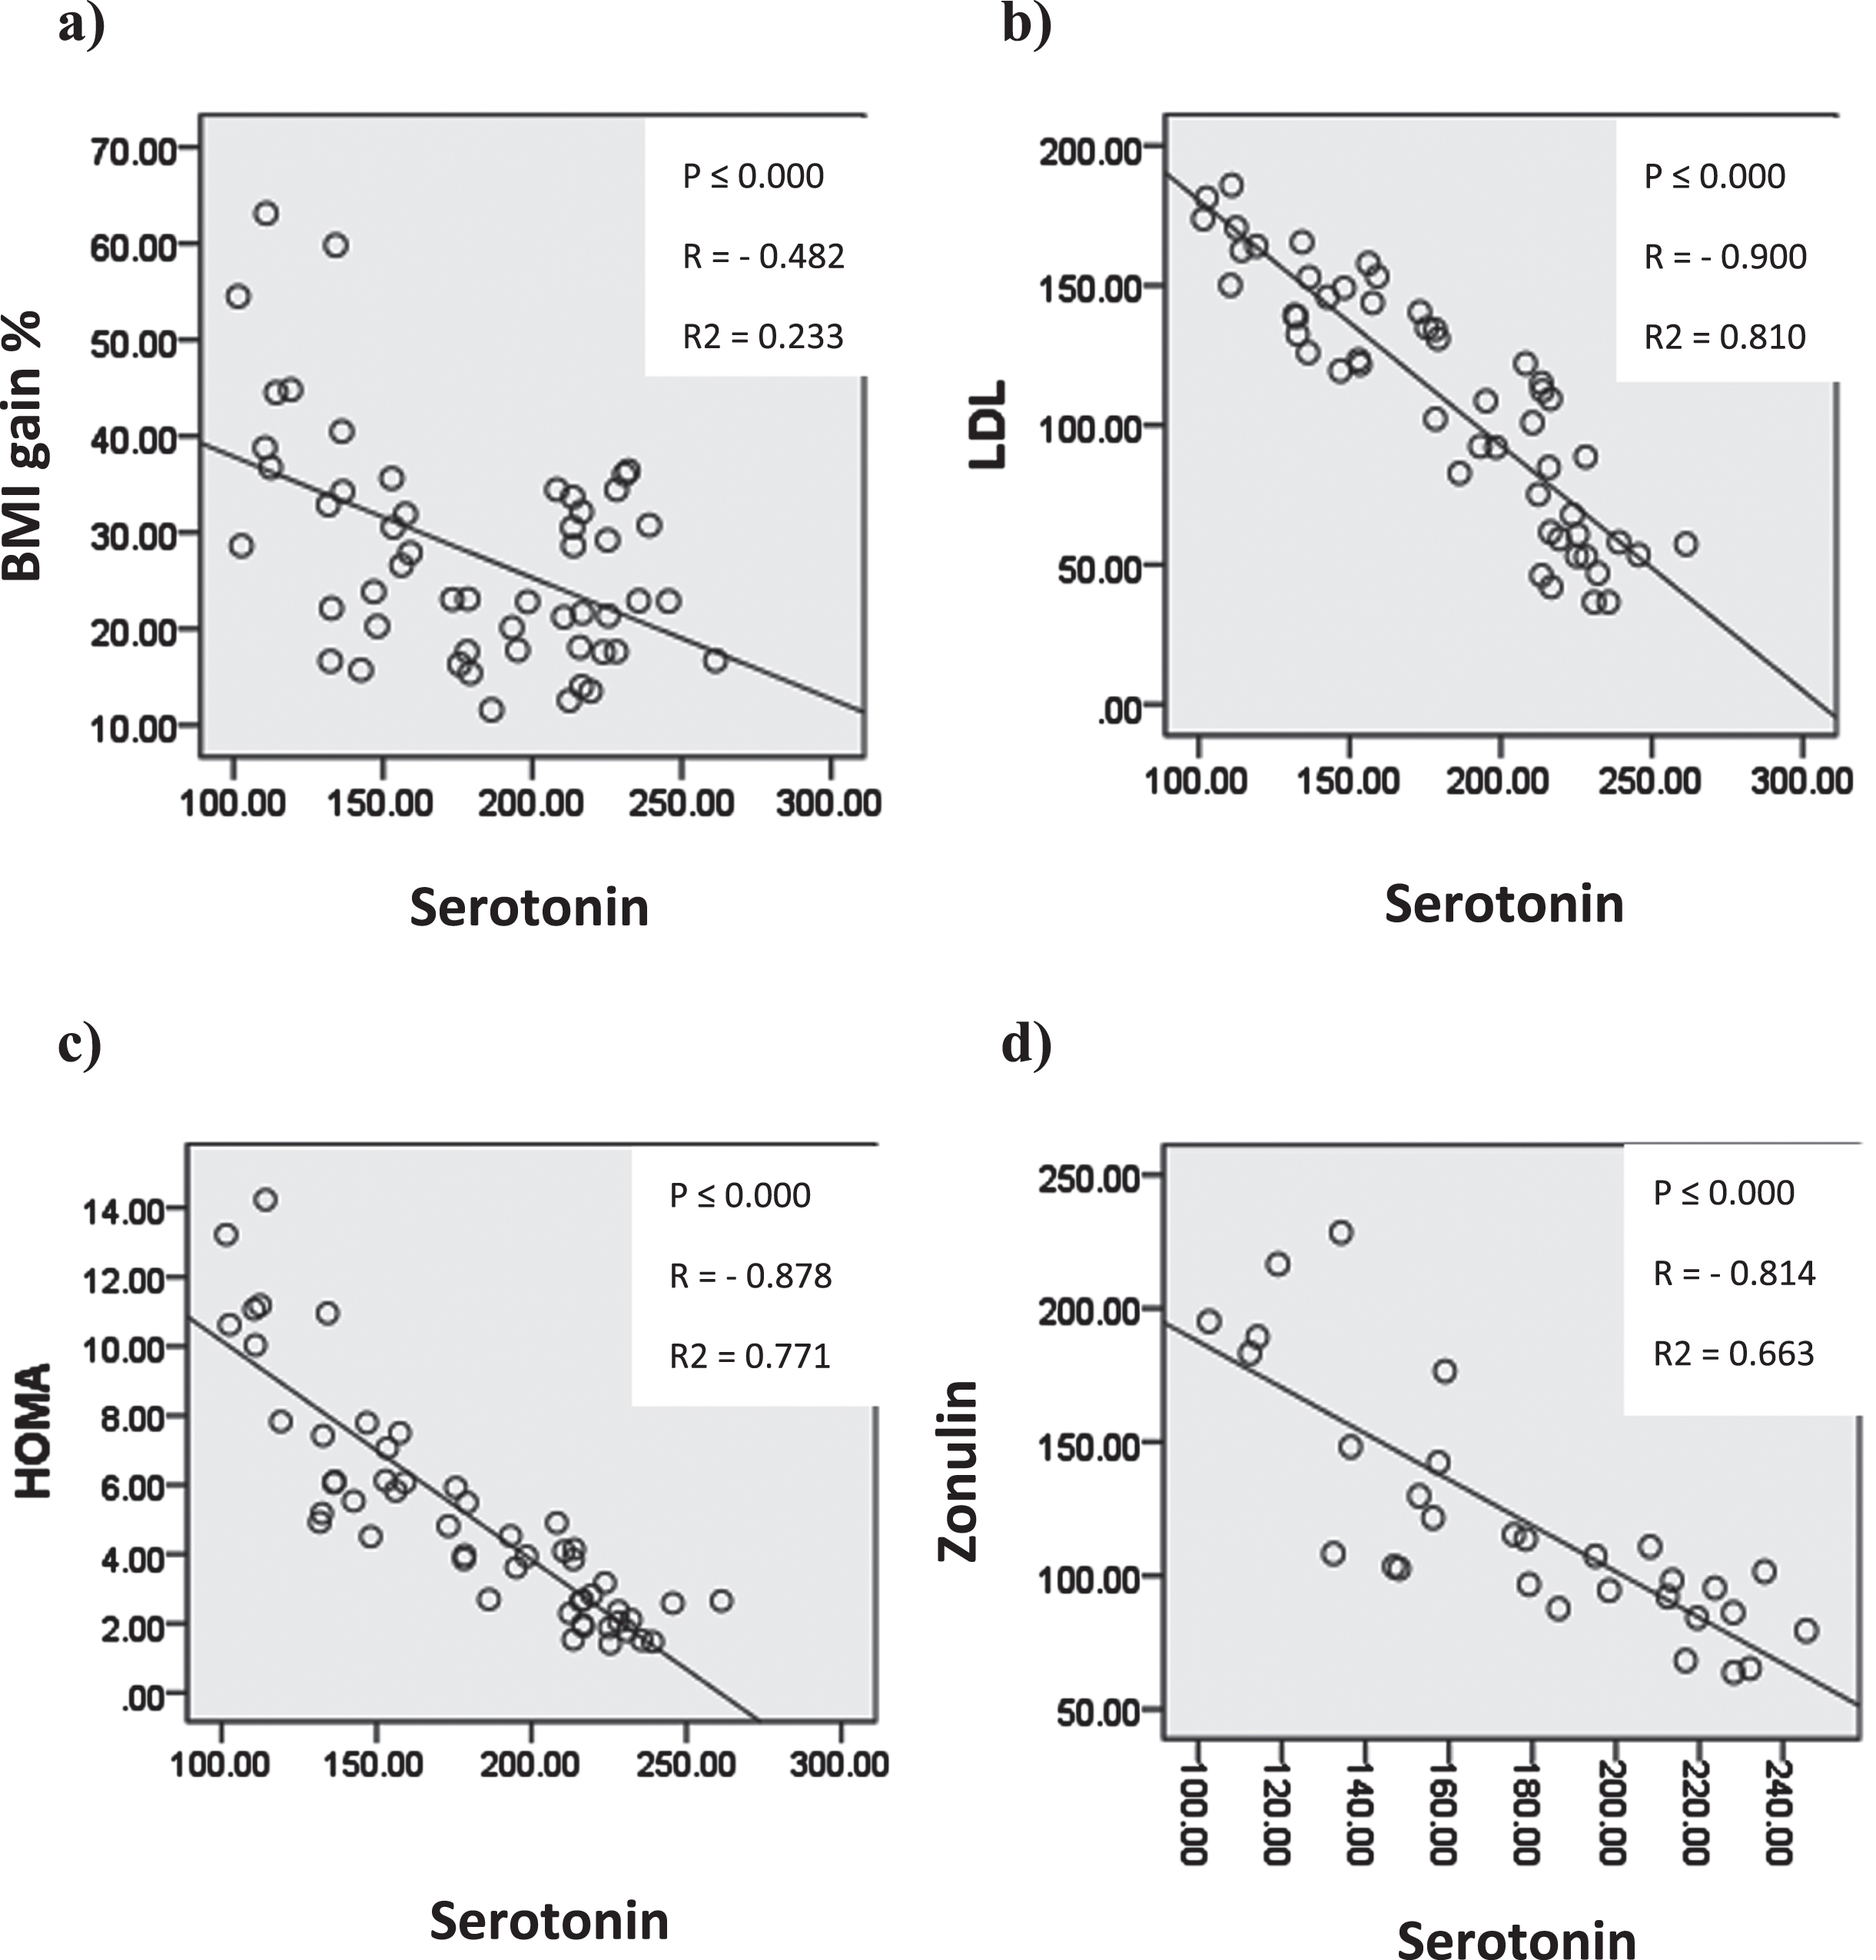
Graphs showing significant correlation coefficient (P), Regression lines and coefficients of determination (R2) between serum serotonin and a) BMIg% b) serum LDL c) HOMA d) serum zonulin.
In Figure (15) Cecal short chain fatty acids showed significant negative correlation with body mass index gain%, serum low density lipoprotien, HOMA and serum zonulin.
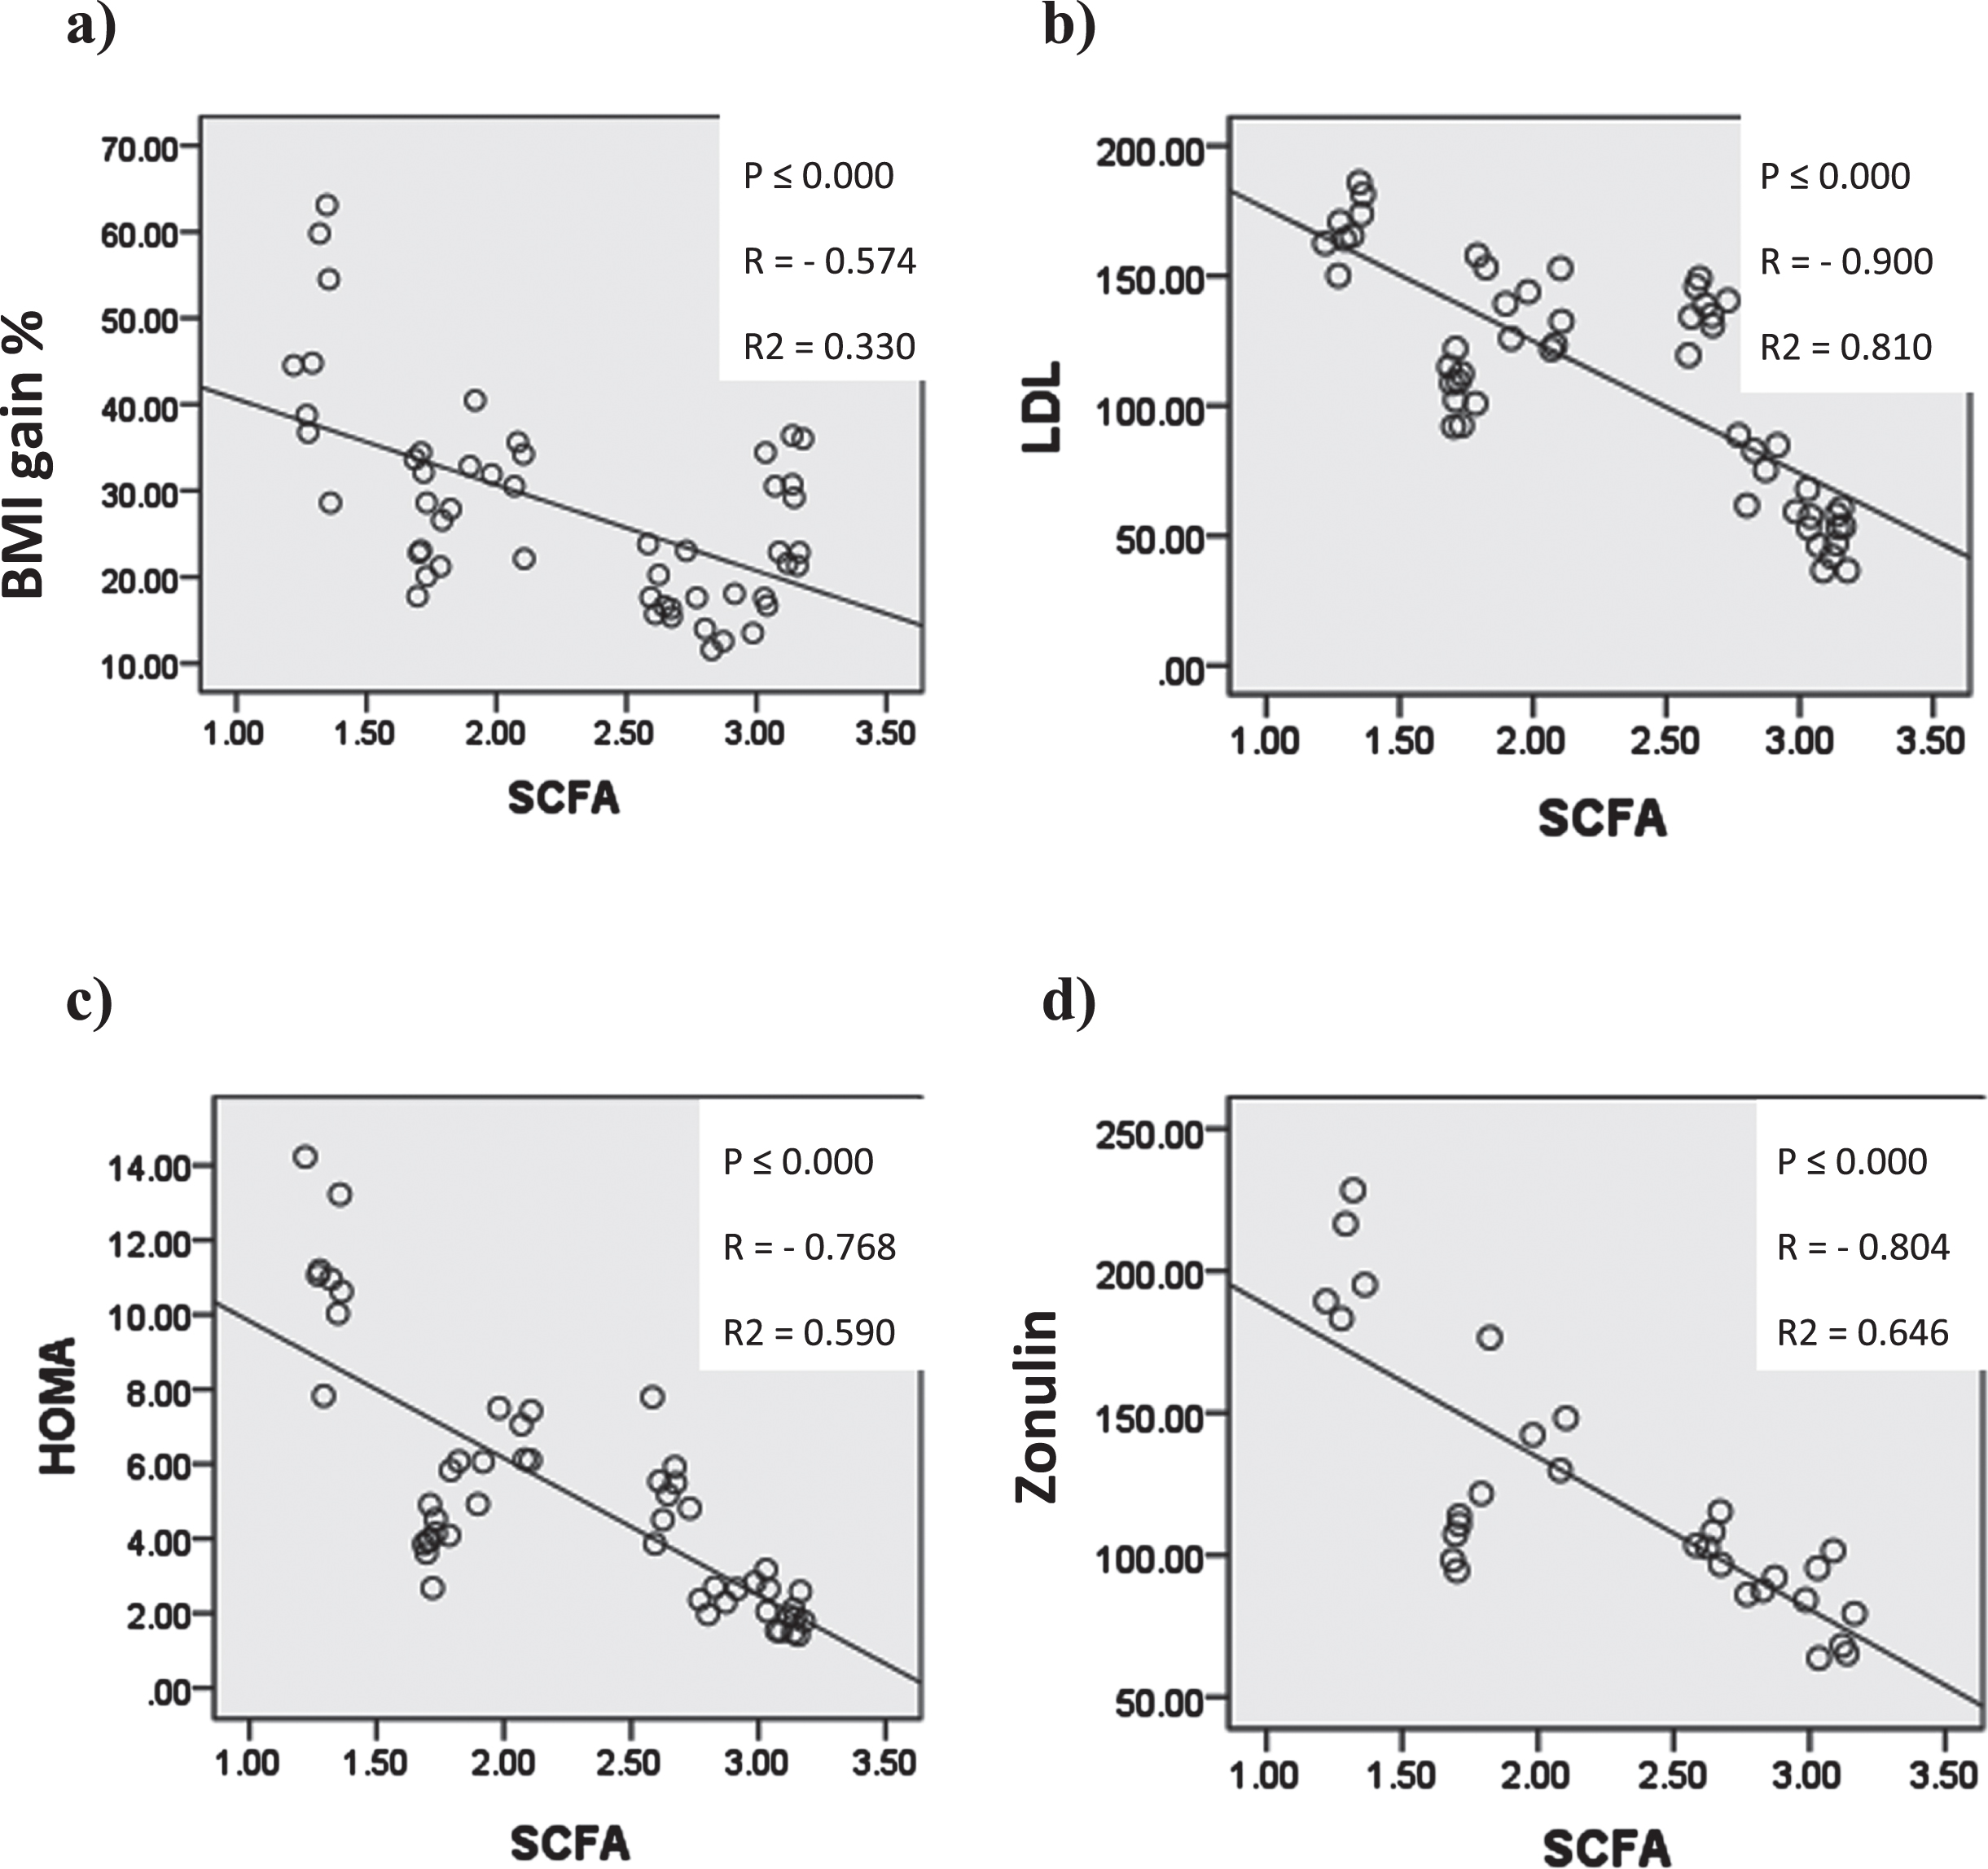
Graphs showing significant correlation coefficient (P), Regression lines and coefficients of determination (R2) between Quantitative cecal SCFAs and a) BMIg% b) serum LDL c) HOMA d) serum zonulin.
In Figure (16) Cecal short chain fatty acids showed significant positive correlation with serum glucagon like peptide-1 and serotonin.
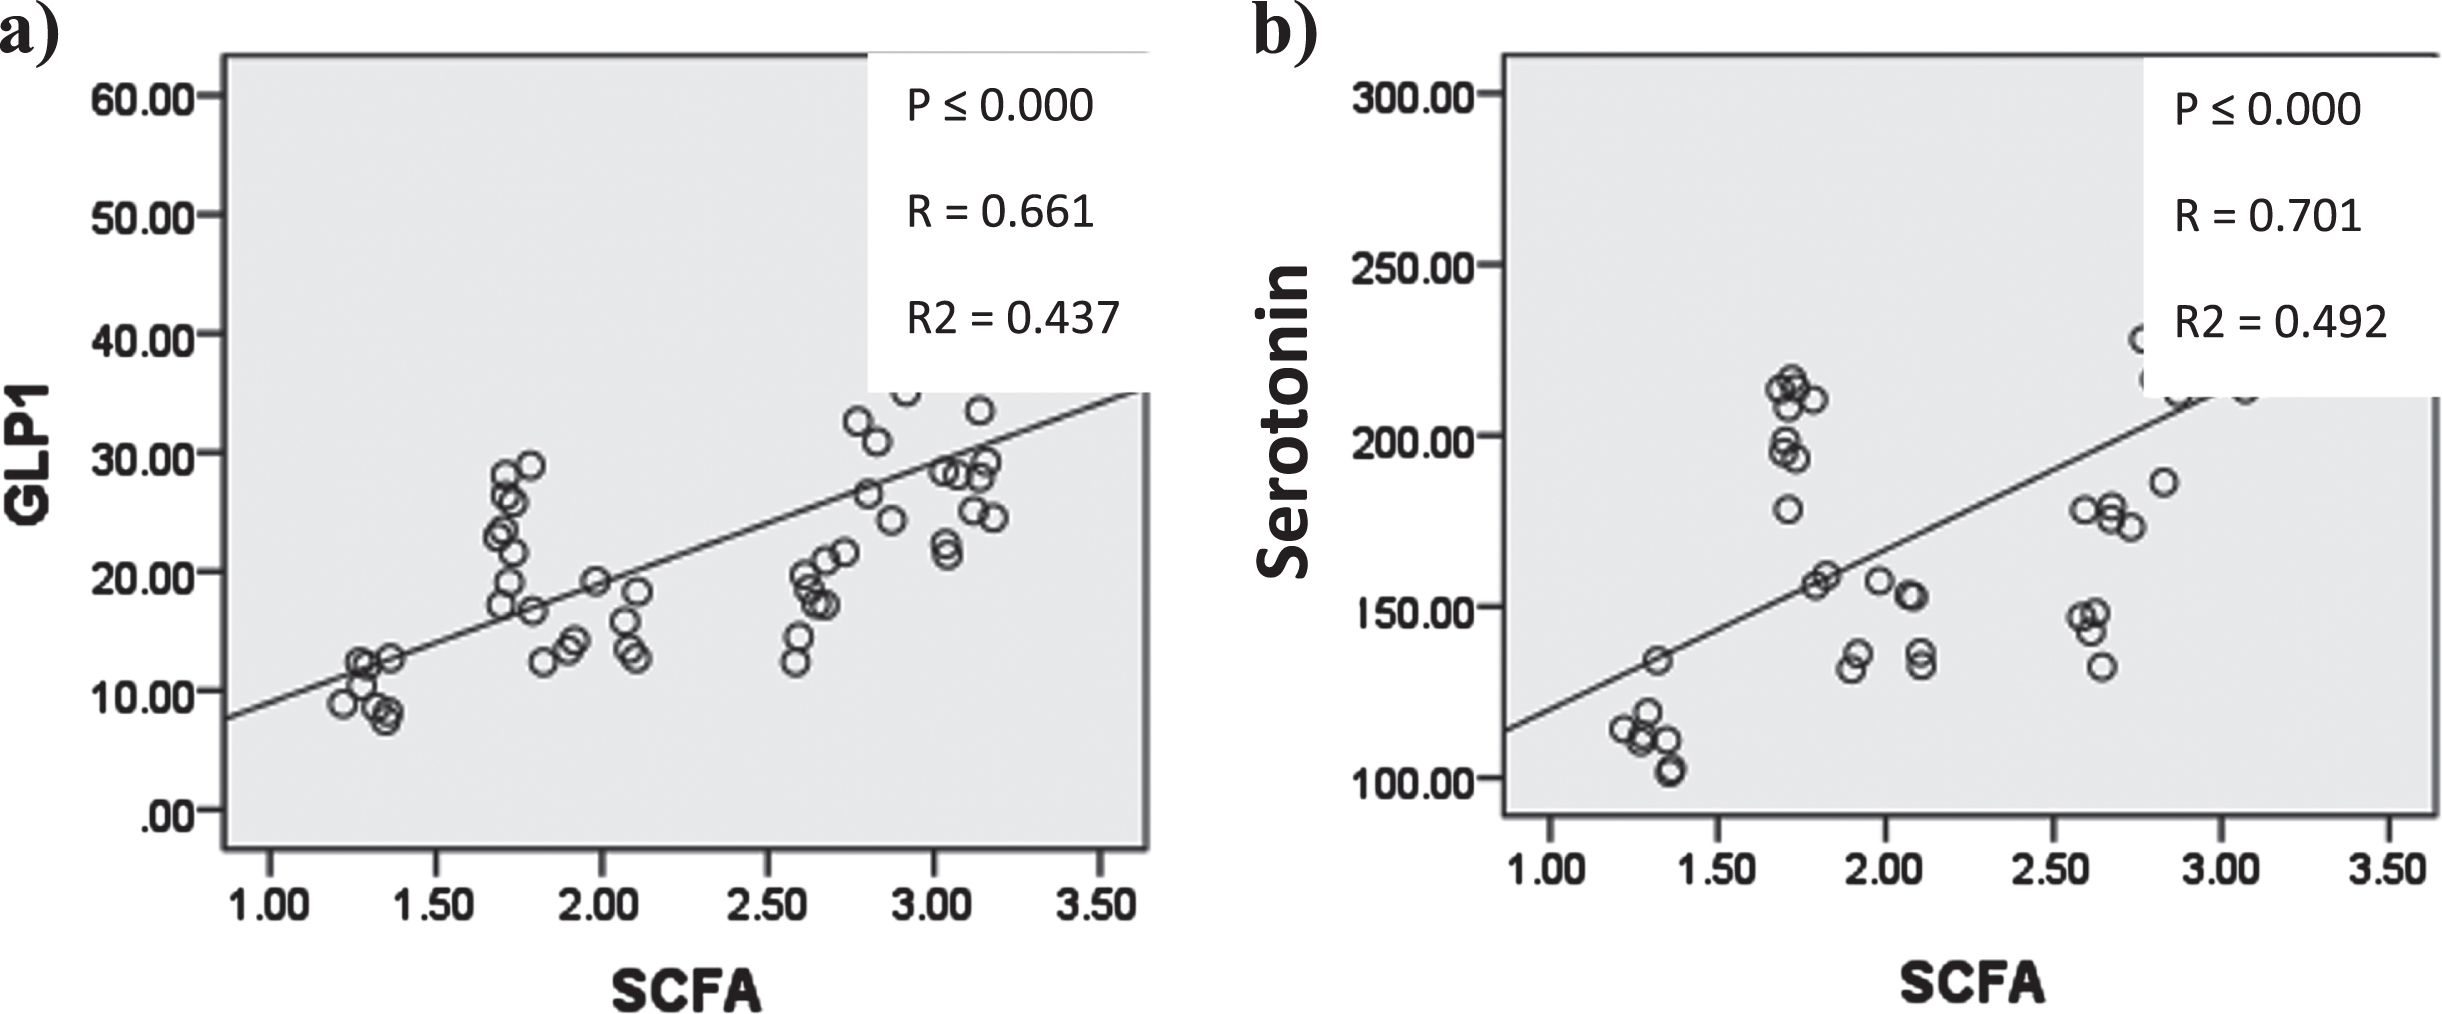
Graphs showing significant correlation coefficient (P), Regression lines and coefficients of determination (R2) between Quantitative cecal SCFAs and a) serum GLP-1 b) serum serotonin.
In Figure (17) Serum malondialdehyde (MDA) showed significant positive correlation with serum liver transaminases (ALT&AST), low density lipoprotein, HOMA and serum zonulin. And significant negative correlation with serum glucagon like peptide-1, serotonin and cecal short chain fatty acid.
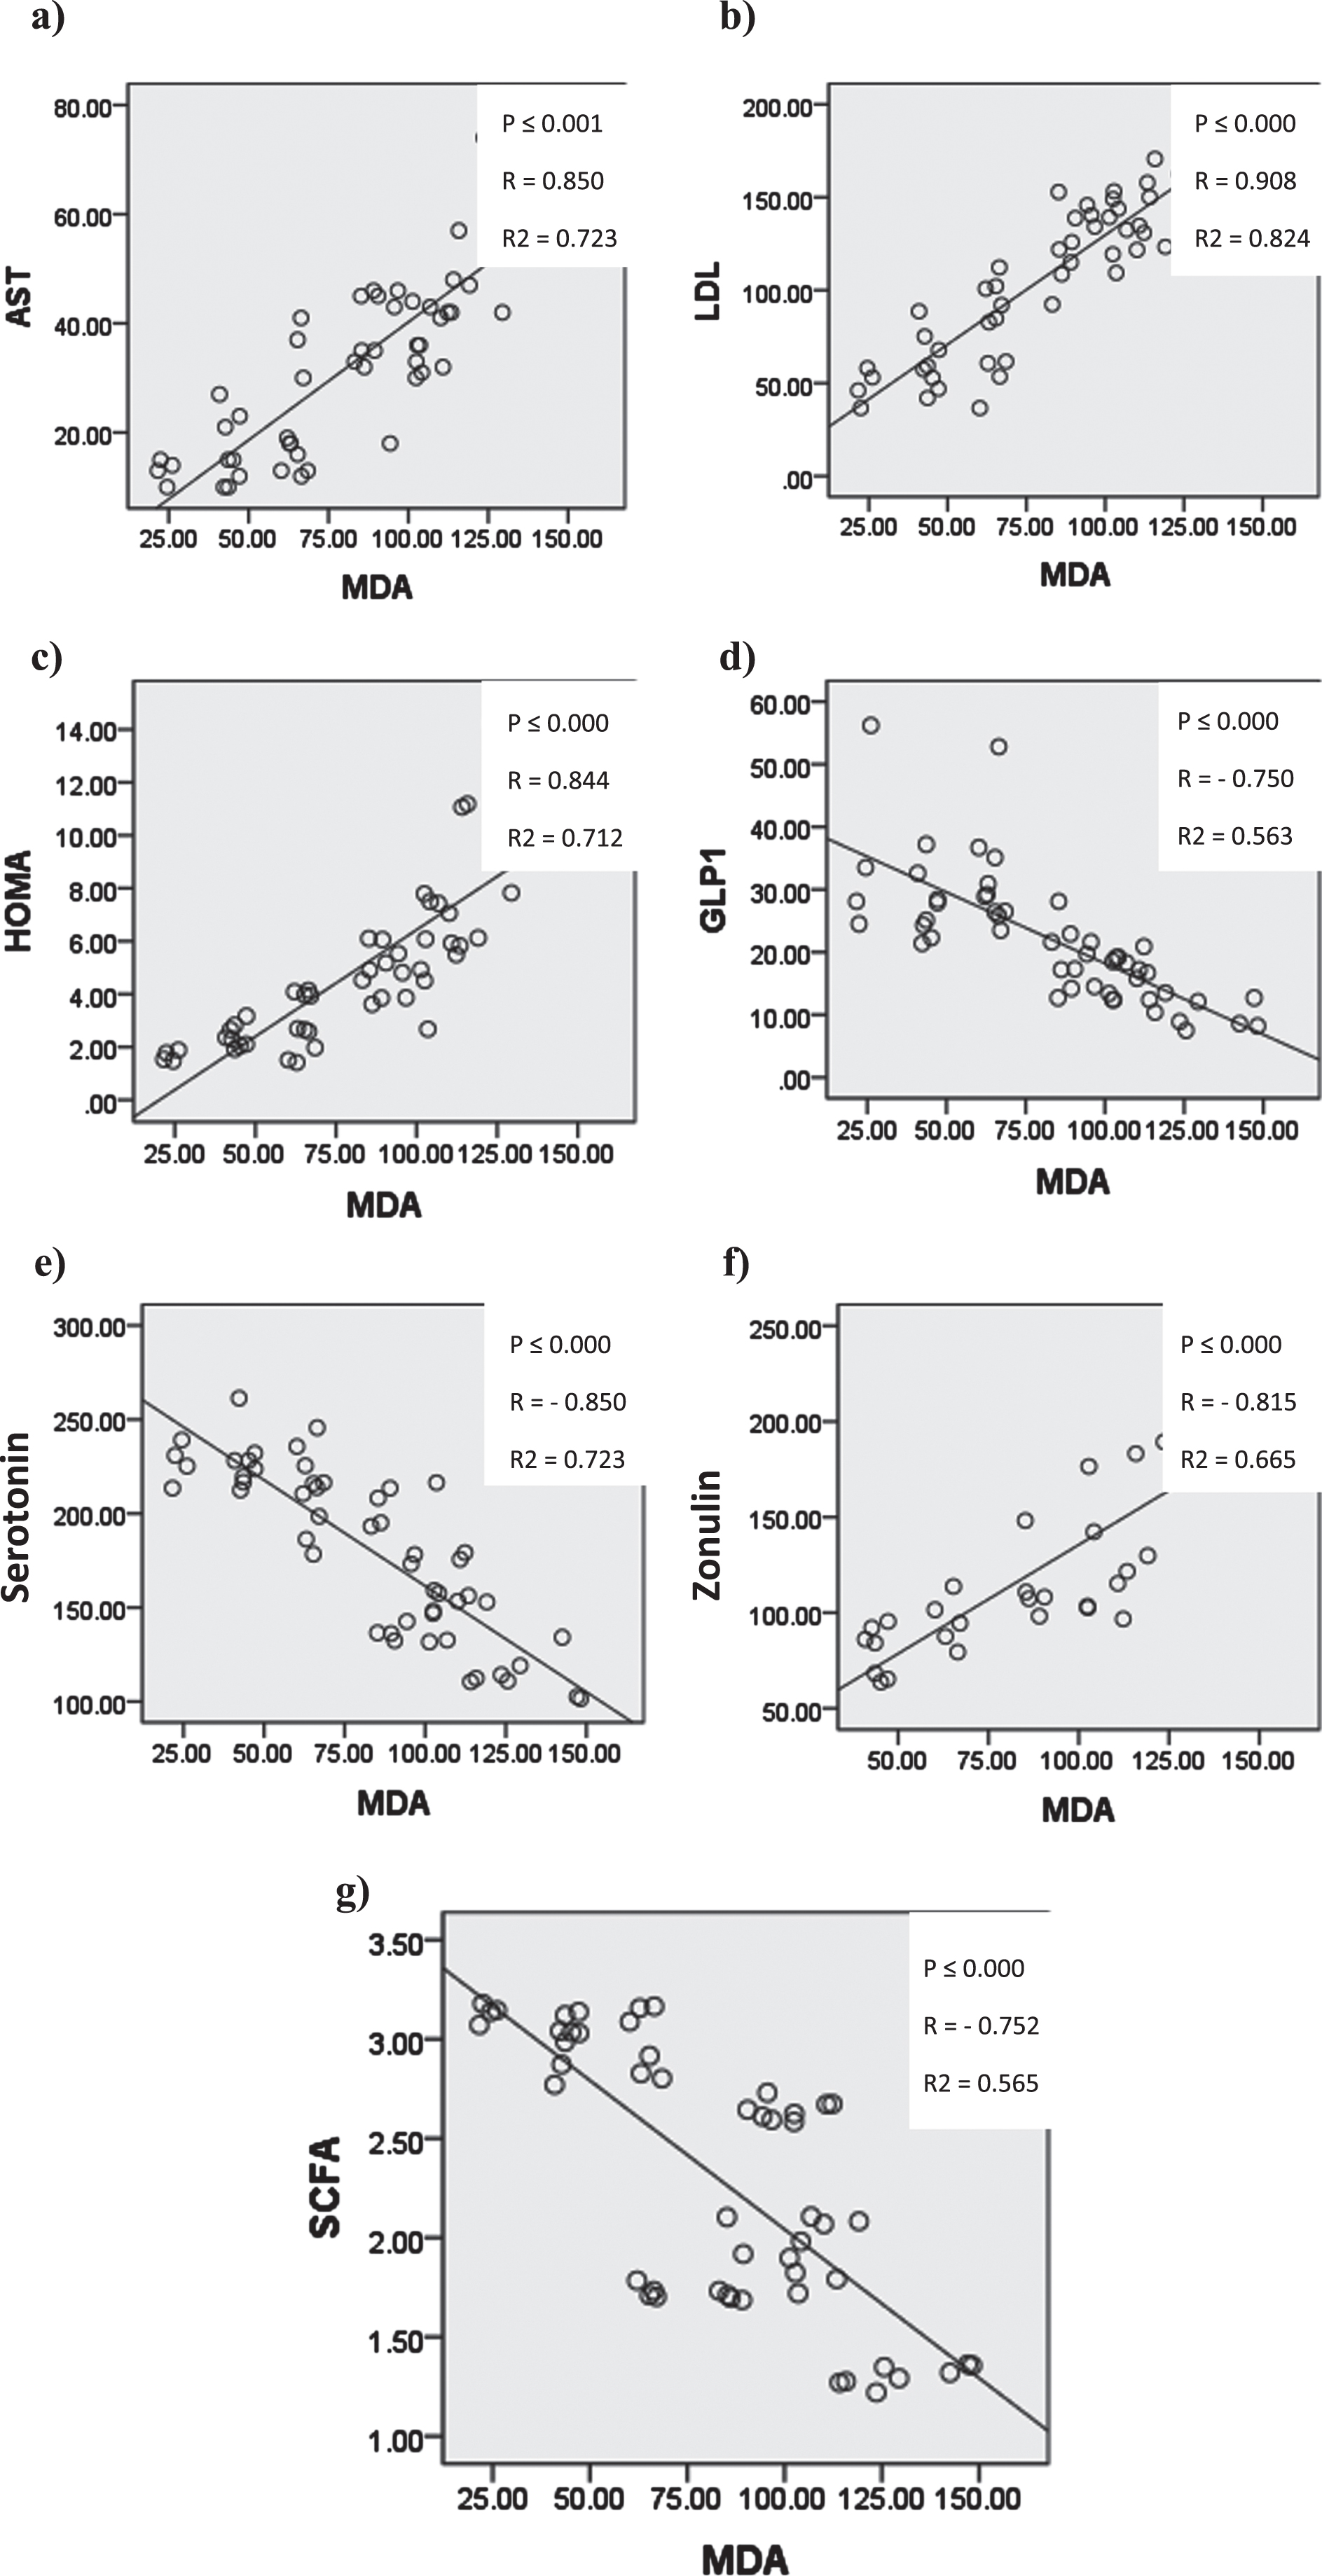
Graphs showing significant correlation coefficient (P), Regression lines and coefficients of determination (R2) between Serum MDA and a) serum AST b) serum LDL c) HOMA d) GLP-1 e) serum serotonin f) serum zonulin g) cecal SCFAs.
The obesogenic effect of fat rich diet [48] was evident in this study by the significantly higher body weight, BMI, Lee index and their gain % in the high fat diet group compared to the control group. This could be attributed to higher rate of acylation of saturated fatty acids into triglycerides and lower oxidation rate compared to monounsaturated and polyunsaturated fatty acids [49]. High fat diet also causes hyperphagia and decrease satiety causing more diet consuming [50]. Added to the ability of dietary fat to increase the expression of the hypothalamic genes in reward pathways to increase energy intake and therefore body adiposity [50].
Moreover, the inflammatory effect and the consequent associated oxidative stress state of high fat diet could be confirmed in this study by the associated higher serum MDA, one of the indicators of oxidative stress [51] and the lower serum GPx levels. This was supported by the presence of inflammatory cell infiltration in lamina propria of colon of HFD fed rats, with ulceration and desquamation of surface epithelial lining and crypts of the colon.
These inflammatory and oxidative states led to disruption of the intestinal barrier and escape of the fecal short chain fatty acids to systemic circulation. This was reflected on the higher serum Zonulin levels, a protein biomarker of intestinal permeability, and the lower fecal SCFAs. Added to the positive correlation between MDA and Zonulin. This goes in accordance with previous studies that reported elevation in MDA with reduction in superoxide dismutase (SOD) and GPx activities as well as higher serum Zonulin levels in both high fat diet fed and obese individuals [52].
Moreover, disruption of the intestinal barrier may lead to pathological translocation of bacteria or their metabolites to the systemic circulation [53] causing metabolic endotoxemia which added to the dysbiosis induced impairment in immune cells will augment the inflammation [54].
Therefore, mentioned oxidative and inflammatory states were accompanied by dyslipidemia which together with high fat diet induced obesity could enhance the flow of more free fatty acids to hepatic cells leading to hepatic fat deposition, dysregulation of adipokines going with Ali et al. (2021) [55] postulations. This was evident by the higher serum liver transaminases (ALT& AST) in high fat diet group and by the significant positive correlation between serum liver transaminases and each of serum MDA and serum LDL.
Further, overproduction of reactive oxygen species (ROS) with high fatty acids can explain the increase in fasting blood glucose and genesis of insulin resistance as they might inhibit the glucose-induced insulin secretion in β cells and stimulate their necrosis & apoptosis, decrease GLUT4 transporter expression in the cellular membrane [56] or downregulate some of the important insulin signaling proteins [57]. This could be suggested in this study by the significant positive correlation between FBS, insulin and HOMA score with the level of MDA.
Glycemic control impairment and insulin resistance could be also related to the HFD-induced obesity associated intestinal barrier disruption and dysbiosis followed by leakage of gut derived antigens and lipopolysaccharide, a major bacterial endotoxin, to the nearby visceral adipose tissue leading to hyperplasia, inflammation, and insulin resistance [58].
The detected decrease in SCFAs consequent to intestinal barrier disruption led to loss of their beneficial effects on glucose homeostasis, insulin sensitivity and inflammatory state which may explain increased insulin resistance going with [59] who reported their ability to suppress production of pro-inflammatory cytokines.
The dysbiosis and the reduction in fecal SCFAs might also explain the reduction in both serum serotonin and GLP-1 as they all showed positive correlation with each other added to the previous reports that SCFAs are known to stimulate intestinal secretion of the anorexic glucagon-like peptide 1 (GLP-1) and 5-HT [3–59]. Moreover, Zaky et al. (2021) [60] recorded a decrease in the expression and production of anorectic hormones as GLP-1 in dysbiotic patients.
In addition, proinflammatory status associated with obesity decreases both serum serotonin and GLP-1 as it increases the expression of indoleamine-2,3-dioxygenase the enzyme responsible for degradation of tryptophan, the precursor of serotonin [61] and dipeptidyl peptidase enzyme (DPP4) which degrades GLP-1 [62]. Also, it decreases GLP-1 receptor expression [63]. This agrees with previous studies described by [51].
In return, the reduction in both serum serotonin and GLP-1 augment obesity as they showed a significant negative correlation with body mass index gain % and Lee index gain %. This may be attributed to the loss of the anorexigenic effect of GLP-1 [64], or due to loss of the serotonin ability to induce an elevation in expression of energy expenditure-related genes as described before in mice [65] or to promote energy expenditure by enhancing sympathetic drive to brown adipose tissue through stimulation of HTR1A and HTR7 [66].
In addition, the significant negative correlation between serotonin and fasting glucose, insulin and HOMA score suggest its role in insulin resistance. Serotonin is described before to be co secreted with insulin from granules of β cells of pancreas in response to glucose as both serotonergic neurons and β-cells proved to show common expression profiles of genes and transcription factors [67].
Further, Kim et al., (2015) [68] reported that tryptophan gene deletion in β-cells caused impaired insulin release and glucose intolerance in mice fed a high-fat diet.
Further, low serotonin and GLP-1 might be involved in pathogenesis of non-alcoholic fatty liver disease (NAFLD). Binetti et al., (2020), [69] reported that the expression of hepatic, intestinal serotonin receptors were decreased in obese women who have NAFLD. Also, Breit and Gudermann, (2020), [70] reported decrease in GLP-1 with high fat diet. GLP-1 agonists were able to decrease liver enzymes, improve hepatic steatosis by reducing de novo lipogenesis, enhancing oxidation of fatty acids.
Synbiotics supplementation led to significantly lower anthropometric parameters than those of high fat diet group being non-significantly different from the control group. This effect could be mediated through promotion of the persistent healthier microbiota composition which can upregulate the expression of lipid oxidative genes [53] and produce short chain fatty acids (SCFAs) that regulate host appetite and energy expenditure [54]. This goes with the detected significantly higher fecal SCFAs compared to the high fat diet group and with significant negative correlation detected between SCFAs and Lee index gain %.
In the same context, synbiotic supplementation was able to antagonize obesity and its associated prooxidative and inflammatory effects evident by the significantly higher serum GPx together with a lower serum MDA. This improvement was accompanied by amelioration in the gut barrier permeability as evidenced by the significantly decreased serum Zonulin levels. These results were further confirmed by histopathological examination of colonic tissue which revealed complete lining epithelial cells covering most of the surface with well-developed brush border and numerous goblet cells.
Our results were in agreement with Kleniewska and Pawliczak, (2017) [73], who suggested that synbiotics enhanced the biosynthesis of glutathione, which can suppress inflammation and tissue injury via reduction of oxidative stress. Similarly, Ahmadi et al., (2020), [74] demonstrated the ability of probiotics and synbiotics to reduce serum Zonulin levels.
The anti-inflammatory responses of synbiotics might be mediated by the induced increase in SCFAs production. SCFAs especially butyrate may promote anti-inflammatory responses through enhancing regulatory T cell function and Il-10 secretion together with B cell reprogramming to enhance intestinal secretion of antibody IgA [75].
Also, SCFAs may prevent translocation of lipopolysaccharides (a potent inflammatory molecules produced from membrane of gram-negative bacteria) to systemic circulation, so they decrease systemic inflammation and metabolic endotoxemia [76]. Further, SCFAs serve as an important fuel for intestinal epithelial cells so they strengthen the gut barrier function and protect against apoptosis [77].
Synbiotics supplementation was able to control dyslipidemia evidenced by the significantly lower serum LDL levels together with the significantly higher serum HDL levels. This can be either due to the reduction in the inflammatory and oxidative profile or due to their anti-obesity effects going with previous reports that oxidized LDL level was significantly reduced after synbiotic supplementation [78]. It may be also explained by the ability of probiotics to compete with cholesterol for intestinal absorption [79] or to use cholesterol in synthesis of microbiota cell membrane leading to a decrease in cholesterol absorption [80].
Also, increased SCFAs by symbiotic supplementation in our study were able to combat dyslipidemia that accompanied high fat diet, where a significant negative correlation between SCFAs and LDL was observed. SCFAs might decrease cholesterol absorption from the intestine and enhance cholesterol secretion in the bile [81].
Further, synbiotics supplementation improved liver enzymes, hepatic architecture and decreased inflammatory cell infiltration. These results were consistent with different studies who proved significant reduction of liver enzymes and steatosis with probiotic supplementation [82]. Alves et al., (2017), [83] stated that synbiotics through propionic acid production can inhibit the sterol regulatory element-binding transcription factor1-c expression and increased liver mitochondrial PPAR-α which prevent lipogenesis and enhanced hepatic lipid oxidation.
The modulatory effects of synbiotics on gut microbiota could influence the intestine-liver axis because alterations in gut microbiota were suggested to aggravate the inflammatory state sharing in the pathogenies of liver cirrhosis and non-alcoholic fatty liver (NAFLD) [84].
Moreover, synbiotics supplemented HFD group demonstrated a significantly lower fasting serum glucose, insulin levels and HOMA-IR compared to the HFD group. This goes in the same context as [82] studies that related this improvement to the reduction in glucose absorption or the enhancement in insulin secretion.
In the current study, glycemic control and controlled insulin resistance might be related to the decreased adiposity, the reduction in serum zonulin denoting decreased gut permeability, the mitigation in inflammatory state and the elevation of fecal short chain fatty acids pointing to the improvement of dysbiosis. This was accompanied by improvement of the epithelial lining the colon that become covering most of the surface with well-developed brush border. And a significant positive correlation between serum zonulin and MDA & a significant negative correlation between serum zonulin and fecal SCFAs.
SCFAs have been shown to increase glucose stimulated insulin secretion (GSIS) in humans, an effect that is dependent upon Gαq/11-mediated signaling consequent to GPR43 activation [85]. In addition, SCFAs (butyrate and propionate) activate intestinal gluconeogenesis, a brain signal derived from the intestine, that enhances rapid-phase secretion of insulin and reduces hepatic glucose production [86].
Moreover, SCFAs increase insulin sensitivity and promote glucose homeostasis through inhibiting histone deacetylase (HDACs) (the proteases which deacetylate histones and inhibit gene expression), thus protecting pancreatic β-cells against apoptosis and promoting their proliferation [87]. SCFAs upregulates expression of hepatic GLP-1 R and subsequently promotes GLP-1-dependent activation of insulin pathways [87].
Synbiotics supplementation was able to increase serum serotonin levels compared to its level in high fat diet group. Mohamed et al., (2021) [88] demonstrated that plasma tryptophan and serotonin synthesis increased following synbiotics supplementation. Higher serotonin following synbiotics supplementation may explain the significantly lower anthropometric parameters than that in high fat diet group as serotonin was described to prevent the enlargement of intra-abdominal adipocytes without having any effect on food intake through increasing the mitochondrial activity and stimulating energy metabolism in skeletal muscle [65]. Controlling obesity might improve insulin resistance and dyslipidemia. This was evident through the negative correlation between serotonin and HOMA-IR, LDL and BMI gain %.
In the current study, increased GLP-1 levels following synbiotics supplementation could confer a way of protection against dyslipidemia as Berberich and Hegele (2021) [89] declared that GLP-1RAs stimulation could reduce low-density lipoprotein (LDL), total cholesterol (C), and fasting triglyceride (TG) levels and decrease atherogenic potential of oxidized LDL. Further, SCFA-mediated HDACs inhibition might ameliorate hepatic lipid dysregulation by enhancing lipid oxidation and triglycerides clearance.
Conclusion
Thus, it could be concluded that six-week synbiotic supplementation ameliorated dysbiosis and increased fecal short chain fatty acids, improved gut barrier permeability. The increase in SCFAs with the accompanying increase in serum serotonin and GLP-1 improved the high fat diet induced obesity, dyslipidemia, oxidative stress and glycemic states.
Footnotes
Acknowledgments
The authors acknowledge Dr. Eman Gomaa EL Saeed, Lecturer of Histology at Histology Department, Faculty of Medicine, Ain Shams University, Cairo, Egypt for scientific help in the histopathological assessment and Dr. Laila Rashed, Professor of Medical Biochemistry and Molecular Biology, Faculty of Medicine, Cairo University, for scientific help in biochemical assessment.
Funding
There was no funding for this research.
Conflict of interests
The authors have no conflicts of interest to report.
Authors contributions
Dr. Bataa Mohamed EL Kafoury contributed to the conception and design of the study, involved in the supervision of the experimental work, involved in the statistical analysis and interpretation of data and provided final approval of the version to publish.
Dr. Asmaa Tarek Ebrahim carried out the experimental work, the acquisition of data and statistical analysis and interpretation of data, writing the manuscript.
Dr. Manal Said Abd-El Hamid Ali contributed to the conception and design of the study, involved in the supervision of the experimental work, involved in the statistical analysis and interpretation of data, share in writing the manuscript.
Dr. Nayra Shaker Mehanna involved in the experimental work.
Dr. Gamil El-Sayed Ibrahim Ramadan involved in the experimental work.
Dr. Wessam Ezzat Morsy contributed to the conception and design of the study, involved in the supervision of the experimental work, involved in the statistical analysis and interpretation of data and share in writing the manuscript.
Ethical approval and consent to participate
All experimental protocols were approved by Research Ethics Committee of Faculty of Medicine Ain Shams University under number FWA000017585.
All experiments methods were carried out in accordance with relevant guidelines and regulations. In this study, we followed the National Research Council of the National Academies.
All methods are reported in accordance with ARRIVE guidelines for the reporting of animal experiments.
Ethical permission was in 2019.
Consent for publication
We confirm that this manuscript has not been published elsewhere and is not under consideration by another journal. We approved the manuscript and agree with its submission to Mediterranean journal of nutrition and metabolism.
Availability of data and materials
The datasets used and/or analyzed during the current study are available from the corresponding author on reasonable request.