
Abstract
Introduction
According to Easton et al. (2009) stroke characterized as an “any central cerebral ischemic occasion with manifestations enduring less than 24 hours”. The absolute number of strokes, measured in disability-adjusted life years (DALYs), has continued to increase from approximately 38 million DALYs worldwide in 1990 to 61 million DALYs in 2020; this increase is the result of the aging population (Mackay & Mensah, 2004). Worldwide, 15million individuals endure a stroke annually. Of these, 3 million women and 2.5 million men die and another 5 million are permanently disabled, which places a burden on their families and the affected individuals every year (Mackay & Mensah, 2004).
Stroke is additionally driving reason for functional impairment. Twenty percent of survivors require inpatient rehabilitation programs (IRPs) after 3 months (Go et al., 2014). A systemic review (SR) also indicated the need for more health care services directed at patients with stroke, including rehabilitation services (Tummers, Schrijvers, & Visser-Meily, 2012). Different rehabilitation programs may be used to maximize an individual’s functions after stroke (Dobkin, Plummer-D’Amato, Elashoff, & Lee, 2010; Nadeau et al., 2013). Considerable controversy and debate encompass the adequacy of related programs after stroke (Pollock et al., 2014). According to the World Health Organization (WHO), rehabilitation interventions are used to maximize function and minimize the limitations in activity using neurofacilitation, functional and compensatory training strategies (Stucki, Cieza, & Melvin, 2007).
The stroke patient if medically stable, rehabilitation can begin in the acute care facility within approximately 72 hours. In a stroke unit, these interventions can prevent or minimize the effects of deconditioning and the risk of secondary impairment (Duncan et al., 2005). According to the final report of the National Study of Subarachnoid Haemorrhage on an audit completed in 34 neurosurgical units in the United Kingdom (UK) and Ireland between 2001-2002, more than 50% of older adults with stroke require additional IRPs after a successful intervention in acute care (Lindsay et al., 2006). Therefore, acute care consideration is all around acknowledged as a specific medical control for the treatment of more young patients with stroke compared to older adult patients who have reduced functional outcomes, which are associated with aging, cognitive problems, the length of stay (LoS), and multiple comorbidities (Chung, Niewczyk, DiVita, Markello, &Granger, 2012).
Despite, the effects of IPRs on maximizing functional independence and reducing the LoS in older adults with stroke are controversial or unclear. To our knowledge, the literature in this area has not been systematically collected and analyzed before. As a result, we performed a SR and meta-analysis (MA) to examine the effects of IRPs on the functional status and LoS in older adults with stroke based on the evidence from randomized controlled trials (RCTs).
Methods
This SR was conducted and reported as per the Preferred Reporting Items for Systematic Reviews and Meta-Analyses (PRISMA) guidelines (Knobloch, Yoon, & Vogt, 2011) and the Consolidated Standards of Reporting Trials (CONSORT) (Schulz, Altman, & Moher, 2011) statements.
A strategic and systematic search was conducted using the Medline, CINAHL plus (EBSCO), PubMed, Physiotherapy Evidence Database (PEDro), and Cochrane Central Register of Controlled Trials (CENTRAL) databases (Guyatt, Rennie, Evidence-Based Medicine Working Group, & American Medical Association, 2002). The keywords used to perform the search were the following: stroke or cerebrovascular accident (CVA); post (–) acute, functional, function, or functional status; elderly, old, older, very old, or aged; inpatient, programs, facilities, multidisciplinary therapy, rehabilitation, physiotherapy, or occupational therapy; hospitalized; discharge; functional independence measure (FIM); and outcomes. The bibliographic search was restricted to RCTs published in English with available full-text and no restriction on the time. An illustration of the search technique utilized for one of the databases appears in Appendix 1.
Finally, the bibliographies of all eligible articles were evaluated by three independent reviewers (S.B., V.V., and E.F.).
Three evaluators (S.B., V.V., and E.F.) independently reviewed the articles identified in the search. The full contents of the conceivably relevant articles were obtained and assessed using the following inclusion criteria: subjects (Hatano, 1976), setting (Safer & Koseoglu, 2015), outcome (Yavuzer, Kucukdeveci, Arasil, & Elhan, 2001), methodology or design (Horwitz, 1995), type of publication (Treadwell, Singh, Talati, McPheeters, & Reston, 2011), and methodological quality (Chumney et al., 2010). Differences of opinion regarding the articles were resolved by discussion and consensus between two of the reviewers (S.B. and V.V.). The detailed inclusion and exclusion criteria were shown in Table 1. Excluded articles (n = 10) and major reason to exclusion appear in Appendix 2.
Inclusion and exclusion criteria (Treadwell et al., 2011)
Inclusion and exclusion criteria (Treadwell et al., 2011)
The three reviewing authors independently extracted the data (S.B., V.V., and E.M.). Information on the following characteristics was extracted: study design (e.g., RCTs), quality (e.g., PEDro scale), participants (e.g., age and diseases diagnosed), setting (e.g., inpatient rehabilitation), and outcomes (FIM and LoS). The authors resolved disagreements by consensus and contacted the study authors for clarification when necessary.
The methodological nature of each included article was then autonomously assessed by two analysts utilizing the PEDro scale (Table 2). The PEDro scale was picked because it is a significant evaluation of the methodological nature of clinical trials and has been applied to treatments and contemplations for restorative interventions and outcomes. The PEDro scale ranges from 0 to 10 and is used to survey study quality. For this review, the PEDro score of 5 was picked as an optional cutoff in light of the fact that the experts felt this score would demonstrate a strong level of confirmation (Foley, Teasell, Bhogal, & Speechley, 2003) and high quality, as reported by Moseley et al. (2002) The reliability and validity of the PEDro scale have been reported elsewhere (Maher, Sherrington, Herbert, Moseley, & Elkins, 2003).
Quality appraisal of the included studies (listed alphabetically by author) of older adults with stroke who partook in inpatient rehabilitation programs
*PEDro = physiotherapy evidence database assessment; 1 = eligibility, 2 = randomized allocation, 3 = concealed allocation, 4 = similar prognosis, 5 = blinded subjects, 6 = blinded therapist, 7 = blinded raters, 8 = key outcome, 9 = intention to treat, 10 = comparison between groups, 11 = precision and variability. Note: the eligibility item does not contribute to the total score. †Maximum score of 10. ‡The included studies with a PEDro score ≥5 were considered high quality. Y = yes; N = no.
It is important to include a risk of bias when assessing the internal validity of each article in this SR (Higgins, Altman, & Sterne, 2011). Two of the review authors (S.B. and V.V.) independently documented the risk of bias of the included articles (Table 3). The risk of bias was assessed using the Cochrane collaboration apparatus as part of the domain-based assessment, with a low, high, or unclear risk of bias judgment for each item (Higgins et al., 2011). The evaluated areas were random sequence generation, allocation concealment, blinding of subjects, blinding of the therapist, blinding of raters, incomplete outcome data, and specific reporting. The results of this risk of bias tool did not influence the inclusion in the final output. The authors determined the differences by examination and contacted the articles’ authors for clarification when necessary.
Risk of bias of all included studies (listed alphabetically by author)
Abbreviations: – = high risk of bias; + = low risk of bias.
Two reviewers (S.B. and V.V.) independently screened the selected articles. Crude understanding and the Cohen kappa measurement were utilized to quantify the agreement between the two analysts.
The primary outcome measure of interest was the functional status, as measured by FIM (FIM-motor, FIM-cognitive, and FIM-total at discharge). The secondary outcome measure of interest was LoS, measured in days. We extracted the means and standard deviations (SDs) of the admission and discharge scores for the primary and secondary outcomes from the included articles. We displayed all of the examined result measures as constant data. Standard mean differences (SMDs) were calculated for all of the outcomes. The Hedges g measurement was chosen because it remedies slight overestimations that may emerge from a small number of examples and the estimation variability of the selected articles was calculated using a balanced effect size (ES). The fixed effect was selected for all of the outcomes because the heterogeneity was low (I2 <25%) (Higgins, Thompson, Deeks, & Altman, 2003). Then, the 95% confidence intervals (CIs) were calculated for the ESs, based on a variance outcome, to identify the overlapping CIs between studies, which confirmed that the heterogeneity was low. The centrality of the overall impact was tested using the z statistic (see Appendix 3 for the formulas used to calculate Hedges g using a Microsoft Excel spreadsheet) (Borenstein, 2009). The magnitude of the ES was categorized using the Cohen categories, with g < 0.5 as a small ES, g≥0.5 and ≤0.8 as a medium ES, and g > 0.8 as a large ES.
The heterogeneity among comparable trials was analyzed utilizing both the standard Cochran Q and Higgins I2 statistics (Higgins & Green, 2008; Higgins et al., 2003). A noteworthy Q test just shows the region of heterogeneity among the data included, while the I2 file measures its size (Higgins & Thompson, 2002). A genuine categorization of the qualities for I2 would not be suitable for all circumstances, although it would likely relegate descriptive words of low, moderate, and high to I2 values of 25, 50, and 75%, respectively (Higgins et al., 2003). A low p value (≤0.05) for the Q statistic was considered proof of heterogeneity of the treatment impacts. A fixed-effects MA was directed to decide the general ES since it is more preservationist, especially for little specimens (Higgins & Thompson, 2002). (see Appendix 4 for the formulas used to calculate the fixed models using a Microsoft Excel spreadsheet) (Borenstein, 2009; Hardy & Thompson, 1998). All of the statistics were computed using Microsoft Excel 2007, version 12.0 [Microsoft, Redmond, WA, USA] (Neyeloff, Fuchs, & Moreira, 2012).
Figure 1 shows the procedure used to choose the 10 articles incorporated into the SR (Fong et al., 2007; Liu & Chan, 2014; Masiero, Armani, Ferlini, Rosati, & Rossi, 2014; Peiris, Shields, Brusco, Watts, & Taylor, 2013; Rabadi et al., 2008; Rabadi, Coar, Lukin, Lesser, & Blass, 2008; Rawl, Easton, Kwiatkowski, Zemen, & Burczyk, 1998; Strasser et al., 2008; Sze, Wong, Yi, & Woo, 2002; Wikander, Ekelund, & Milsom, 1998) and the 8 articles that were deemed suitable for the MA (Fong et al., 2007; Liu & Chan, 2014; Peiris et al., 2013; M. Rabadi et al., 2008; M. H. Rabadi et al., 2008; Rawl et al., 1998; Strasser et al., 2008; Wikander et al., 1998). The two articles (Masiero et al., 2014; Sze et al., 2002) that were excluded from the MA reported median (interquartile range) values for the outcomes. The agreement between reviewers on the specified inclusion and exclusion criteria (see Table 1) for all stages of article selection was nearly perfect (100% crude agreement, kappa = 1) (Viera & Garrett, 2005).
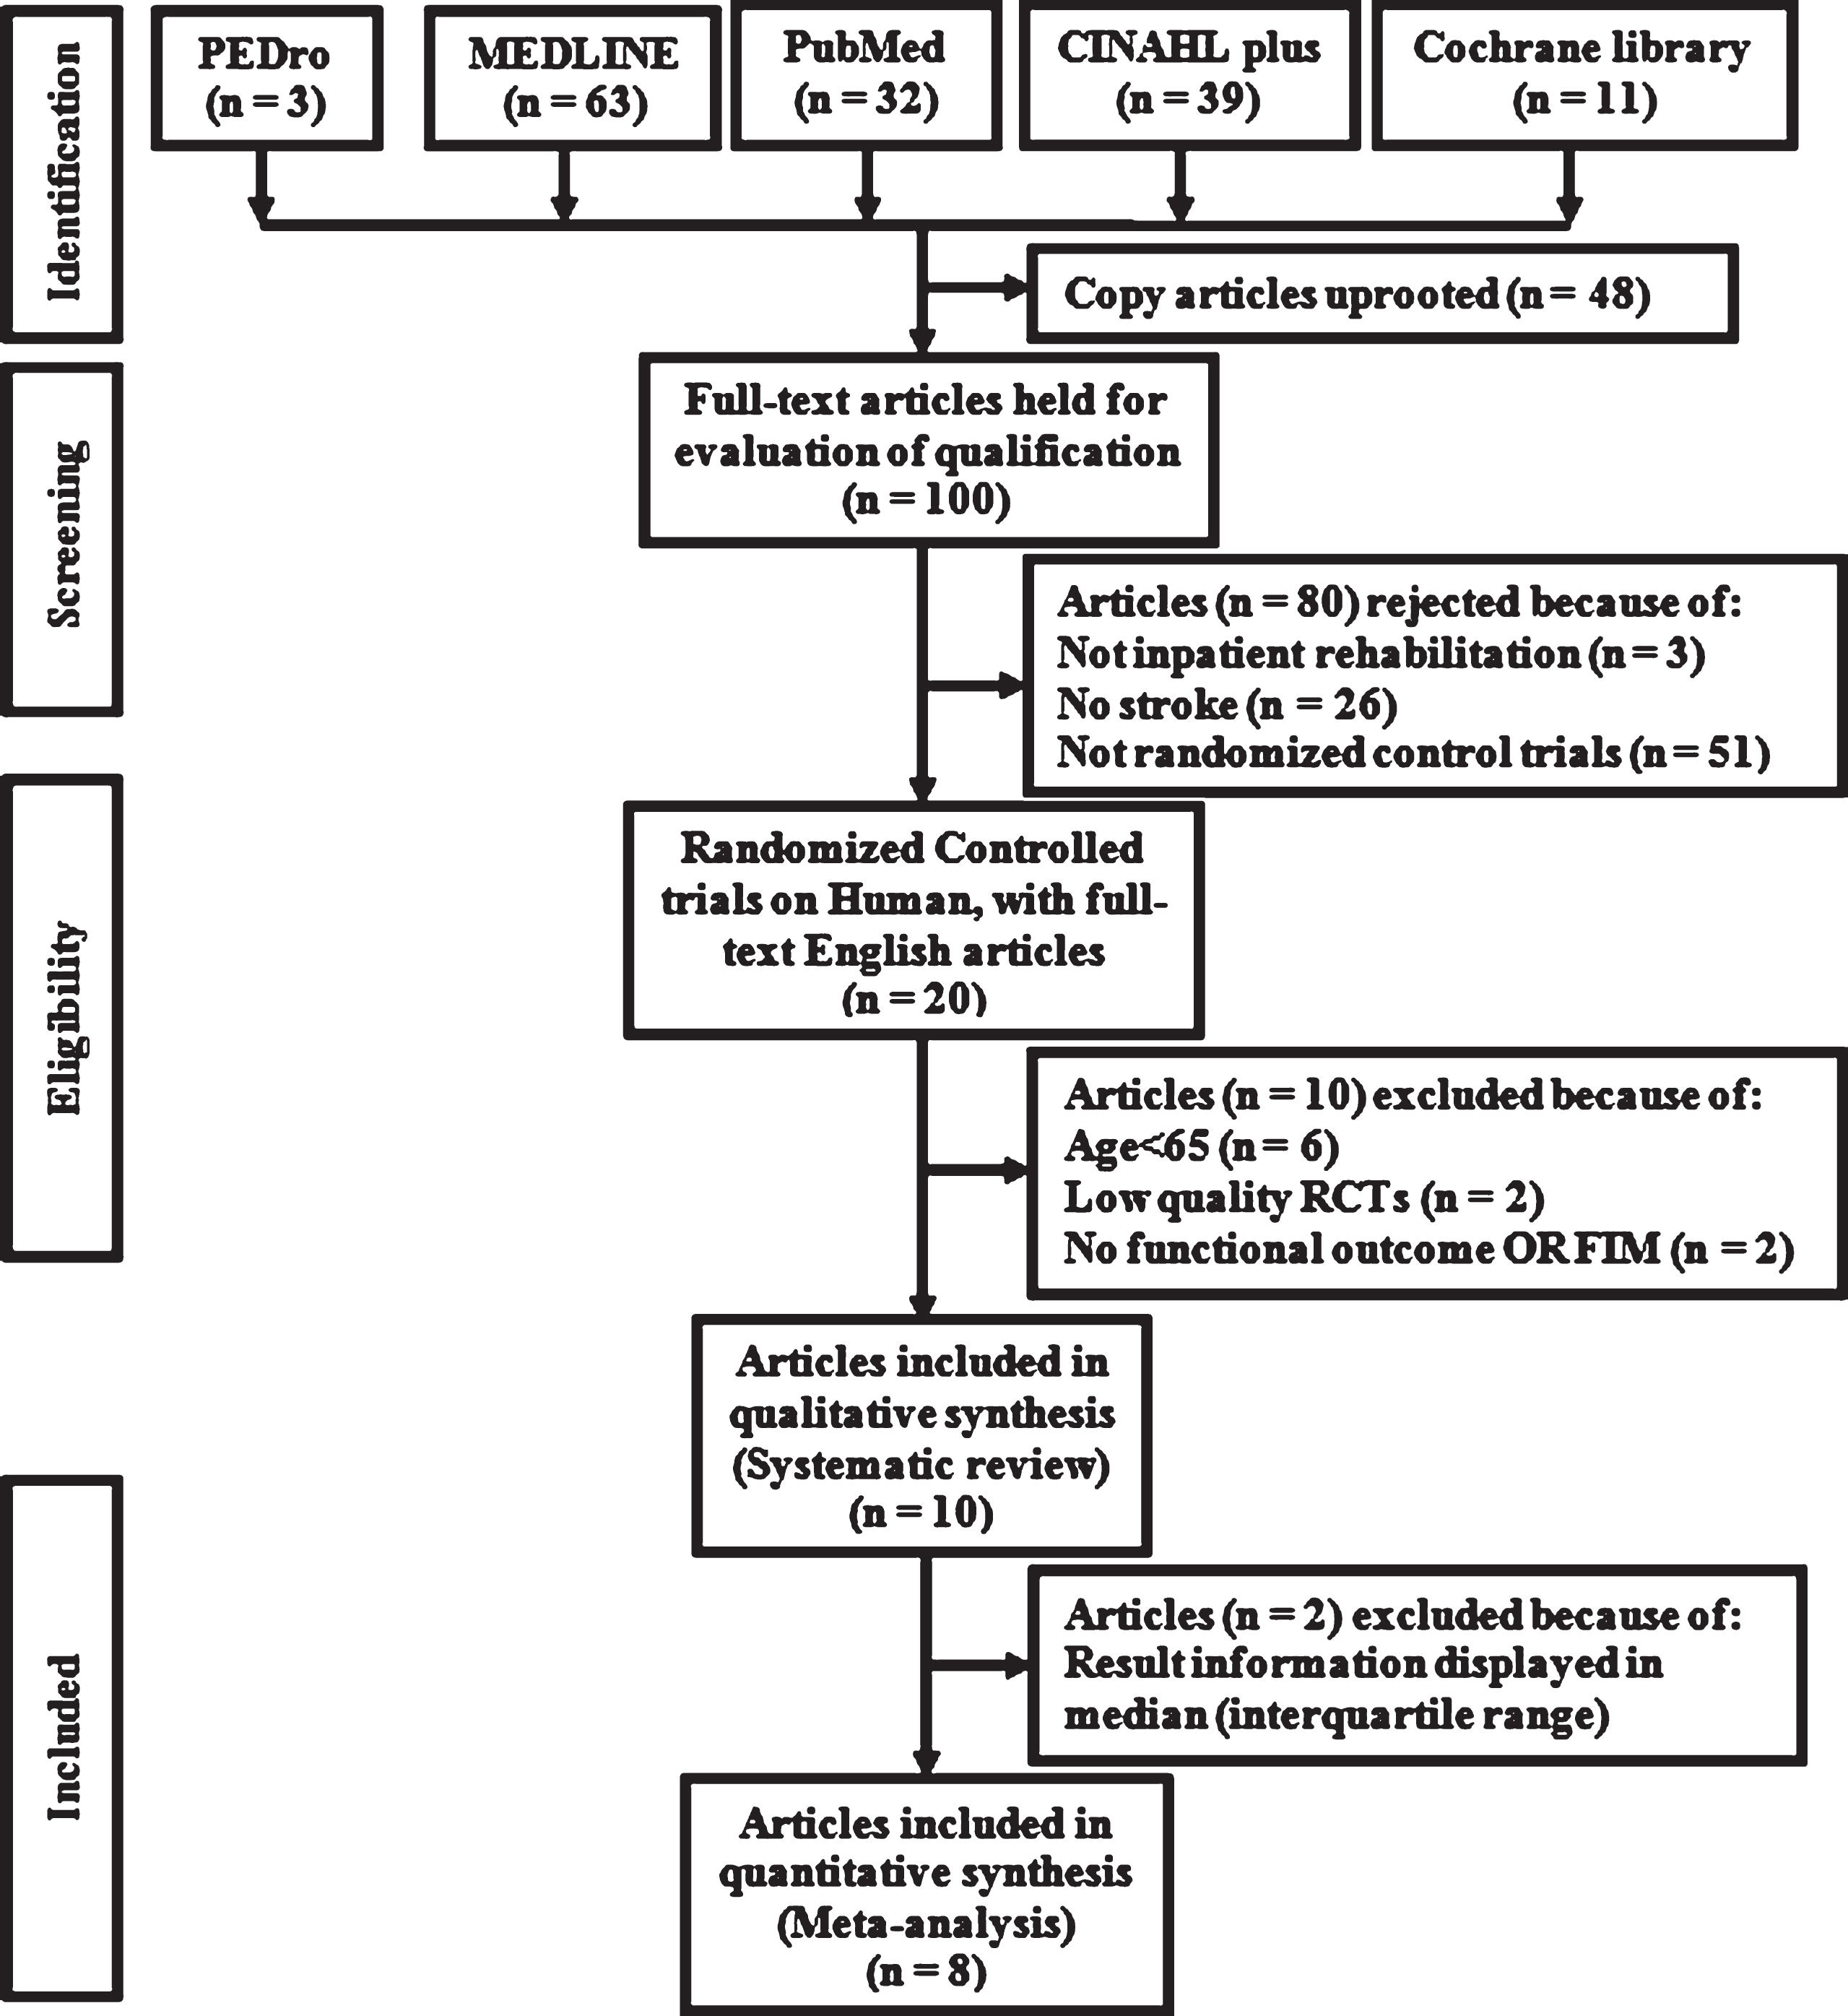
Flowchart of papers selected for the study.
The after effects of the methodological appraisal are compressed into Table 2. The agreement of the methodological quality between the two independent reviewers was perfect (100% crude agreement, kappa = 1) (Viera & Garrett, 2005). The PEDro scores of the included articles ranged from 5 to 8, with a median score of 5 classified as a high quality article. The most common limitations were the following: lack of blinding of the patient and therapist (Fong et al., 2007; Liu & Chan, 2014; Masiero et al., 2014; Peiris et al., 2013; M. Rabadi et al., 2008; M. H. Rabadi et al., 2008; Rawl et al., 1998; Strasser et al., 2008; Sze et al., 2002; Wikander et al., 1998), lack of blinding of the raters (Rawl et al., 1998; Strasser et al., 2008; Wikander et al., 1998), intention to treat (Fong et al., 2007; Liu & Chan, 2014; M. Rabadi et al., 2008; M. H. Rabadi et al., 2008; Rawl et al., 1998; Strasser et al., 2008; Wikander et al., 1998), concealed allocation (Fong et al., 2007; Masiero et al., 2014; Rawl et al., 1998; Strasser et al., 2008; Wikander et al., 1998), and a similar prognosis (M. Rabadi et al., 2008; M. H. Rabadi et al., 2008). The items that best adhered to the PEDro Scale were random allocation, key outcome, comparison between groups, precision, and variability, which were evident in almost all of the trials. The randomization methods, eligibility, statistical analysis criteria were clearly defined in all of the included articles (Fong et al., 2007; Liu & Chan, 2014; Masiero et al., 2014; Peiris et al., 2013; M. Rabadi et al., 2008; M. H. Rabadi et al., 2008; Rawl et al., 1998; Strasser et al., 2008; Sze et al., 2002; Wikander et al., 1998).
The evaluators agreed on the risk of bias of each included article. The risk of bias assessment of the included articles is illustrated in Table 3. The overall risk of bias assessment indicated that the risk of bias was high in all of the included articles. The most common risks of bias in all of the included articles were blinding (patients, therapists, or raters) (Fong et al., 2007; Liu & Chan, 2014; Masiero et al., 2014; Peiris et al., 2013; M. Rabadi et al., 2008; M. H. Rabadi et al., 2008; Rawl et al., 1998; Strasser et al., 2008; Sze et al., 2002; Wikander et al., 1998) and concealed allocation (Fong et al., 2007; Masiero et al., 2014; Rawl et al., 1998; Strasser et al., 2008; Wikander et al., 1998). Not surprisingly, the clinicians and subjects were not blinded in any of the studies. This finding contrasts with the conclusion of Boutron et al (Boutron, Tubach, Giraudeau, & Ravaud, 2004) who demonstrated that patient blinding is difficult to accomplish in nonpharmacological studies. However, whereas all of the articles were RCTs, only 5 reported concealment.
Table 4 summarizes the characteristics of the articles included in this review. All the 10 included articles with 2,309 participants were allocated to the intervention (n = 1,124) or control (n = 1,175) groups in either rehabilitation hospital or unit setting. The mean age of older adults with stroke ranged from 66.0 ± 11 to 74.3 ± 11.8 years, and the LoS ranged from 9 to 76 days. Despite the fact that men and women were incorporated into the studies, men represented the unmistakable sex. In all of the articles included in this review, the primary diagnosis of the participants was stroke, and they were admitted to an IRP for functional recovery, as measured with the FIM scale, and had an adequate follow-up (≥74%). The overall loss to follow-up from all of the included articles was 0.45% (n = 10). Most of the included studies were conducted in the US.
Characteristics of the included randomized controlled trials (listed alphabetically by author) of an inpatient rehabilitation programs
Abbreviations: FIM = functional independent measure; NA = not available; SD = standard deviation; yr = years; hr = hours; min = minutes.
The outcomes are summarized in Table 5. Of the 10 articles, 5 articles (Liu & Chan, 2014; Peiris et al., 2013; M. H. Rabadi et al., 2008; Strasser et al., 2008; Wikander et al., 1998) reported a significant functional improvement in the intervention group that was admitted to an IPR. Of these five articles, the results of two articles (Peiris et al., 2013; M. H. Rabadi et al., 2008) revealed that the participants in the intervention group had a significantly higher FIM-total score upon discharge. The discharge results from five articles (Liu & Chan, 2014; Peiris et al., 2013; M. H. Rabadi et al., 2008; Strasser et al., 2008; Wikander et al., 1998) showed that the participants in the intervention group exhibited a significantly improved FIM-motor subscale score. Three articles (Liu & Chan, 2014; Peiris et al., 2013; Wikander et al., 1998) showed that the participants in the intervention group exhibited a significantly improved FIM-cognitive subscale score at discharge. All of the included articles reported on the LoS, which varied between 9 and 76 days. Only one article reported that the intervention group may have had a shorter LoS upon discharge compared to the control group (Peiris et al., 2013).
Summary of outcomes
Abbreviations: FIM = functional independent measure; NA = not available; SD = standard deviation; yr = years; NIH, National Institutes of Health.
Eight RCTs with 1,910 patients were included in MA. The data from all of the trials were combined to analyze four distinctive outcome measures: FIM-motor, FIM-cognitive, and FIM-total at discharge as well as LoS. The settled ESs obtained from the fixed-effects model is introduced in the forest plots. The effects are summarized in the combined forest plot for all of the included articles in Fig. 2. A single plot for each outcome and the full details are available in Appendix 5.
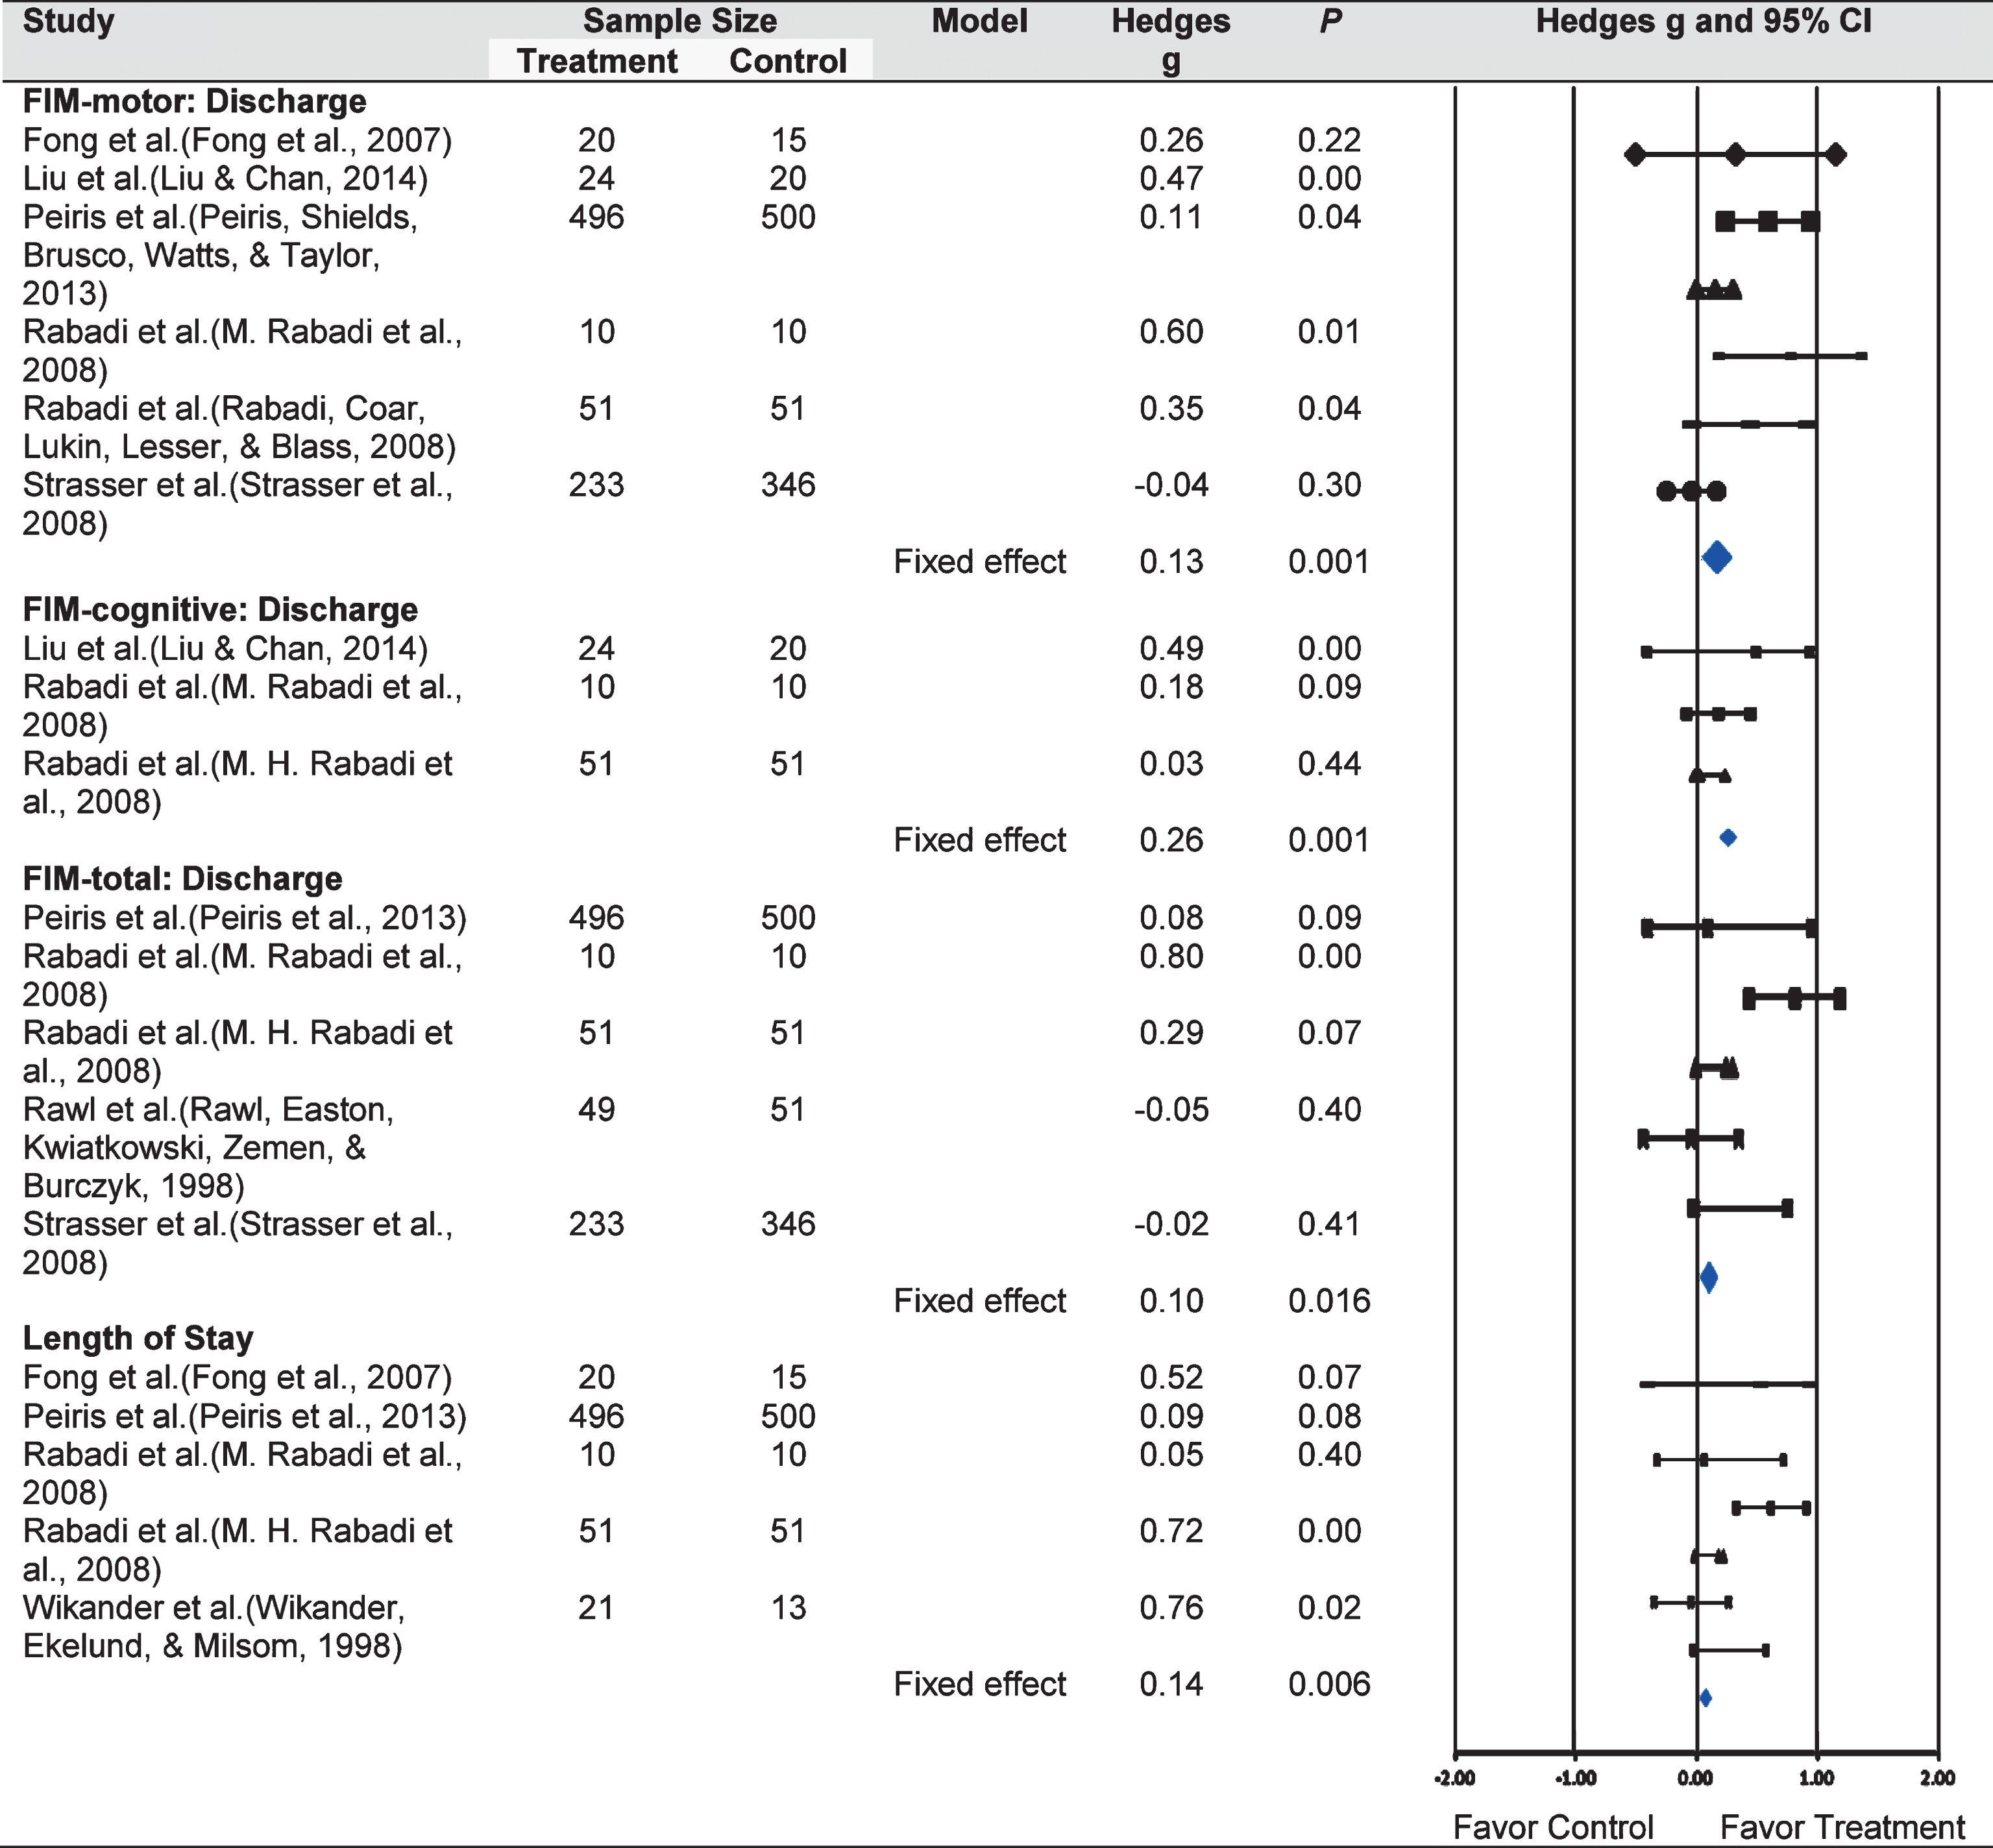
Consolidated forest plot of all outcomes. Abbreviations: FIM, functional independent measure; ES, effect size; CI, confidence interval.
The small ES for FIM-motor (6 RCTs, 1,776 participants; Hedges g ES = 0.13; 95% CI = 0.05, 0.22; p = 0.001), FIM-cognitive (3 RCTs, 166 participants; Hedges g ES = 0.26; 95% CI = 0.09, 0.22; p = 0.002), and FIM-total (5 RCTs, 1,797 participants; Hedges g ES = 0.10; 95% CI = 0.01, 0.22; p = 0.016) at discharge were significant under the fixed-effects theory. The small ES for LoS was also significant (5 RCTs, 1,187 participants; Hedges g ES = 0.14; 95% CI = 0.03, 0.22; p = 0.006). Therefore, favored the IRPs compared to the control and were effective in maximizing the functions and reducing the LoS. The sample sizes for the intervention and control groups were 834 and 947 participants, respectively. No evidence of heterogeneity was observed, yet the discoveries were critical for FIM-motor (Q value = 14.8; p = 0.01; I2 = 0%), FIM-cognitive (Q value = 4.08; p = 0.13; I2 = 0%), and FIM-total (Q value = 17.09; p = 0.00; I2 = 0%) as well as LoS (Q value = 9.67; p = 0.05; I2 = 0%).
Generally, there was no distribution predisposition, and the studies did not perform quantitative tests (Classic Fail-safe N tests, Begg and Mazumdar rank correlation test, Egger test of the intercept, and Trim and Fill test) (Sterne, Gavaghan, & Egger, 2000). Because the tests for funnel plot asymmetry are not prescribed when there are fewer than 10 concentrations, a sample funnel plot is displayed in Appendix 6 (Sterne et al., 2011).
This review aimed to examine the effects of IRPs on the functional status and LoS of older stroke patients. The IRP setting of each included article was a hospital or unit. Our evaluation showed that all of the articles performed adequate random sequence generation. The present review showed that IRPs might be beneficial for maximizing the functions in older adults with stroke. Regarding the overall outcomes, the IRPs showed a short-term effect at discharge.
We used the PEDro scale, a scoring system to evaluate the methodology of the included articles. The advantages of this scoring framework are its convenience and capacity to easily compare the scores from different studies. However, there is no best quality level to confirm the authenticity of these scores, making it hard to figure out if they are legitimately measuring the methodological quality. Also, these scores don’t consider the relative importance of the differing things fused into the scales, and they frequently join things that are not related to the study quality or inclination assessment. The Cochrane review now considers risk of bias apparatuses with regard to the methodological quality evaluation scales (Higgins & Green, 2008).
The judgment of the risk of predisposition was extremely difficult to determine because of the poor or brief reporting of the data. More than half of the area construct assessment using the Cochrane collaboration apparatus was judged to be at low risk of bias for determination, location, and steady loss bias; however, for most of the studies, the risk of bias was judged to be high in blinding participants, therapists, raters and the concealed allocation domain of the Cochrane collaboration tool. In this review, none of the patients from the included articles were blinded to the study and aims, which could confound the results of the studies. In the event that the participants were blinded, the nature of the rehabilitation interventions and the moral prerequisite to obtain informed consent often make it difficult to maintain blinding. For the most part, it is difficult to blind the treating physicians or specialists because they must be acquainted with the intervention that they are controlling. Three of the included articles (Rawl et al., 1998; Strasser et al., 2008; Wikander et al., 1998) did not use a blinded assessor, which can introduce considerable bias into the results of the study. In particular, specialists frequently have solid convictions with regard to their support of a specific methodology. The overall conclusion assessment indicated that the risk of bias was high in all of the included articles. The inclusion of these articles did not affect the results, and the methodological features of the RCTs of rehabilitation interventions were improved.
The results from this review provided strong evidence that the IRPs may maximize functional independence and shorten the LoS in older adults with stroke. A previous SR of the literature on stroke patients aged 18 years or older indicated that the patient’s age, cognition, and functional level were associated with prognosis and rehabilitation admission. This SR included studies in which the methodological quality was poor (Hakkennes, Brock, & Hill, 2011). This is reflected in the International Classification of Function, Disability, and Health from the WHO, which indicates that social and environmental factors also affect a person’s functional status (Stucki et al., 2007). A thorough, basic survey of the therapeutic writing from 1950 to 1998 uncovers considers that were connected with practical result after stroke. The early start of rehabilitation administrations and rehabilitation in an interdisciplinary versus a multidisciplinary setting after stroke seems to have a solid association with enhanced practical result at discharge (Cifu & Stewart, 1999). Thus, age, functional level, and rehabilitation approaches were the main factors that influenced the patient’s maximum functional independence after stroke.
Despite the differences among IRPs across all of the articles included in the MA, the results demonstrate significant effects on the primary and secondary outcomes. To our knowledge, this is the first MA to provide strong evidence of the effects of IRPs on the functional recovery and reduced LoS in older adults with stroke, and the results support its effectiveness. Other MAs have either been exceptionally broad, acquired a solid positive conclusion (Collaboration, 2013; Ferrarello et al., 2011; Luker, Lynch, Bernhardsson, Bennett, & Bernhardt, 2015; Pereira et al., 2012) or have had diverse participants, settings, and results measures; however, none confirmed the effects of IRPs for older adults with stroke. Recently, Pollock et al. (2014) reported that a physical rehabilitation program significantly maximized the functions in adults with stroke aged 18 years or older. The authors measured the functional outcomes and presented them as SMDs and 95% CIs for 10,401 participants using different scales, including the FIM for Activity of Daily Living (ADL). Bachmann et al. (2010) reported that inpatient rehabilitation that is specifically designed for geriatric patients with hip fracture aged 55 years or older showed beneficial effects on the functional improvement. The authors measured the functional outcomes using the Berthel Index for ADL and presented the results as odds ratios and 95% CIs for 4,780 participants. In contrast with the present MA, there was strong evidence that IRPs can maximize functions in older stroke patients. Katrak et al. (2009) presented a review of a prospectively maintained database of all stroke patients admitted to a rehabilitation unit in an Australian university hospital during a 9.5-year period. This review showed that patients achieved significantly greater gains in function after inpatient rehabilitation, which was measured with the FIM scale. These differences in results may be a result of the inclusion criteria that were adopted in this review. In the present review, the mean change score (Appendix 3) was measured for each primary outcome using the FIM and compared using Hedges g and 95% CIs; however, the differences in the data can affect the results (Garg, Hackam, & Tonelli, 2008).
Results like our discoveries have been distributed for older adults with stroke (Liu & Chan, 2014). Schnitzler et al. (2014) conducted a study in France of 28,201 patients aged >65 years who were admitted to a multidisciplinary inpatient rehabilitation (neurological or geriatric rehabilitation) service in 2009. This study affirms, on a national level, the practical advantage of specific rehabilitation in a neurological rehabilitation center. Lee et al. (2012) demonstrated that a prolonged IRP (6 months) achieved functional improvements in stroke patients older than 60. Foley et al. (2012) reported a study of 123 stroke patients admitted to an IRP over a 6-month period and revealed that there was a large increase in FIM focus in the IRP. Granger et al. (2009) provided benchmark data for a vast national specimen of patients who received inpatient rehabilitation following stroke from 893 medical rehabilitation facilities located in the US. These results were obtained from the Uniform Data System for Medical Rehabilitation (UDSMR) from 2000– 2007. The report on stroke rehabilitation showed an improvement in the patients’ functional independence during their rehabilitation stay. Thus, older adults with stroke recover their functionality during inpatient rehabilitation stay.
The other point of this review was to look at the effect of IRPs on LoS. Compared to the control, the IRPs were able to significantly reduce the LoS. Tan et al. (2009) determined that a patient’s socioeconomic status and family structure are more likely to influence LoS. Somerford et al. (2004) published that the LoS is more likely to be longer for female patients, whereas patients who reside in rural areas had a shorter LoS. Brosseau et al. (1996) found that IRPs were indirect predictors of the LoS. Overall, the available literature revealed that IRPs were strongly influenced by the socioeconomic and environmental factors of stroke patients (Ottenbacher & Jannell, 1993; Reistetter et al., 2014).
As discussed above, the identification of all relevant trials was confounded by a number of factors and the search strategy. Therefore, this review may have publication bias towards specific types of studies and distributions. For example, we may be missing the following types of articles: those distributed without the full-text, those distributed in a language other than English, or those distributed in journals that are excluded from the electronic databases that we searched.
The clinical implications of the discoveries in our review warrant further consideration. Our findings suggest that IRPs are effective at maximizing functional independence in older adults with stroke. Thus, these findings indicate a need for IRP development, particularly in older adults with stroke. Because few studies indicate that age is the strongest predictor of functional outcome in an inpatient rehabilitation setting (Abdul-sattar & Godab, 2013; Bagg, Pombo, & Hopman, 2002), additional analyses should be performed to determine whether IPRs truly improve the functional outcome and reduce the LoS in older adults with stroke. If confirmed, this may be a new intervention that improves the outcomes in older adults with stroke, and it should be a high priority for implementation in practice.
A few limitations of this review should to be noted. The total number of included articles in this review was small and limited to older adult patients with stroke. This may decrease its generalizability. Two studies were excluded from the quantitative analysis because the outcomes of these studies were reported as medians and interquartile ranges. If we had included these studies, they may have influenced the results of the MA because the data were not normally distributed. The lack of publication bias underpins the production inclination evaluation. We did not examine the patients’ demographic criteria (e.g., age, sex, race, and socioeconomic status), which can influence the functional outcomes in IRPs. There were differences in the interventions and settings between studies. However, we attempted to address these disparities. The articles that were included in this review were limited to full-text articles written in English; it is possible that some studies may have been missed. Another limitation is that we did not examine the types of inpatient rehabilitations, which can affect functional outcome, in this study. For example, in their critical review of rehabilitation interventions comparing different types of inpatient rehabilitations of stroke care, Cifu and Stewart (1999) demonstrated differences in the functional outcomes and LoS that depended on the setting in which the inpatient rehabilitation is provided. However, we did not include studies that aimed to determine the effect of neglect on functional outcomes in stroke patients. This may have contributed to the variation in the results.
In summary, this SR provided evidence that IRPs have beneficial effects on improving functionality and reducing the LoS for older adults with stroke. Regarding the overall outcomes, IRPs showed a short-term effect at discharge. However, a consensus on the IRP definition and its components is lacking. This methodology provides a significant amount of information with which to guide future practice.
Conflict of interest
The authors declare that there is no conflict of interest.
Footnotes
Appendix 1
An example of the search strategy used for the PubMed database
Appendix 2
Excluded studies (listed alphabetically by author)
Appendix 3
Example of the formulas used to calculate Hedges g using a Microsoft Excel spreadsheet
Appendix 4
Example of computing the combined effect and related statistics for a fixed effect model using a Microsoft Excel spreadsheet
Abbreviations: ES, effect size; SE, standard error; CI, confidence interval; df, degree of freedom; w, weight; k, no. of studies.
Abbreviations: FIM, functional independent measure; CI, confidence interval; SUMSQ, sum square root; MAX, maximum; SQRT, square root; Df, degree of freedom; ES, effect size, WT, weight.
Column (Cell)
Label
Excel Formula
Formula
(Section 1) Statistical data
A
Study
Entered
B
Effect size
Entered
(0.1)
C
Standard error
Entered
D
Lower 95% CI
=B – 1.96*C
E
Upper 95% CI
=B + 1.96*C
F
Z-value
=B/C
G
p-Value
=(1-(NORMDIST(ABS(F),0,1,TRUE)))*2
(Section 2) Each study Fixed Effect of WT and WT*ES
H
Variance
=SUMSQ(C)
SE2
I
Variance within
=$H
J
WT
=1/I3
Wi = 1/Vi or 1/SE2
K
ES*WT
=B*J
J9
WT
=SUM(J3:J8)
K9
ES*WT
=SUM(K:K8)
(Section 3) Calculating the joint impact and related statistics for the fixed effect model
I13
Effect size
=K9*J9
T. =Σki = 1Wi Ti /Σki = 1Wi
I14
Variance
=1/J9
V = 1/Σki = 1Wi
I15
Standard error
=SQRT(K14)
SE (T . ) = .
I16
Lower 95% CI
=K13 - 1.96*K15
T . — 1.96 * SE (T . )
I17
Upper 95% CI
=K1 + 1.96*K15
T . +1.96 * SE (T . )
I18
Z-value
=K13/K15
Z = T . /SE (T . )
I19
p-value (1-tailed)
=(1-(NORMDIST((K18),0,1,TRUE)))
P=1- φ (Z)
I20
p-value (2-tailed)
=(1-(NORMDIST(ABS(K18),0,1,TRUE)))*2
P = 2[1- φ (I Z I)]
(Section 4) Computing the values required for the tau-squared test
L
ES2*WT
=SUMSQ(B)*J
M
WT2
=SUMSQ(J)
L9
SUM
=SUM(L3:L9)
M9
SUM
=SUM(M3:M9)
(Section 5) Computing heterogeneity Q and I2 for the fixed model
L13
Q
=L9-SUMSQ(K9)/J9
Q =Σki = 1Wi Ti – 2/Σki = 1Wi
L14
Df
=B10-1
Df = (Number of studies) – 1
L15
Numerator
=MAX(M13-M14,0)
L16
C
=J9-M9/J9
C =ΣWi – ΣWi2/ΣWi
L17
Tau-sq
=M15/M16
T2 = Q – df/C
L18
I2
=(M1-M14)/M1*100
I2 = (Q-df)/Q*100
Appendix 5
All related statistics and forest plots for the outcomes.
Appendix 6
Example of a funnel plot (FIM-total at discharge outcome)
Acknowledgments
The authors extend their appreciation to the Research Centre, College of Applied Medical Sciences and the Deanship of Scientific Research at King Saud University.