






Abstract
BACKGROUND:
Gait deficits and functional disability are persistent problems for many stroke survivors, even after standard neurorehabilitation. There is little quantified information regarding the trajectories of response to a long-dose, 12-month intervention.
OBJECTIVE:
We quantified treatment response to an intensive neurorehabilitation mobility and fitness program.
METHODS:
The 12-month neurorehabilitation program targeted impairments in balance, limb coordination, gait coordination, and functional mobility, for five chronic stroke survivors. We obtained measures of those variables every two months.
RESULTS:
We found statistically and clinically significant group improvement in measures of impairment and function. There was high variation across individuals in terms of the timing and the gains exhibited.
CONCLUSIONS:
Long-duration neurorehabilitation (12 months) for mobility/fitness produced clinically and/or statistically significant gains in impairment and function. There was unique pattern of change for each individual. Gains exhibited late in the treatment support a 12-month intervention. Some measures for some subjects did not reach a plateau at 12 months, justifying further investigation of a longer program (>12 months) of rehabilitation and/or maintenance care for stroke survivors.
Introduction
Stroke is a leading cause of death and disability worldwide (WHO 2020). The most rapid rate of recovery occurs within the first 30 days post stroke (Duncan, Goldstein, Matchar, Divine, & Feussner, 1992; Cramer 2020). As a result of this observation, rehabilitation (in the United States) has been typically front-loaded during the acute and subacute stages and completed within 4 months (Winstein et al., 2016). Despite this current situation, more than one-third of stroke survivors report continued or worsening disability in the chronic stage. Longitudinal studies have reported that disability remains unchanged or worsens in the years following the termination of current rehabilitation (Hendricks, van Limbeek, Geurts, & Zwarts, 2002; Kuptniratsaikul, Kovindha, Suethanapornkul, Massakulpan, Permsirivanich, Kuptniratsaikul, 2017). In contrast to this situation of ongoing or worsening disability in the current healthcare milieu, studies of neurorehabilitation in the chronic phase after stroke have demonstrated that functional mobility improvement is possible in the chronic stage, but results have been either modest or limited to single types of impairments, such as balance or weakness or dyscoordination. This narrow focus of studies treating a single or too few impairments has been important in identifying potentially beneficial interventions for each of the single impairments that, together, underlie mobility dysfunction after stroke. However, if the field of neurorehabilitation is to progress, studies are needed that test interventions containing a more complete array of the impairments preventing recovery of function. To that end, we and others have conducted studies that are investigating treatment response of chronic stroke survivors according to a more complete array of impairments underlying mobility dysfunction in chronic stroke (e.g., Boissoneault et al., 2020).
In addition, a second gap exists in the current literature–the length or duration of intervention. The majority of interventions studied, to date, are less than 3–4 months in length. However, literature is emerging that supports the benefit of longer duration interventions of 6 months or more. In our own work, we tested a comprehensive, 6-month-long intervention program, entitled “Safety, Functional Outcomes, and Recovery after Stroke (SOARS)”, finding clinically and statistically significant improvement in balance, coordination, and functional mobility (Boisonneualt et al., 2020). These studies are important in justifying further investigation into the benefits of long-term neurorehabilitation.
To our knowledge, there is no information, to date, regarding the detailed trajectory of response to long-duration mobility/fitness intervention, according to measures of the broad array of impairments precluding functional mobility recovery in the chronic phase after stroke. But this information is important for a number of reasons. First, for example, characterizing the detailed trajectory of recovery in response to chronic-phase treatment will be valuable in providing insight into the near-term and long-term timing of response within a long-duration neurorehabilitation program, according to the salient array of impairment obstacles. Quantifying the timing of long-duration treatment response will provide evidence justifying the provision of long-duration treatment. A second important point is that characterizing individual response of chronic stroke survivors will provide evidence of the individual differences in treatment response. This information can provide quantitative evidence justifying the need for custom or precision neurorehabilitation in chronic stroke. Therefore, the purpose of the current preliminary work was to quantify the trajectory of change in response to the SOARS program of treatment, across 12 months of neurorehabilitation, in a sub-sample from a prior study.
Materials and methods
Design
This is the study of a subsample cohort of five stroke survivors who completed 12 months of treatment and who were assessed every two months from baseline to 12 months. The program consists of an array of interventions designed to target multiple impairments and dysfunctions obstructing the recovery of mobility in chronic stroke.
Subjects
At enrollment into the study, subjects were > 8 months post-stroke (except for one, 4 months post stroke). The study was conducted within the oversight of the university human subjects’ protection program (the Institutional Review Board (IRB). All subjects signed an Informed Consent Form.
Intervention
Sessions were conducted in an outpatient neurorehabilitation clinic and were 1–2.5 hours in duration, with duration dependent upon whether aerobic cycling was included on a given day and the endurance and comfort of the subject. Neurorehabilitation was administered by the study physical therapist, with specialized training and experience in neurorehabilitation.
The neurorehabilitation SOARS intervention was administered in two 6-month phases:
We used a strengthening program for lower limb muscles as follows: up to 50–80% of the 1 repetition maximum (1RM), up to 6–12 reps per set, and up to 1–4 sets per muscle group. (O’Sullivan & Schmitz 1994; Umphred, Lazaro, Roller, & Burton, 2013; Ryerson & Levit, 1997; Carr & Shepherd, 1987). For balance training, we used standard physical therapy practice (O’Sullivan & Schmitz 1994; Umphred, Lazaro, Roller, & Burton, 2013; Ryerson & Levit, 1997; Carr & Shepherd, 1987), and we integrated that with Yang-style Tai Chi movements (Taylor-Pillae et al., 2012; 2014). We used standard clinical practice principles for treatment progression (Daly et al., 2011; 2012).
We used the published protocol of Quaney et al. (2009) to conduct our moderate intensity aerobic training on a stationary bicycle and up to a target of 70% of maximal heart rate for 35 minutes, with a warm up (5 min) and cool down (5 min). We followed standard safety guidelines (Billinger et al., 2015; Gordon et al., 2004). One safety measure was that if resting blood pressure was greater than 140/90, cycle exercise was not performed on that day.
We based our coordination training on prior published work [Daly 2007; 2011; 2012; Boissoneault 2020]. This training was customized to baseline level of each participant and finely incremented in terms of challenge and treatment progression (Daly & Ruff, 2007). To assist with seated or side-lying coordination training, we used functional electrical stimulation as an exercise practice-assist for ankle and knee muscle activation (EMS+2™ Staodyn, Inc (Longmont, Colorado)). Stimulation parameters were: amplitude at subjectively comfortable level; 30Hz; 500μs pulse width; and duty cycle, 5 s on and 5 s off. FES use during gait training was customized to the timing of the individual’s gait cycle. Additional details for the coordination treatment components are presented elsewhere (Daly & Ruff, 2007; Daly et al., 2011; 2012; Boissoneault et al., 2020).
Measures
Impairment measures were as follows: 1) lower limb dyscoordination, the Fugl-Meyer-Lower Extremity Motor Assessment (FM; MDC of 3.57 points (Hiengkaew, Jitaree, & Chaiyawat, 2012); and 2) balance deficits, the Berg Balance Scale (BBS), with minimal detectible change (MDC) of 4.13 points (Flansber, Blom, & Brogårdh, 2012) and a threshold for functional independence of 45 points (Doğğan, MengüllüoĞĞlu, & Özgirgin, 2011).
Functional mobility measures were as follows: 1) 6MWT, with a minimum clinically important difference (MCID) of 111ft for initial gait speed of.4m/s or less and 233 ft for those with initial gait speed of > .4 m/s (Fulk & He, 2018); 2) gait speed (derived from the second minute of the 6 Minute Walk Test (6MWT), with an MCID of.16m/s (Tilson 2010); and Timed Up and Go Test (TUG), with an MDC of 4.13s (Hiengkaew, Jitaree, & Chaiyawat, 2012; Flansber, Blom, & Brogårdh, 2012); threshold for fall risk in older stroke survivors, 14s (Andersson, Kamwendo, Seiger, & Appelros, 2006).
The functional activity measure was the Functional Independence Measure (FIM), with an MCID of 22 points (Beninato 2006). Quality of Life (or life role participation) measure was the Craig Handicap Assessment and Reporting Technique (CHART), with a norm score for chronic stroke of 425.8 points (Walker, Mellick, Brooks, & Whiteneck, 2003).
Data were acquired at baseline and every two months, by the trained study therapist.
Data analysis
We generated descriptive statistics for the group mean and standard deviation. We inspected descriptive statistics for individual subjects. This information was compared to known MDC’s and MCID’s for each study measure, in order to make statements regarding group and individual measurable change and clinically significant gains, respectively.
For investigation of group performance, the randomization test was selected for its appropriate use in small sample size (Siegel & Castellan, 1988) and was used under the null hypothesis that the trend from baseline to 12 months was constant. The test statistic was the mean difference between baseline and 12 months. The p-value is reported as the proportion of permuted mean differences that are at or above the observed mean difference. The effect size of the 12-month change was computed using Cohen’s d (Cohen 1992). Confidence intervals were constructed from the nonparametric bootstrap with the percentile method (Davison & Hinkley, 1997).
The average trajectory for each measure was quantified using locally weighted polynomial regression (LOESS). This is a nonparametric regression method that produces a smooth curve to fit the average trajectory. These curves are estimated in the R computing environment (R Core Team 2018), R version 3.4.4, with the “ggplot2” R library (Wickham 2016). The LOESS curves are shown as the black lines in Figures 1–7, and individual subject trajectories are indicated in separate colors for each figure.

Individual participant 12-month trajectories of balance capability in response to long dose neurorehabilitation. Black solid line = group average trajectory. Top dotted line = ceiling. Bottom dotted line = <45, fall risk threshold.

Individual participant 12-month trajectories of lower limb coordination values in response to long dose neurorehabilitation. Black solid line = group average trajectory.

Individual participant 12-month trajectories of walking distance in 6 minutes, in response to long dose neurorehabilitation. Black solid line = group average trajectory.

Individual participant 12-month trajectories of gait speed in response to long dose neurorehabilitation. Black solid line = group average trajectory. Top dotted line = >.8 m/s, community ambulator. Bottom dotted line = >.4m/s, household ambulator.

Individual participant 12-month trajectories of functional mobility speed in response to long dose neurorehabilitation. Black solid line = group average trajectory. Dotted line = >14s, fall risk.
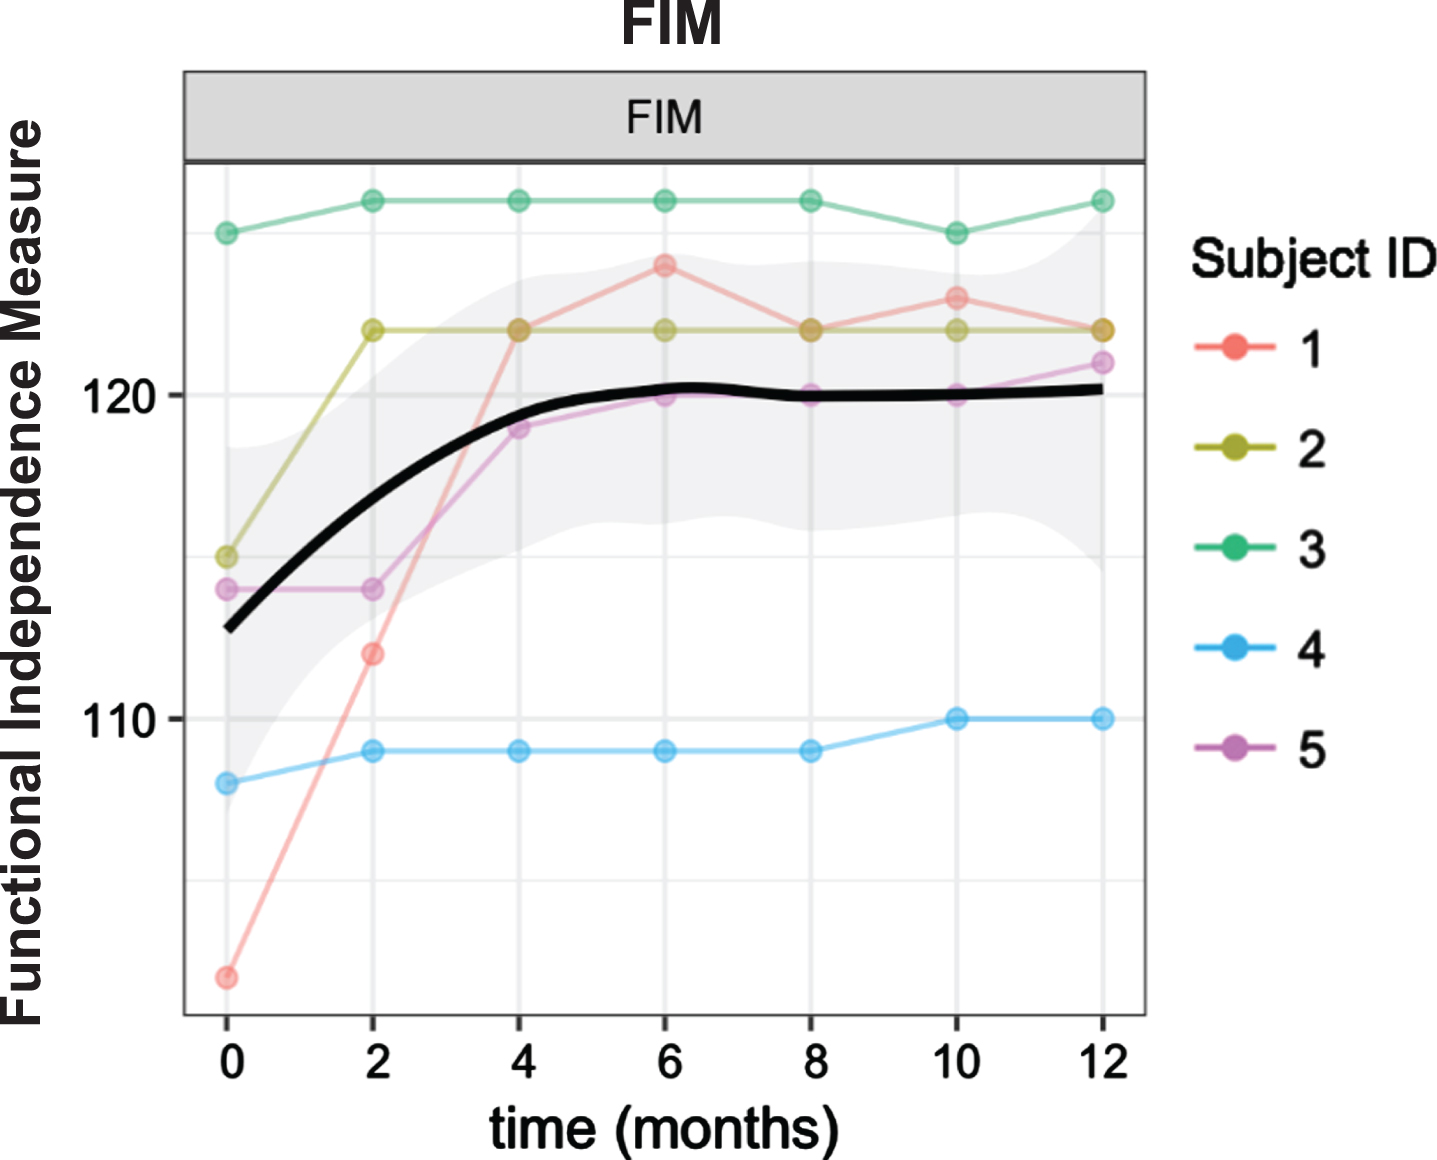
Individual participant 12-month trajectories of functional activity performance in response to long dose neurorehabilitation. Black solid line = group average trajectory.

Individual participant 12-month trajectories of life role participation (quality of life) in response to long dose neurorehabilitation. Black solid line = group average trajectory. Dotted line = chronic stroke norm.
Subject characteristics are shown in Table 1.
Subject Characteristics
Subject Characteristics
Impairment
Statistically Significant Improvement in Impairment, Function, and Quality of Life
Statistically Significant Improvement in Impairment, Function, and Quality of Life
Clinically Significant Achievements
Key: *MCID for initial walkers of.4 m/s or less = 33.8 m (Fulk 2018). **MCID for initial walkers of > .4 m/s = 71.0 m (Fulk 2018). BBS: Berg Balance Scale. 6MWT: Six Minute Walk Test. TUG: Timed Up and Go. FIM: Functional Independence Measure. CHART: Craig Handicap Assessment and Rating Tool. m/sec: meters / second. MCID: minimal clinically important difference (change). MDC: minimum detectible change.
Functional activities
Quality of Life
Individual case results across impairment, functional mobility, functional activities, and life role participation
Since there was so much variability across the subjects for each of the study measures, it is informative to identify the pattern of improvement within each given subject. The supporting data for the individual case results below are in the Supplementary Materials.
S1. Limb coordination improved 6 points (FM), by month 6 and was maintained there to month 12. This was accompanied by an increase in gait speed of.33m/sec, which is double the MCID for gait speed, and was maintained through month 12. Functional mobility (TUG) speed and endurance (6MWT) also improved from month 4 through month 12. The FM and gait speed improvements were accompanied by an improvement in functional activities (FIM, 20-point gain by month 4), which was maintained through month 12. The gains in impairment and functional activities were then accompanied by a gain in life role participation, which finally occurred in month 12 (CHART gain of 43 points from baseline to month 12).
S2. By 6 months, balance (BBS) improved 5 points reaching the ceiling of 56 points and maintaining at or near the ceiling through month 12. Limb coordination (FM) did not show improvement until month 12, at which time there was a 5-point improvement compared to baseline. Along with improved balance, there was gain in functional mobility as follows: 6MWT, 195.4 m gain by month 4, maintained through month 12; TUG, steady improvement from months 6 to 12; gait speed improved 0.29 m/s by month 4, then steadily improved through month 12 by .79 m/s, which is four times the MCID. Functional activities (FIM) improved 7 points. For the CHART, S2 began the study at a ceiling score of 600 and steadfastly maintained that self-reported score through month 12, with no perceived limitations in life role participation. She owned a small-business construction contracting business and described a full life of extended family and friends.
S3. S3 had early and important gains in limb coordination (FM), with a 5-point gain at month 2 and a 9-point gain from baseline to month 4, which he struggled to maintain, but achieved again at month 10. Limb coordination could have fluctuated with his reported fluctuating amount of home exercise, especially with FES. He also had an early improvement in balance (BBS) at month 2, with a 5-point gain (ceiling), which he essentially maintained through month 12. Gains in limb coordination and balance were followed at month 4 by gait speed improvement of 0.64 m/s and by month 6, improving the TUG score by more than 50% and maintaining through month 12. S3’s FIM and CHART scores were essentially at ceiling throughout the study. He owned a realty business and described a full extended family life and friends.
S4. S4 had a steady improvement in the two impairment measures: limb coordination (FM) improved throughout the 12 months, with an overall gain of 8 points; and balance (BBS) improved in increments of 1 point to 8 points through month 12, with an overall gain of 17 points. Gait speed and mobility endurance (6MWT) did not change, but functional mobility speed (TUG) improved by 11 s. FIM improved by 2 points from baseline to 12 months. Life role participation (CHART) improved once by month 2 and then again at month 6, with steady further improvement at months 8 and 10, finishing at month 12 with a 121-point gain from baseline.
S5. S5 exhibited early (2 points, by month 2) and steady gains in limb coordination (FM) through month 8, with a final 12-month gain of 9 points. Balance (BBS) progressively improved through months 2, 4, and 6, and again at month 12 (1 point from ceiling), with an overall gain of 16 points. Functional mobility endurance (6MWT) improved from month 4 through month 12, with a final gain of 53.3 m. From months 6, 8, 10, and 12, there was incremental improvement in gait speed and TUG, with overall gait speed gain of.17 m/s (the MCID), and overall TUG gain of 11.6 s. Along with her considerable gains in limb coordination and balance, there was an overall gain in functional activities (FIM) of 7 points, with the last point of improvement at month 12. Her life role participation score (CHART) peaked at month 6, but the overall gain from baseline to month 12 was still 45 points.
Discussion
This study contributes to the literature in two ways. First, long-duration (12 months) and clinically significant improvement was shown in chronic stroke, and second, the trajectory of a 12-month treatment response is characterized.
Statistically and clinically significant improvement in impairment and functional mobility, (Treatment Months 0–12)
First, the study shows that chronic stroke survivors can improve both clinically and statistically significantly in an array of measures of impairment and function. There was statistically significant improvement in impairment (limb coordination (FM); balance BBS). Given the relationship between impairment and function (Nas, Gür, Çevik, & Saraç, 2004; Wee & Hopman, 2005), it is reasonable to consider that the significant gain in function shown here was produced by improved balance and coordination (Verheyden et al., 2006; Hessam et al., 2018). Furthermore, given the relationships between function and quality of life, it is reasonable to consider that the significant gain in function was sufficient to improve quality of life in important ways, as well (Price & Choy, 2019; Cinnera et al., 2020).
Trajectory of recovery
The second contribution to the literature is that through repeated measures across the 12-month intervention, this study provides information regarding both the average trajectory of improvement (Figs. 1–7, thick black line), and the individual variation of recovery trajectory across Subjects, throughout the duration of the 12-month intervention.
Group average
Regarding the group average trajectory, for all measures except the FIM and CHART, there was continued absolute improvement through the entire treatment period (12 months). For the impairment measures of coordination (FM) and balance (BBS), the greatest rate of change was from months 1–6 and months 1–4, respectively. After that, the FM had a plateau for two months, and then continued to improve until the end of treatment.
Group BBS gain was > 2× the MDC and demonstrated a steady rate of improvement until ∼ month 6, where the rate of gain dropped to more modest levels, although continued improvement may have been hampered by a ceiling effect; all 5 Subjects approached or met the maximum score on this balance measure. A more challenging balance measure may have captured additional balance improvements in this patient sample. In fact, less than half of Subjects initiated the study with a BBS score below the BBS measure cutoff for functional independence. Of the two Subjects with lower scores, there was an improvement of 16.5 points, ∼4× the MDC established by Flansbjer (2012).
In terms of functional mobility, group average gait speed showed a higher rate of change during the first four months (∼0.13 m/s) versus the last six months, but there was still improvement during the last eight months (∼0.05 m/s increase per every two months). At the 6-month time point, the group mean surpassed the threshold for community ambulation (0.8 m/sec).
The 6MWT plateaued during months 10–12, as did functional mobility (TUG). Group FIM exhibited a high rate of change through month 4, and approximately plateaued beyond month 4. Quality of life followed the same group trajectory.
Group TUG gain was > 3× the MDC. The group gain for the TUG was influenced most highly by the three Subjects (S1, S4, S5) whose baseline TUG scores showed initial high fall risk (>14 sec). Though these three subjects did not quite achieve this cutoff score during the study, they improved on average by 14.22s, which is 4.5× the established MDC of 3.16s. Further, they were each within only 4s of the fall risk cutoff, and notably, they had not yet plateaued in their improvement trajectory at month 12.
We can note that the high rate of change in the impairment measures through months 4–6 coincided with the greatest rate of group improvement in the functional mobility measures, overall function (FIM), and quality of life (CHART). Because Subjects continued to improve in coordination as measured by the FM through month 12, and experienced a ceiling effect on our measure of balance, the BBS, there remains a question as to whether further treatment beyond the 12 months would continue to produce average gains in coordination and balance sufficient to produce even further functional and quality of life improvements. Further study would elucidate the answer to this question.
Individual differences in recovery trajectory and advantage of long-duration treatment
Group information is important, and at the same time, group data fails to inform us as to the individual differences and needs for specific stroke survivors in treatment components. That is, each participant had a unique 12-month improvement pattern across the impairment, function and quality of life measures used in the study, and some required the full 12 months to reach their highest score.
Impairment
Subject variability in limb coordination gains is shown in Fig. 1. Balance recovery variability is shown in Fig. 2, in which Subject 4 had the greatest gain in BBS during months 6–8, whereas Subject 5 had the greatest gain during months 2–4. This subject variability highlights the diverse, patient-specific nature of stroke recovery.
The long-duration treatment was advantageous. For example, Subjects 1, 2, and 4 had important coordination and balance improvement from months 4–12. These late-occurring coordination and balance improvements could be critical for further improvement in function and quality of life (Nas, Gür, Çevik, & Saraç, 2004; Verheyden et al., 2006; Hessam et al., 2018; Price & Choy, 2019; Cinnera et al., 2020), even beyond the 12 months of the study. Further study could be warranted with regard to reaching optimal levels of coordination and balance, with a longer-term program of care and treatment for chronic stroke survivors.
Functional mobility.
Though group gait speed gain was > 2× the MCID, the rate of improvement was highly variable; two Subjects exceeded the MCID at month 2, one at month 6, and one (Subject 5) showing a very slow and steady climb by month 12 to the MCID. Though the 6MWT gain approached 2×’s the MCID, we can see in Fig. 2 that the group diverged into 2 low functioning Subjects and 1 high functioning Subject who made minimal to no gains pre- to post-intervention, and two medium functioning Subjects who were responsible for most of the group change found at the group level. Thus, the 6MWT group plateau during months 10–12 data (Fig. 3, thick black line) also conceals the fact that Subject 2 continued to improve from months 10–12. The same could be said for the TUG group data (Fig. 5, thick black line), for which an apparent group plateau from months 6–12 conceals the continued improvement for Subjects 1, 4, and 5 (Fig. 5).
The group gain for the TUG was influenced most highly by the three Subjects (S1, S4, S5) whose baseline TUG scores showed initial high fall risk (>14 sec). Though these three subjects did not quite achieve this cutoff score during the study, they improved on average by 14.22 sec, which is 4.5×’s the established MDC of 3.16 s. Notably, they were each within only 4 s of the fall risk cutoff, and notably, they had not yet plateaued in their improvement trajectory at month 12, further supporting long-duration care and treatment for stroke survivors possibly even beyond 12 months.
Quality of Life
Important gains were exhibited by Subjects 1, 4, and 5, with the gains for Subjects 1 and 4 requiring 10 to 12 months of intervention. S5’s values are more difficult to interpret, given the high value at month 6; this value could have resulted from some life event which resulted in more positive circumstances for that week. For example, if there was a family gathering over a period of days, more communication with others could have occurred, along with more outings into the community, potentially raising the score. Two subjects were at the CHART ceiling at baseline (Subjects 2 and 3). At study entry, these two subjects had managed to extensively compensate for their limb and gait dyscoordination and balance deficits to the extent that they were able to work as owners of their own respective businesses–construction contracting service and realty, respectively. Their life situation, with employment in the public domain, resulted in the high baseline CHART score.
Conclusions
We can make several conclusions from the study data, as follows: 1) Long-duration neurorehabilitation (12 months) for mobility/fitness was clinically or statistically significant in terms of impairment and functional measures; 2) According to the array of impairment, functional, and quality of life measures, comparison of individual response to treatment across the five stroke survivors shows a unique pattern of change for each individual; 3) Given the gains in some measures that occurred late in the treatment protocol, a 12-month intervention can provide critical neurorehabilitation for achieving best possible function and quality of life after stroke; 4) Given that some measures for some subjects did not reach a plateau at 12 months, there is justification for further investigation of evidence for a potentially longer program (>12 months) of rehabilitation and/or maintenance care for stroke survivors.
Footnotes
Acknowledgments
This work was funded by the University of Florida, College of Medicine (award #2901D18N06) and the McKnight Brain Institute (Grant # 00114654); and the Department of Veterans Affairs (Grant B9024S and B22615). We are grateful to the Magnolia Parke Outpatient Rehabilitation Facility of the ShandsHealth System associated with the University of Florida. Lynn Dirk provided formatting and graphics assistance.
Conflict of interest
The authors report no conflicts of interest.
