
Abstract
Postsecondary educational attainment is an important determinant of future economic opportunity and social mobility. However, sizable gaps in educational attainment exist within communities and across sociodemographic lines. The goal of this research is to develop processes and methodologies that could be applied across a variety of geographic areas to better understand why postsecondary attainment varies across communities. Academic persistence is influenced by factors that go beyond the individual student, to include contextual and institutional influences. We developed a study of 21 high schools within two distinct geographic regions of Virginia: Richmond City and surrounding rural counties and the Roanoke and Appalachian region. We used nearly 70 publicly available administrative, survey, and opportunity datasets from across multiple organizations to characterize the high schools, the student body, and the communities. These data informed predictive models and statistical analysis for exploring factors that influence student outcomes after high school. We found that influencing factors varied by student characteristics (e.g., economically disadvantaged) and high school location (urban versus rural). We must account for the unique characteristics of the student and the communities to develop targeted strategies that encourage postsecondary enrollment.
Introduction
Postsecondary educational attainment is an important determinant of future economic opportunity and social mobility [1, 2, 3]. However, sizable gaps in educational attainment exist within communities and across sociodemographic lines [4]. The Virginia State Government’s State Council of Higher Education for Virginia (SCHEV) is responsible for developing statewide strategic plans that respond to Virginia’s goals around higher education. Approved in 2014, The Virginia Plan for Higher Education provides a framework that drives towards the goal of making Virginia the best-educated state by 2030. To do this, SCHEV estimates that Virginia must increase the rate of postsecondary degree attainment from 51% to 70% by 2030 [5]. Postsecondary training and education can be achieved through a variety of means, from a traditional two-year or four-year college degree to a college or industry certificate, credential, or license. In an effort to move towards this goal, SCHEV is interested in understanding why postsecondary attainment varies across communities in Virginia. They would like to use this information to support policy development, education, and intervention strategies that target outreach to community leaders, teachers, students, and parents in these communities.
High schools in the Roanoke/Appalachia and Richmond Study Areas. (top) High school zones and urban versus rural distinctions according to the 2010 U.S. Census urban-rural classification. (middle) Proportion of graduating high school students enrolled in two-year institutions. (bottom) Proportion of graduating high school students enrolled in four-year institutions. Note that the geographies are not to scale. (Data source: Virginia Department of Education, 2011–2015 school years.) *The boundaries for Open High and Richmond Community High overlap with the high schools in Richmond City and as such are not shown in the figures. The proportion of graduating students from these high schools who enrolled in two-year institutions is 17% and 7% and the proportion who enrolled in four-year institutions is 71% and 87%, respectively. Note that a high school boundary was not available for Franklin Military Academy, which is a secondary military institution in Richmond City. As such, we did not include Franklin Military Academy in the study.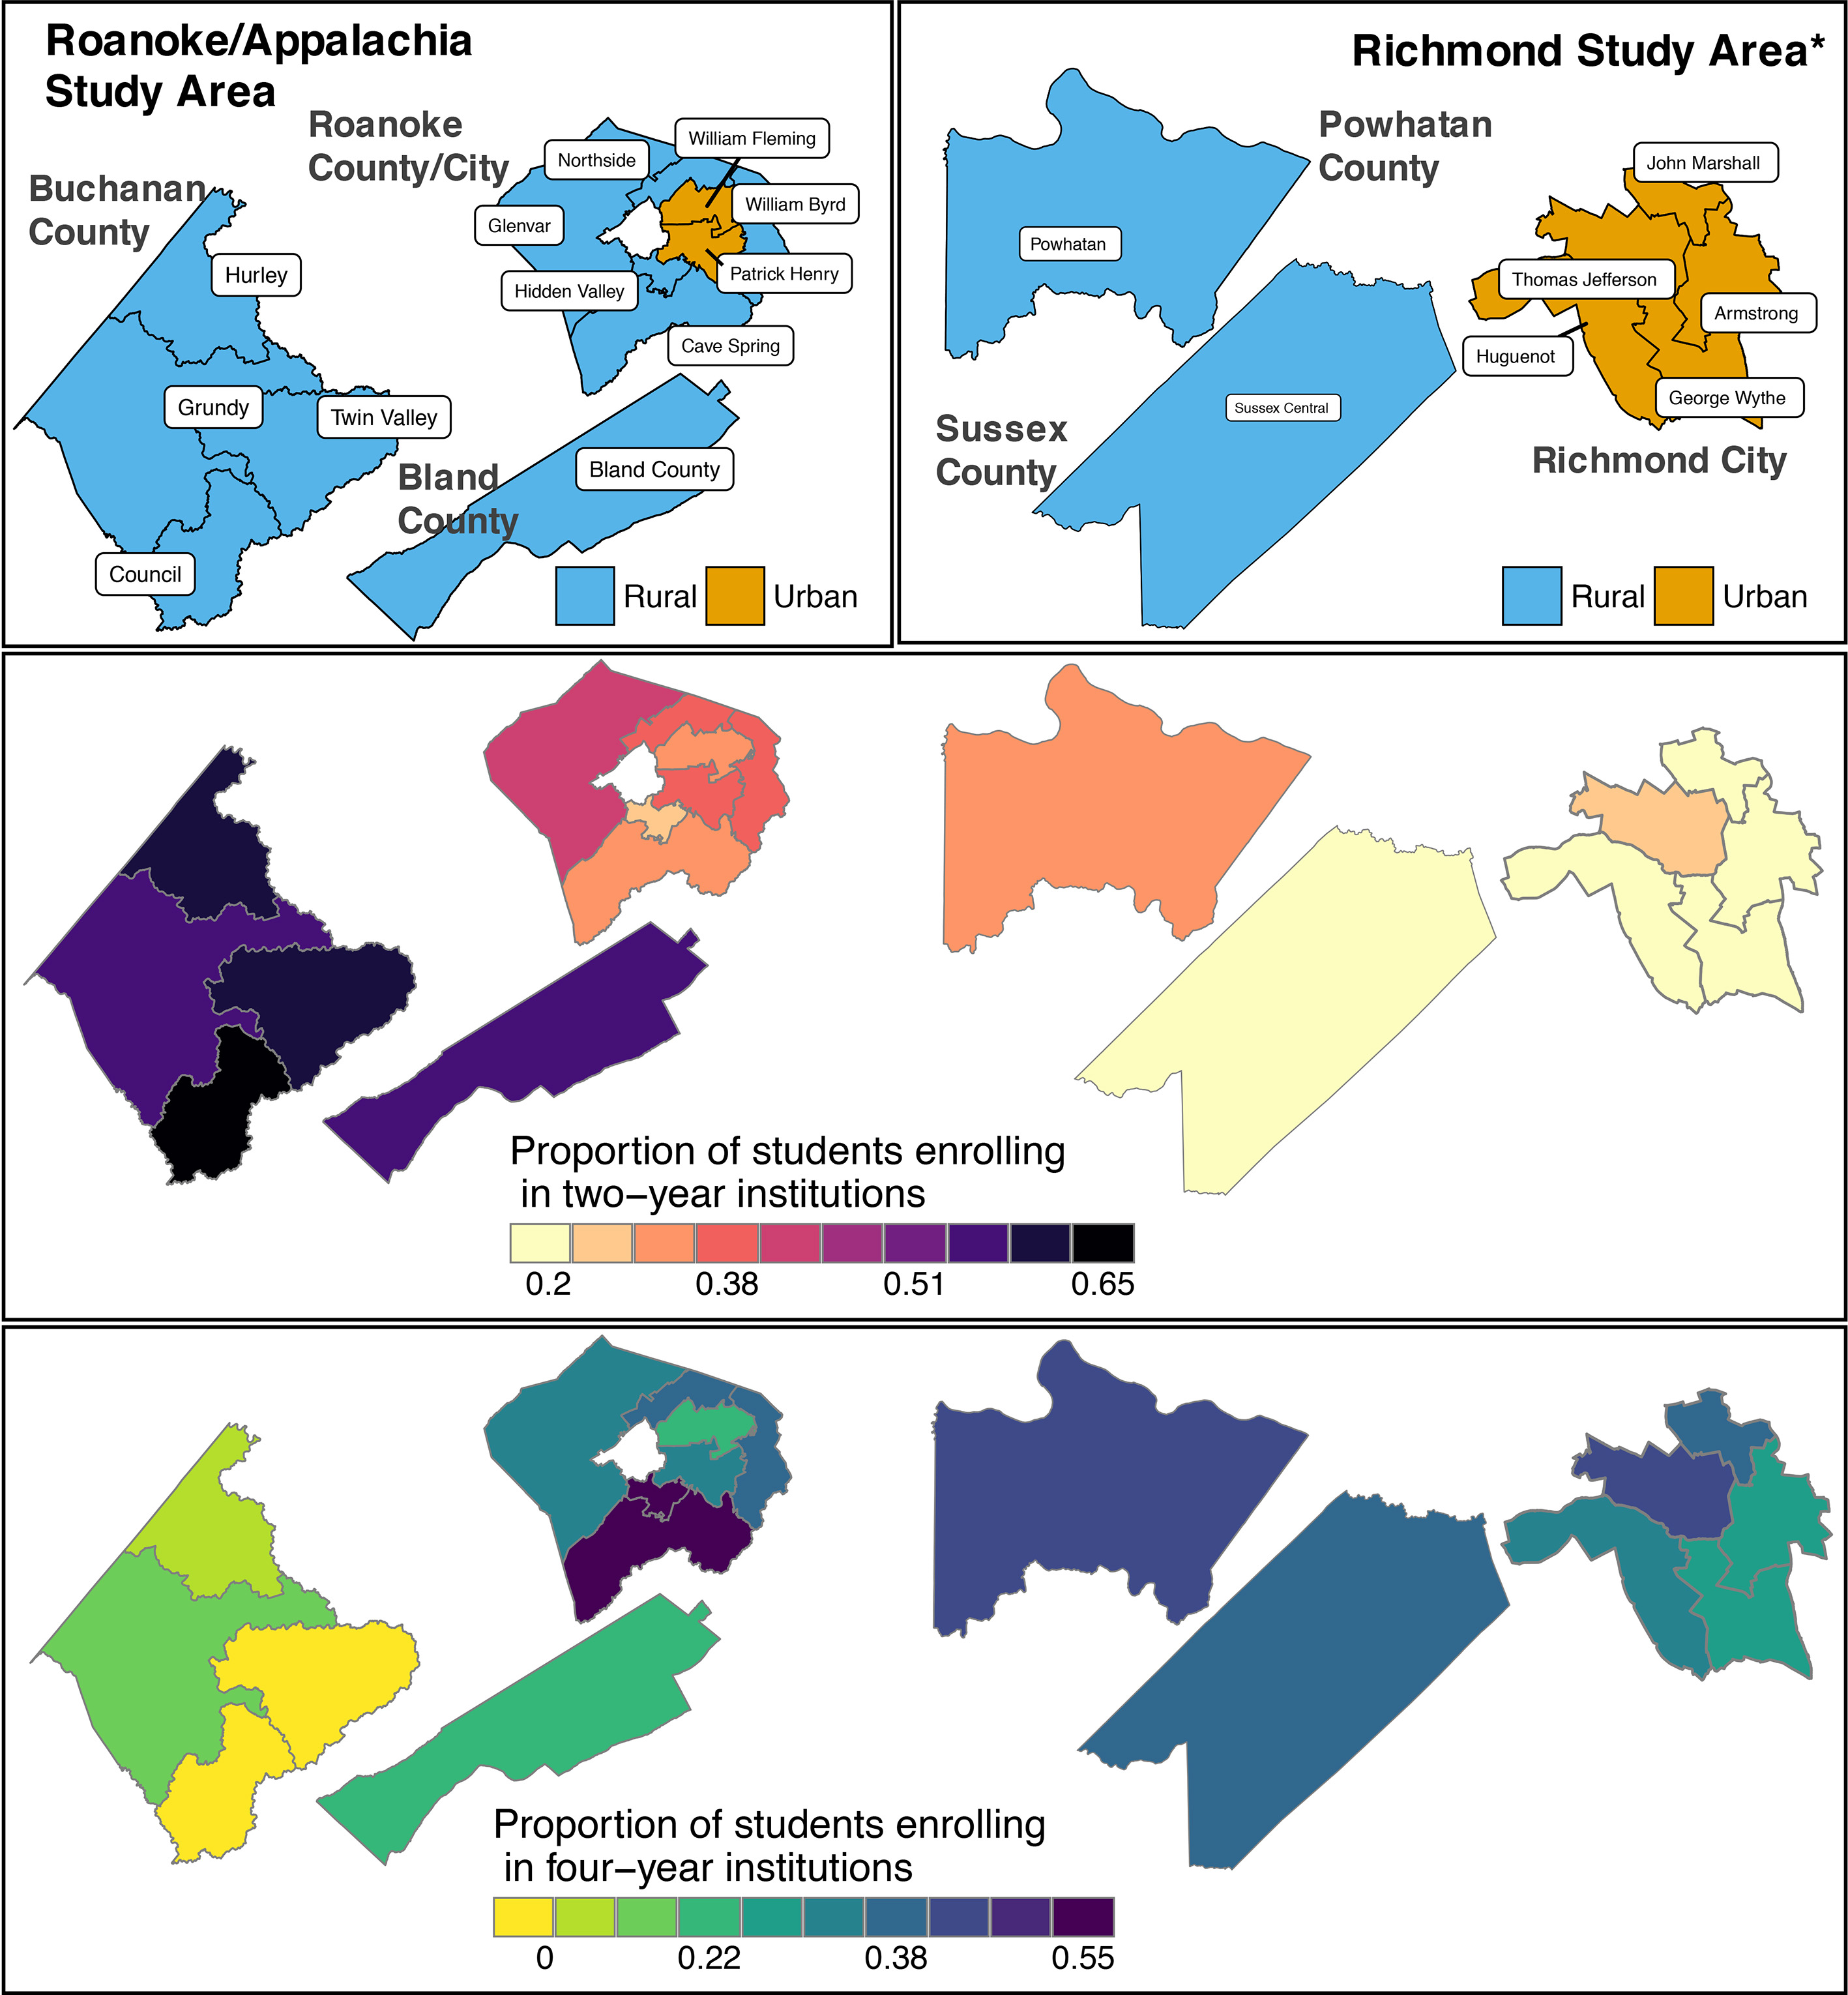
Subset of socioeconomic and academic variables used to characterize the high schools in the Roanoke/Appalachia and Richmond Study Areas. High schools within the yellow shaded area are those in the Roanoke/Appalachia Study Area and high schools in the white area are those in the Richmond Study Area. Within each study area, high schools are sorted by county/city. The horizontal axis is the proportion of students or residents within a high school zone. The dashed line represents the mean of each variable. (Data sources: Virginia Department of Education, 2011–2015 school years; U.S. Census Bureau’s American Community Survey, 2015 5-year estimates; The College Board, 2014; Open Data Open Jobs, 2016–2017.)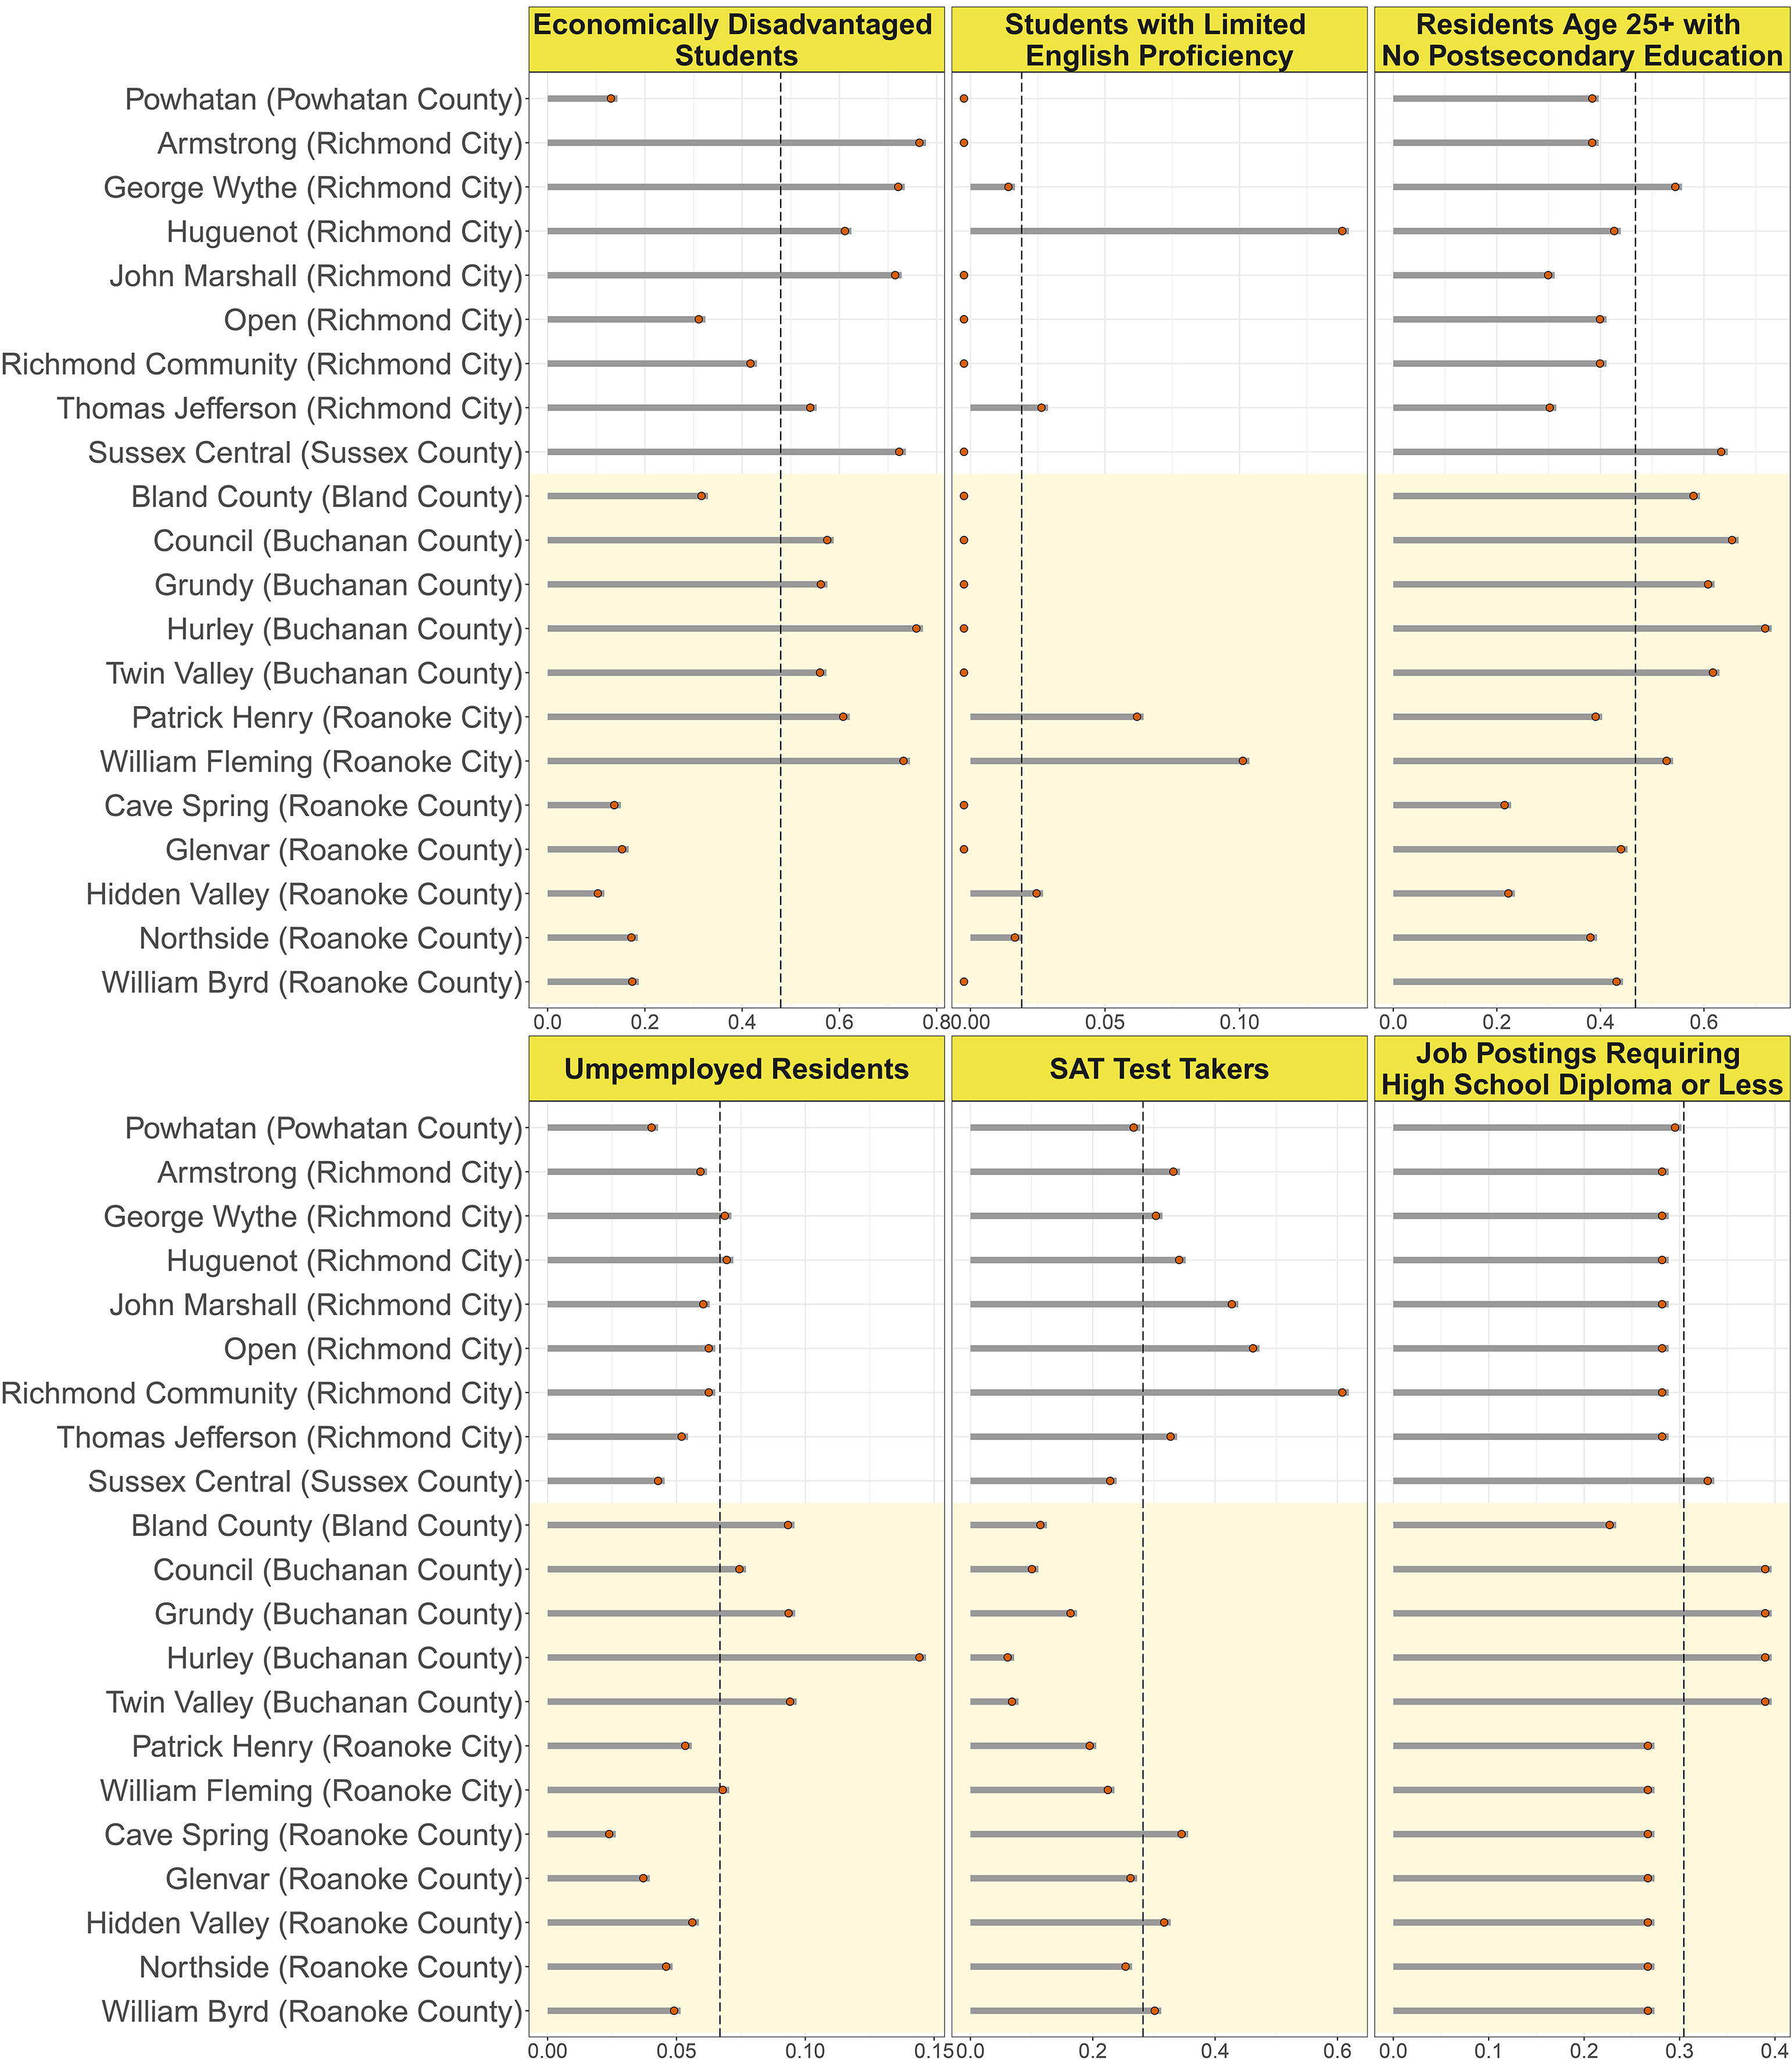
We completed a pilot study of two geographic areas in Virginia. The first area, which we call the Roanoke/Appalachia Study Area, is comprised of Buchanan County, Bland County, Roanoke County, and Roanoke City. The second area is the Richmond Study Area and includes Sussex County, Powhatan County, and Richmond City. Within each study area, we sought to select counties/cities that are geographically near but that show variations in their levels of postsecondary educational attainment and socioeconomic diversity. The Roanoke/Appalachia Study Area is mostly rural while the Richmond Study Area is more diverse and provides a larger mix of rural and urban populations. Figure 1 shows the high school boundaries in the study areas and urban versus rural distinctions according to the 2010 U.S. Census Bureau’s urban-rural classification. Also shown are the proportion of graduating students enrolled in two-year and four-year institutions by high school. Higher proportions of students in the Roanoke/Appalachia Study Area are enrolling in two-year colleges, especially those from Bland County and Buchanan County. On the other hand, high school students in the Richmond Study Area and in Roanoke County and Roanoke City are more likely to enroll in four-year institutions.
Conceptual data model with a sample of the variables used to characterize the high school, the community, and the broader context. The source for each variable is shown in parenthesis. The primary data sources are described further in the table at the bottom.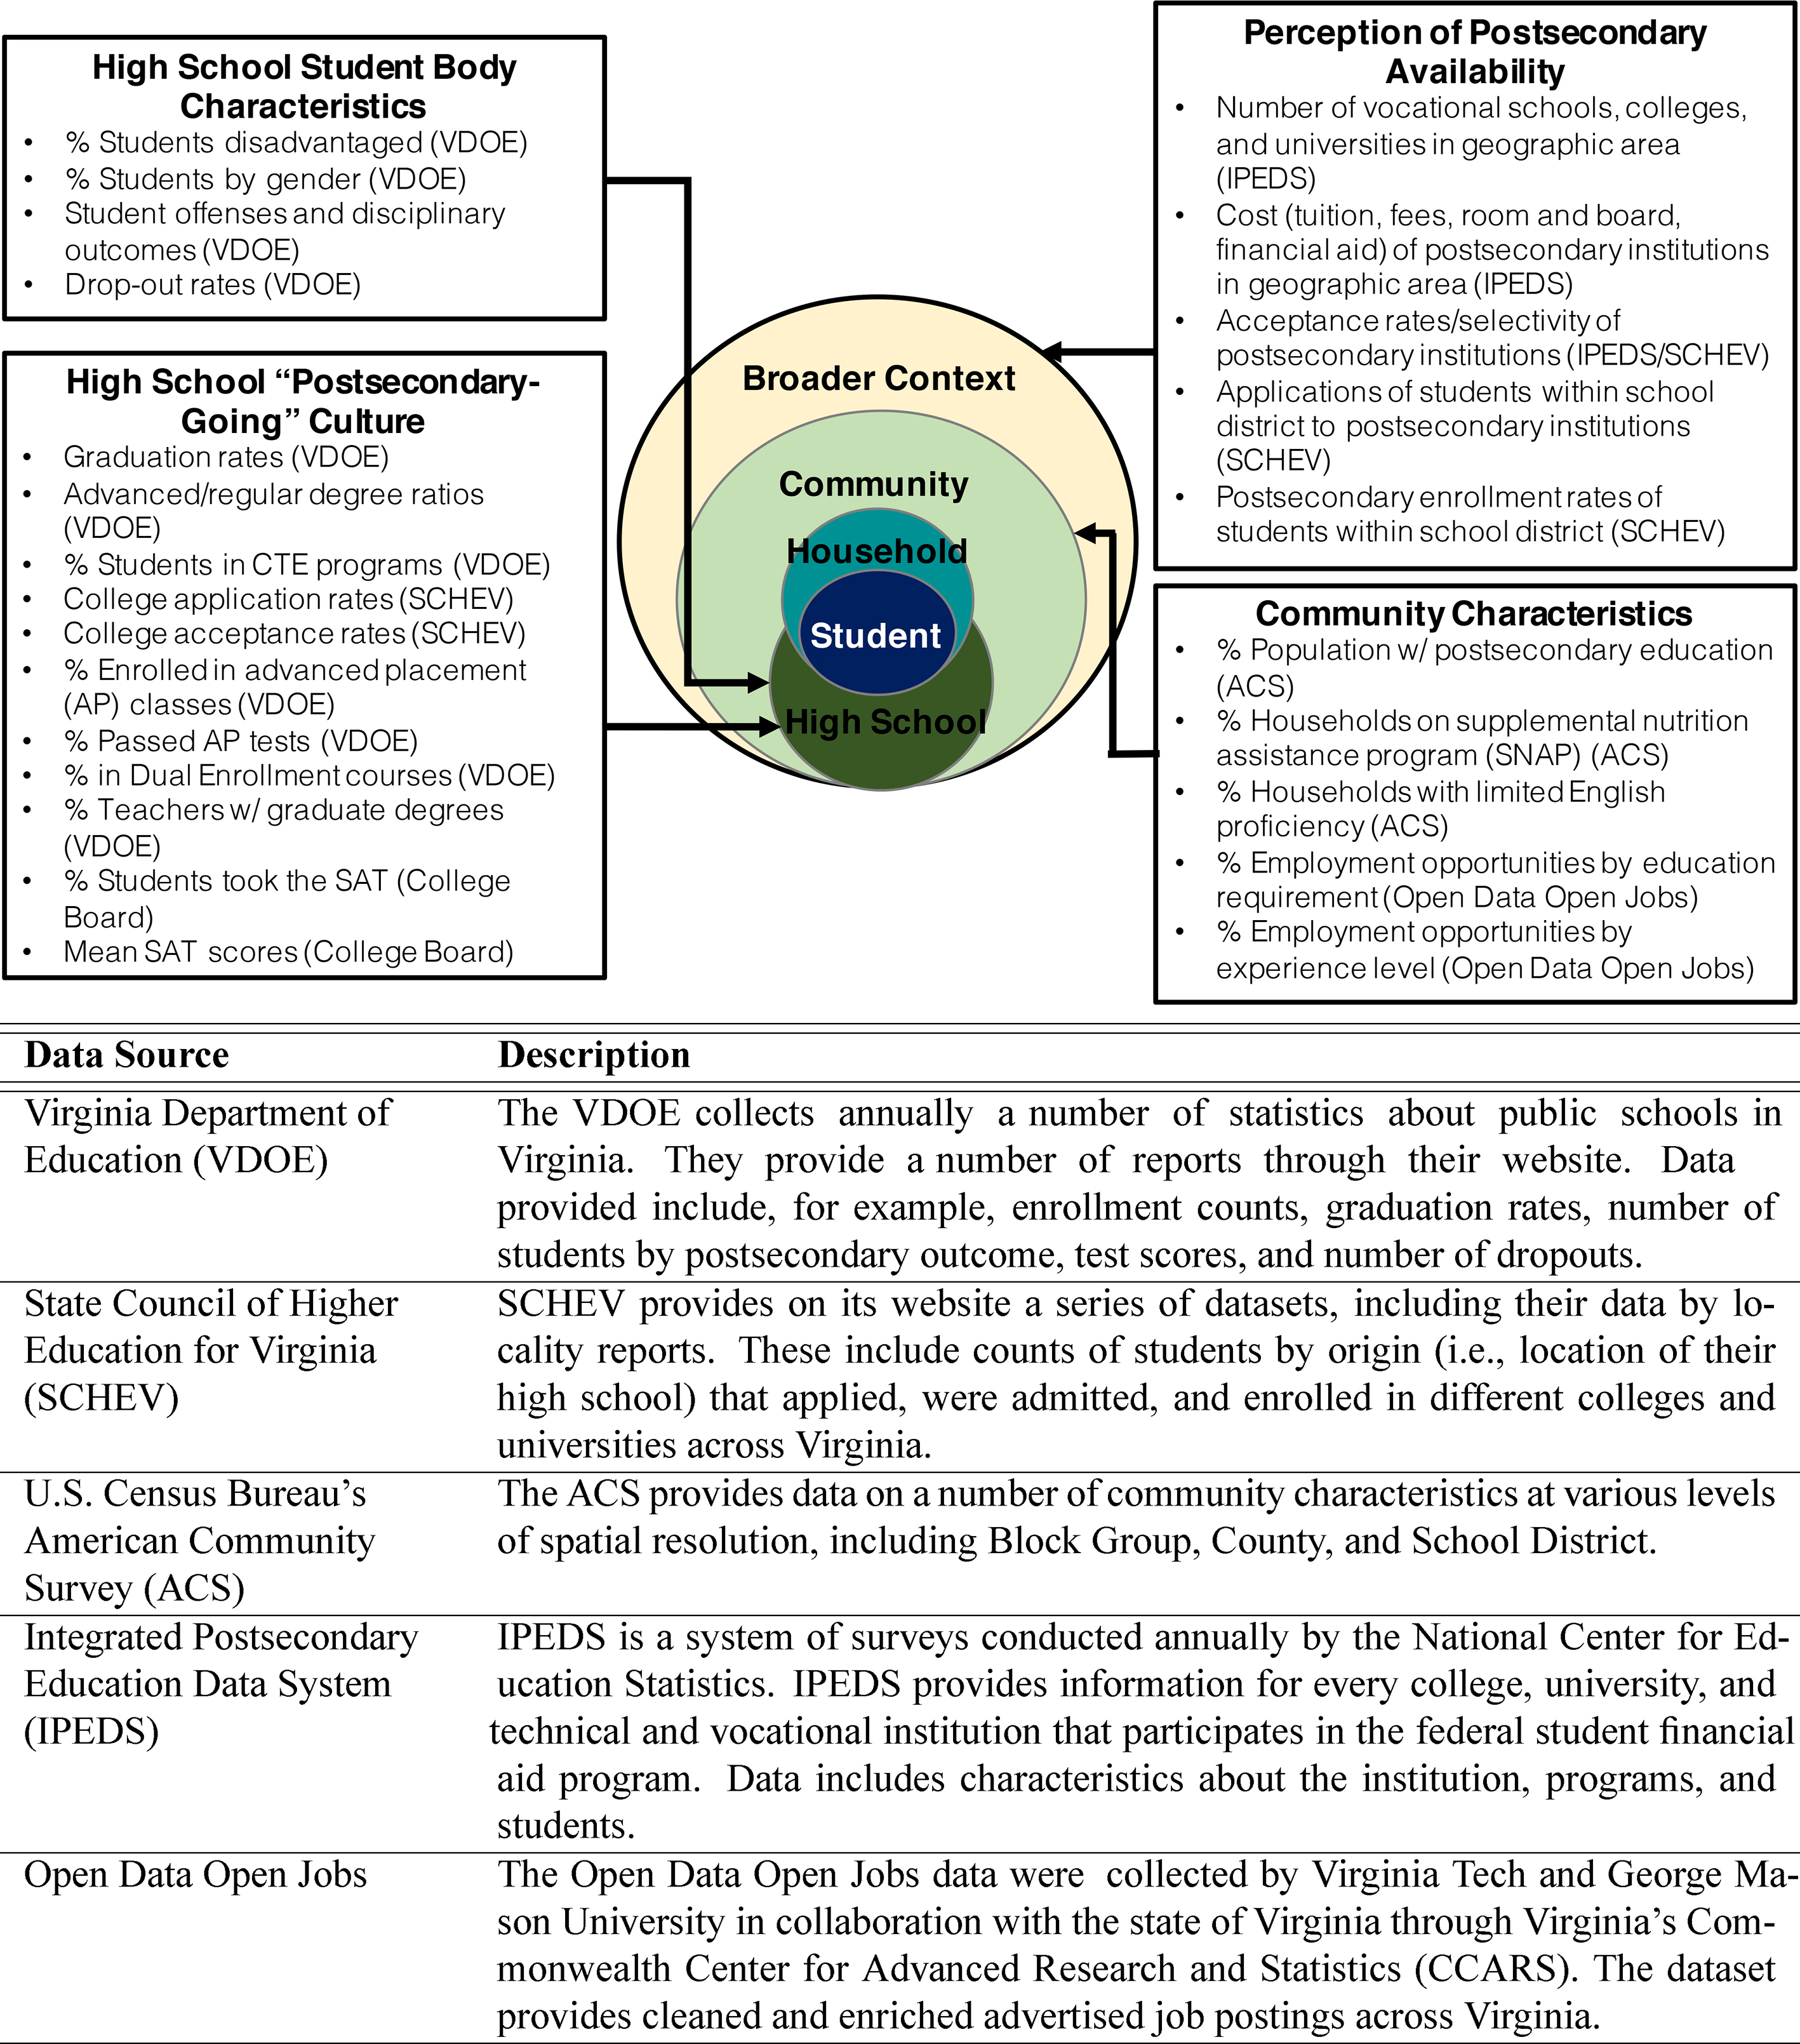
There are many factors that can influence a high school student’s decision to either pursue a postsecondary education or not. They go beyond the characteristics of the individual student to include the contextual and institutional environment for which the student is embedded. These factors, such as background characteristics, achievements, high school culture, access and availability of institutions, interact to ultimately influence attitudes and shape the student’s decision [6, 7]. For this reason, it is important that any model of postsecondary choice take a holistic approach that incorporates multiple levels of contextual influences.
In this study, we use publicly available data across federal, state, and local sources to understand what influences postsecondary outcomes within the two study areas. We approach this by first conducting a disciplined process of data discovery. Guided by the literature and expertise from our collaborators at SCHEV, we documented, extracted, and explored nearly 70 datasets, including administrative, survey, and opportunity data (e.g., online job postings). The intended use of these datasets can vary depending on a number of factors, such as the intended audience and reporting requirements. Extensive efforts were placed in repurposing these data. In a highly iterative manner, we developed the conceptual data model which provides a data framework (see Fig. 3) to inform statistical analysis and model development. Selected socioeconomic and academic variables used to characterize the high schools in the study areas are shown in Fig. 2. For example, high schools that tend to have higher proportions of students taking the SATs have lower proportions of unemployment. On the other hand, there does not seem to be an association between SAT test takers and the proportion of economically disadvantaged students. Understanding such associations and their effects on postsecondary outcomes requires statistical methods that will help uncover these relationships.
We developed predictive models of postsecondary outcomes that account for student body, high school, community, and regional characteristics. By understanding the features of a high school that lead to lower or higher rates of postsecondary enrollment, we can help guide policy development and resource allocation that helps high schools achieve postsecondary goals. Finally, we take a deeper look into the high schools’ “postsecondary-going” culture. The literature defines a high school with a “college-going” culture as one that encourages all students to go to college and ensures that they are informed about their college options [7]. Prior strategies for assessing a high school’s “college-going” culture have been largely subjective with particular focus on encouraging four-year college enrollment. As part of this study, we explore development of composite indicators of “postsecondary-going” culture that may better quantify a high school’s culture for encouraging all types of postsecondary enrollment.
Part of the goal of the pilot was to assess the feasibility of scaling this study to the entire state. While exploratory in nature, we believe that the methodologies and initial results of this pilot provide enough promise to warrant expanding the study to all high schools across Virginia. The use of publicly available administrative and survey data makes this approach easy to expand across all high schools in the state of Virginia as well as to other states should similar data sources be available.
Our approach for better understanding why postsecondary attainment varies across communities within the study areas can be broken-out into three high-level steps. These include a disciplined process of data discovery and preparation of a conceptual data model to inform statistical analysis and modeling, development of predictive models to understand postsecondary outcomes, and creation of composite indicators to measure a high school’s postsecondary-going culture. We discuss each of these steps and associated results in more detail here.
Conceptual data model
The early educational aspirations of a student do not necessarily equate to actual educational attainment. Redford et al. [3], for instance, found that first-generation college students and continuing education students had similar expectations for obtaining a bachelor’s degree but much fewer first-generation students actually obtained the degree, citing reasons almost all external to the coursework itself. Moreover, Avery et al. [8] found that low-income students in high schools with little to no tradition of sending students to college are more likely to “undermatch” (i.e., apply to less selective schools even though they meet the academic qualifications for more selective institutions). Contextual and institutional pressures, from perceived or actual financial burden, to the normative expectations of students at a high school and the educational attainment of those in the neighborhood, can all potentially influence the rates of postsecondary outcomes in a community. The conceptual data map shown in Fig. 3 emerged through such considerations, in addition to the local and subject-matter expertise of our collaborators at SCHEV and the process of data discovery.
The integration of vast amounts of data across the local, state, and federal levels requires that we apply a disciplined approach for identifying data sources, preparing them for use, and then assessing the value of these sources for our research [9]. In developing the data model, we explored approximately 70 publicly available datasets across federal, state, and local sources. These included administrative data from the Virginia Department of Education (VDOE), SCHEV, and The College Board; survey data from the U.S. Census Bureau’s American Community Survey (ACS) and the U.S. Department of Education’s Integrated Postsecondary Education Data System (IPEDS); and opportunity data (e.g., online job postings) from Open Data Open Jobs, a collaborative initiative between Virginia Tech, George Mason University, and the state of Virginia. Selected variables within each dataset were documented and profiled, including examination of the longitudinal availability, units of analysis, and data suppression rules. The intended use of these data can vary for many reasons, e.g., the intended audience, reporting requirements, the specific requirements of a job. Administrative data, in particular, are typically not intended for use in statistical analysis and modeling. For this reason, preparing the data for these purposes required extensive efforts in data cleaning (e.g., VDOE Excel reports are not formatted for simple loading into statistical software) and transformation, which allowed the datasets to be linked across the many sources. Finalizing the data model was an iterative process between continued data discovery, inventory, and cleaning and transformation processes in addition to feedback from subject-matter experts.
We found that by using publicly available data we can characterize various aspects of the high school, the community, and the postsecondary opportunities of graduating high school students. We categorize the data into the following areas:
Characteristics of the high school student body, which includes demographic and socioeconomic variables, such as gender and economically disadvantaged status. The high schools’ postsecondary-going culture, which includes factors that influence a high sch-ool’s culture around encouraging postsecondary educational opportunities. Based on our literature review as well as discussions with domain experts, we acquired a set of variables that jointly capture the notion of a high school’s postsecondary-going culture. This set contains information on graduation rates, college application rates, standardized test scores, among others. We chose to assess postsecondary-going culture, rather than college-going culture, because it was important that we understand those factors associated with various postsecondary trajectories to include four-year or two-year college degrees, postsecondary and industry certificates, and other credentials.
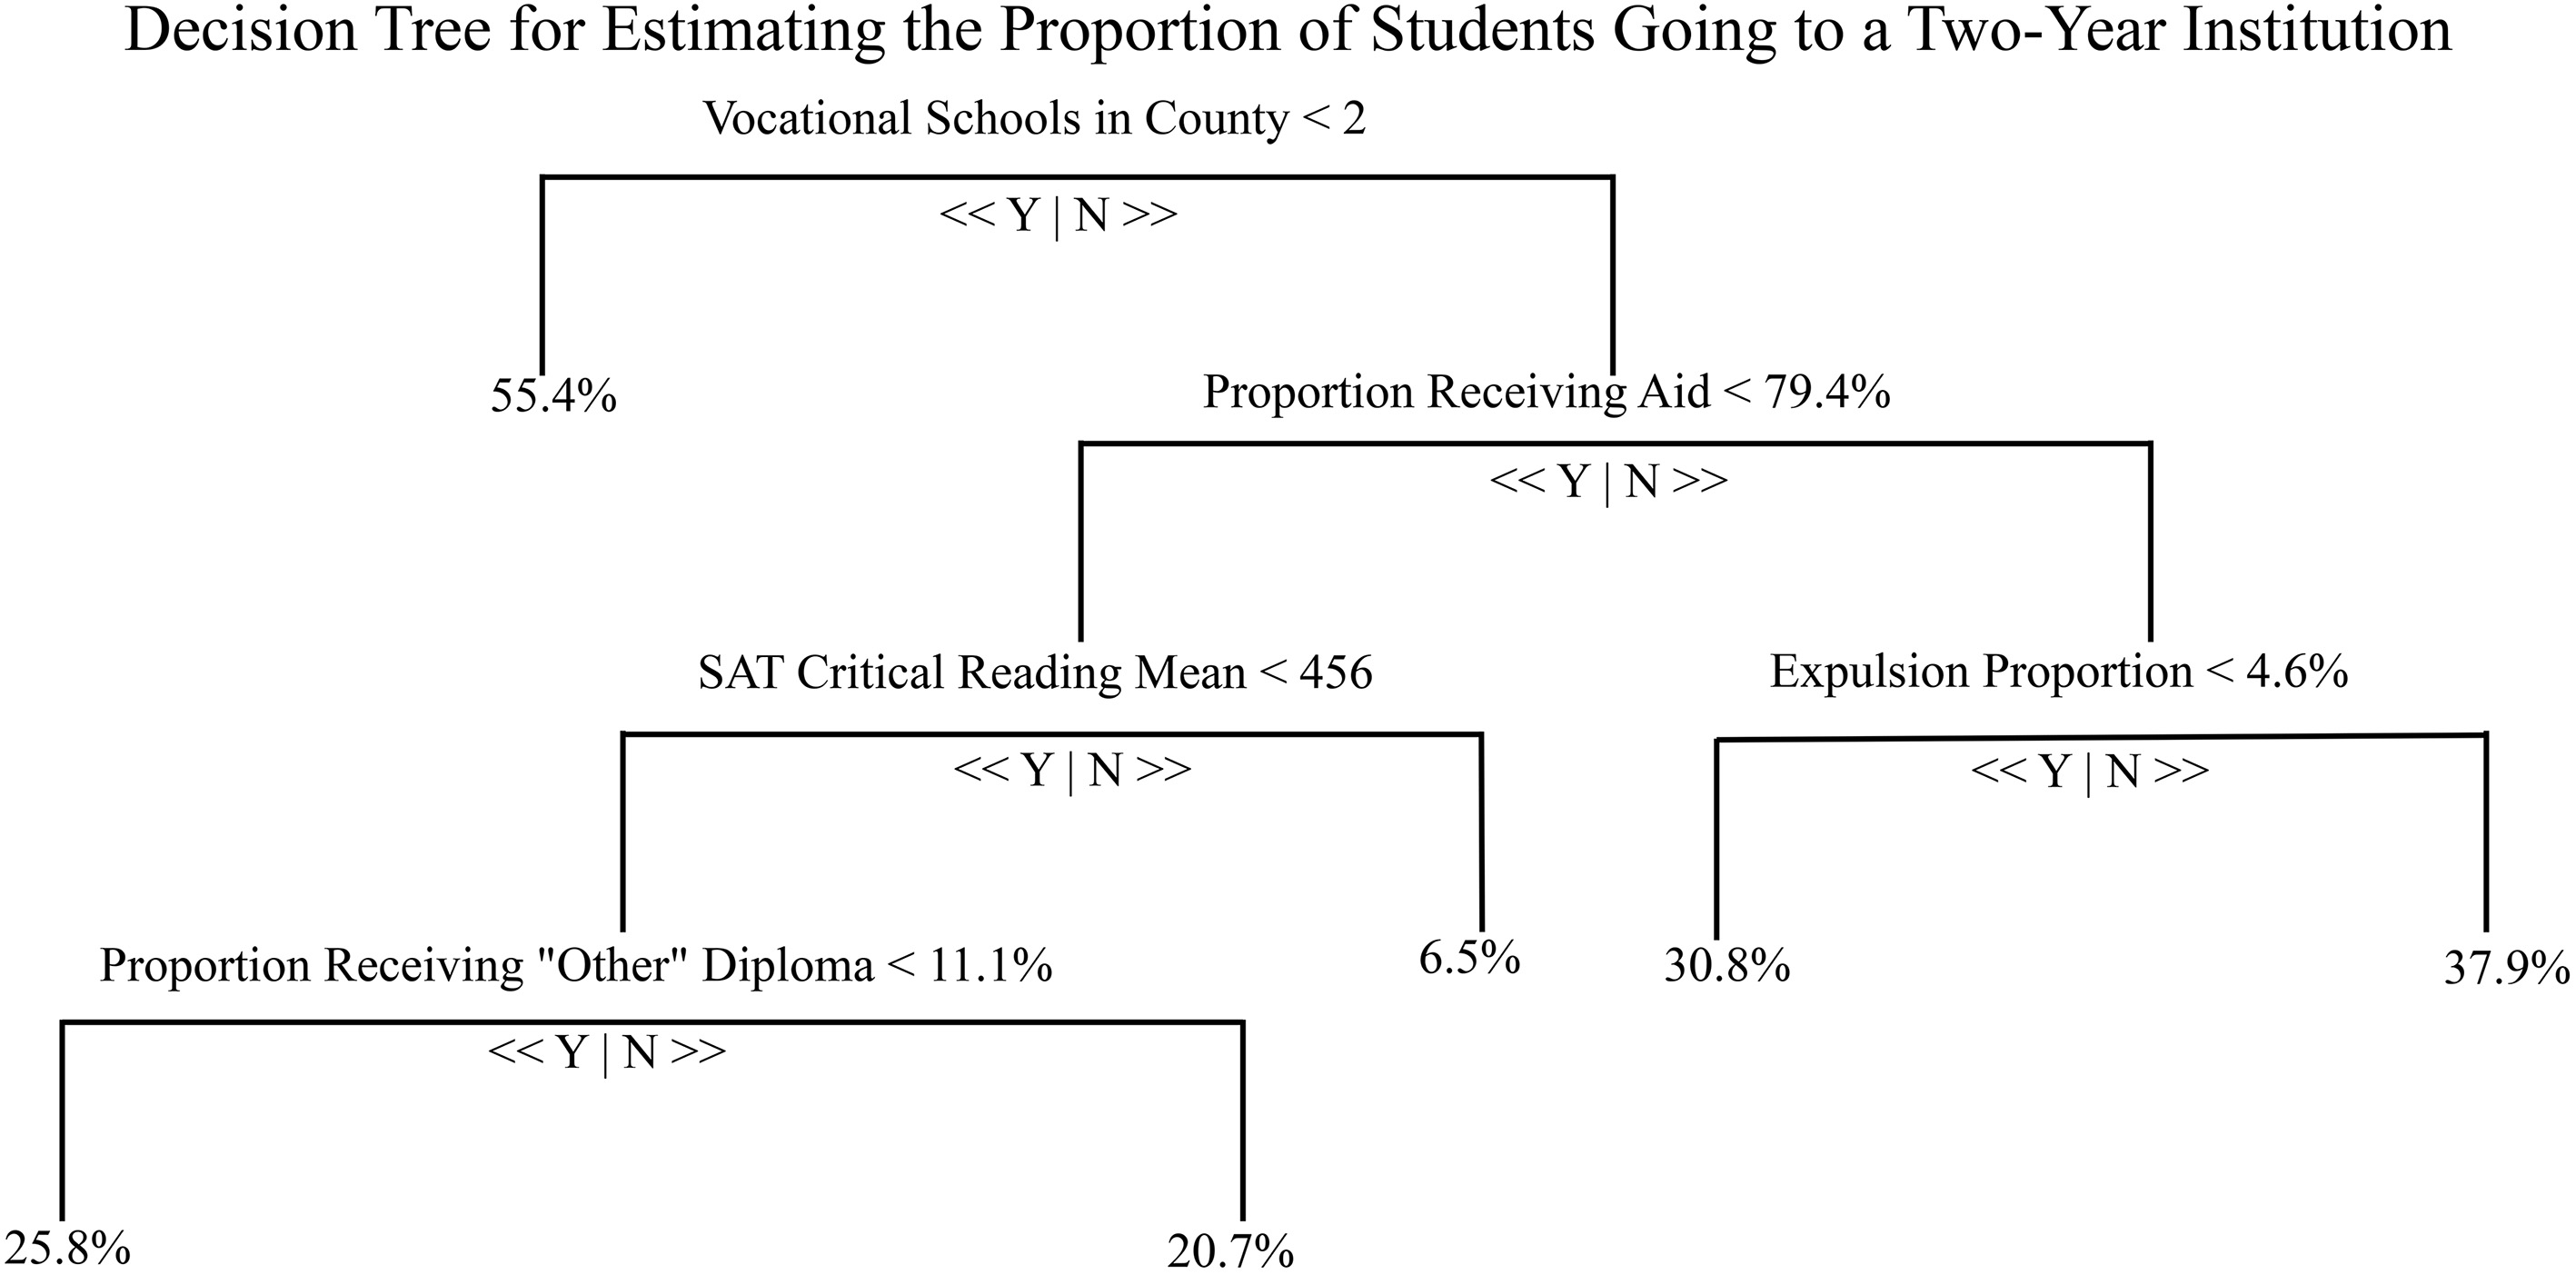
Example decision tree from the CART model. This example shows the decision tree for predicting the proportion of graduating high school students going to a two-year institution. Begin at the top node and descend the tree going either to the left or right depending on the data for a particular high school to get to the prediction for that school. Note: “Other” diploma types include modified standard diplomas, applied studies diplomas, and general achievement adult high school diplomas. Community characteristics are the socioeconomic characteristics of the high schools’ surrounding community, such as the educational attainment of the 25 and older population, the percentage of residents in poverty, and employment opportunities by educational and experience requirements. Perception of postsecondary availability is related to the geographic and financial availability of postsecondary institutions to the high school graduates in the area.
As is often the case with data-driven model building, over half of the project’s efforts went towards data discovery, development of the data model, and preparation of the data for use in the statistical analyses and modeling (discussed further in the next section) [10]. Specifically, preparing the data involved extracting, cleaning, transforming, and then linking nearly 100 files in various formats, such as Microsoft Excel, Comma Separated Values (CSV), web-scrapped websites, and JavaScript Object Notation (JSON) file formats. Prepared data were statistically aggregated to the level of the high school. Note that because we are using publicly available data for this study, access to data on individual students was not available.
We addressed several challenges with the data. Suppression of certain variables in the data limited our ability to model effects by certain sub-populations such as race and ethnicity. However, we did have complete data on other sub-populations, such as the number of students by gender and the number that were economically disadvantaged. Inconsistencies in the longitudinal availability of variables across data sources was also a challenge. For this reason, we chose to average the values available during a five-year period (2011 to 2016).
After collecting and organizing the data, our next step was to produce statistical models to predict the proportion of high school students pursuing one of a variety of postsecondary trajectories. We considered six possible options for a student to pursue: attend a four-year college, attend a two-year college, pursue other continuing education (vocational schools, etc.), join the military, enter the job market, or have no plans. For each of the six outcomes, we fit a random forest model [11] to assess the predictive power of our data, as well as to determine which features are most relevant for prediction. Each of these models used 71 total variables to predict the proportion of graduating seniors at each of our 21 high schools which went onto each of the six possible pathways. In the next sections, we describe Classification and Regression Trees (CART), the basis for random forest models, and then the random forest itself.
CART models
Regression trees are flexible yet intuitive models for capturing the relationships between predictor variables and a response. Unlike traditional linear models, CART models can discover very general patterns in data and are not restricted to pre-specified functional forms. They work by partitioning the data into subsets based on cutoff-values along the predictor variables. Then, in each resulting subset, the model fits a simple prediction for all the response values in that group. These partitioning decisions and final prediction are effectively visualized as a tree structure, hence the name of the model.
This process is illustrated in Fig. 4, which predicts the proportion of high school students attending a two-year institution. Depending on the value of the predictor variable at each node, one moves either left or right along the tree. For instance, if a school is in a county with fewer than two vocational schools, then the predicted proportion is 55.4%. If there are more than two vocational schools in the county the decision tree is more complicated. In this case, if more than 79.4% of the high school students receive aid, score lower than 456 on the SAT critical reading test, receive an “other” diploma (e.g., modified standard diplomas or applied studies diplomas intended for students who have a disability), then the predicted proportion of high school students attending a two-year institution is 25.8%.
Some things to note about this model. First, the prediction is clearly non-linear in the predictors. Since it is based on cutoffs instead of smooth relationships, it can express very general patterns. Second, the relevance of some features depends on the values of the other features. For example, if there are fewer than two vocational schools in a high school’s county, no other data are relevant to the model. This property helps to filter variables, which is particularly useful for our study since we have more predictors than observations. However, this can also produce idiosyncrasies. It is unlikely that no other feature is relevant if a high school lies in a county with fewer than two vocational schools, for instance. For these reasons, CART models by themselves were not the final tool used to predict the rates of postsecondary outcomes. Rather, we used the aggregated results of multiple CART models, a technique known as a random forest.
Random forest
A random forest is an aggregation of multiple CART models trained on different portions of the data. Each individual tree is created by drawing a random subset of the data1 and then fitting a CART model as in Section 2.2.1. The data are sampled so that about a third of schools are not used for any given random tree. Thus, we can use each tree to make out-of-sample predictions. Predicting out-of-sample is essential in this case, as using more predictor variables (71) than units of observation (21) can easily lead to over fitting. Out-of-sample techniques are robust to this effect. This model produces two outputs which are useful for model evaluation and policy development.
The first output of this model is a prediction of a given response variable for a given school. This is constructed by applying the prediction procedure described in Section 2.2.1 to each tree in the forest and then averaging all of the individual predictions. The main use of these predictions in this context is for model evaluation. Assessing the accuracy of the predictions returned by the model lets us assess the extent that predictor variables capture variation in the response variables. If the models explain that variability well, then we can be confident that we have captured the variables that determine the rates of postsecondary outcomes. This is a central goal of any feasibility study, as we do not know ahead of time what has bearing on these rates. Knowing what is important will allow us to focus effort on acquiring those data elements as we extend this project to larger sets of high schools.
The second output we used in this analysis is a measure of variable importance. Since each predictor variable is used in some but not all of the trees in the random forest, we can compare the predictive performance of the trees with and without a given variable to determine how helpful that variable is for prediction. This lets us identify the most important variables for each response variable under consideration. Exploring the variables that are associated with each postsecondary outcome is the first step towards understanding the factors that underlie those variables, which could become targets for policy interventions.
Predictors of postsecondary outcomes
Table 1 shows summary statistics for the random forest model run on each of the responses. The first column gives the mean squared error (MSE) for the out-of-sample schools, collected across each tree in the forest. Note that it is expressed as a percentage. The pseudo-
where
Summary statistics from the random forest models
MSE is the mean squared error of the predictions. The pseudo-
Variable importance plots for four-year college attendance and graduating with no plans. The plots on the left panel show the average decrease in the out-of-sample predictive mean squared error (MSE) resulting from including a given predictor in standard deviations. The plots on the right show the relationship between the values of the top three predictors and the estimated value of the response variable. Note: prop 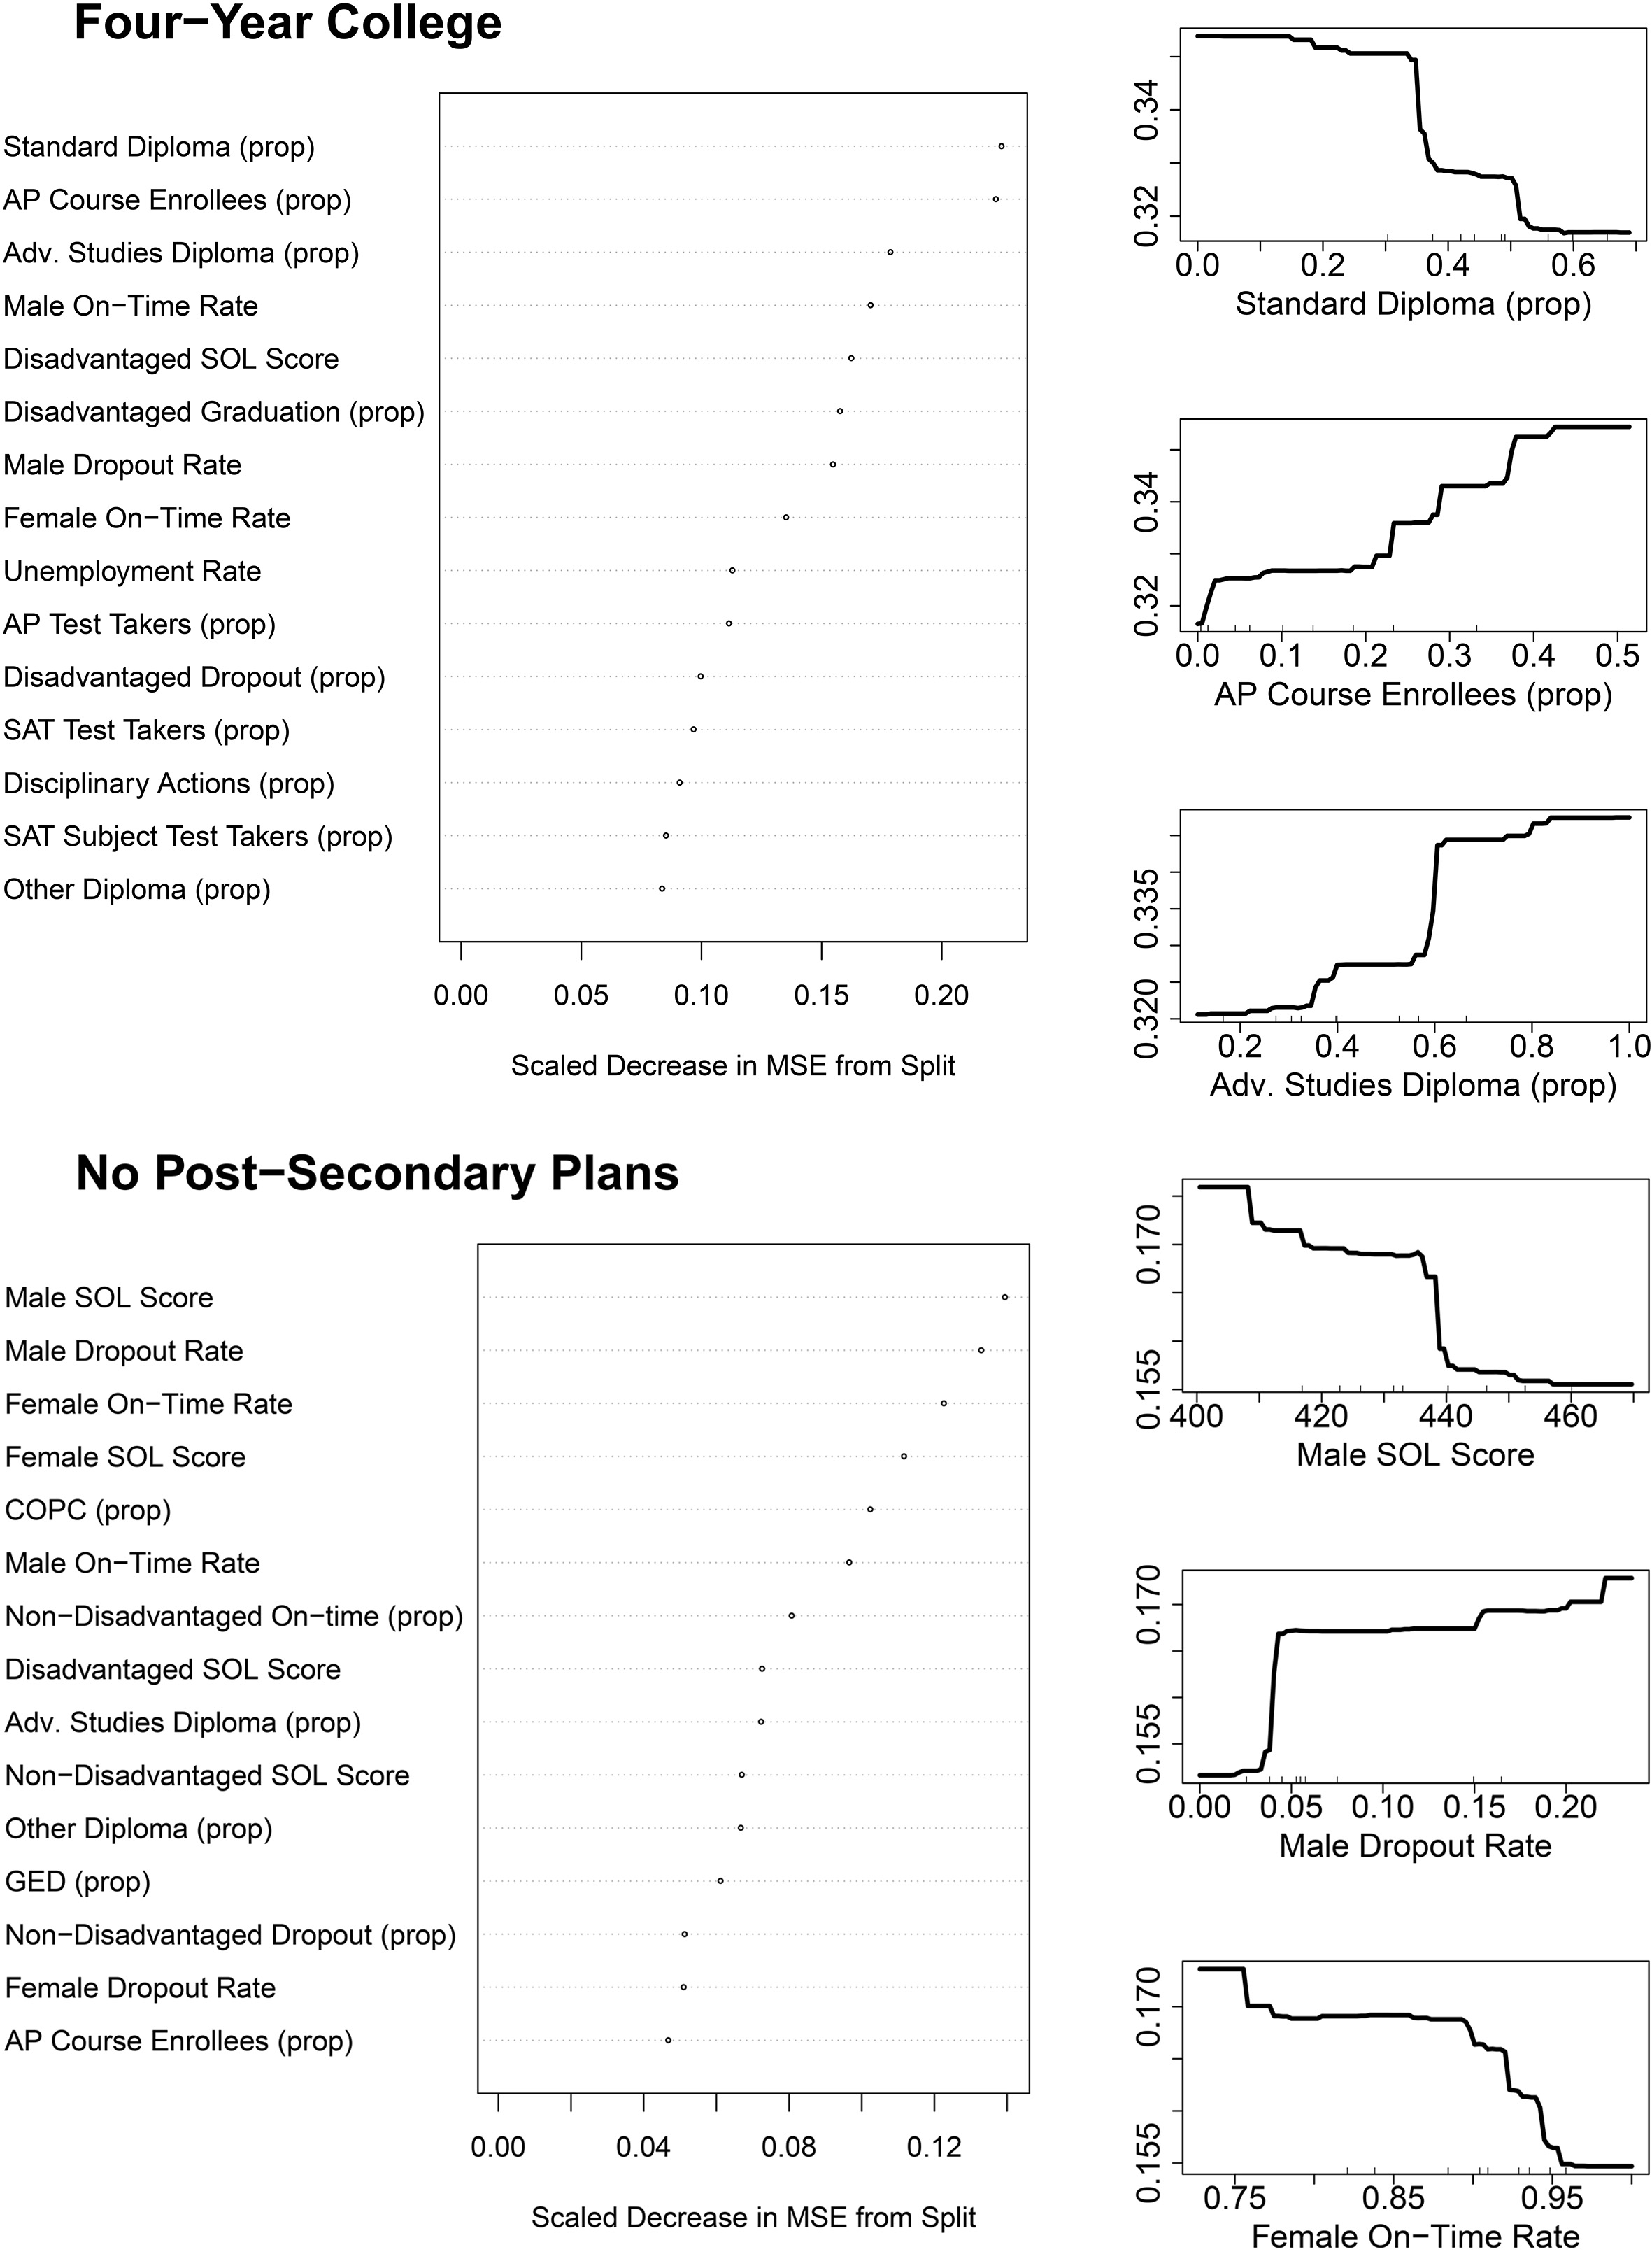
Our model most accurately captured the variability in two- and four-year college attendance rates, and also performed well predicting rates of employment and the reporting of no postsecondary plans. The model did not perform as well for other continuing education and for military service. These findings are reasonable in light of the features we collected for the study. Characteristics of the student body and the local community have bearing on all possible postsecondary outcomes, but a large portion of the variables are more specific to postsecondary educational trajectories. In particular, variables associated with postsecondary-going culture involve several measures of standardized test scores, which are much more applicable to two- and four-year college attendance than our other measures.
Figure 5 details the results of our model for four-year college attendance and for having no postsecondary plans. We assess variable importance by measuring how much, on average, using that variable in a tree decreases the error of that tree’s predictions. This measure is scaled by the standard deviation of the response under consideration. For instance, for predicting the four-year college attendance rate, using the proportion of students who get a standard diploma improves the MSE on average by 0.25 standard deviations. This measure captures the average benefit of using a particular variable, but does not describe how the predictions vary with different values of that variable. The partial dependence plots on the right panels of Fig. 5 display a more nuanced view of the relationship between a given predictor and our response variable. These plots show how the predicted value of the response changes as a function of the given variable. For example, the top right plot shows the predicted value of four-year college attendance as a function of the proportion of students acquiring a standard diploma. If a school has a low proportion of students receiving a standard diploma, the predicted four-year college rate is around 31% on average. On the other hand, if the proportions are close to one, the prediction is closer to 35% on average. This can be compared to the advanced studies diploma plot, which shows a nearly opposite pattern. While the direction of the relationship between the advanced studies proportion and four-year college going rate is not surprising, the model quantifies the extent to which changes in the proportion of advanced studies degrees varies with the proportion of students going to a four-year institution.
As discussed in Section 1, a high school with a “college-going” culture is one that encourages all students to go to college. Frameworks have been developed to help guide a high school’s assessment of their own college-going culture, including McClafferty et al. [7] and the College Board [13]. McClafferty et al.’s [7] framework in particular outlines nine principles of a college-going culture. These include clear and ongoing communication about college, access to up-to-date and comprehensive information on colleges, partnerships between the high school and colleges, and faculty involvement. These frameworks suggest looking at a number of indicators to assess a high school’s current college-going culture, including graduation rates, college application and acceptance rates, number of AP and college-level courses offered, and the promotion of college information sessions by the school’s administrators. While these frameworks provided initial guidance for our study, we wanted to be inclusive of all types of postsecondary educational outcomes (e.g., two- and four-year institutions, vocational schools, certificates) and account for the unique features of a high school’s culture that may lend itself to various postsecondary trajectories. We explored the feasibility of quantifying indicators of a high school’s “postsecondary-going” culture.
Note that as a feasibility study, this analysis is exploratory in nature. Our goal is to determine if it is possible to find indicators with narrative consistency in the subset of data we have collected. Bearing these factors in mind, we followed the procedure recommended by Nardo et al. [14] to construct our composite indicators, including first developing a theoretical foundation and performing variable selection. We then conducted a principle components analysis (PCA) on 21 postsecondary-going culture variables measured at the high school level (see, for instance, the bottom left section of Fig. 3).
The variables used in the PCA were the proportion or rates for each high school, and in the case of college tests scores, the mean. These variables can be classified into the following seven categories:
Diploma type (e.g., standard diploma, advanced study diploma). Disciplinary actions (e.g., expulsion, in-school suspension, special education interim placement). Postsecondary rate (e.g., acceptance rate into 4-year institutions). School programs (e.g., dual course enrollment, Governor’ school enrollment). Teacher credentials (e.g., teachers with graduate degrees, teachers not highly qualified). College admission tests (e.g., sophomore PSAT test takers, mean SAT writing scores, advanced placement test takers). Graduation timeliness (e.g., male on-time graduation, female on-time graduation, male dropout, female dropout).
PCA is a variable reduction technique that is conducted on the correlation or covariance matrix of a set of variables. The correlation matrix was used in this analysis. The idea is to reduce the dimensionality of interrelated variables to a few linear combinations that retain as much of the variability of the original set of variables as possible. The linear combinations are called principal components, which are similar to multiple regression equations minus the intercept term and the responses derived from the principal components are called the principal component scores.
The principal component scores for the first two principal components are displayed in Fig. 6, light blue circles identify the rural schools and mustard the urban ones. By looking at the length of the ellipse it is easy to see the first principal component accounts for a larger share of the variability than the second, 34% versus 21%. The first two standardized (mean
The high school scores for the first two principal components. The rural schools are identified with a light blue circle and the urban schools with a mustard circle; a separate ellipse encloses each group. The urban schools line up on the first principal component and the rural schools line up with the second principal component (see Fig. 7).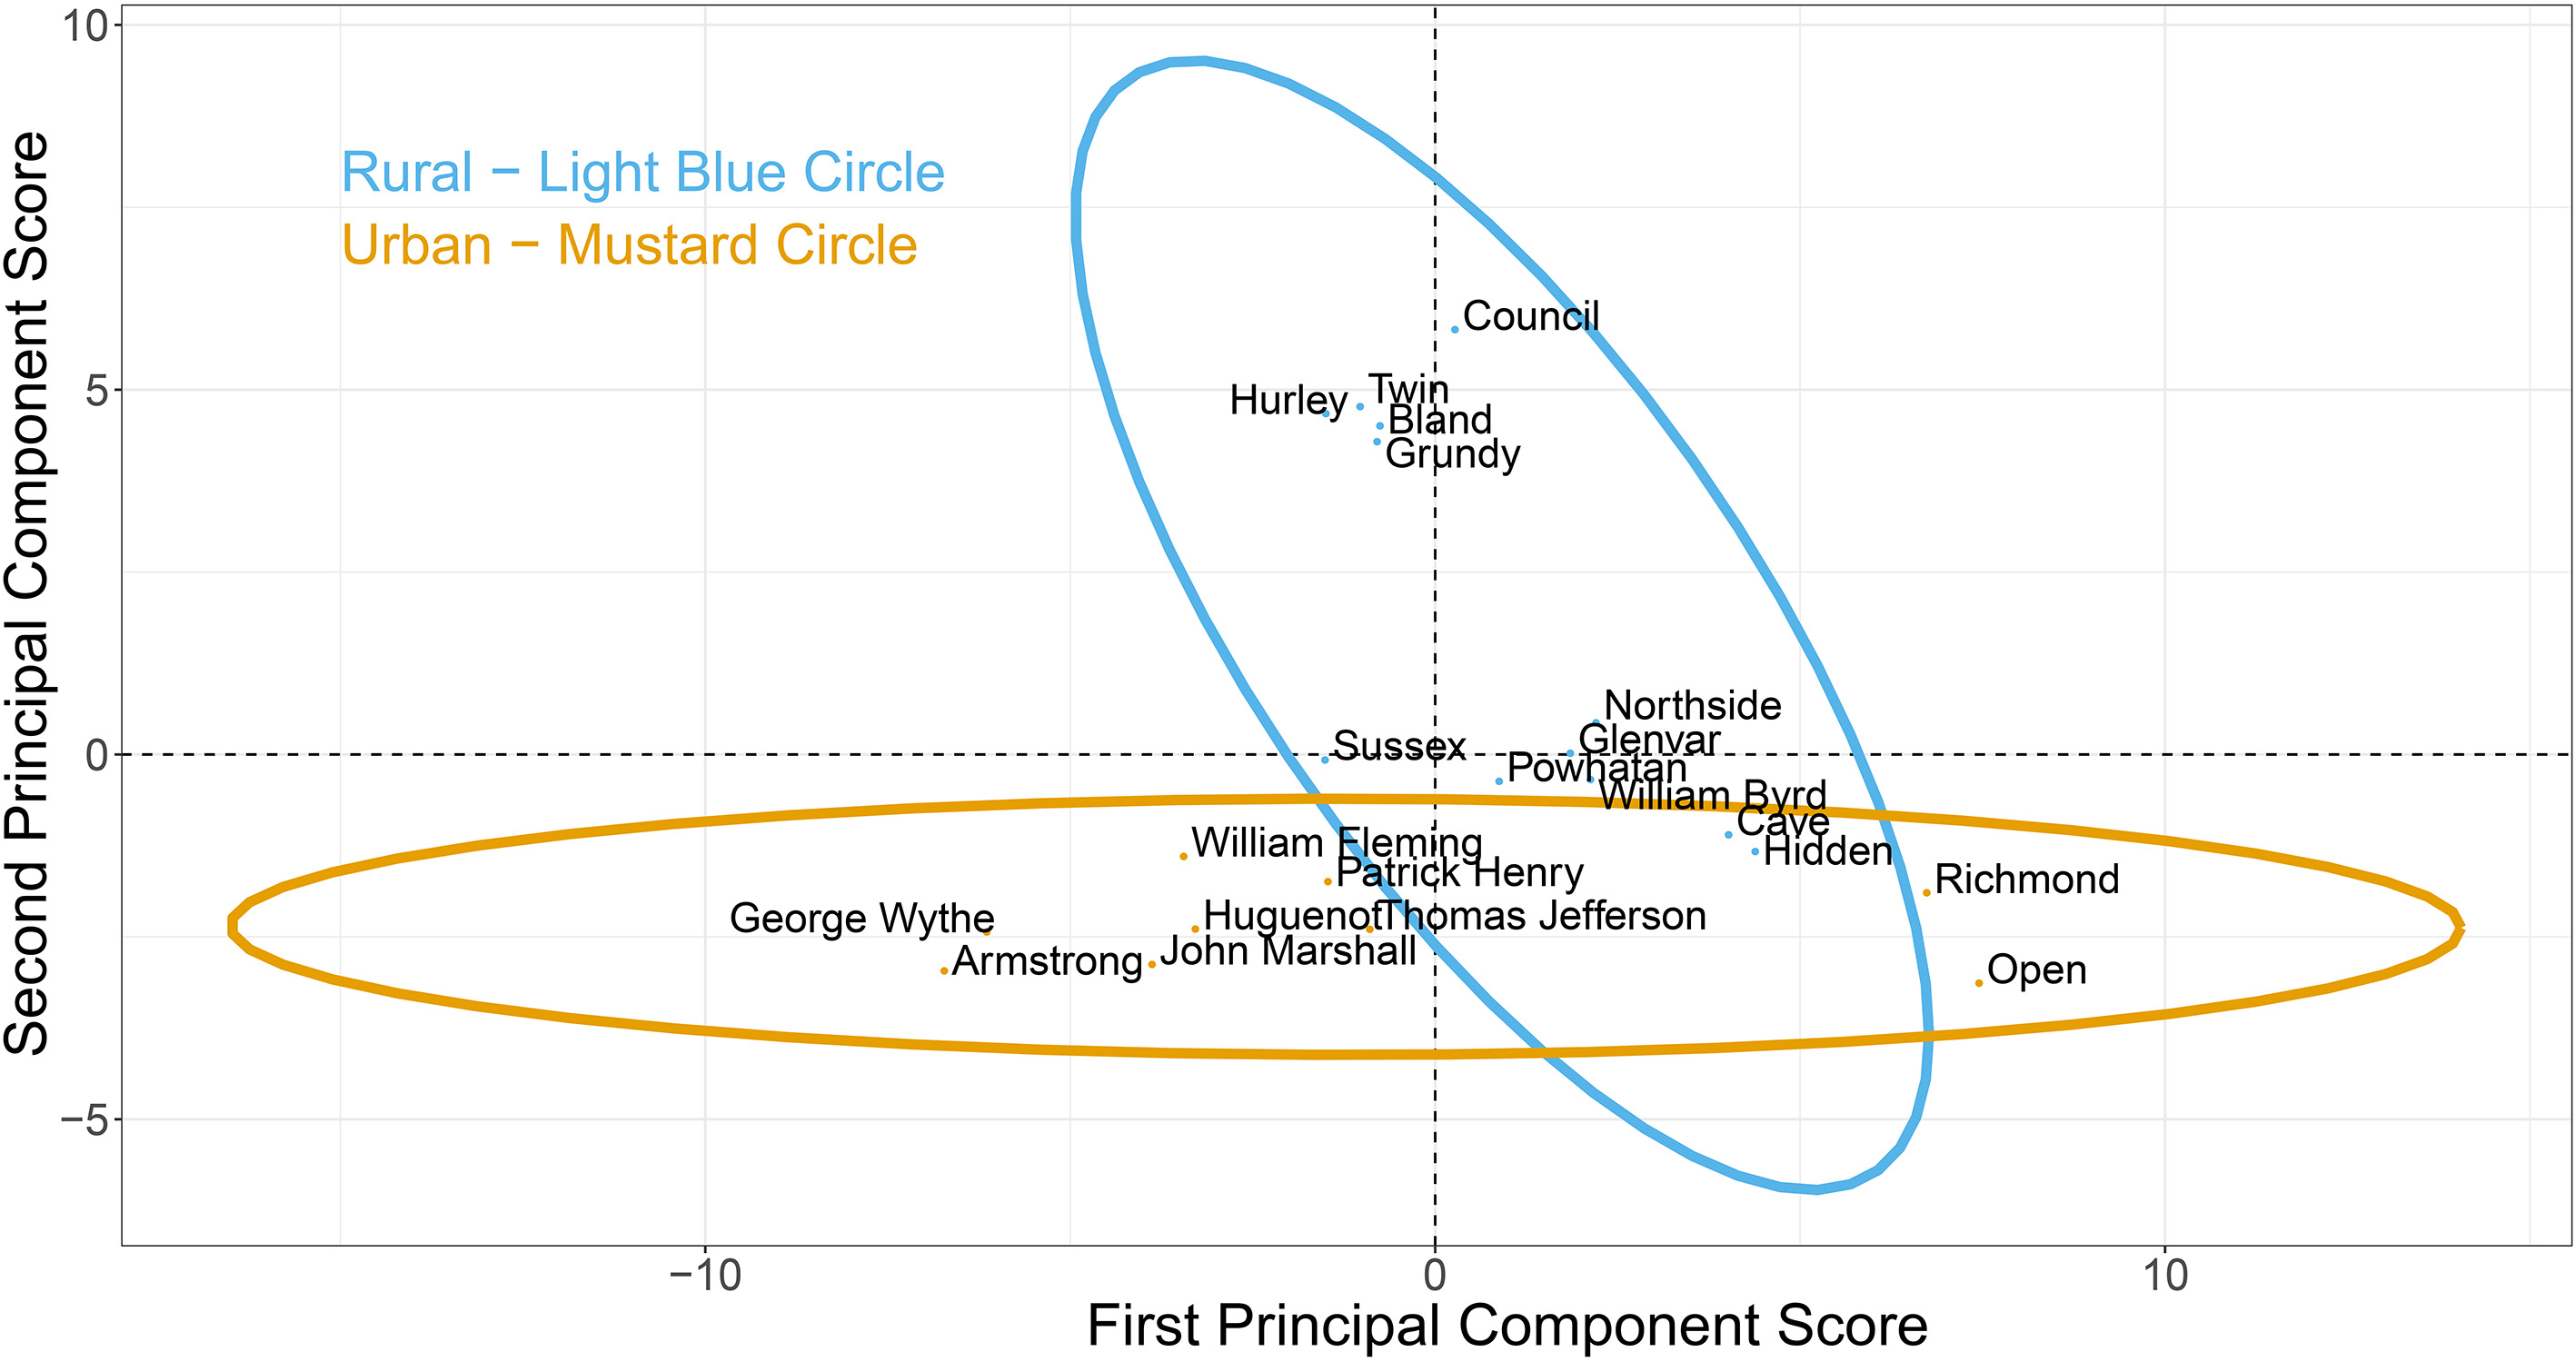
There is a striking correspondence between the principle component axes and the urban-rural classification of the schools. The first component lines up strongly with the urban schools, explaining much of the variability in them. The drivers of variability in postsecondary-going culture for these schools are on-time graduation rates (male, female, disadvantaged, and non-disadvantaged) and advanced studies diplomas on one end, and standard diplomas, other diplomas, and behaviors counterproductive to graduating on-time on the other. Counterproductive behaviors include disciplinary actions such as short-term suspension and dropping out of school (identified with negative loadings), but not modified expulsion to suspension and in-school suspensions which have positive loadings.
The first two standardized (mean 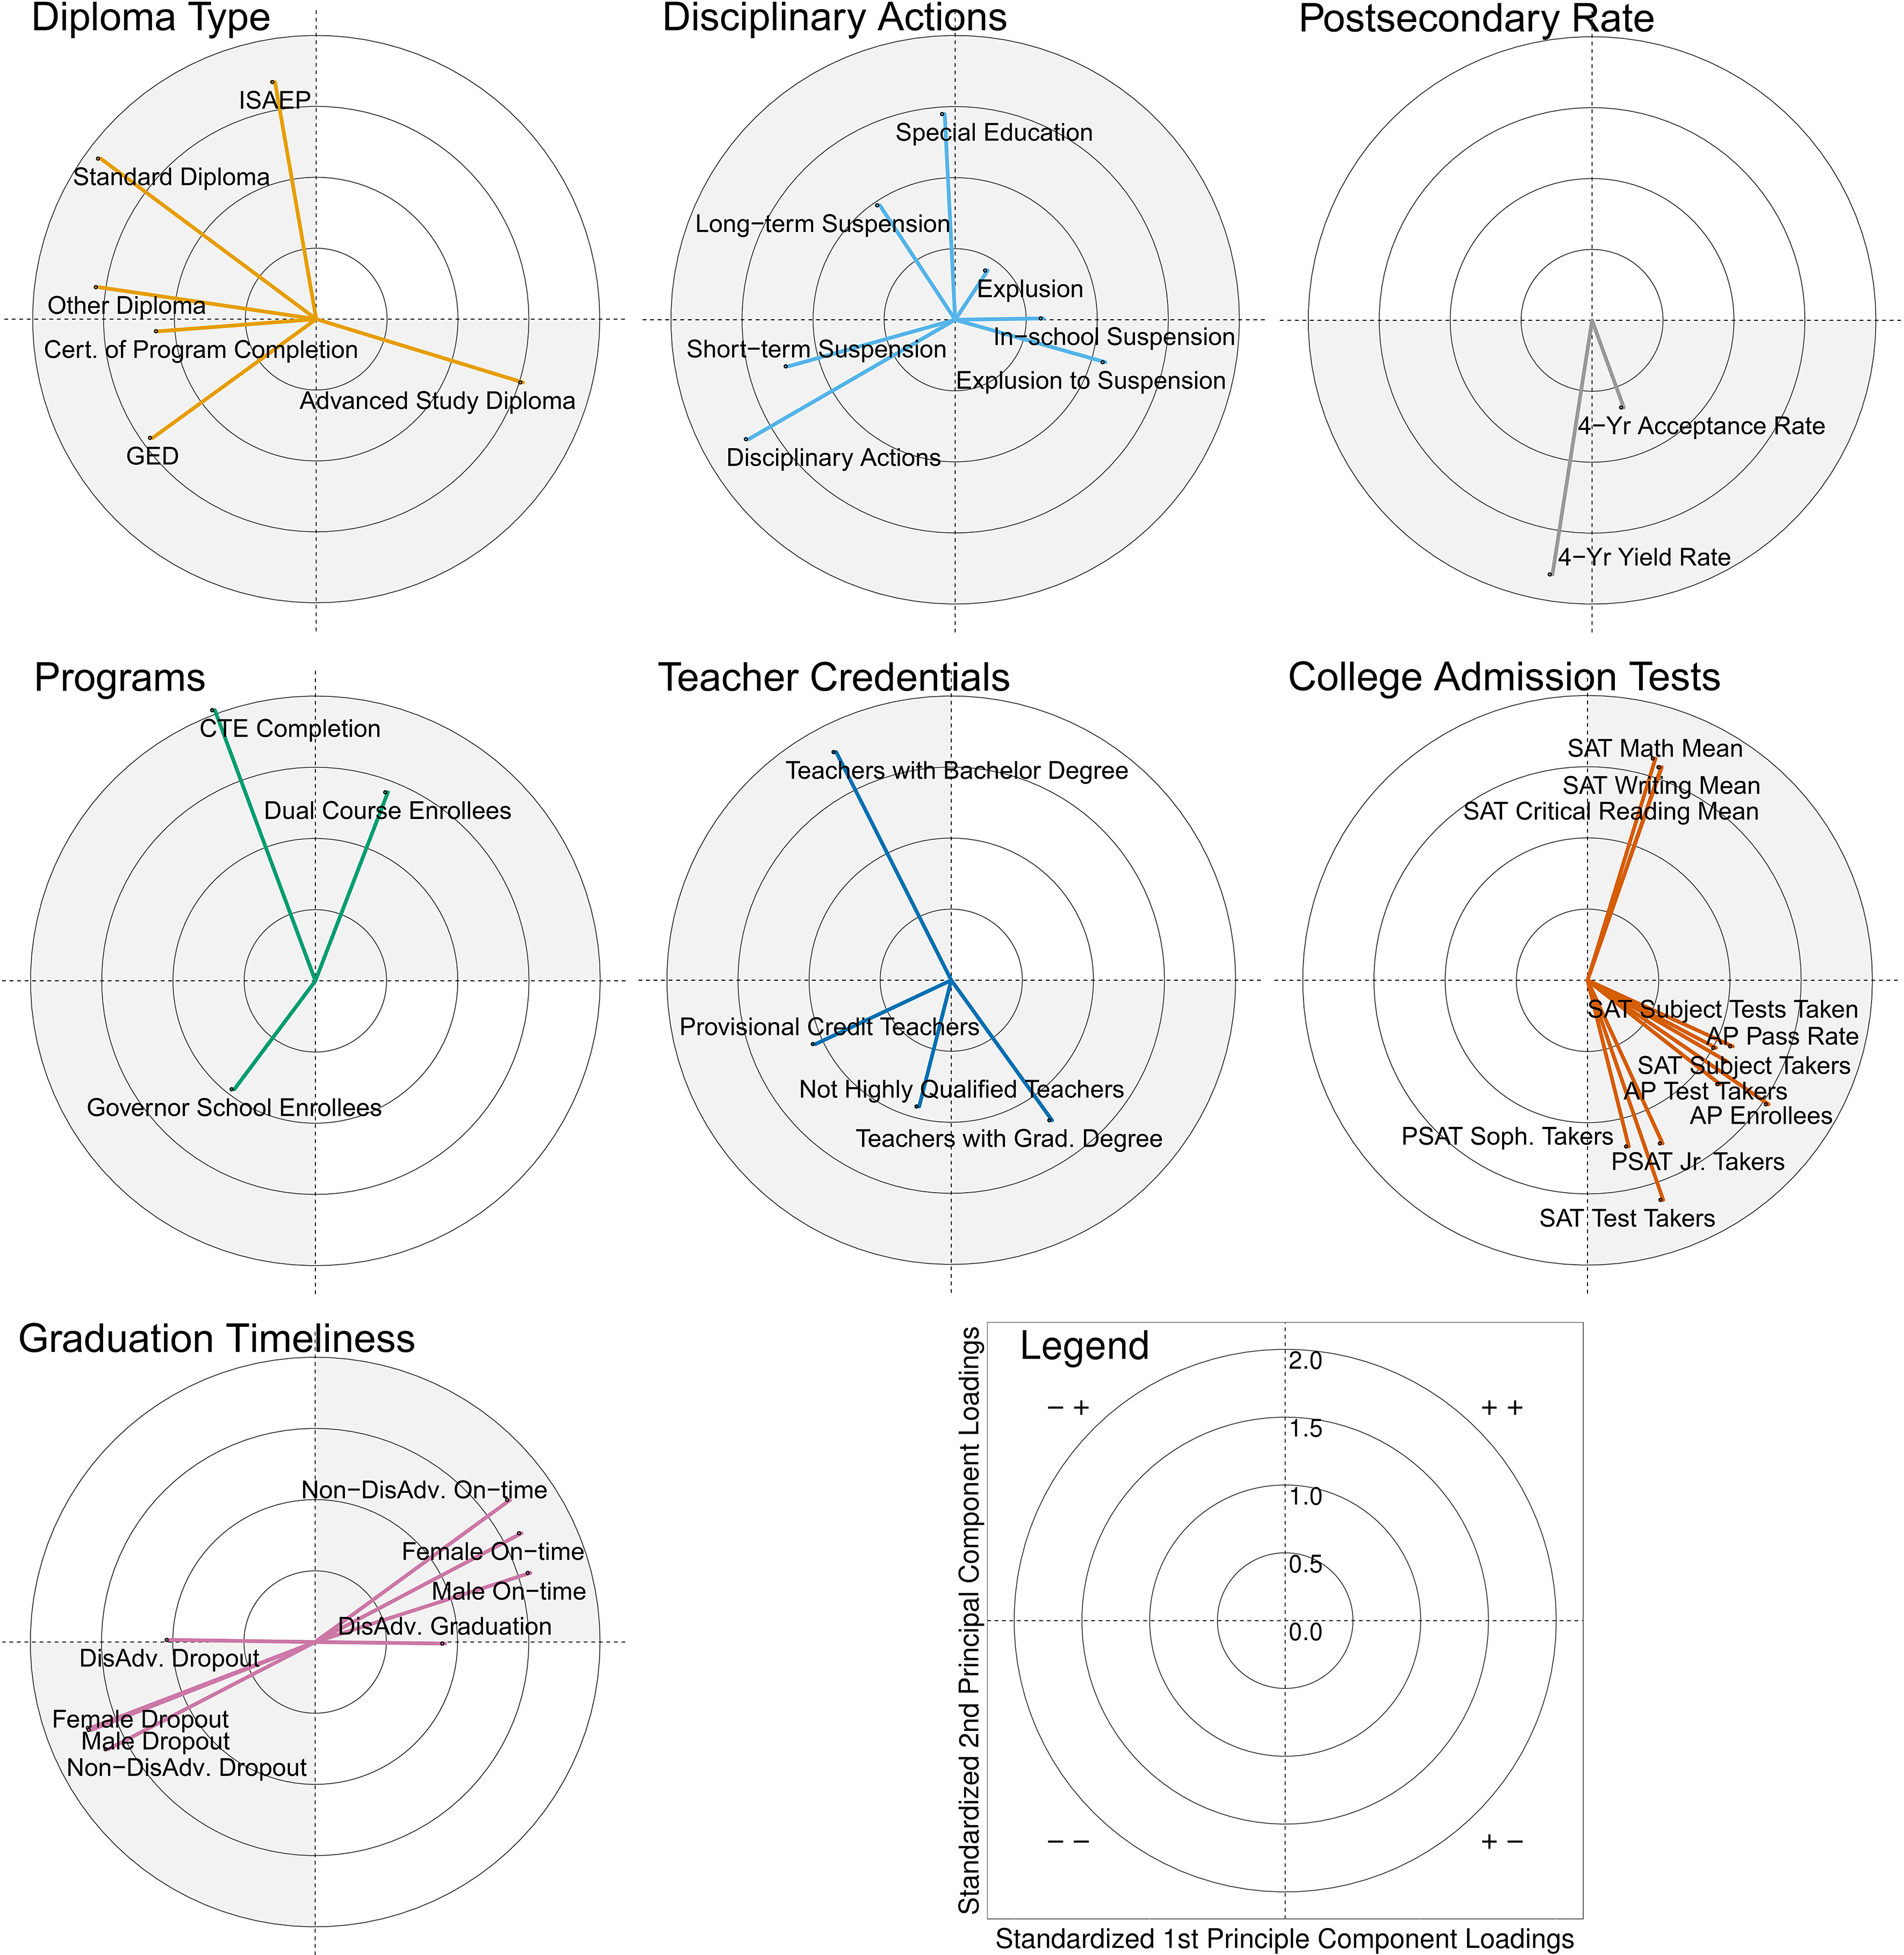
The second principle component explains very little variability in urban schools, but explains much of the variability in the rural schools. Participating in career and technical education (CTE) programs, the Individual Student Alternative Education Plan (ISAEP), dual college credit course enrollment may align with graduating with a standard or other diploma. This is in contrast to the variables with negative loadings which align with the “college-going” literature, including taking the PSATs and SATs, a large proportion of teachers with graduate degrees, and seeing peers admitted to four-year colleges. The third and fourth principal components (not displayed) account for 14% and 5%, respectively, which together with the first two account for 75% of the variability in the set of 21 variables. These preliminary results suggest that different indicators may be needed to capture variability in urban and rural schools in Virginia.
Based on this pilot, we have shown that we can use publicly available administrative, survey, and opportunity data to predict postsecondary outcomes at the high school level. In particular, administrative data from the Virginia Department of Education (e.g., enrollment counts, school report cards, superintendent reports) and the State Council of Higher Education for Virginia (e.g., locality to college flows) were critical for characterizing the high schools and for developing the statistical models. Complementing these data with surveys, such as the Department of Education’s Integrated Postsecondary Education Data System and the U.S. Census Bureau’s American Community Survey, we were able to accurately predict rates of postsecondary outcomes within our study area. For example, we were able to predict four-year college enrollment by considering diploma types acquired, advanced placement (AP) course enrollment, on-time graduation rates, and standard of learning (SOL) scores. Two-year enrollment is associated with four-year admission rate, unemployment, and CTE completion. The predictors of the likelihood to enter the workforce and graduating with no postsecondary plans were similar. Likelihood to dropout, on-time graduation rates, and low SOL scores were predictive of these two outcomes. We cannot accurately predict military enrollment and other continuing education plans. Being able to profile schools with these characteristics allows us to target interventions and the dissemination of resources.
How we define postsecondary-going culture is dependent on the postsecondary outcome (e.g., four-year college enrollment, two-year college enrollment) making it a challenge to develop one indicator that is inclusive for all outcomes. We found that influencing factors varied by student characteristics (e.g., economically disadvantaged) and high school location (urban versus rural). Moreover, strategies for postsecondary preparation vary depending on the postsecondary trajectory (e.g., two-year college vs certificate program). For instance, a postsecondary-going culture that encourages students in a rural community to go to two-year colleges may emphasize CTE programs in high school, while a culture that supports students at an urban high school enroll in four-year institutions may focus on offering AP courses and provide an emphasis on on-time graduation. We must account for the unique characteristics of the student body and the communities (e.g., workforce demands) to develop targeted strategies that encourage postsecondary enrollment.
Results from this feasibility study allowed for a better understanding within the study area of the high school characteristics most important in predicting postsecondary enrollment. These findings additionally enabled the development of initial composite indicators to measure the high schools’ postsecondary-going culture. We found that one indicator was appropriate to explain variability in urban schools and a second, orthogonal one is appropriate for rural schools. In future work, we propose to re-evaluate and scale the predictive models and the postsecondary-going culture composite indicator to all high schools across Virginia. We will also construct student-level predictive models that make targeting postsecondary communication more efficient and that supports broader postsecondary-going strategies. As part of this approach, we plan to gain researcher access to non-publicly available data of students across Virginia.
Microtargeting to guide communication strategies and to assess intervention outcomes has been operationalized in other domains through the use of “predictive scores” [15]. A combination of statistical modeling, such as classification and regression trees, literature on the subject, and domain expertise- can be used to construct and assign scores to students. For instance, it may make sense to target communication to students with low to moderate likelihood of attending postsecondary education (behavior score); high likelihood of succeeding in a postsecondary institution (readiness score); and high likelihood to respond positively to intervention (responsiveness score). The combination of a composite indicator of postsecondary-going culture with high school and student-level predictive models would provide school administrators and local and state government officials’ guidance in policy development and outcomes through a better understanding of the features of a high school and its surrounding community that are more likely to lead to postsecondary trajectories that would benefit each student.
Footnotes
Acknowledgments
This research was partially supported by the State Council of Higher Education for Virginia under contract #449696 and the U.S. National Science Foundation, National Center for Science and Engineering Statistics under a cooperative agreement #58-3AEU-7-0074 through the U.S. Department of Agriculture National Agriculture Statistical Services. We would also like to thank Daniel Chen and Kyle Morgan for their help in collecting, cleaning, and transforming the data.