






Abstract
Internet has been widely recognized as a new data source that can be used either to compile new statistics, or to enhance the traditional ones in several fields of official statistics. Considering that online commerce has a rapid growing share in the overall household’s consumption expenditures behavior broke down by distribution/transaction channel, price statistics is one of the research areas in official statistics which benefits greatly from this new data source. This paper provides a description of the Romanian National Institute of Statistics experience regarding the use of Internet as a data source and an exercise in compiling an experimental consumer price index (CPI) based on Internet data. Aim the pilot project was to investigate whether alternative data collection methods for price statistics can be introduced and enhance the statistical production system in the near future and, most important, it was a great firsthand opportunity to identify methodological challenges which are inherent to Big Data sources from the official statistics point of view. The tool chain is built on top of the traditional methodology used for CPI, enhanced by new features such as simple clustering technique for treating high volatility present in the collected data using a distance-based method for classification similar products.
Introduction
For the past 30 years, the world has witnessed a new kind of fundamental structural change, which resembles, in terms of magnitude and impact, with the Industrial Revolution, as data production and usage is actively embedded in the very fabric of society. Data pervasiveness in every human and/or non-human activity was made possible by the advent of new technologies such as the Internet and World Wide Web. This created an exponential increase in data generation, coined under the term Big Data. In 2013, at the DGINS conference in Scheveningen, The Netherlands, the European Statistical System Committee (ESSC) agreed upon the strategical importance of Big Data and set the stage for future plans on integrating Big Data into the official statistics production system [1]. ESS Task Force Big Data was created and entrusted to setup a Big Data strategy and implementation framework. Along with other partners, the Big Data Action Plan and Roadmap 1.0. was elaborated as a planning and monitoring tool, providing descriptions of the necessary steps that should be undertaken by ESS and NSI’s for an optimal response to this new challenge on short, medium and long-term [2]. The ESSnet on Big Data, the collaborative research network of ESS, was tasked with piloting research projects [3], which asses what are the necessary capabilities, such as new methodological approaches [4], new skills and new IT technologies, and also to design them. In 2017, the Romanian National Institute of Statistics started an internal project to asses the potential of data collection methods from the World Wide Web with some preliminary results being presented at the DGINS 2018 Bucharest Conference [5]. Bucharest Memorandum [6] explicitly expressed that new data sources, new IT technologies and new expertise will be at the core of Trusted Smart Statistics initiative [7, 8], an Eurostat and ESS joint effort to incorporate Big Data sources into the statistical production system at ESS level.
The incorporation of Big Data sources in the official statistical production does not aim to entirely replace the traditional methodologies, but it is rather an iterative and incremental approach in which certain components of the traditional statistical production process are enhanced by the Big Data sources inputs and the related processing algorithms [9, 10]. Alternatively, Big Data sources can contribute to the reduction of the response burden or they can be used only to study some economic or social phenomena before designing a statistical survey which are inherently expensive to pilot. Also, incorporating Big Data sources into official statistics means maintaining a net competitive advantage and relevance of the official statistics products compared to those provided by a plethora of commercial players, with reference to large corporations that are active in the field of information technology [11].
One of the main big data sources is the World Wide Web (WWW) system, which can be considered an ocean of information impossible to be neglected by official statistics institutes. In order to take advantage of the data publicly available on web sites some automatic procedures for data collection should be designed first. These procedures are referred under the term web scraping or automated data collection.
Automatic data collection of price data and its use to derive statistical indicators was pioneered by MIT [13] where the prices collected from online shops were used to build a CPI for some South-American countries. Since this first experiment, several statistical offices throughout the world started to collect data from online retailers and study how these data sets can be used for CPI calculation. We can mention here CBS Netherlands [14], ISTAT Italy [15] or Destatis Germany [16], as some of the first statistical offices in Europe that experimented the web scraping techniques for online prices, although they didn’t follow the classical Big Data approach of MIT and only monitored some prices, or tried to collect prices only for the products included in the traditional collection method. The web scraping techniques were used to collect data in other areas of statistics too, for example to improve some statistical registers [17] or for job vacancies [18]. No matter how it was used, for bulk scraping of all prices, or for only specific prices in certain areas [19] the web scraping techniques proved to be a very useful method in the hand of statisticians.
Under these circumstances, one of the objectives of our experimental project was to test the possibility of streamlining the statistical production process by lowering the overall productions costs, reduce the response burden and improve the dissemination term. Such projects, through the incorporation of modern computing technologies, could create the premises for developing a framework for testing and piloting new methodologies and technologies in a systematic and rigorous manner [20].
Our project experimented on how web scraping collection method can be used as an alternative tool for data collection in order to compute a new/experimental CPI or to improve upon the classical CPI computation [21]. We started our work by identifying and selecting online channels that have significant weights in the process of trading goods and services for household consumption. This is not an easy task given that there is no information on the volume of online transactions made by retailers who also have an online portal for transactions, an issue which is found in other projects too [22]. An example may be that retailers in the hypermarket category, although they have a physical trading correspondent with very high trading volumes, the volume of online transactions is unknown. The criteria used to select the online trading channels included in our study was to have a physical correspondent and record significant overall sales turnover at national level. At the second step in this phase, we proceeded with the task of identifying the appropriate means to implement the automated price collection process from e-commerce sites. The criteria used to identify some optimal solutions are expressed in terms of flexibility, ease of use, scalability and cost. An essential task to achieve this goal was to explore different methods/approaches and test the existing solutions.
The second objective of our project was to carry out the automatic price collection process over a relevant period: 6 months–2 years. Achieving a maturity level specific to official price statistics that are currently published, will require a much wider period of rigorous and systematic testing of the collection process and the results obtained. The resources available for running the data collection, technology adoption and skill development are critical and a continuity plan should be devised if some data sources become unavailable, legislative changes occur during this period, or the technology and skills are outdated by the evolution of the Web architecture.
The third objective of our project was to compute an elementary price index at product and groups of homogenous product level and compare it with those obtained using the traditional data collection method in order to emphasize the issues related to the difficulties of applying and/or adapting the traditional CPI methodology [23] to the new data sources. A compromise to ensure a certain degree of comparability is the use of traditional CPI methodology [24, 25] to estimate price indices, although traditional methodology may be incompatible from some points of view with the new data source.
Last, but not least, we intended to identify the legally sensitive aspects regarding the reconciliation between National Statistical Law, the European Statistics Code of Practice, other regulations in official statistics and legislation on accessing online data [26].
The paper is structured as follows. In Section 2 we present details of the data collection process, in Section 3 we provide a description of the methodological approach, in Section 4 we present our first results and Section 5 provides some conclusions on the projects results an future developments.
Data collection
Some of the official statistics offices that run similar projects have opted to outsource this component to companies specialized in collecting, processing and storing the data instead of acquiring the data directly. While this minimizes greatly the overhead cost associated with developing and maintaining a large portion of the production pipeline it inccures the risk of being dependent on an external organization out of the control of NSI. We explored several existing software solutions: Robot framework [27], Scrapy [28, 29], Apache Nutch [30], RSelenium [31] and rvest [32], in order to keep the whole production pipeline under our control. We chose these solutions based on several criteria. They should be freely available and open source, easy to maintain, to have a soft learning curve for statisticians, and to have an active technical support from a dynamic community of users. These criteria were inspired from the previous experience of other NSIs in the field of web scraping.
The statistical unit was the web site of the retailers. When designing the non-probabilistic sample (very common the big data sources) of web sites/stores, several criteria were considered:
The store/online shop should be present in the sample used for the traditional CPI; When selecting a store from the traditional CPI sample, sales turnover reported by the store was used as an auxiliary filter, sorting decreasingly by value and choosing only the top four or five store for the beginning of the project; The stores delivery system would have to cover the entire country;
When we started the project we found out that not all major players on the food, clothes and footwear market have online distribution channels. From those that have a website for e-commerce, we sampled 4 sites for food, 5 sites for clothing and 5 sites for footwear products. But there are strong market signals that in the near future we expect that all brick-and-mortar retailers will have a dedicated online distribution channel.
Table 1 provides a description of the collected variables. For each item we collected the item name, if provided, a quantitative and qualitative description of the item, current sale price, if provided, price unaffected by discounts or price per standardized quantity, name of the site from which the data was collected and date of collection. Data is stored in comma separated values files. In total, between 50,000 to 70,000 records were collected each month.
Collected variables description
Collected variables description
A summary of the methods used for automatic classification
After we evaluated several web scraping frameworks, we started our project using Robot Framework. This software solution is implemented using Javascript language with node.js library. The main advantage of this framework is that it can automatically access asynchronous and dynamic web content by simulating the interaction between a user/web browser and a web server. Automating the collection of information from dynamically generated content sites involves simulating the interaction between the user/web browser and the server through a headless browser application, in this case phantom.js. The Robot Framework solution allows user to set up a script that sends asynchronous requests to the Web server through the browser. Content of responses sent asynchronously by the server are stored, parsed, and copied to .csv files. Depending on the nature and amount of the dynamic elements in a website, a web scraping session may take between a few minutes and a few hours per online shop. Editing the script file involves the use of information available through a web developer tool, common to all major Web browser distributions (Chrome, Firefox, Edge), for identifying the item of interest from the Web page structure, as well as any scripts that can interact with that item. The address of an item in a document can be reproduced in two ways within the script file, the first being with the CSS selectors and the other with the Xpath selectors. The difference between the two modes is given by the fact that the second one can point to text content components within the element. Extracted page URLs are provided to a set of procedures that serialize navigation process on web sites. It is worth mentioning that the Robot Framework solution is highly configurable, through the introduction of Javascript specific procedures that are used by the sites, proven to be a scalable web scraping solution for the requirements of a medium sized project. The major downside of Robot Framework is that currently, from what we are aware, is not under active developement.
During the time span of the project we gradually moved the automatic procedures to the R ecosystem. The rationale behind this decision was that the whole process should make use of a single coherent framework for both data collection and processing. This way it is easier to maintain and develop further functionalities. After several weeks of trials, we identified strong advantages in favor of RSelenium solution for data collection process, and decided to implement the data collection procedure using this framework.
RSelenium is an API developed as a R package for the popular Selenium automation web browser testing framework. RSelenium provides basic methods for passing synchronous/asynchronous messages and parsing responses to and from a web browser. A net advantage of using RSelenium consists in how easy is to integrate into the R ecosystem, substantially improving the maintainability aspects of the whole process. For example, creating scripts that can access web sites/web pages in parallel [33, 34] is very easy to implement and maintain, by comparison with other web scraping solutions, saving countless hours in the data collection process. A basic work pipeline consists in allocating computational power for a parallel cluster, starting a Selenium server instance, starting multiple web browser instances, navigating and collecting data, closing the web browsers, the server and the nodes after each successful session or saving the browser state as a message in case of exception, as presented by Algorithm 2.
[!h] Algorithm for data collectionRead
Same periods for data collection from the web sites selected in the first step of our project were kept as in CPI traditional survey. Due to the unstructured nature of the extracted data, decomposition at the core components of CPI classification is required first. To address this issue, we have developed a chain of R scripts that transform the data in a way that allows flexible processing. The CPI computation steps are sequentially deployed, the data input for each stage depending on the output of previous stage, except for the first step whose input depends on raw data.
In the following paragraphs activities carried out at each stage will be described, underlying that we attempted to keep the traditional CPI methodology as much as possible intact, in order to maintain comparability. A graphical representation of the data collection and processing is shown in Fig. 1.
Data collection and processing session.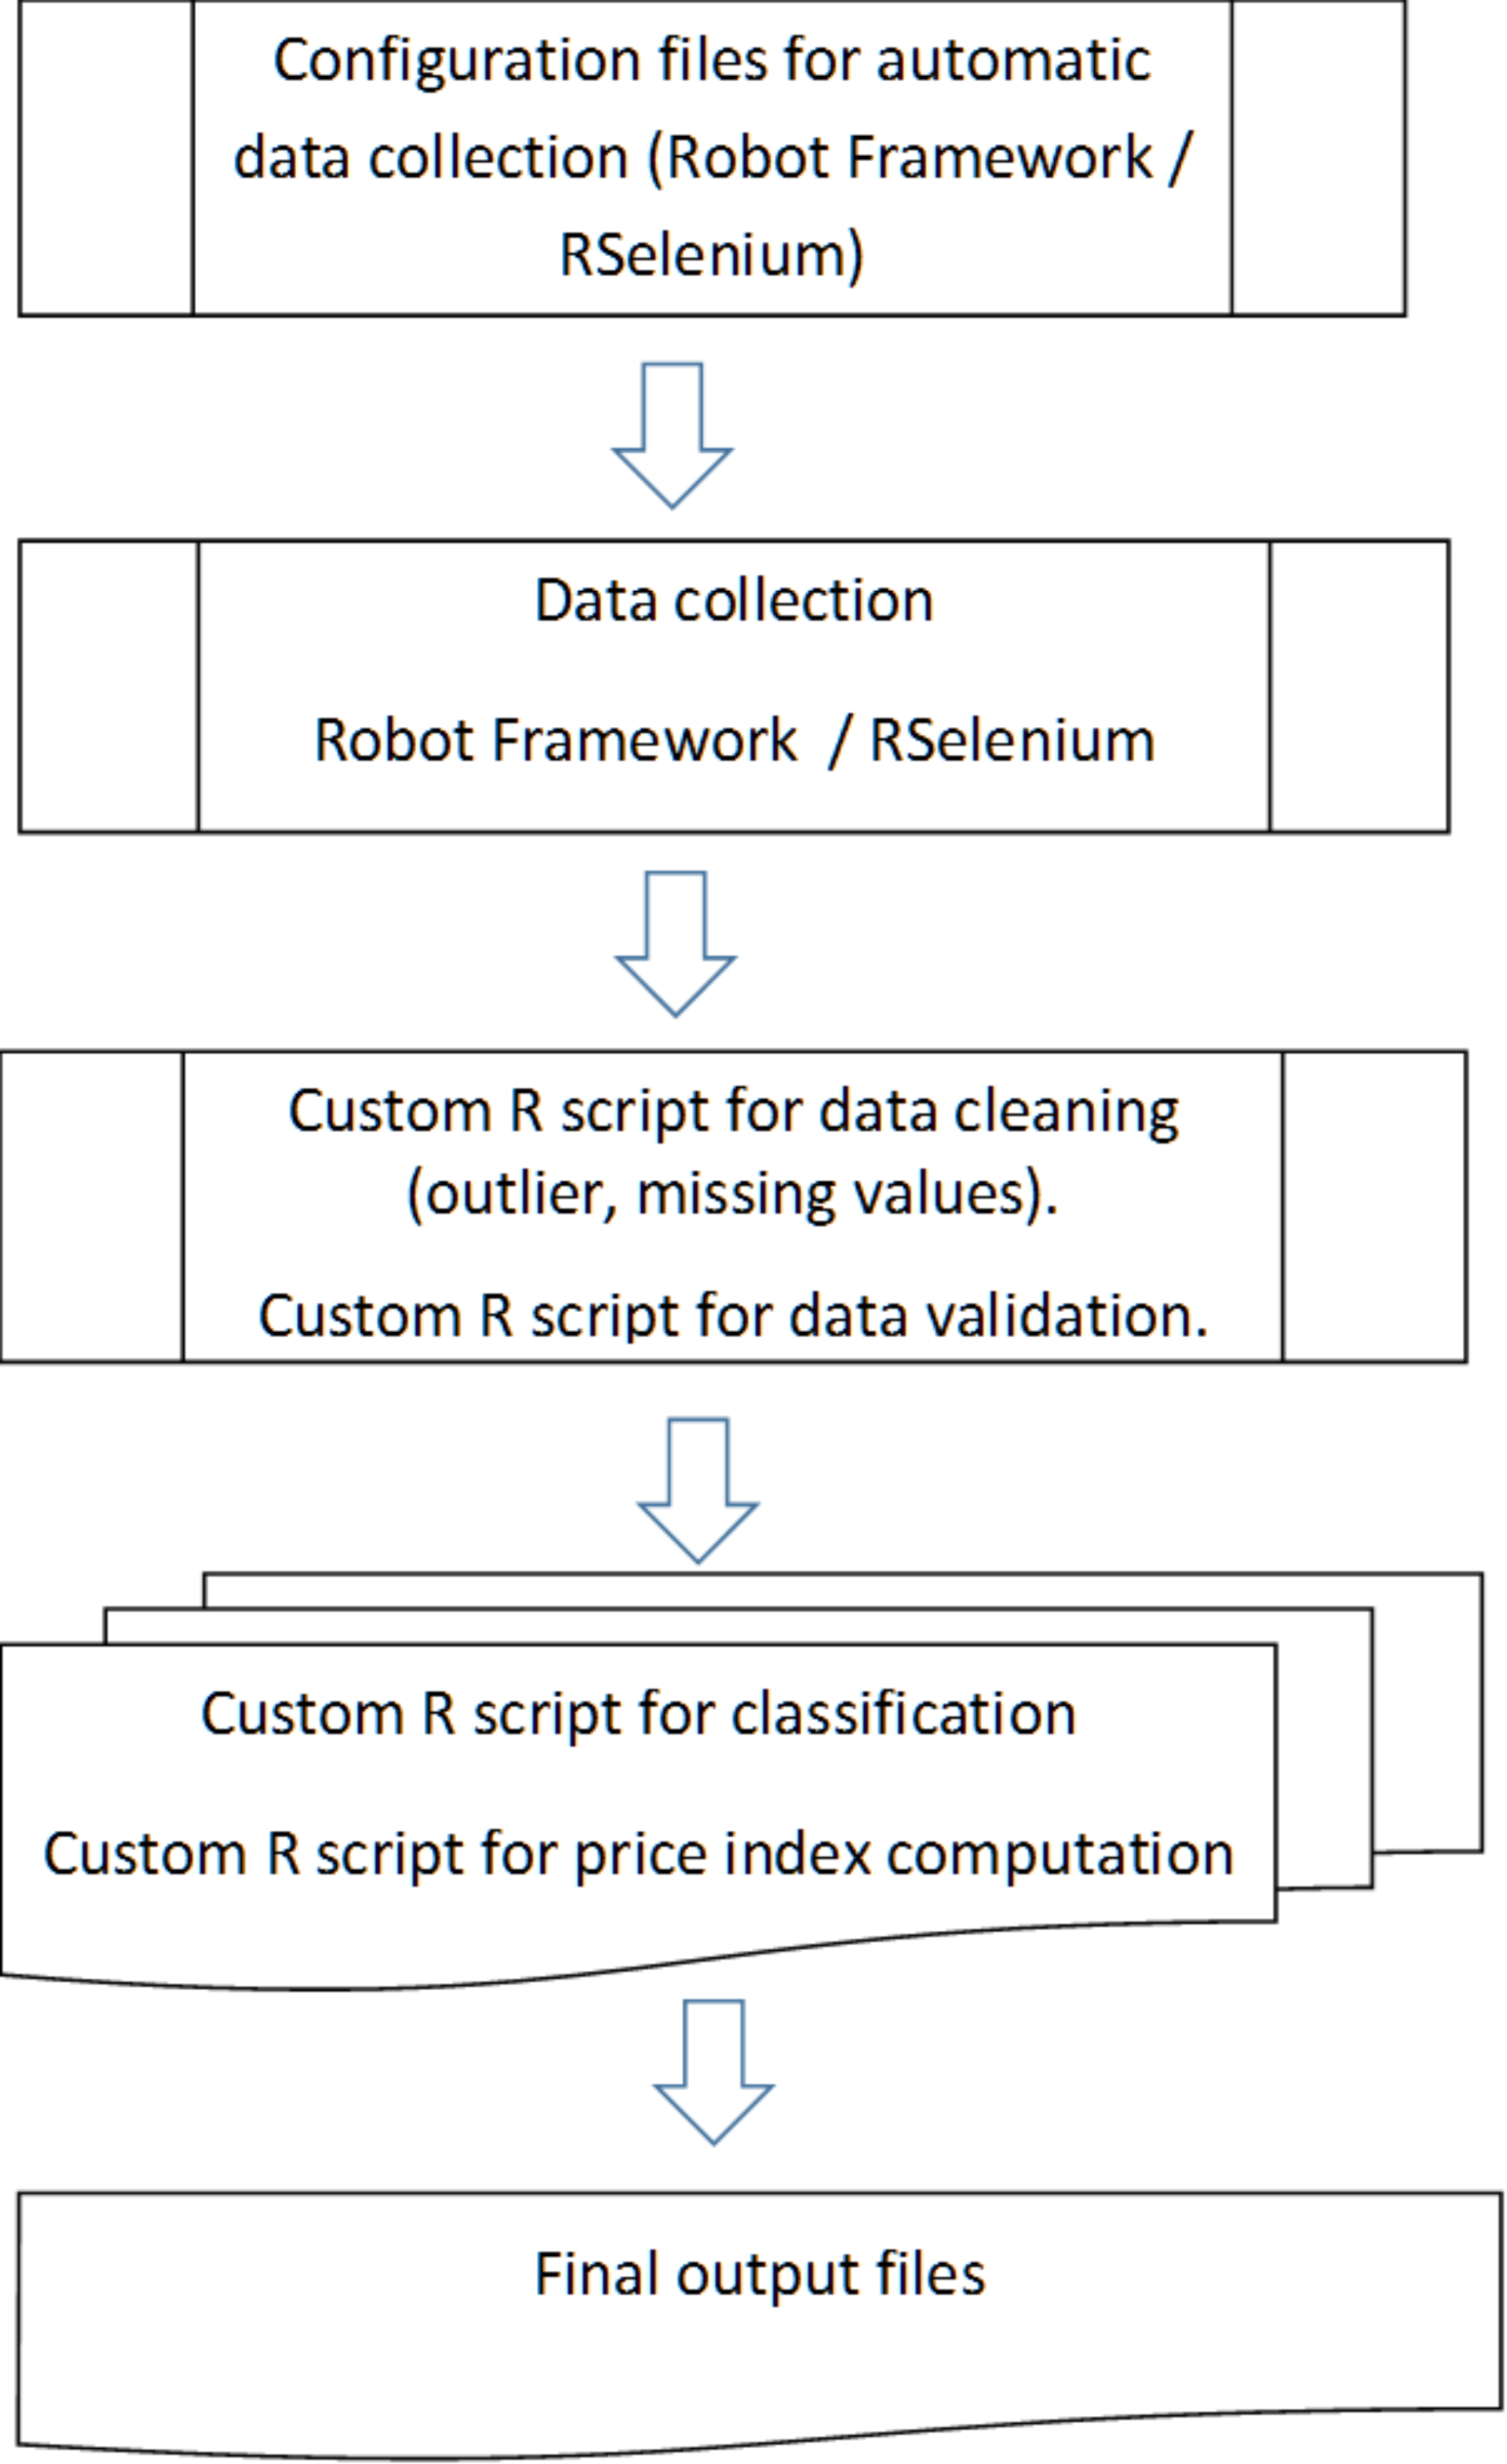
The first activity was the data cleaning. We started with the web scrapped data and performed some basic operations, checking data integrity and consistency with the CPI classification. In case there are missing items among the data sets, the web scraping process resumes, after checking the online accessibility of the site and the log files of the web scraping application. In this process we identified a set of error types that had to be checked frequently:
Periods of downtime for some websites or changes in sites structures; For some dynamically generated content of sites precautions should be taken for the data collection procedures. For example, we observed that some sites targeting the whole country show different prices depending on the geographical region of the user. This is still an open issue at the time writing this paper; The web application that supports the online distribution channel for some retailers has mechanism for robot detection and blocked our data collection procedure.
Next, all the files obtained from the data collection process for a certain month are joined based on item/retailer/collection period. The output file is fed into an R script and transformed into a data structure suitable for an automatic processing procedure. Some basic transformations are again performed using an automated R script, before classifying and linking the products according to the CPI methodology. First we performed a manual product linking and classification according to the standard CPI classification which implies identifying the items which contain a description similar to the one provided in the classical CPI classification. Being a manual user input activity it is error prone, and the propagation of the possible errors can significantly influence the quality of results. While we acknowledge that no method, either manual or automatic, is error free, we recognize that this is an inherent risk associated with new data sources for official statistics. Sensitivity and selectivity of the new data sources is a hot research area nowadays [12].
The principle that we used in the absence of a previous experience in working with methodological aspects for product selection was to assume that the consumer will choose a product or products substitutable to the one present in the standard classification within a reasonable price limit (
Therefore, we selected several items for one assortment in the same statistical unit. To reinforce the strict tracking rule of the same articles found in the standard CPI methodology, we performed join operations between the data structures for all weeks and observed months. The join operation between two or more tables was based on the “name” variable containing the product description by matching strings in a 1 to 1 ratio (perfect matching), according to the classical CPI methodology which specifies that the same product should be followed during the whole period of observation. After performing this activity, from an initial number of about 10,000 of articles, they were restricted to 545 articles, 216 assortments, and 52 expenditure groups from the public product and services list used for the classical CPI [23], identified as constant during the 6 months of observation, assuming that the description given in the observations made for the variable “name” represents a guarantor for the invariance of technical and qualitative characteristics of the targeted products.
Several attempts were made to develop an automatic classification procedure of the selected items according to the standard CPI classification. However, their use would involve deviations from the classical CPI methodological framework, manifested by the appearance and disappearance of the articles in the sample with a high frequency. We tested the most important machine learning and distance-based algorithms used in similar classification procedures. The best results, expressed as the share of correctly classified products by the automatic methods in the total sample as it can be observed in Table 2, were obtained using the Levenshtein distance. A future direction of research, that we intend to follow, is to replace the perfect matching method used for chaining the data from different periods with a non-zero distance between strings and study its influence on the final results.
A secondary objective of the project is to asses if online observed prices can be successfully used as a substitute data set for computing, either the traditional CPI or a similar experimental statistics, e.g. online observed CPI. Therefore, in order to retain, as much as possible, comparable results with the traditional CPI, the collection periods within a month, along with the goods and services included in the CPI national classification were preserved. Due to practical limitations regarding the allocated resources for this project, the data collection process was focused on food and beverages and items covering clothing and footwear categories, as these types of goods hold the biggest share in household’s consumption expenses, e.g. food accounts for nearly 40% of total expenses [35].
CPI is computed by weighted serial aggregation of elementary price indices at item, assortment, category and group level, the entire process being a combination of traditional procedures and intermediate aggregations targeted at product survivability from one period to another. After data pre-processing, i.e. testing if data is consistent with the methodological requirements, removing duplicates, matching products across different periods, the first step requires prices aggregation into an arithmetic monthly average for each item, given that data was collected 3 times per month for food and beverages and once per month for clothes and shoes.
where:
The arithmetic mean is used to calculate the elementary price indices at item level, by dividing the current monthly average for an item to it’s respective base period monthly average.
where:
To ensure that results are comparable at different periods and capture only pure price change, ideally would be to collect price data for the same products indefinitely. In the real world, this is impractical due to different reasons. Therefore, price data collectors are equipped with a list of strict rules when products or services are no longer available and substitutes are needed. These rules may target product description (producer, weight, composition, etc.), store geographical location and local/national market share, or a combination of these is used to ensure that qualitative differences between products no longer available on the market and substitutes are minimal. According to different research studies on using Big Data to compile CPI conducted inside National Statistical Offices, item survivability in sample is the most common issue in preserving comparable results across longer periods [36, 37]. To address this issue an intermediate calculation step was necessary. Based on the optimal supervised classification score, price indices for similar items were clustered into a generic price index for the same statistical unit by using a geometric mean. For example, within the same statistical unit we collected at
where:
The following steps of the computation procedure were performed roughly according to the the Romanian National Institute of Statistics CPI methodology. Taking into consideration that in order to obtain the price index at the expenditure category level (e.g. items containing white flour) we assigned a weight equal to
where:
where:
The process diagram for computing online price index.
The GSBPM diagram.
To obtain indices at group level, e.g. foods, in the last step, we used COICOP consumption weights from CPI methodology in order to aggregate category indices. The following formula was used:
where:
The re-calibration coefficient is applied to each category weight:
where:
This intermediate stage is necessary due to potential absence of certain items from sample at any given moment in time, The final formula used was:
where:
The process diagram is shown in Fig. 2, while in Fig. 3 we build a process diagram in terms of GSBPM (Generic Statistical Business Process Model) [38]. The GSPBM framework was used to attain a small, but relatively modular production pipeline, as a monitoring and integration tool and, also, as a checklist in producing some preliminary results. Starting with some basic objectives, we tried to identify critical points in the production pipeline and provide flexible definitions for a set of activities flagged as important. The workflow chain contains feedback loops between some states and the state itself, in order to build incremental improvements taking into consideration the allocated resources. Depending on future needs, the entire pipeline can be subjected to re-engineering. While we acknowledge that GSBPM was developed to provide a common language for developing and maintaining the processes and the production pipelines for classical survey data we see no reson why this model could not be applied to new data sources too [39].
We used August 2017 as the basis for calculating monthly price index, since this was the first month when started data collection process, and we obtained the aggregated indices at the groups of food, clothing and footwear displayed in Figs 4–6.
The comparative evolution of the price indices for food.
The comparative evolution of the price indices for clothes.
The comparative evolution of the price indices for footwear.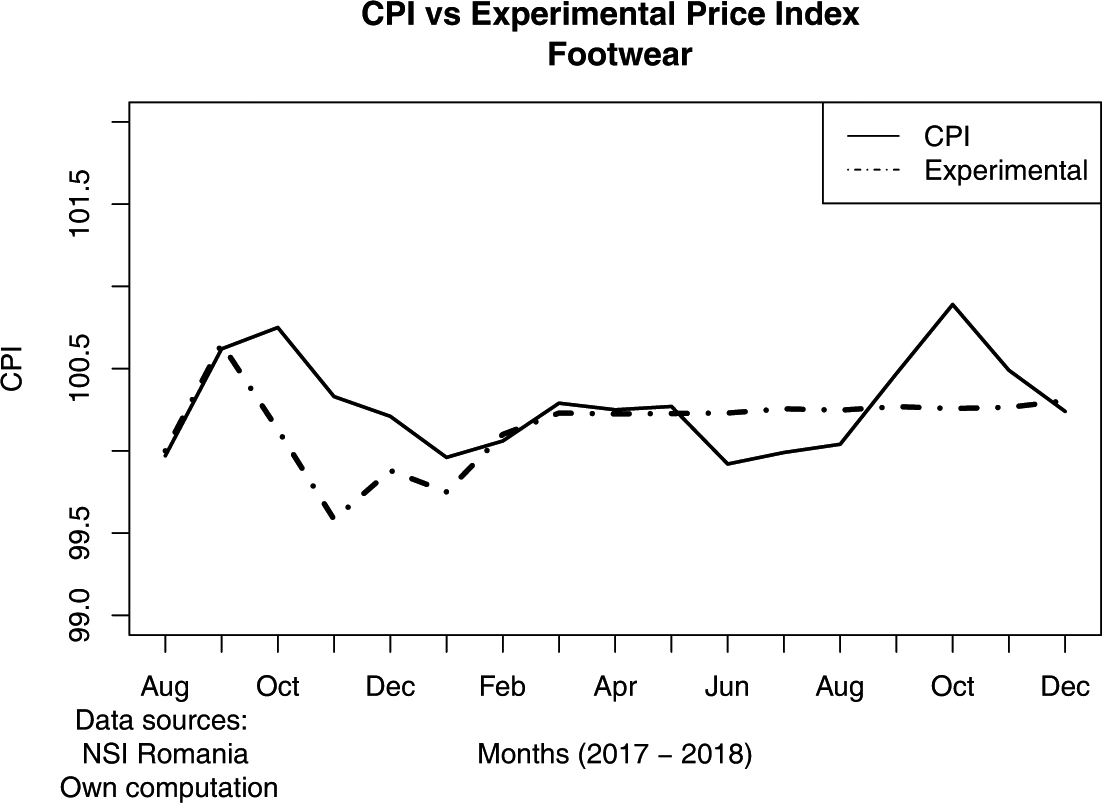
Based on the trends of the official/classical CPI and the experimental index computed using online price data, one can note that the second index has a slightly different trajectory, that can be explained based on the different samples and different weights at assortment and expenditure group level. Another plausible explanation could consist in the non-probabilistic sampling process of online ignoring the local retailers, due to the lack of specific information. Selected food, clothing and footwear retailers generally cover large and medium cities and the neighboring areas, having complex pricing policies which are different from small shops covering small city areas and rural communities.
The results obtained until now show that online prices can be used in different new ways:
Calculate a separate online price index; Introducing a new category in the classical CPI based on online prices.
The findings point that this data collection procedure can be easily extended to all categories of products and services and, moreover, data collection process can be run with much higher periodicity, for example collecting daily prices.
While there are several web scraping solutions freely available or commercial ones, our experiments have shown that a solution based on RSelenium can be an optimal choice for a statistical office because is free and open source with no hidden costs, simultaneously being highly scalable.
This project was the first experiment that implemented a web scraping technique for data collection inside Romanian National Institute of Statistics. CBS’s Robot Framework proved to be a flexible web scraping tool, providing an easy solution for developing and maintaing code just for data collection. The major drawback is that currently is no longer in public active developement which was the main reason that made us to change the data collection solution during the project and switch to RSelenium.
RSelenium, along with other packages from R ecosystem, is a very powerful and easy to use tool, greatly enhancing the flexibility through use of a single programming language for the whole workflow pipeline. While we gained experience with the software tools, we also identified some limitations for our specific study of online price collection which are briefly described below:
The share of online transactions may be small. The number of households that use online channels is relatively small, and they depends on several socio-economic factors such as income level, education level, geographic position etc. The IT technology can have an impact on price levels. Sophisticated algorithms run behind web servers which can track user’s activity and other types of variables, e.g. prices run by the competition, and dynamically adjust price levels accordingly. Although, this may be out of the scope of the current research. Not all retailers with a significant sales volume are included in the list of observation units for traditional CPI have an online distribution channel; The weights used at the expenditure groups in the classical CPI do not entirely capture the consumption patterns of the population segment addresed by online stores.
Based on the results obtained and the potential of the web scraping collection method, we intend to implement this data collection method other official statistics areas and we will continue to develop a specific/experimental online consumer price index [13], by extending the current collection procedures to the entire range of products and services and by developing a new methodology based on the characteristics of the collected data. Secondly, a separate product and service classification may be developed specifically for online data based on measurements, such as the longevity of certain products and services in the online offer, and a series of metadata related to those products and services, for example, analysis of online interaction based on buyers reviews with the respective brands and the online store.
Our experience with this project showed that a careful planification should always take into account the changing nature of the data source, the web sites being in a continuous transformation which requires a continuous monitorization. Another lesson learned from this project is that the new data sources shouldn’t be seen as a replacement for the traditional data sources, but as a support for enhancing traditional statistics or producing new, innovative indicators. The costs of such a project were kept at a minimal value, provided that the statisticians were opened to learn new technologies.
From a strictly technical perspective, the tools used should be carefully selected based on several criteria, such as: minimal financial costs – for web scraping and data processing/analysis, free and open source software is a viable alternative, the tool should provide the mechanism to implement easily reproducible procedures – portability, literate programming, and a sufficiently large and vibrant community – lean learning curve based on a rich documentation addressing different learning stages, easy to find and understand tutorials and flexible ways to ask for help from the community.
A key insight seen as a negative lesson during this project was that it should be defined from the very beginning of the project a clear criterion to set an equilibrium between the quantity of the data extracted and the quality and usefulness of these data. While one could be tempted to scrape a lot of data, being very easy to add a new script to the collection procedures, a large share of the total data collected could be of less value for the main purpose of the project. Due to the unstructured nature of these data and the frequent changes in the web sites an important processing effort is required to deal with Big Data, but the added value to the final result is not so important and difficult to explain to a general public.