






Abstract
The way we eat and what we eat, the way we move and the way we sleep significantly impact the risk of becoming obese. These aspects of behavior decompose into several personal behavioral elements including our food choices, eating place preferences, transportation choices, sleeping periods and duration etc. Most of these elements are highly correlated in a causal way with the conditions of our local urban, social, regulatory and economic environment. To this end, the H2020 project “BigO: Big Data Against Childhood Obesity” (
Introduction
Obesity is highly prevalent among children and adolescents in Europe, with a particularly high rate in children of families with low socioeconomic status [1]. On average, obesity affects one in every three children aged six to nine years in Europe [2], with no other chronic disease reaching such high prevalence in the school-aged population. Children who are obese are more likely to stay obese into adulthood, which puts them at increased risk for non-communicable diseases (NCDs), such as type-2 diabetes and cardiovascular disease. This fact, combined with the slow but continuous increase in the obesity prevalence in the last forty years [3] jeopardizes the sustainability of our healthcare systems.
The World Health Organization’s (WHO) Commission on Ending Childhood Obesity has recently released a comprehensive report [4] outlining a high-level set of recommendations to tackle the childhood obesity epidemic, grouped into 6 broad categories: (i) promoting healthy foods, (ii) promoting physical activity (PA), (iii) preconception and pregnancy care, (iv) early childhood, (v) school-aged children, and (vi) weight management for overweight and obese children. Cross-cutting through all recommendations is the need for “robust monitoring and accountability systems”, which “are vital in providing data for policy development and in offering evidence of the impact and effectiveness of interventions.” Furthermore, the report recognizes that successful measures should address the entire obesogenic environment. There are several difficulties towards implementing these recommendations. Individuals and their behavioral choices are situated within and influenced by their broader social and environmental context [5], which consists of a complex array of local external factors [6], like community, demographic and socioeconomic characteristics. Measures that combine multiple strategies that modify the obesogenic environment may improve the dietary and sleeping habits, increase physical activity and reduce sedentary behaviors. Such interventions can be successful [7], if they are evidence-based and context-specific [8].
Smartphones, portable or wearable sensors, open data and Internet of Things technologies can act as an enabler for objectively measuring the information required to study the obesogenic behaviors of the population in relation to their local environment, and to effectively design appropriate policies. Although the use of sensors on mobile phones and wearables is now common for lifestyle and sports applications, using them for developing evidence-based policies against childhood obesity is not straightforward. Issues to be resolved include unobtrusive data collection, protection of the privacy and anonymity of participants, selection of variables to be calculated, data aggregation as well as data quality.
In this paper we present an overview of the data acquisition and aggregation methodology that is currently being developed in the BigO project [9] (12/2016 – 12/2020). The proposed methodology aims to address the above issues and provide practical solutions for extracting statistical evidence from big data collected from multiple heterogeneous data sources in an uncontrolled manner.
BigO’s layers of information.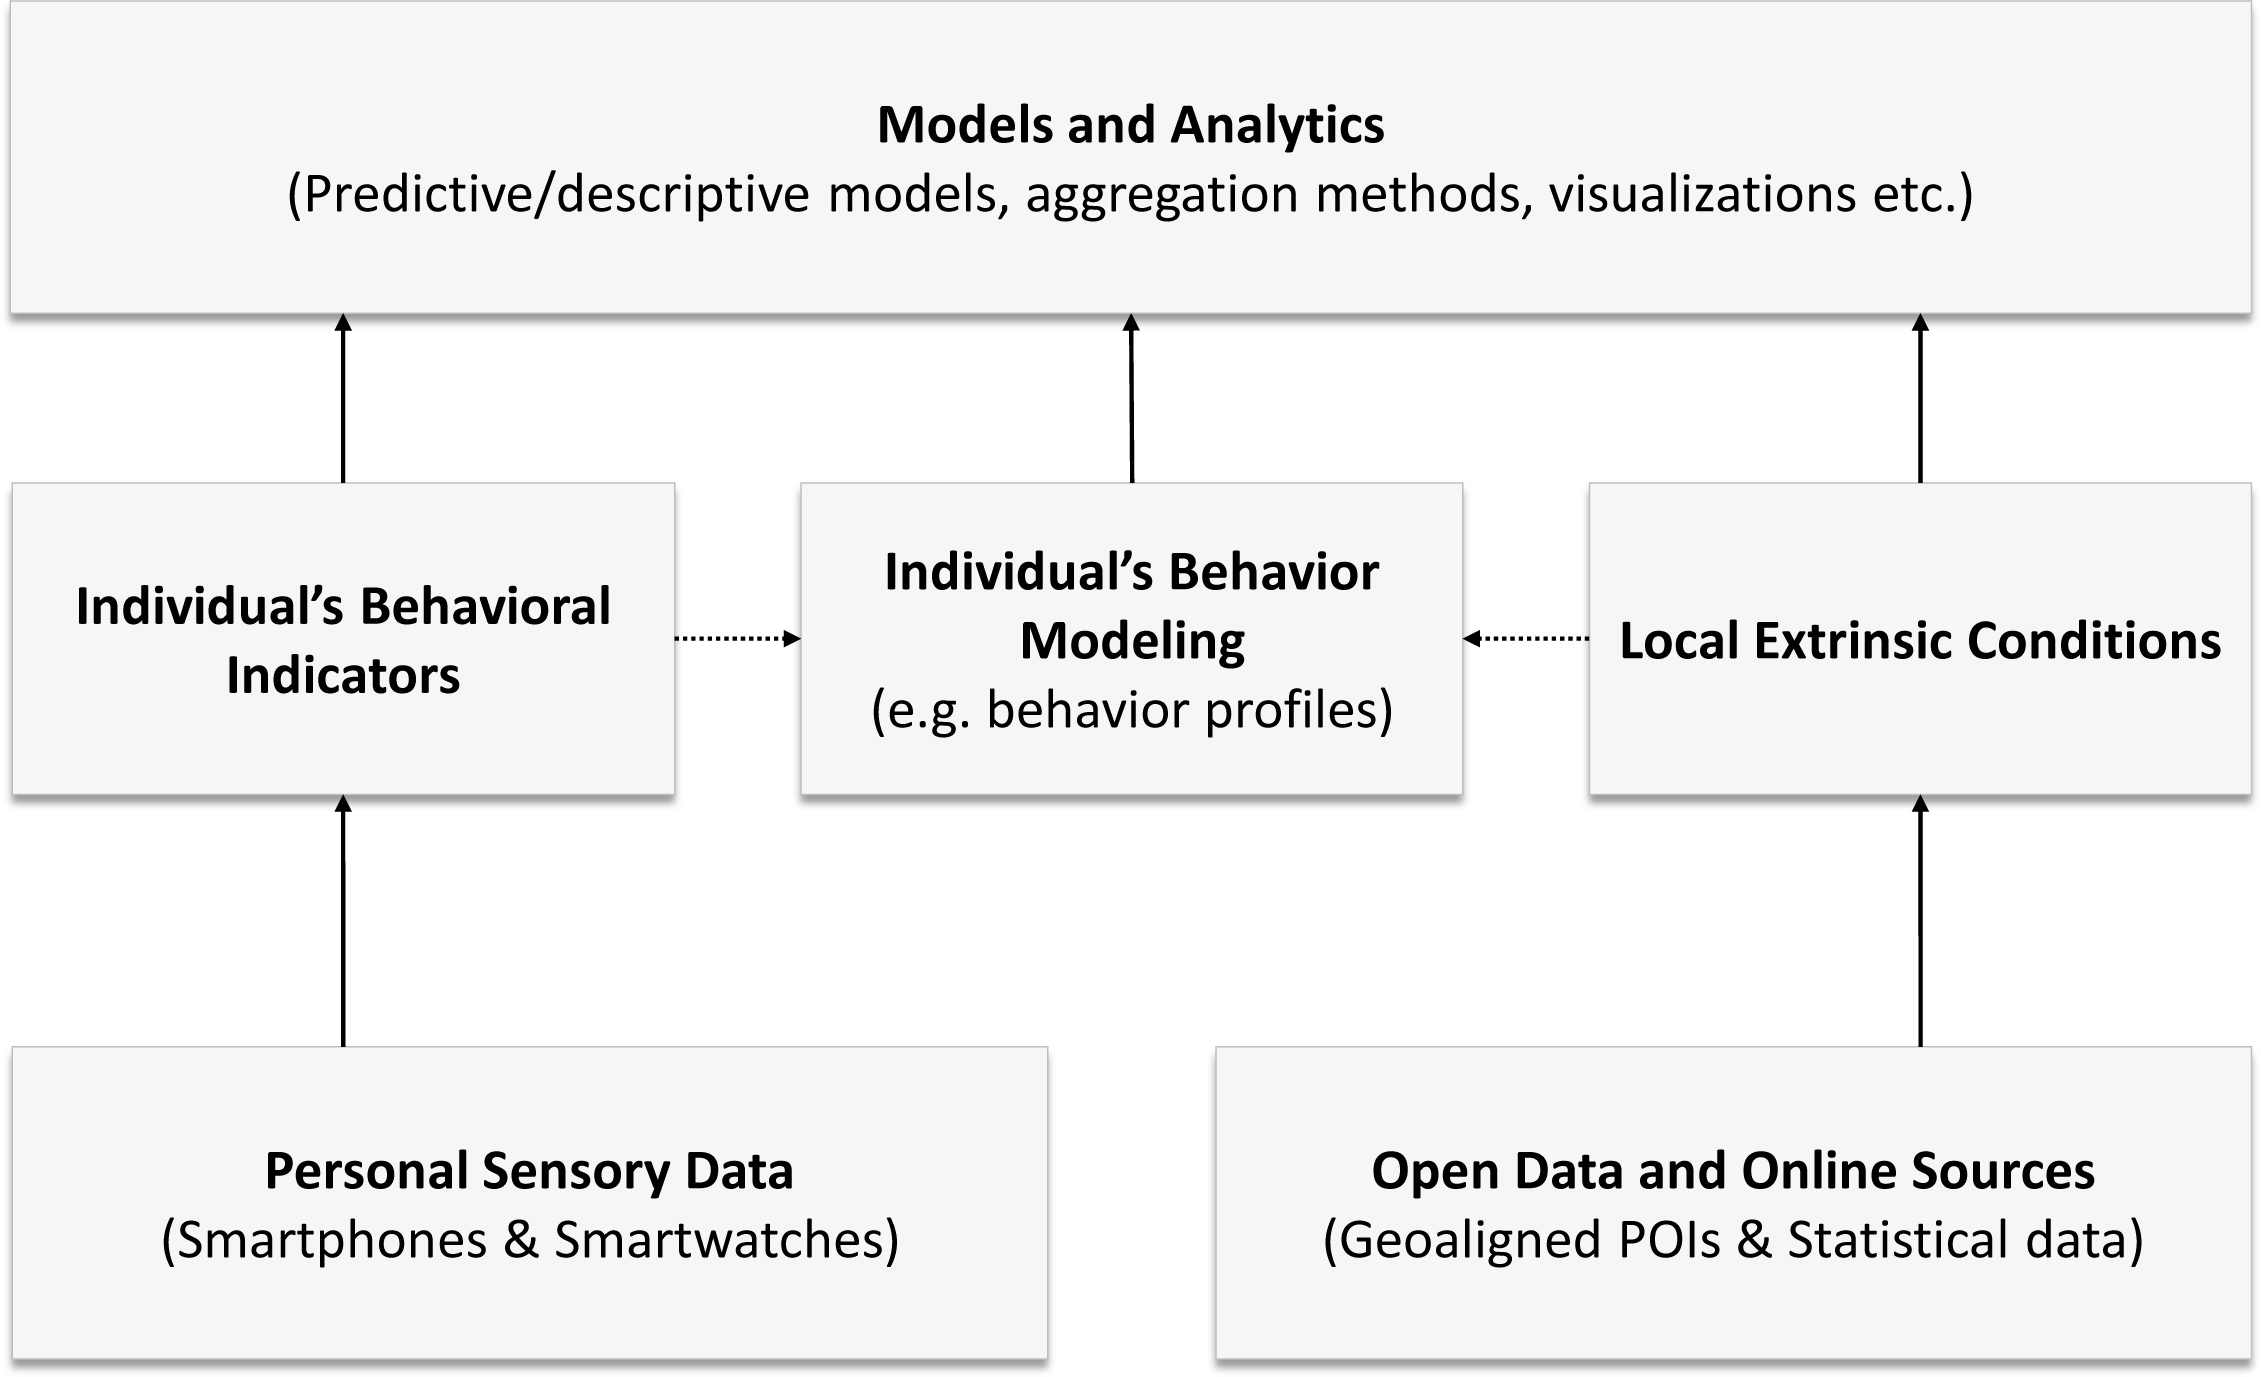
The proposed methodology includes steps for (i) data acquisition for objective measurement of individual behavioral indicators, (ii) measurement of environment factors that are relevant to childhood obesity, (iii) mechanisms for aggregating individual data to measurements describing the behavior of the population (to support analysis of behaviors with respect to the environment), (iv) mechanisms for controlling the level of privacy protection of individuals and (v) preliminary steps for quantifying data quality and addressing quality issues in the data analysis processes.
These elements of the BigO methodology are general, in the sense that can easily be adapted for use in other domains beyond childhood obesity. In addition, they are aligned with the principles of Trusted Smart Surveys, as they are outlined in [10]. Specifically, both propose the use of passively collected sensor data to extract objectively collected measurements in order to augment data collection from survey participants. Furthermore, both propose mechanisms for strong data and privacy protection. For example, Secure Multi-party Computation approaches, such as [11, 12], have been suggested for Trusted Smart Surveys, while the privacy controlling mechanism of BigO is outlined in Section 4. Finally, both Trusted Smart Surveys and BigO rely on voluntary citizen participation through the concepts of “Citizen Statistics” and “Citizen Science”, respectively. Based on these observations, we can argue that in terms of methodology, the proposed approach is aligned with the Trusted Smart Statistics concept [13]. They differ, however, in terms of their objective (official statistics vs scientific research).
The structure of this paper is as follows. Section 2 outlines the information model of the proposed methodology, from raw data acquisition to data analysis. Then, Section 3 goes deeper in the description of the types of behaviors and environmental factors that are considered for the problem of childhood obesity. Section 4 focuses on the mechanisms for aggregating individual data to population behavior, while Section 5 describes the mechanism for quantifying data quality according to the proposed methodology. Section 6 discusses the challenges and lessons learned during the development of BigO, which are relevant to Trusted Smart Statistics and especially Trusted Smart Surveys, and will hopefully be useful to developers of such systems. Finally, Section 7 concludes this work and provides directions for future research.
The primary goal of the examined methodology is to create new sources of evidence together with exploration tools for the Public Health Authorities to assist in their effort in developing policies against childhood obesity. Information in BigO can be grouped into three layers: (a) the raw data from sensors and external sources; (b) the quantification of behavioral and environmental characteristics; and (c) models and analytics. An illustration of the BigO information model is given in Fig. 1.
Overall, the methodology of BigO relies on the following functionalities:
The collection of Big Data associated with the individuals’ behavioral patterns (e.g., based on accelerometry and geolocation), using different technologies (smart phones, smart watches and wristbands). The collected sensor data are processed to produce behavioral indicators, which quantify behaviors known to be associated with obesity, such as eating habits and diet, physical activity and sleep. The collection of Big Data about characteristics of the environment which may affect the local population behavior and, eventually, contribute to the development of unhealthy lifestyle habits. This type of data is collected from multiple online and publicly available sources, such as official statistics, maps, registries and Geographic Information Systems (GIS). The collected data are processed to calculate the Local Extrinsic Conditions (LECs) which represent the local context in terms of the urban landscape, school programs, local policies, socioeconomic factors and food marketing. The creation of comprehensive models of the obesity prevalence dependence matrix, through the association of the LECs with the obesogenic behavioral patterns of the population. Note that the behavioral indicators and LEC data – instead of the original raw data – are used as input to the models. These models are the basis for providing data-driven decision support to public health authorities, policy makers and clinicians. Specifically, the targeted models are used to
Identify the most important obesogenic factors of the local environment. Although it is in general known what are the main conditions of the urban, the social, the regulatory and legal environment that negatively affect the obesogenic behavior, the examined methodology aims at identifying those that are prominent at a local level. Simulate the effect of interventions to the obesogenic behaviors. Local authorities will have indication of the effectiveness of their counter-obesity measures before their actual implementation. The visualization of the acquired data and their relations is also part of the functionalities that facilitate the exploration of populations behaviors versus the local environment conditions.
Using big data for collecting evidence
This section describes in more detail the raw data acquisition and processing methodology of BigO (layers 1 and 2 of the information model shown in Fig. 1). Sections 3.1.1 and 3.1.2 describe the data sources for behavior and local environment, whereas Sections 3.2.1 and 3.2.2 describe the behavioral indicators and LECs, respectively. Section 3.3 demonstrates a mechanism for describing the temporal characteristics of an individual’s behavior. Finally Section 3.4 briefly discusses the process for participant selection in BigO.
Data collection
Sensor data
The first source of raw data used in BigO is Personal Sensory Data acquired by smart phones and commercial smart watches. These are raw sensory data that are collected via a portable/wearable device, pertain to the individual that is using the device (with the single exception of food advertisement photographs), and are related to the behaviors that are of interest to BigO (what one eats, how one eats, how one moves, etc.). BigO relies on two types of sensor-enabled devices: (a) smart phones with Android or iOS and (b) smart watches with wearable OS (e.g. Wear OS).
The sensory data collected via the smartphones are inertial measurement unit data (IMU), location data and photographs. Other types of sensors are available which, however, are currently not used. Smartwatches collect the same types of data with the exception of photographs. Photographs are captured whenever users decide to submit pictures of their meals or food-related advertisements.
Indicative list of “base” behavioral indicators
Indicative list of “base” behavioral indicators
Unemployment rate in blocks of two areas, inside the same Greek municipality. Orange and red values indicate high, while blue and green values indicate low unemployment rates as estimated by the analysis of car images appearing on Google Street View [19].
Acquisition of the raw data is constrained by battery consumption limitations that currently prohibit continuous acquisition at high sampling frequency. Typically, all sensor signals available on the device are recorded on the slowest sampling frequency the operating system allows, which is enough for the calculation of most behavioral indicators in BigO. For most devices, the sampling rate for IMU sensors is between 5 and 25 Hz, while for GPS location data sampling rate is reduced to one sample per minute.
There are certain types of indicators that can only be calculated using raw data at high sampling frequency. For example, our algorithms for automatic extraction of in-meal behavior indicators (e.g. bite detection) using smart watches [14, 15, 16] require triaxial accelerometer and gyroscope signals with sampling frequency over 60 Hz. Integrating such indicators requires data collection at high sampling frequency for relatively small time periods during the day (e.g. only during meals).
Data acquisition mechanisms for battery preservation
To further preserve battery, BigO’s raw data acquisition software is aware of OS-level optimizations (such as the “Doze” mode for Android phones [17]). Battery optimizations essentially set the phone (or watch) CPU and sensors to stand by when it is not used. The criteria for what counts as usage vary slightly across different operating systems and device vendors. In practice, sensor recording stops when the device is left stationary with screen switch off for more than a few minutes. The device resumes recording as soon as there is some user input or significant motion. This fits the use-case of BigO very well since the criteria for suspending sensor recording directly imply that the device is not used, or that the individual’s physical activity is very low (and therefore no need to record sensor data).
The second source of data used in BigO are the Environment Data retrieved from online data or public data providers: geo-aligned Points of Interest and statistical data.
Geo-aligned points of interest
A number of online providers, such as OpenStreetMap, Google Maps, Foursquare, and Bing Maps, provide access to the metadata of Public Points of Interests (POIs). Among the different types of POIs, in BigO we are interested in POIs that refer to:
Food, such as restaurants, fast food outlets, grocery stores, supermarkets. Physical activity, such as gyms, pools, sports. Transportation, such as bus stops, metro stations. Other types of facilities related to child behavior, such as parks and indoor recreation facilities.
Additional metadata may characterize the usage of the POIs (e.g., timetables, transportation routes). We have adopted a common coding scheme and heuristic rules to map the characterizations of each data source/provider to an internal taxonomy.
Demographic, social and financial statistical data
Socioeconomic indicators such as the average income, unemployment rates, type of employment, educational level are collected from published archives of Eurostat and the National Statistical Authorities. This type of information is directly related to the LECs and heavily influence our aetiology models.
Other data on behavior, habits, and lifestyle of the population and on obesity prevalence have been collected and are openly available from WHO and initiatives like the Childhood Obesity Surveillance Initiative (COSI) [18].
Complementary sources for environment data
Two important limitations of the statistical data sources are (a) the relatively coarse spatial resolution of the statistical data (NUTS 1, 2 and rarely 3) and (b) the relatively low temporal resolution limited by the census periodicity. Two complementary sources of similar information are being currently explored:
The microdata repositories that are kept by the statistical authorities. Inference of statistics of interest from the analysis of publicly available data. A very promising illustration of this option is our work in [19] that attempts to predict unemployment rate at a fine resolution by applying deep learning and image processing techniques to Google street view images. An example of the method for two municipalities in Greece is given in Fig. 2. In this example, the true unemployment rate is estimated using a linear model and a surrogate variable calculated automatically from the parked cars in Google street view images (
Indicative list of “derived” behavioral indicators
Indicative list of “derived” behavioral indicators
Behavioral indicators
In BigO, the behavioral indicators are measurable quantities that provide information for the behavior of an individual. Overall, the behavioral indicators are measures that describe an individual’s behavior on diet (what you eat), eating behavior (how you eat), physical activity (how you move) and sleep.
In addition to the categorization in terms of the type of behavioral measurement, indicators differ in terms of the way they are computed. According to this viewpoint, three types of indicators are identified in BigO:
Self-reported indicators. These can be computed directly from the individual’s self-reports. Their drawback is that they depend on the user compliance and reporting accuracy; thus, they tend to be unreliable. Base indicators. These are indicators that are computed directly by processing the Personal Sensory Data. Their advantages are that they are calculated automatically, they provide objective measurements of behavior and they do not require any effort by the individual. Table 1 shows examples of base indicators in BigO. (Note that the “diet” indicators are also collected as self-reported indicators.) Derived indicators. These are calculated from the base indicators and may also leverage self-reported data. Table 2 shows examples of derived indicators.
Local Extrinsic Conditions (LECs)
Local Extrinsic Conditions (LECs) are measurements of the environment extracted by processing the Environment Data from open and online sources. LECs quantify the characteristics of the environment which can affect an individual’s behavior, including urban landscape, school programs and policies, socioeconomic factors as well as food marketing. Table 3 shows an indicative list of LECs calculated in BigO.
Indicative list of local extrinsic conditions (LECs)
Indicative list of local extrinsic conditions (LECs)
The base indicators are the first step for quantifying the individual’s behavior. Subsequently, the derived indicators provide some higher level information about the individual. However, indicators cannot express all aspects, especially the ones that refer to temporal characteristics of behavior. For example, consider the following cases:
After school, does the individual go to home or not? If not, what types of POIs does the individual visit? When is it most likely to visit a fast food restaurant or take away outlet? What type of POIs precede a visit to such facilities for the individual?
For this purpose, BigO has developed mechanisms to systematically model the temporal characteristics of behavior (i.e. the individual’s daily habits), which are known to be associated with the risk of developing obesity. The most prominent mechanism is the behavior profiles [20].
Briefly, a behavior profile for an individual is calculated through the following steps:
For each individual we identify the visited POIs by executing a clustering algorithm. For example, we can use the DBSCAN variant of Luo et al. [21], which is tailored for geospatial trajectories. The POIs are then transformed to reflect their type (e.g. school, fast food or take away, athletics and sports, public parks, etc.) using online data sources (such as, Google maps and Foursquare). The more important element is that the actual coordinates of the POIs are discarded in the next steps. This way we can ensure high level of privacy protection since the actual location coordinates are never used. The timeline is constructed as a sequence of “stop” and “move” events. Each event contains the recorded sensory data and extracted base indicators, the timestamps, the POI type for “stop” events and the origin and destination POI types for “move” events. In addition, “move” events contain the travel distance and the transportation mode (e.g. vehicle or walking). Using the available timelines of an individual we calculate two behavior profiles, one for school days and one for non-school days. A behavior profile consists of three parts:
A transition graph that captures the individual’s mobility patterns. It is calculated using the frequency between the origin and destination POIs of the “move” events across all timelines of the specific type. It is based on the assumption that the timelines can be modeled by a first order Markov chain for the mobility patterns of the individual [22]. An edge of the transition graph from POI type
Figure 3 shows an example graph visualization of a behavior profile calculated for a student that participated in a BigO pilot using the timelines of
Example graph visualization of a behavior profile [20]. The profile was extracted using the timelines of 10 school days for a student that participated in a BigO pilot. The transition metadata for each edge of the graph with The POI metadata for each node of the graph. They describe how the individual behaves during a visit at each POI type (e.g. number of meals, physical activity indicators) and can be modeled using distributions or their average values.

More information for the calculation of behavior profiles and detailed examples from real-world data can be found in [20].
The presented methodology focuses on how data is collected from each individual participant and each geographical region, independently of how these have been selected. For the statistical analysis the sampling mechanism is of high importance, especially if the objective is to compute statistics about the population.
Example choropleth map depicting the geospatial distribution (at 7-character geohash level) of the average value of “activity counts per minute” in the city center at Larissa, Greece. The block of higher (orange) values at the city center can be explained by the pedestrian zone that has been built there.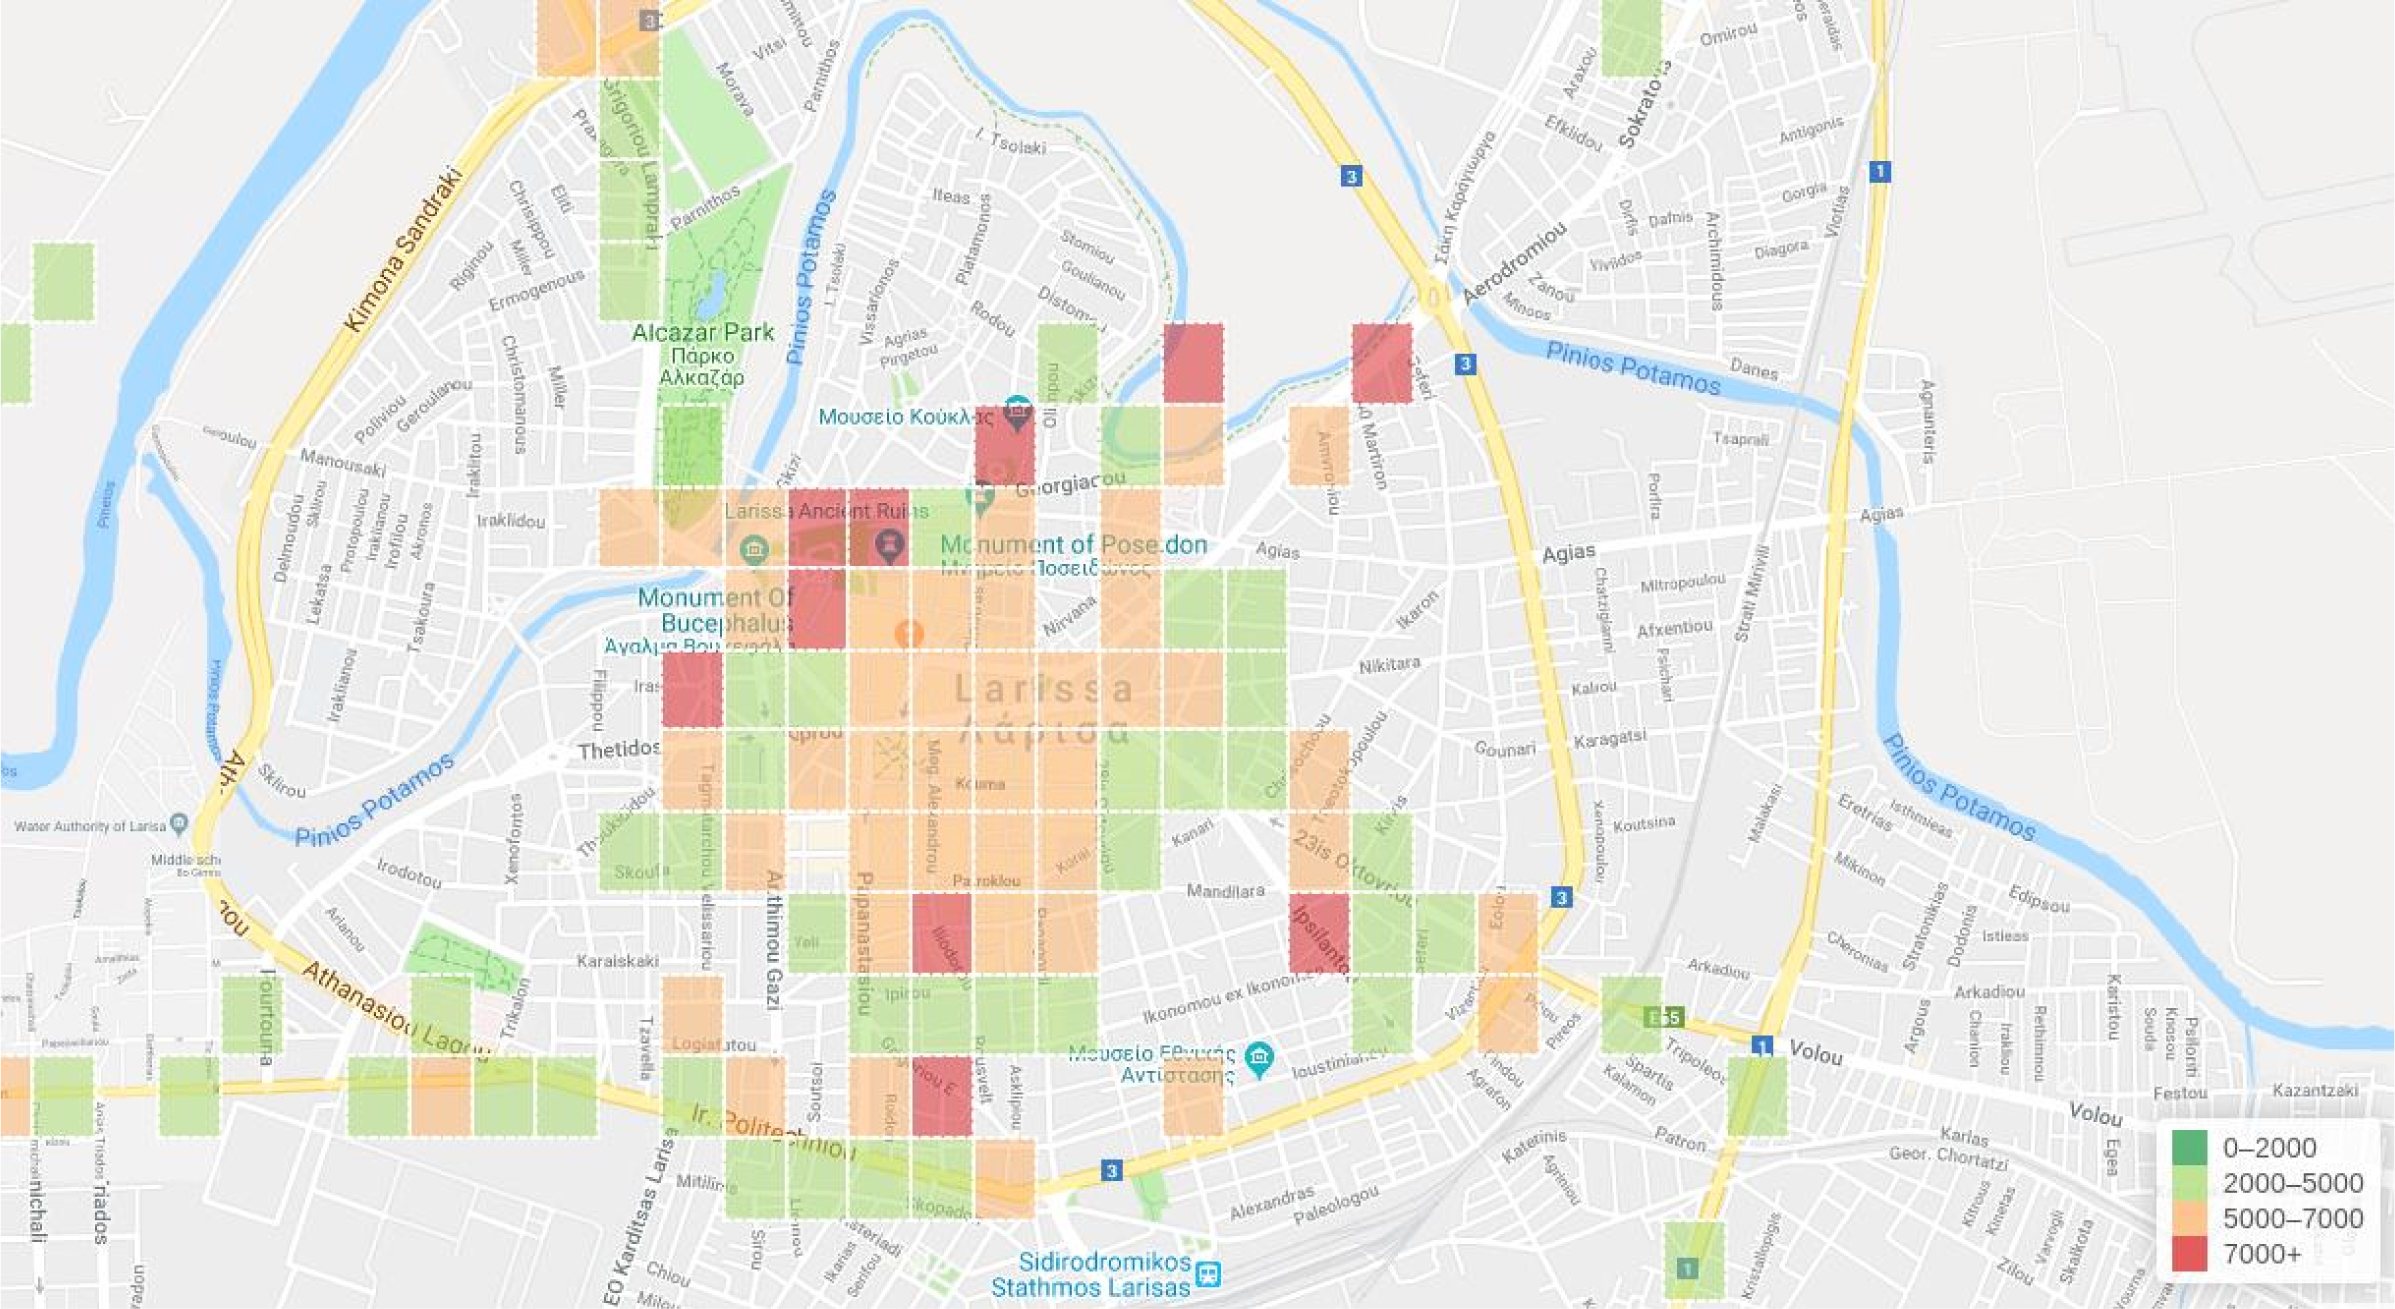
In BigO, children participate through their schools in the context of class activities, and under the supervision of their teachers. Participation is voluntary and there are no exclusion criteria. High school children participate using their own mobile phones. For primary school children, smartwatches are distributed to the children, which are paired to their parents’ smartphones.
As a result of these procedures, schools can be selected for participation in the data collection by the researchers (based on the geographical region of interest), however students of these schools are free to participate or not (given permission by their parent or legal guardian, where necessary). This selection process is expected to introduce some self-selection bias, since the distribution of the participating sample is, in the general case, different than that of the population of the participating schools. Coverage bias is also introduced due to children not owning a smartphone, or due to their parents not owning a smartphone (in the case of primary school children).
Resolving these issues remains an open issue in BigO and the domain of childhood obesity. Current research is involved with performing appropriate participant segmentation by clustering behavioral profiles 3.3 and use this to define a sample weighting scheme to counter the effect of these biases.
Behavioral information that is described by the indicators of Section 3.2.1 represents the behavior at individual level. In the context of evidence-based policy making, however, we are interested in the behavior of the population at a certain geographical region during an observation period, which is computed using some type of aggregation function.
Geographical regions of interest can be census units (usually consisting of a few thousand people each) or larger administrative regions, such as municipalities. For the problem of childhood obesity we are interested in modeling the local context with high detail and are therefore interested in high geographical resolution. We have adopted the encoding of geohashes [23] for measuring LECs and aggregating population behaviors. An example showing aggregated physical activity data at 7-character geohash level is shown in Fig. 4. This system is similar to the GEOSTAT 2011 population grid [24] or any other grid-based system which integrates geographical and statistical data. The geohash encoding has the additional advantage of being able to easily support different geographical resolutions, since the geographical resolution depends on the length of the geohash string, with longer geohashes corresponding to smaller regions.
Regarding the length of observation time, it should be of sufficient duration to capture the desired behaviors. As a tradeoff between measurement quality and possible burden placed on participanting children, we consider two weeks of monitoring data as sufficient for the purposes of measuring obesogenic behaviors. More data should be obtained however, whenever possible.
In terms of data aggregation, there are two categories of aggregations in the proposed methodology. Those that aggregate the behavior of the individuals that live at a specific region, and those that aggregate the behavior of individuals visiting a specific region. We can briefly refer to the first type of analysis as the “habits” of the population and the second type as the “use of resources.” Not all indicators are applicable to both types of analysis. For example, the “Average weekly visits to fast food restaurants” cannot be applied to the “use of resources” type of analysis, since it examines the behavior of an individual irrespective of their location. On the other hand, the “Number of fast food meals during a visit to a region” indicator applies to the “use of resources” type of analysis only, since it focuses on the behavior of people visiting a particular region. Despite their differences, both types of analysis use similar aggregation functions, which are described in the following section.
Aggregation functions
One can think of simple averaging as the most common aggregation function. In more general (and formal) terms, an aggregation function is a mapping from a set of tuples to a summary which is most commonly a real number or a distribution (a vector of real numbers that sum to one),
where
which is translated as “individual with id 5 that lives in geohash sx0r4k performed 32 steps at the minute 11:52 of the 1st of July, 2019”.1
Given this notation, Table 4 lists a set of aggregation functions which are useful for the purposes of collecting evidence for obesogenic behaviors in a region. Depending on the type of analysis, the expectation may be applied for the individuals living in the region, or the individuals only during their visit to a region, as explained previously. It is also worth mentioning that the aggregation functions of Table 4 can also be applied with additional filtering criteria, e.g., based on age, gender, value of other indicators etc.
A set of common aggregation functions
Privacy protection in the proposed methodology aims at eliminating the possibility of inferring information about individuals through the aggregated behavior data, as well as on limiting the sensitive individual information that is stored centrally in the system. Detailed analysis of the privacy protection mechanisms is beyond the scope of this paper, however they are briefly outlined here for completeness. They include the following measures:
No directly identifiable information (names, emails) is stored. Participation is performed through registration codes. Data about individuals is never displayed or shared. Geographical region size is adjusted dynamically to include data above a minimum number of individuals. Support for distributed computation.
The first two mechanisms are enforced by design. Individual data are stored in a different database than the aggregated data. Data from the database containing sensitive, individual data is never shared or used for display.
Even when providing only aggregated data, however, there are privacy risks when the number of individuals is small. Assuming that only few participants (i.e. below a threshold) have provided data for a region, it is possible to (a) disregard the region or (b) use larger regions, until sufficient participants are included. This second approach has the advantage that valuable data is not ignored in the analysis. In the case of geohashes, this can be achieved by reducing the geohash length until the required number of participants is included.
Finally, distributed computation protects highly sensitive individual data (such as raw location data), by analyzing them at the edge device, without transmitting them and storing them centrally. According to this approach, the raw sensor data is processed at the participants’ smartphones to extract the behavioral indicators of Section 3.2.1. The indicators are then transmitted and stored for analysis. The drawback of this approach is that the raw data is not available later, if additional processing needs to be done.
Data quality levels
Data quality levels
Mapping data availability to quality level
In contrast to data collection under controlled conditions, working with big data sources introduces significant data quality challenges. Low data quality in the context of this work can be due to
Missing or incomplete data. E.g., some participants will only wear a smartwatch a few hours of the day or a few days per week, while others will deactivate location data recording. Heterogeneous data sources. E.g., the accuracy of physical activity indicators depends on the type of accelerometer sensor and its sampling rate. Measurement errors for behavioral indicators. E.g., activity type recognition or transportation mode detection algorithms are not 100% accurate. Bias. E.g., selection bias (differences between those who choose to participate and those who don’t), coverage bias (differences between those who are able to participate and those who don’t).
Regarding the last error type (bias), work on determining appropriate sample weighting to counter the effect of selection and coverage bias is currently in progress (as discussed in Section 3.4) and is not discussed here. For the first three sources of error, our approach is to quantify the quality of each data sample using a common, 5-level data quality scale, which is shown in Table 5.
Having a quantified quality level for each measurement allows us to represent our “confidence” in the measurement and take this information into account in subsequent statistical analysis [25] or predictive modeling [26] steps. In the following subsections we briefly outline a set of simple guidelines for quantifying data quality.
Quality determined by data availability
Missing values and incomplete data is a result of measuring using general-purpose wearables and sensors. Not all devices include all sensors, while compliance across users varies. In addition, behavior measurements for each geographical region can be computed from different numbers of users, with different recording duration.
To map data availability to quality levels, we use thresholds. A “Very low” threshold determines the value under which the quality is “Very low”, while a “Very high” threshold is used to determine the value above which the quality is “Very high.” Values in-between are linearly interpolated to determine the quality level. The thresholds presented in Table 6 are indicative and depend on the application and type of behavior that needs to be measured.
Quality determined by data source and accuracy of behavioral indicator extraction
When measuring behaviors for the purpose of understanding and preventing childhood obesity we consider the quality of data produced by smartwatches to be “Very high.” For data produced by mobile phones, the quality is “High.” Regarding LECs, data coming from statistical authorities are considered to be of “Very high” quality. The quality of map and GIS data sources for estimating LECs varies. For example our experience is that Google’s maps (“Moderate” quality) are less reliable than Foursquare maps (“Very high” quality) regarding available venues. Depending on the application, a small number of experiments can allow assignment of quality levels to different data sources.
Measurement errors for behavioral indicators are introduced by the behavioral indicator extraction algorithms. Based on the algorithm effectiveness, as measured in annotated datasets, one can estimate the quality level for each indicator. A discussion on the effectiveness of the various indicator extraction algorithms is, however, beyond the scope of this work.
Multiple simultaneous sources of error
Multiple sources of error may be present simultaneously during the analysis. For example, the estimated average number of daily steps a child performs in a region may be inaccurate due to low sample size, due to missing measurements during the day, or because the step counting algorithm introduces error. To keep the analysis simple, we treat the quality levels as fuzzy numbers and use fuzzy operators to combine them, such as fuzzy intersection and union (
On the other hand, if we have two measurement types for the same information (e.g., self-reports and objectively measured information on fast food visits) then we can expect the quality of our data to be the union of the two values. Using the standard union,
The advantage of this approach is that any type of
This section provides an informal account of the obstacles that we have encountered, thus far, while implementing the proposed methodology in the BigO technology platform. Given the overlap between BigO and Trusted Smart Surveys (as discussed Section 1), our hope is that such information will be useful for those who develop similar solutions for Trusted Smart Statistics.
Technology
The technical challenges that we encountered are the result of the requirements for sensor data acquisition from commodity smartphones and smartwatches. These requirements include the following:
Data should originate from off-the-shelf smartphones or smartwatches that participants already own (using special-purpose devices is not a viable option for extracting population-level statistics) Data collection should be as unobtrusive as possible, to increase usability and compliance. Aside from answering questions (active data collection) users should not notice any changes in their device’s operation while sensor data are passively collected Most of the data processing should take place at the edge device, to avoid unnecessary transmission of personal data Behavioral indicators should be as accurate as possible. In any case, the probability of error should be quantified
The main problem associated with the first two requirements is that the operating systems of modern smartphones and smartwatches (namely Android, Android Wear OS and iOS) have built-in mechanisms for battery saving which prevent applications to execute continuously in the background. This means that unless special provisions are made from the developer side (such as the ones outlined in Section 3.1.1), data acquisition may unexpectedly stop when the data acquisition application runs in the background. To make matters worse, many vendors of popular Android devices have introduced special, non-standard and non-documented procedures for stopping applications in the background. These cannot be bypassed programmatically, so device-specific multi-step instructions need to be provided to the users of such smartphones.
For the third requirement (processing at the edge device), complex processing can indeed be carried out in modern smartphones, since they are equipped with powerful processing units. It is best to collect the data locally and perform the processing when the device is charging, since in that case any processing side-effects (power consumption, increased device temperature) are not noticable to the users. On the other hand, smartwatches are less appropriate for data processing and a mechanism must be implemented for transmitting the data to the paired smartphone first.
Finally, regarding the fourth requirement, research on signal processing and machine learning algorithms for behavioral indicator extraction is still in progress, although the state of the art is already fairly accurate [28, 14, 21, 29, 30, 31]. One problem is that development and evaluation of these algorithms take place using publicly available datasets which generally are different compared to the data collected through mobile and wearable applications. Additional algorithm development and validation is therefore needed. In the same context, it is important to highlight that errors are also introduced by limitations on the use of the system. For example, people often don’t carry their mobile phones when exercising. This means that often the individual physical activity is understimated.
As a result of all the above issues, is important to plan for significantly increased research and application development time compared to other mobile applications which usually focus on front-end development. This also depends on the required sensors (IMU sensors are usually more complex to handle than GPS, for example). Given that data acquisition is a prerequisite for all subsequent data processing and analysis steps, an overly optimistic development time estimate here will have a major impact to project planning.
Usability and participation
Usability is cruicially important for citizen science applications, since it facilitates participation, inclusion and retention (especially when longer duration of use is desired). Our experience so far is that existing devices, and especially smartwatches, are not sufficiently user-friendly for many users who expect seamless, minimum-effort setup procedures. To overcome this barrier, special emphasis must be placed on user experience and interaction, and especially on making sure that adequate feedback is provided to users. This includes feedback showing whether data is being recorded or not, as well as appropriate indications when something is wrong and what the user should do about it, both for the setup and the normal operation of the system.
In addition to usability, voluntary participation requires the use of some type of incentive and an engagement mechanism. For the children who are citizen-scientists of BigO, user engagement is mainly achieved through school-based activities, coordinated by teachers. These can be quite effective for children, but do not generalize to the entire population and require effort from a third-party (i.e., the teachers in our case). Research, experimentation and possibly several pilot deployment rounds are required to discover effective incentives and communication strategies that work in engaging the required population sample in the case of Trusted Smart Surveys.
Conclusions
We have presented an overview of the BigO methodology for collecting evidence on population behavior and the environment related to the problem of childhood obesity. BigO develops tools that allow for the monitoring of obesogenic behaviors of the population and the association of these behaviors with the characteristics of the environment. Individuals voluntarily offer their data according to the citizen scientist paradigm. The personal sensory data originating from worn IMU sensors, GPS, pictures captured by the users and responses to questionnaires are being aggregated in order to produce behavioral indicators and behavioral profiles. Collection of data from open and online sources is leveraged to produce LECs, which refer to geo-aligned POIs and statistical variables (demographic, social, financial, etc.) known to be linked to obesity and unhealthy lifestyle choices. Extracted behavioral indicators are being correlated to LECs as a means to identify local factors that cause (childhood) obesity. Furthermore, BigO adopts strict privacy preservation mechanisms, including innovative aggregation methods, and features data quality criteria that take into account various sources of error.
Footnotes
The corresponding interpretation for the “use of resources” analysis would indicate that the individual visited geohash sx0r4k during that time, and not that he or she lives there.
Acknowledgments
The work leading to these results has received funding from the European Community’s Health, demographic change and well-being Programme under Grant Agreement No. 727688 (), 01/12/2016 – 30/11/2020.