





Abstract
Statistical disclosure control aims neither at revealing the identity of an individual, nor at revealing characteristics of individuals, households or companies that are confidential or personal. Primary statistical secrecy concerns information one can directly assess, whereas secondary statistical secrecy concerns information that a user could deduce indirectly by recombining and crosschecking all the disseminated data.
In the case of spatial data disseminated according to several geographical partitions, it is possible to combine and intersect the geographical areas in order to derive information on new and smaller areas. The differencing technique, which consists in subtracting the value of two overlapping areas, can lead to a breach of confidentiality.
We have developed a method for dealing with geographical differencing problems by detecting individuals located in small overlapping areas and whose personal information can therefore be disclosed. Modelling the data into a graph structure enables focusing on relevant geographical regions. The originality of the method resides in reducing the graph size and complexity. We applied the method to French income tax data composed of 27 million households dispatched on the 150 000 square cells and on the 35 000 administrative units. The results show that 10 000 households are at risk for disclosure.
,88avenueVerdier,92120,Montrouge,France.Tel.:+33680342070;E-mail:vianney.costemalle@insee.fr.
Introduction
The French National Institute of Statistics and Economic Studies (Insee) disseminates very small-scale spatial data. For example, statistics on households income and demographic structure are provided both through a regular 200 m-squares grid and through administrative units. There are about 35.000 municipalities in France and the metropolitan territory is covered by 2.3 millions of 200 m square cells. Statistical Disclosure Control (SDC) is, in this context, a major issue since the two datasets, one for municipalities and the other for the regular grid lead to aggregation of the sames variables on different overlapping areas. This could lead to households identification, either directly because the number of households involved in the considered aggregate is below some threshold or indirectly, by linear combination of published aggregates. Broadly speaking, there are two major classes of methods in order to avoid disclosure of confidential information: one, called perturbative methods, consists in adding a random noise or randomly exchanging households characteristics at the level of micro data and then, computing aggregates; the second class of methods consist in identifying and suppressing or aggregating at-risk cells. Usually, SDC adopts some ad-hoc measures of risk of the published information with respect to a given involved household, such as (n,k)-dominance[1]: n or fewer households constitute greater than k percent of the total cell value, for example. In this paper, we adopt a much simpler approach of risk: an aggregate is assumed problematic when the number of households involved is below a conventional threshold. This threshold is a parameter of the algorithm. The paper is centered on indirect SDC in the specific case of spatial differencing.
For this indirect SDC, we need to monitor all possible ways of combining regular grid and municipalities data in order to check where theses combination finally lead to reveal some information about aggregates of households whose size is less than the previously mentioned threshold. The level of the task, while scanning all possible combinations, is completely intractable by a computer: the magnitude of the number of combinations is typically
Many authors have shown the connection between SDC, linear programming and graph theory in the identification of (indirect) at-risk cells[1, 2, 3, 4, 5], among others, have developed algorithms based on graph theory in order to detect at-risk cells in different contexts. Our work is based on these ideas but applied in the specific context of spatial data where graph theory tracing linear combination of data may be nicely complemented by geographic proximity in order to reduce dramatically the complexity of the detection of at-risk cells.
Because people want to know what is happening locally, there is a growing demand for spatial information. To this end, NSIs will release an increasing quantity of data which are geographically located. Eurostat emphasized “the need to enhance the use of the spatial dimension during the collection, processing and dissemination of statistics has been acknowledged by the EU and its Member States for almost two decades”.
The grid system, consisting of regular, usually square-shaped, cells, has proven useful to disseminate spatial data in a harmonized way and get rid of administrative boundaries. Several NSIs have already released grid data, from census data or business data. It is then expected that confidentiality issues regarding spatial data and grid data in particular will have a growing importance for NSIs. In the context of SDC, geographic information is not like any other information because it is highly identifying information (such as the name or the address). One is expected to know his neighbours better than random people [6]. Moreover, there is an increasing supply of detailed and open geospatial data, such as the ones provided by Open Street Map or Google Earth, which can help identify buildings and dwellings in some given areas. Therefore, some special treatments must be considered when dealing with the confidentiality of spatial data.
To prevent geospatial data from disclosure, perturbation methods, such as targeting record swapping [7, 6], have been explored. But indirect SDC is clearly a much more complicated and significant issue here: by subtracting a zone composed of squares of the grid data to a zone composed of municipalities, one can discover information on an area containing very few statistical observations (households, companies, individuals, etc.). The operation is called geographical differencing.
Duke-Williams and Rees have already developed a method to detect differencing issues, but restraint to a special case, the most simple one, consisting of regions composed of only one area of either of the two zonings. These authors explained that testing differencing on aggregation of areas, and not only on a single area, was “beyond the scope” of their software [8]. It remains very difficult to detect all the differencing issues arising from a database disseminated according to two different, non-nested, zonings. The reason is that the number of regions that can be differenced increases exponentially with the number of geographical areas. The purpose of the work presented in this paper is to provide a framework as well as a method to detect observations which are at risk because of the geographical differencing. It is thus an attempt to bring some new tools to better tackle secrecy hacking in the context of spatial data.
The geographical differencing technique, and why the computations may be exponential
The differencing technique
The differencing technique can be used when the disseminated data are additive, which means that these data can be added together or subtracted from each other. For instance, the population’s total income is additive whereas the median income is not. The principle of the geographical differencing technique is quite simple: it consists in making the difference, on additive data, between the data disseminated in an encompassing area
Diagram of the principle of the geographical differencing. Note: The area 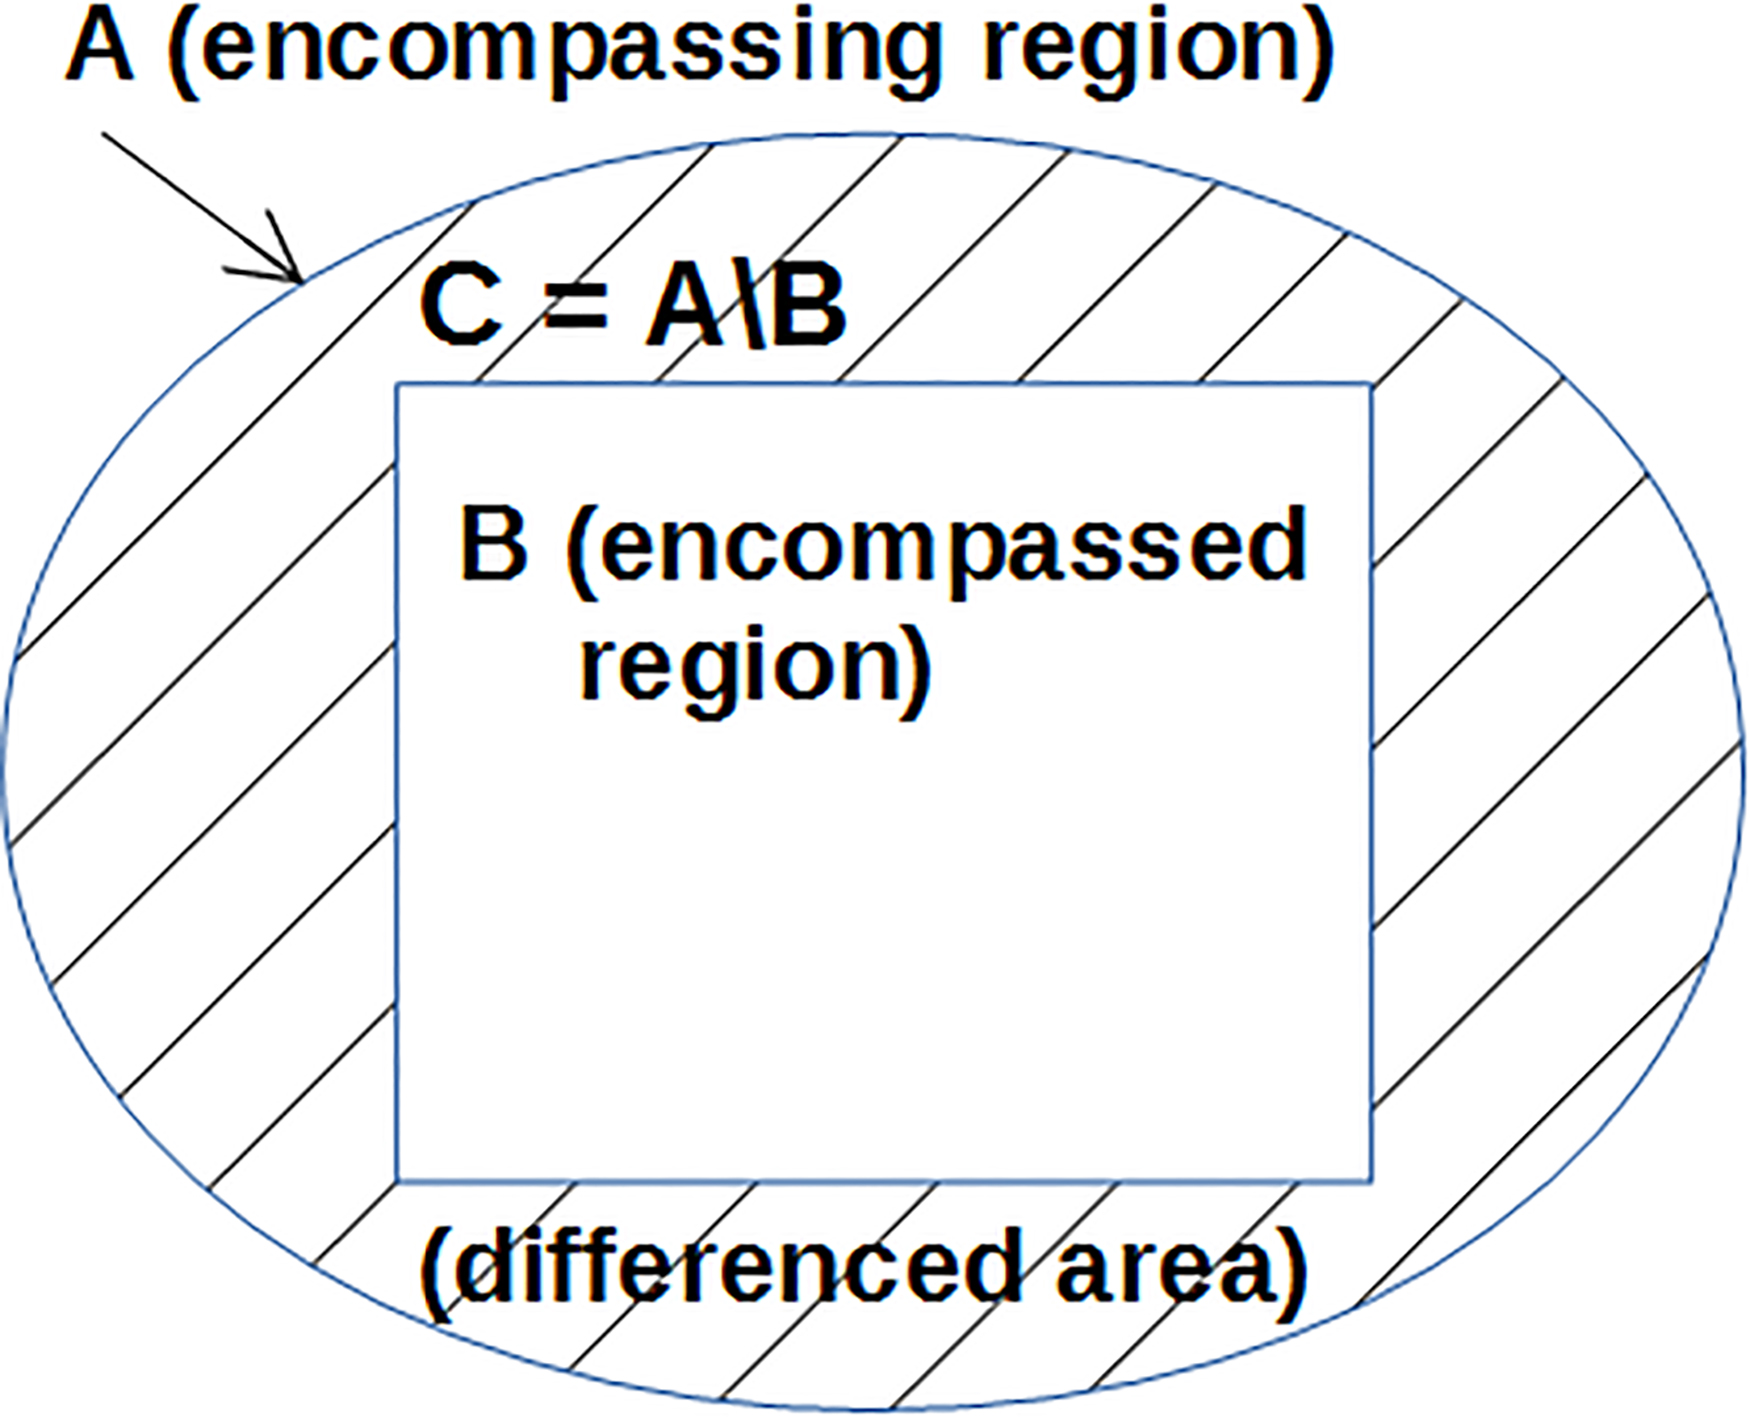
Lets first consider an educational example. Figure 2a displays a map representing 23 statistical observations located on 4 administrative (
Educational example to illustrate the differencing issue.
To be able to discriminate between fully included cells (like
All the possible differencing, internal and external, related to the example of Fig. 1
Note: Each line represents a region on which differencing is applied. A dot
Modelisation
Lets consider a geocoded database with
By definition, for a given region
The connected areas and the graph representation
As we have noticed on example of Fig. 2, some combinations lead to the same subset of at-risk observations (e.g. combinations 3, 7 and 10 and 14 in previous example). In the example, computing the differences on the group
The first idea is then to restrict the search on encapsulating regions
With this consideration it is sufficient to check differences on regions whose elementary zones are connected. We can deal more easily with this result by representing the data within a graph structure. The nodes of the graph are the elementary zones of the first zoning
Graph representation.
To summarize:
each connected subgraph of the graph corresponds to an encapsulating zone which can potentially lead to a differencing problem; in order to know if there really is a confidentiality issue, the number of observations located in the differenced area, noted if
This approach enables to substantially reduce the number of differences to compute. In our example, it is only necessary to compute 7 differences (corresponding to the 7 connected subgraphs, see Fig. 3b) instead of the initial 16 differences. In many cases the number of connected subgraphs of the initial graph can be too important to check them all. For France, for instance, the graph has 35 000 nodes each having on average 6 neighbours. In that case there are billions of possible subgraphs. For that reason we developed a method which allows to reduce the number of connected subgraphs to test, without missing any observations at risk. It consists of “reducing” the size of the initial graph.
We present two ways of dealing with a large graph for the problem of detecting the connected subgraphs which lead to a differencing problem. The first technique is to merge nodes that we know must be in the same subgraph. By repeating this merging technique as much as possible, it enables the size of the graph (i.e. the number of nodes) to be considerably diminished. The second technique is to split the graph into many components and to consider these components separately. Once again this reduces the number of subgraphs to test.
Diagram of the part of the graph taht links the node 
Diagram of the splitting of the graph. Note: The node 
Let
If we consider a connected subgraph containing the zone
Consequently, if
Moreover, if
The last idea we developed is to split the resulting reduced graph into several smaller graphs. Lets consider one node
Another important fact is that if there is a differencing problem over an area
Number of differencings which lead to a confidentiality problem, according to the size of the area on which the differencing is done and according to the number of observations the differencing puts at risk
Two examples of regions composed of multiple municipalities (colored area) leading to a differencing problem. Note: The figures represent the number of observations at the intersection between grid and municipalities. The bright area containing only 1 observation highlights the differenced area where the observations at risk are located.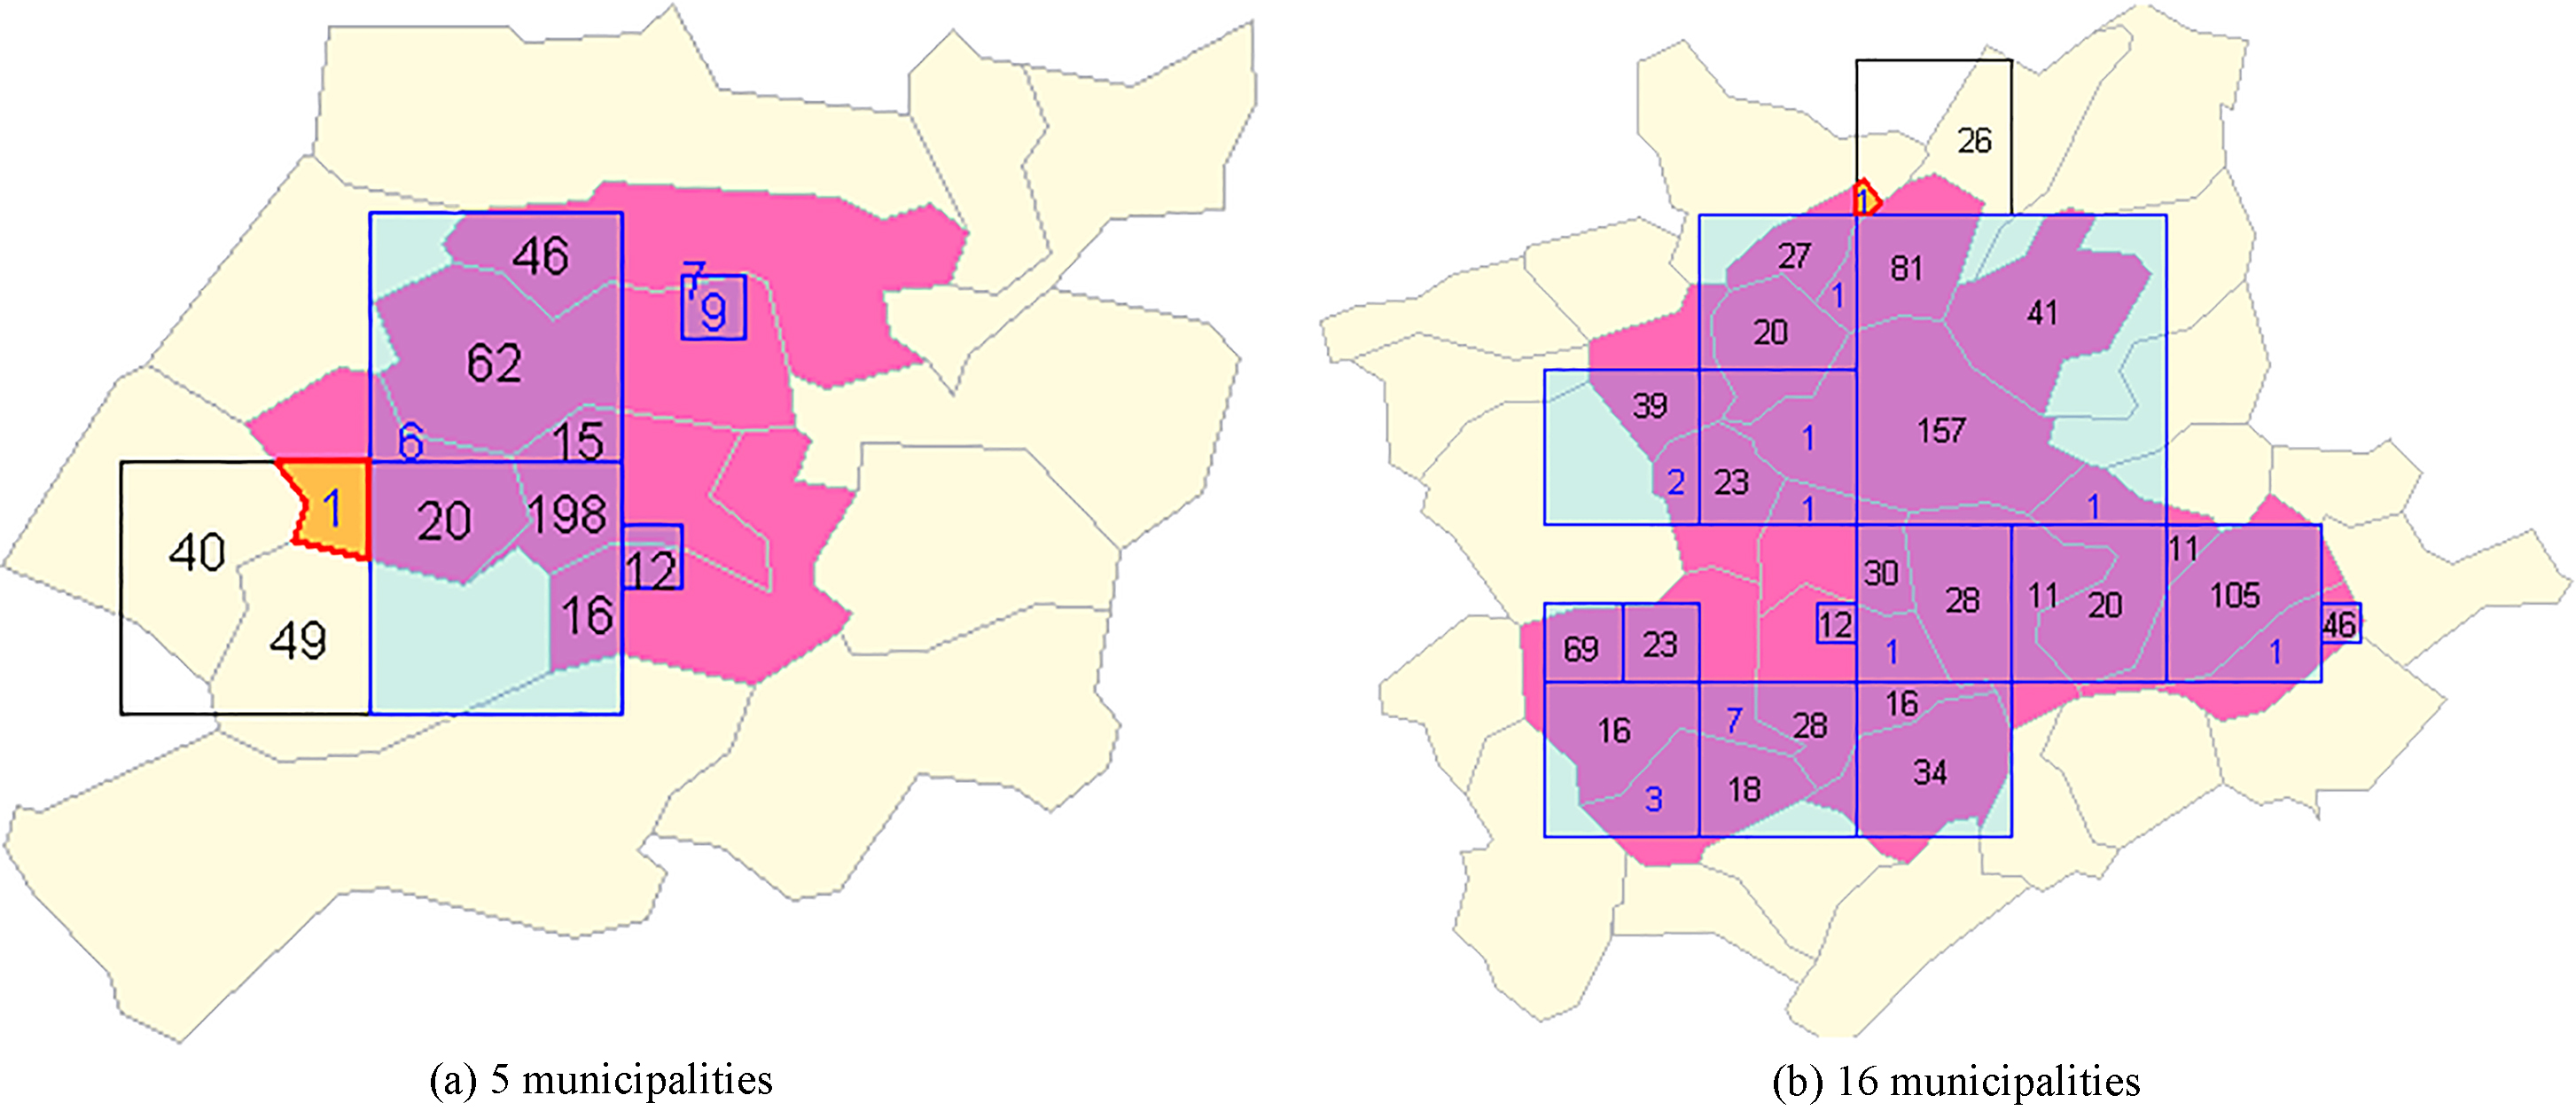
Thus, if we test for a differencing problem over all the subgraphs which are included in one of the
merging nodes of the graph, and so reducing the size of the graph; spliting the graph into smaller connected components, and then reducing the number of connected subgraphs to test.
We apply the proposed method to the case of the French income tax database, in order to detect the households at risk. The database contains information on the 27 million households living in France, including the standard of living which is a confidential variable. These information are disseminated according to an administrative zoning (the 35 000 municipalities) and according to a grid squares resulting from the quadtree method (150 000 cells). The squares size varies between 200 m and 32 km depending on the population density. They are designed in such a way that no cell contains fewer than 11 households, which is the confidentiality threshold for this source. In that case, differencing problems may arise between municipalities and cells. The whole process took 5 h 30 to run. Around 10 000 households at risk have been detected, that is 0.04% of the total number of households. There are 2 530 areas composed of municipalities which can potentially lead to a confidentiality issue when using the differencing technique. The larger area is composed of 345 municipalities, but most of the areas contain few municipalities. Almost 60% of them are composed of one municipality and 95% of fewer than 14 municipalities. Table 2 gives the number of differencing problems according to the number of observations at risk located in the differenced area. For example, 50 regions made up of a number of municipalities between 10 and 49 will give information on only one household. Some very complex regions lead to deduce information on only one household (6 regions made up of more than 100 municipalities – Table 2). Figure 6 gives two examples of differencing problems. Figure 6a shows an area (colored in pink) composed of 5 municipalities. When difference between those 5 municipalities and the inside squares (colored in blue) is computed, one deduces information on the household highlighted in yellow. Figure 6b displays a more complex example of differencing problem involving 16 municipalities.
To allocate one household to a specific cell, the exact location of the household is needed (i.e. the coordinates of the point representing the household). In the case of the French income tax database the coordinates are retrieved through the cadastral plan, using the fact that each household is linked to a specific cadastral plot. The retrieved coordinates may not always match perfectly with the localisation of the house, and in the case of big housing estate, there is only one point representing all the building even if it spread over a large area. Because the grid square cells is computed with those locations, the differencing problems will also arise based on those locations no matter how imperfect they are. The number of households being disseminated according to the two zonings, an external user can precisely know the number of observations in any differenced area. So an external user, even if he doesn’t know the exact locations of the households can assess if a particular difference leads to a breach of confidentiality or not.
An important point is that an external user cannot applied the propose method to detect all the risky households without knowing the exact locations of the households. Nevertheless, it is not impossible to estimate those locations thanks to satellite imagery or open source geographical information. The deduced graph from those estimated locations may not be exactly the same as the proper graph but it can be close enough to allow to target some truly risky households.
Conclusion
We developed a new method which can handle complex geographical differencing problems and which is able to run quite rapidly. Nevertheless, our method has some limitations. It is intended to work only on data being disseminated on two, and only two, zonings. It won’t work if the data are disseminated over three or more zonings (even though one can detect observations at risk by considering all the couples of zonings, but it will not ensure that all the risky observations have been detected). Moreover to be applied properly, the method needs some assumptions on the data which are being disseminated. The first assumption is that the same data are disseminated over the two zonings, otherwise it won’t make sense to difference the zonings. If the data are not exactly the same, but are very correlated (for example if a variable X, before being disseminated in the second zoning has been processed in some way), our method is still of use, but it won’t be able to distinguish between the differencings which will lead to infer true information and the differencings which will lead to infer only approximate information (because of the non strict equality of the X’s over the two zonings). Furthermore, differencing can jeopardize statistical secrecy if the data underlying the dissemination of information are comprehensive. If the values disseminated over the different zones are the result of an estimation from a sample, the method cannot determine which differencing will lead to some confidentiality leak. Finally this method does not take other confidentiality risks into account.
It can be argued that pertubative methods such as randomly swapping observations or adding some random noise to the data provide enough protection even for the differencing problems. But this is not so easy to assess. Some perturbative methods add noise only to specific observations that are targeted “at risk” before the data dissemination. If the differencing risk is not taken into account in that global risk, one may not consider that the perturbations are protecting the observations from differencing. So in that case it remains important to target the risky observations because of the differencing technique. Moreover, even if some random noise is adding to all the observations, one cannot infer the level of protection it provides to observations at risk because of differencing. It may be a good enough protection as well as it may be under the security expectations. In any cases, it seems useful to target the observations at risk because of differencing in order to assess their level of protection.
The diffman R package
An R package, named diffman, has been developed to implement the proposed methodology. The main function of this package takes as an input a database with all the observations with two variables: one indicating in which area of the first zoning the observation belong and the other one indicating the area of the second zoning. The output is a data table with all the risky observations and it indicates the encompassing and encompassed areas leading to the differencing problems. The package is freely available on the CRAN.
Footnotes
Acknowledgments
I wish to express my gratitude to my colleagues from the methodological department at Insee. I especially thank Marc Branchu, Vincent Loonis and Patrick Sillard for their enriching remarks and conversations which helped me to achieve this work. I also thank Arlindo Dos Santos and François Sémécurbe for their C++ code which allows to test all the subgraphs smaller than a given size. I also would like to thank Hicham Abbas for his precious help for the proofreading. Obviously, all the errors in this text are entirely my own.