





Abstract
As societies evolve through the data revolution, it is important that National Statistical Offices (NSOs) continue to devote efforts to fine-tune their approaches to maintain the vital trust they need to operate successfully. To do this, they must constantly re-invent themselves to remain relevant to new data needs and keep up with their high-quality standards. With new sources of information surfacing both in the public and private spheres, options are multiplying for NSOs to design new ways to gather and grow the data into information. As this is happening, new practices and new issues are emerging throughout the data life-cycle process. Operating beyond the sample survey paradigm, NSOs see themselves confronted with the need to anchor their new approaches in solidly defined and defendable frameworks. Further, as new data themes, methods and sources are considered, transparency becomes a central issue. Using Statistics Canada’s data life-cycle management model, this paper illustrates how the scientific approach can be leveraged to make transparency more explicit both in projects and management.
Introduction
Official statistics are a mirror of society as they shed light on so many aspects of our social, economic and environmental contexts. As they produce information, National Statistical Offices (NSOs), must do so in a manner that is exemplary enough to generate the trust they need from society to be effective. This is not a new feature of NSOs [1] but the information eco-system has significantly shifted since the coming of the data revolution [2].
New methods are being developed, new data sources are emerging and the traditional parts of the business model of NSOs are evolving almost daily. As a result, there are new approaches either used, tested or contemplated throughout the data life-cycle.
With society becoming more complex and increasingly digitized, transparency is more needed, and in fact requested more than ever by citizens. Transparency is a key enabling piece of trust and accountability. It is beneficial to both social acceptability and scientific integrity and is an integral part of quality processes.
To ensure that the information produced be of good quality for decision-making, it is crucial that methods, approaches, guidelines continue to evolve and serve as solid anchoring points. This has the direct benefit of providing frameworks for quality and rigour. It also paves the way for provision of more complete information on methods to the public and users, hence increasing the transparency that is essential to build and maintain trust in the statistical system.
One such framework is the set of legal instruments with which an NSO operates. In Canada, this is centered on the Statistics Act [3]. It provides the foundation for official statistical activities. Other frameworks exist for quality and transparency such as the United Nations National Quality Assurance Framework (NQAF) [4], the European Statistics Code of Practice [5] or Statistics Canada’s Policy on informing users of data quality and methodology [6] as well as for standards and other statistical activities. In all cases, it is important to have solid frameworks on which to stand, whether it is for subject matter, methodology, standards, governance, data stewardship, communication or any other area of expertise.
Two such frameworks are considered in this paper: the scientific approach and the data life-cycle model. After a brief description and discussion of transparency in Section 2, Statistics Canada’s data life-cycle model is first presented in Section 3 to provide a simplified illustration of statistical processes and a backbone to the next part. It is then followed in Section 4 by a version of the scientific approach that is enhanced to facilitate transparency. Section 5 concludes.
Transparency
Transparency is the quality of an object or process through which one can see. The definition can be quite fluid and mean a number of things depending on the context, but in the world of Official Statistics, it means that approaches, methods, decisions, and information are made available to users, researchers, stakeholders and citizens. For example, Statistics Canada is committed to openness and transparency and is equipped with a number of mechanisms and tools to pro-actively realize it [7].
The benefits of transparency are multiple. On the social side, it can provide recognition and it supports accountability. On the scientific side, it provides a foundation and directly contributes to replicability and reproducibility. In terms of management, transparency favors a more conscious decision-making process. The Secretary-General of the OECD [8] states that “Openness and transparency are key ingredients to build accountability and trust, which are necessary for the functioning of democracies and market economies”. Finally, accountability and transparency constitute the third United Nations’ fundamental principle of official statistics [9].
Transparency can be both internal to the organization and external. Internally, it relates to information provided to employees, it dwells on peer-review processes and pro-actively informs on decisions and decision processes. Externally, it can refer to the legal basis as well as to informing and engaging with the public through communication to favor trust and to show the added value of activities of the organization.
Transparency has evolved from being perceived as a constraint to now being an enabling tool. Organizations have equipping themselves with transparency strategies. A comprehensive example is that of the World Trade Organization [10]. Since the advent of internet and with the data revolution, transparency strategies have evolved and adopted more modern practices. It is now pro-active, it is about opening much more than in the past, it is about going beyond legal requirements, and it is about consulting and engaging – not only communicating.
An important question is how to set up transparency and organize it so that it be not only enabling all other activities but being itself justified and standing on solid grounds. We argue with examples that the scientific approach, as presented in this paper, provides such a solid ground. The next section concisely presents main parts of the data life-cycle where transparency can be increased with a more explicit use of the scientific approach.
Statistics Canada’s data life-cycle management model
During the last 10–12 years, much effort has been devoted to the development of reference models and standards that represent the business process of NSOs. Most notably is the Generic Statistical Business Process Model (GSBPM) produced by the High-Level Group for the Modernization of Official Statistics (HLG-MOS) under the United Nations Economic Commission for Europe [11]. In other areas such as the world of Geographic Information Systems (GIS), there is a well-defined data life-cycle model [12] where the elements are collection, management, analysis and dissemination.
When considering survey data, administrative data (from public or private sectors), satellite/GPS/Sensor data and big data, Statistics Canada has been using since 2017 the simple yet highly illustrative data life-cycle management model shown in Fig. 1 jointly with the GSBPM. It is based on the ideas that the main activities are that of gathering data, guarding them, growing them and giving them back to society in the form of information. It is noteworthy that when considering other representations of the data life-cycle, others used more groups (Plan, Acquire, Process, Analyze, Preserve, Share) [13] or fewer groups (Collection, Access, Analysis) [14] but all essentially consist in the same underlying activities. A very detailed and complete model is presented in the context of curation [15], showing that data life-cycle models are not only in the field of official statistics.
Statistics Canada’s gather-guard-grow-give model.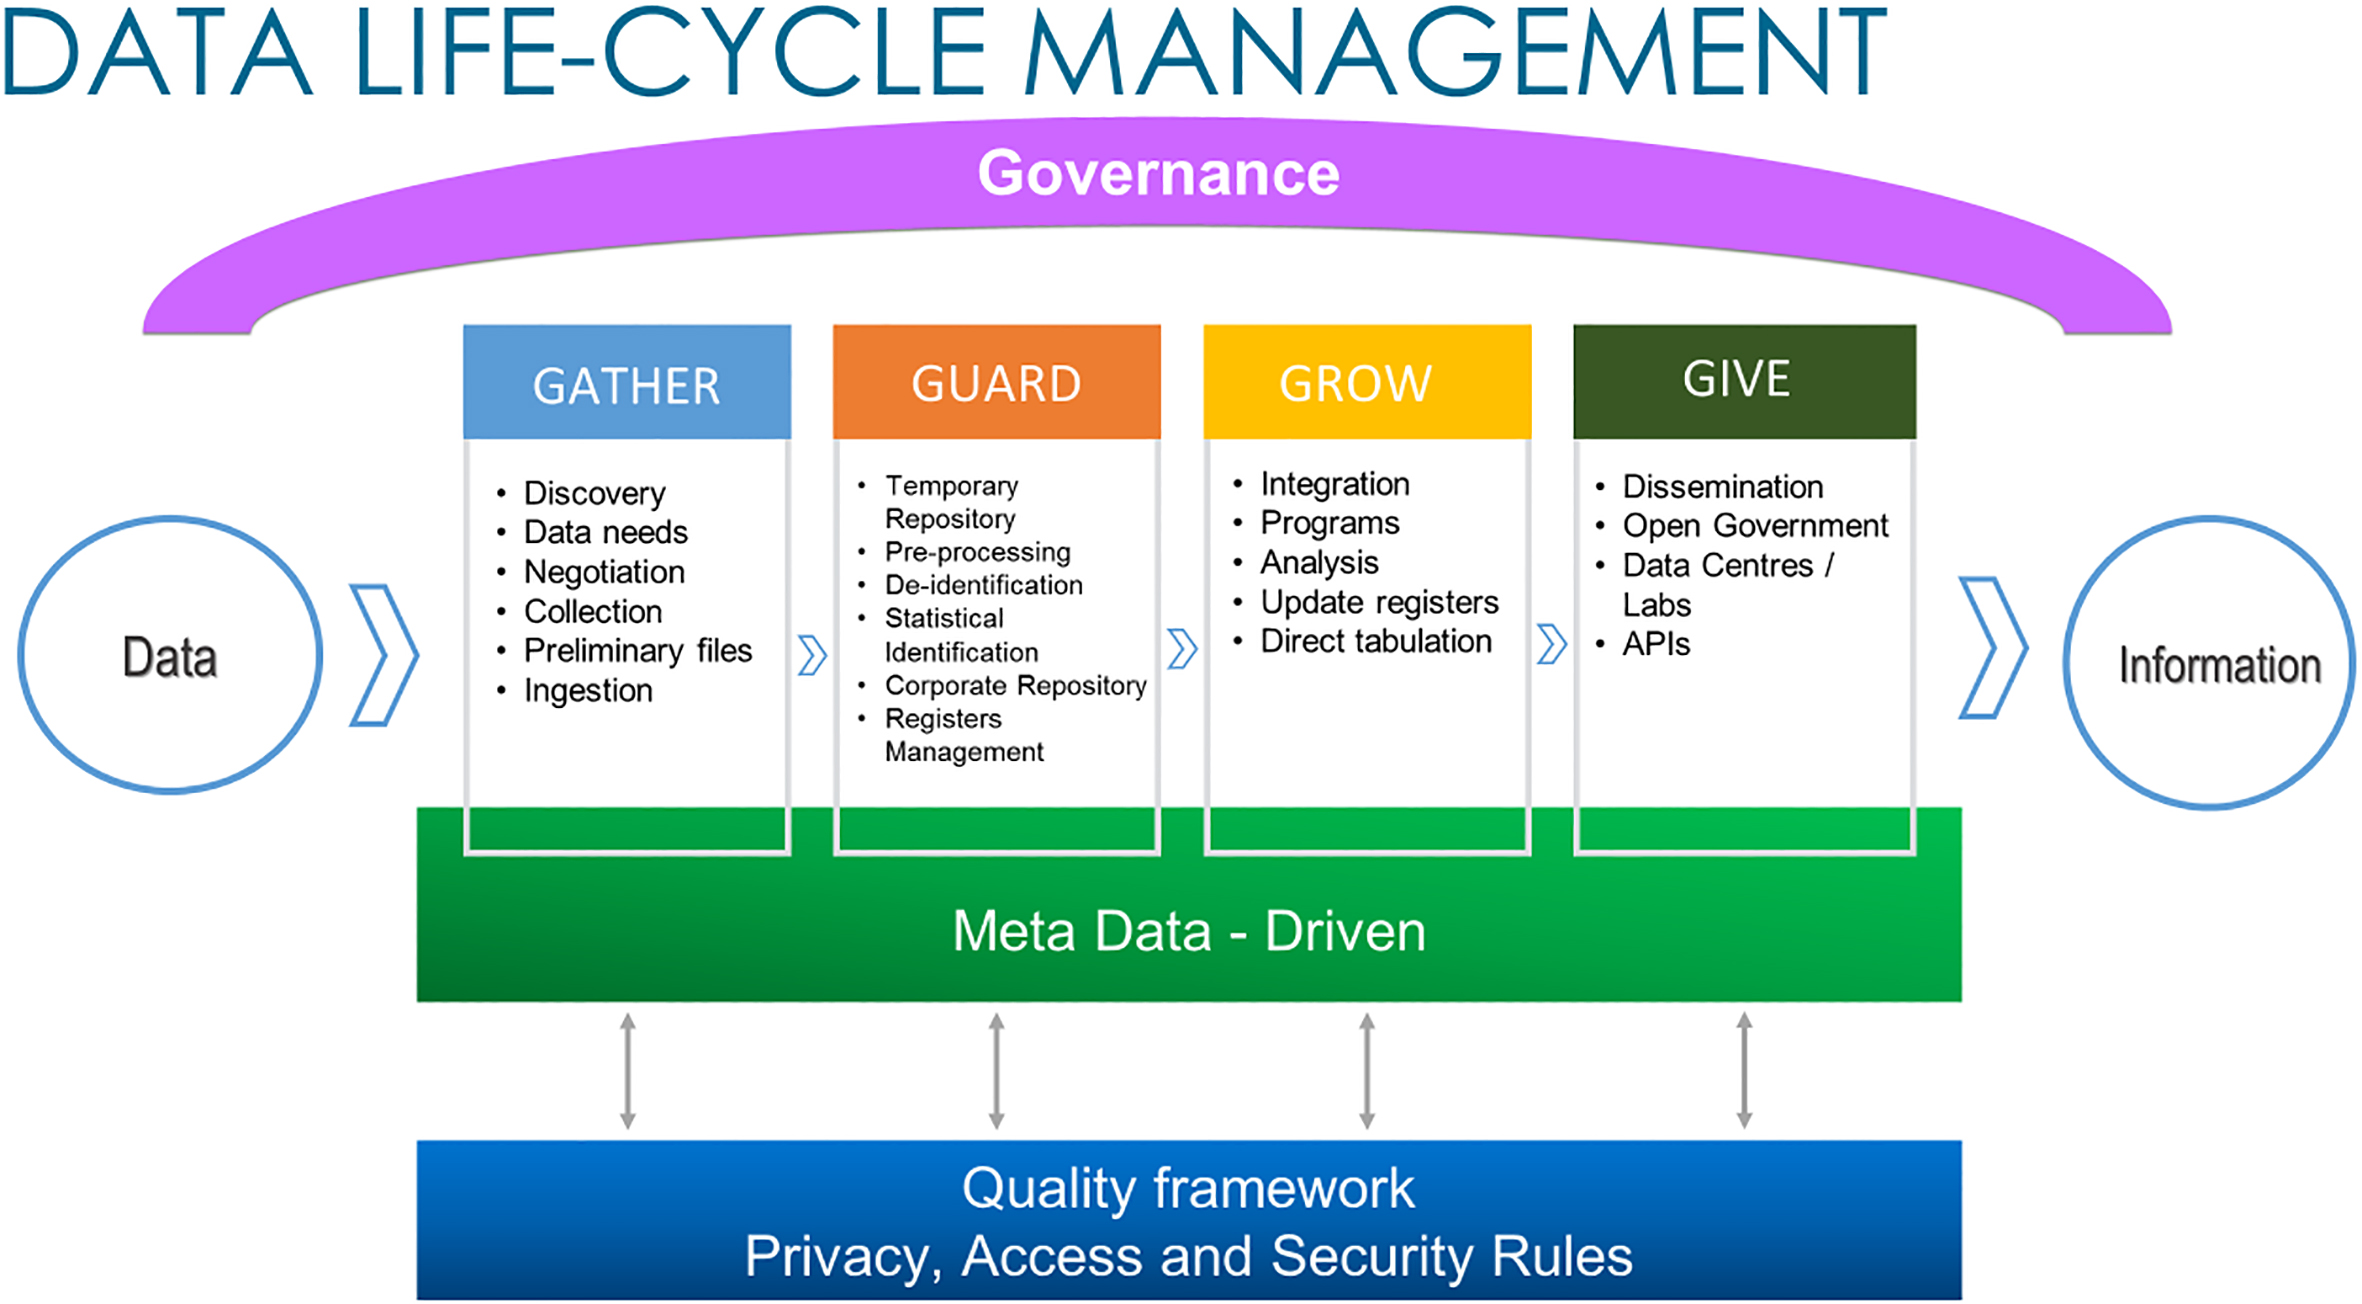
While Statistics Canada’s model was conceived primarily for the context of statistical activities and having in mind to remain true to the adopted GSBPM, it was adjusted and finalized to ensure that it be much more general than simply for statistical purposes. For example, it could be used to represent data flow in the context of data used to provide a service to citizens (e.g. passport delivery), to monitor processes or for regulatory purposes (e.g. food safety). Its final version is similar to that of the United States Geological Survey [9] but in that case, more emphasis is put on data preservation. In the end, the selected representation of a data life-cycle model depends on the level of abstraction and simplicity desired.
At Statistics Canada, the model has been increasingly used to group activities in planning and also to serve as a common language to better categorize activities between input, throughput and output. Further, the Information Technology (IT) architecture team is using the model to guide the overall prioritization for the development of capabilities and the data management branch as well as the methodology branch have re-structured themselves along its lines. For example, a division is responsible for gathering administrative data; a division is responsible for statistical infrastructure corresponding to the guard part and two methodology divisions are mainly involved in the grow part, one for economic statistics, one for social statistics.
Data, as defined by Statistics Canada [16] are “observations that have been converted into a digital from that can be stored, transmitted or processed and from which knowledge can be drawn”. However, citizens, analysts, researchers, decision-makers, service providers, etc. need information to perform their activities. The data life-cycle management model is a high-level representation of the parts and principles that are involved in this process. It purposefully attempts NOT to include any specific characteristics of the business process and NOT to include any aspect related to the IT architecture. In this manner, it can be applied more broadly to a variety of business processes and it leaves freedom to IT architects who are developing structures and then solutions.
Governance
Above and beyond the data life-cycle is governance. The model needs to be acknowledged and supported by senior management. As well, it should have a committee that oversees it or a line manager in charge of it. This step includes the decision structure, the vision and principles that are involved in the data life-cycle as well as the management structure, roles, responsibilities and supporting documents such as policies, directives and guidelines.
Gather
When a need to produce information arises, the first part is to identify and/or discover the necessary data that are required as an input. Then, through collection or negotiation, a system is developed to ingest such data and pass it on to the next part.
Guard
As data flow into the system, they are stored in a temporary repository and made ready for pre-process-ing. Data are then de-identified to ensure secure use by a greater number of actors and an internal identifier can then be assigned. This allows for storage of the data into a corporate repository that can be accessed by analysts and other people involved in the next parts. This is also where parameters for preservation and disposition are determined and implemented.
Grow
Once data files are available in the corporate repository, they can be used by the various statistical programs. In some cases, the information may come from surveys while in other cases from administrative files. These files are usually processed through editing and imputation, followed by estimation and tabulation. Much of the work usually conducted by methodology after collection is part of the Grow step. This step is also where subject matter specialists and researchers conduct their analysis. Data integration through record linkage is also an important set of activities included in this step.
Give
Once information has been produced from the data, it can be disseminated to the public. This takes place through Statistics Canada’s web site as well as the Government of Canada open data portal. Information can also be made available to researchers in the form of public use microdata files, or through research data centres.
Metadata
To enable full knowledge of the data files under its stewardship, statistics Canada ensures that information on the data (metadata) is kept and managed. Data files inventory systems are in place to provide employees the information they need to carry out their activities in all parts of the data life-cycle.
Quality
Handling and processing data are activities that can be carried out using various software, algorithms and methods. However, the key to producing information that will enable users to draw valid conclusions is to ensure that quality be at the centre of all activities. There are many aspects of quality and so it is important to develop and/or adopt a quality framework [4] that guides how data are gathered, guarded, grown and given.
Privacy, access and security rules
Solid data stewardship is anchored in explicit privacy protection methods and well-articulated Information Management (IM) practices as well as (IT) access and security rules that are in place for all parts of the data life-cycle. For example, data are encrypted in transit on their way into Statistics Canada through a secured transfer protocol, stored in a secured environment where there is another mechanism for encryption at rest.
Having presented the data life-cycle model, we can now turn to the scientific approach and see how it can be applied to the various parts of the model.
The scientific approach
Scientific principles are part of the United Nations Fundamental Principles of Official Statistics (Principle 2) [9]. While they form the basis of the work at Statistics Canada, they have been enhanced and made more explicit in programs (for example in the methodology branch). This section presents the scientific approach and how Statistics Canada has enhanced it to improve transparency and strengthen integrity throughout the data life-cycle process.
The basic scientific approach
Application of the scientific approach in Official Statistics means that a series of steps are followed with discipline to ensure that rigour and defendable approaches are used both in statistical programs and in management practice. Figure 2 shows the steps of the approach that are summarized as follows:
The basic scientific approach.
Needs: A problem or issue is identified and requires data to be examined/collected or a decision to be made; Observation: Existing or passed data are analyzed, the literature and previous approaches are studied, and available methods are considered; Hypotheses: Hypotheses are formulated and/or a design is elaborated with the intent of testing a certain option; Test/Do: A test is conducted on the first iteration, and possibly in more than one, and then the approach is implemented; Analysis: Results are studied, and conclusions are drawn; Communication: Findings are documented and communicated to peers and open for constructive criticism; Iteration: The process is iterated after the test for subsequent tests or for implementation. The information and conclusions drawn from an iteration are used as observation that feed the next iteration.
This approach has been serving Statistics Canada well, but with the important increases in possibilities to gather and integrate data, it was found to be not entirely sufficient. As a result, the model needed to be expanded.
While the scientific approach has provided a good general framework, it has been found that in research projects there is often a need to consult and communicate more widely and much earlier than after testing. Indeed, after hypotheses have been formulated, there is often much benefit in exposing them to experts/academics to seek guidance before committing on tests (that could be costly or sensitive). Further, as NSOs embark in new and innovative practices that may not have social acceptance, it has become more important to communicate and engage with citizens in all parts of the process. Further, with the data revolution, there needs to be faster iterations, more tests, and new issues; all reasons to increase communication and update the approach.
The scientific approach was therefore enhanced to reflect these points. As a result, a check point was added to consult in order to ensure that the rest of the sequence is more viable and appropriate. Further, communication is now encouraged and present in all steps of the process. Figure 3 illustrates the new sequence of steps with the check point added as defined below:
The enhanced scientific approach.
Needs: A problem or issue is identified and requires data or a decision; Observation: Existing or past data are analyzed, the literature and passed approaches are studied, and available methods are considered; Hypotheses: Hypotheses are formulated and/or a design is elaborated with a view to test; Check point: Once hypotheses and a design are developed, a pause is made to ensure risks, sensitivity, ethics, legal or other considerations such as proportionality of the effort needed with respect to needs are adequately considered; Test/Do: A test is conducted on the first and possibly in more than one iteration, and then the approach is implemented; Analysis: Results are studied, and conclusions are drawn; Communication: Findings are documented and communicated to peers and open for constructive criticism after analysis, but also throughout the process; Iteration: The process is iterated after the test for subsequent tests or for implementation.
This section presents how the (enhanced) scientific approach can be followed using examples taken from the data life-cycle model. The scientific approach might seem to be more naturally applicable to the grow part where statistical methods are more likely to be tested, developed and used but it applies to all parts. Hence, we start by illustrating how it applies in general to the Governance of statistical programs as a whole with Statistics Canada’s modernization, followed by a typically non-statistical part (gather) and then the grow part. As will be seen, the framework can be used for statistical methods, for management as well as for more operational activities.
Governance – Statistics Canada’s modernization
Over the last few years, society has evolved to become a digital world where data is a center piece to decision making in everyday life. Nowadays, people provide and receive information through their cellular phones and other devices on a continuous basis. This data revolution has dramatically altered the statistical landscape and left NSOs with little choice but to change their methods of operation. As the traditional approaches are not sustainable to meet information needs in a rapidly changing environment, Statistics Canada has embarked on a modernization agenda [17] built around five pillars:
A more user-centric approach to data needs; Increased and much more dynamic collaboration with partners; Using leading-edge methods that will enable the use of new types of data; Providing capacity-building support to other actors of the national statistical system; A modern workforce and workplace that are suited to the times and more flexible to changing contexts.
This agenda was implemented through pathfinder projects aimed at adopting new approaches to producing information, all the while moving forward in order to learn by doing. Four program areas have been identified as pathfinders:
Measuring aspects of cannabis consumption (in the pre- and post-legalisation context); Producing housing statistics (based on administrative data from cities integrated with information already available at Statistics Canada); Enhancing the measurement of tourism-related activities (using non-traditional data for levels of expenses and movement of people); Increasing the output of statistics to better assess low-carbon economy (by better integrating more sources of data).
These ground-breaking programs have all been undertaken and the results each has produced have significantly contributed to paving the way for Statistics Canada’s modernization in various other areas.
We present below a brief outline of the scientific approach to the modernization agenda for Statistics Canada to illustrate how it is implemented (not within a given division, but globally throughout the organisation):
Needs. As society is rapidly changing and becoming increasingly complex through the data revolution, there are new needs for real-time and more granular information to be released. Observation. Statistics Canada has conducted an environmental scan to assess the current state of data needs, the pertinent stakeholders, the activities of other NSOs and academics as well as the types of data that are already available. Hypotheses. A modernization strategy was developed to focus on user-centric service delivery based on such pillars as leading-edge methods and data integration; statistical capacity building and leadership; sharing and collaboration; a modern workforce and a flexible workplace. The hypothesis (verified since then) was that modernizing statistical programs in this way would improve several aspects of Statistics Canada such as relevance and timelines. Check point. The strategy was discussed in committees within Statistics Canada as well as with other departments, the Minister of Innovation, Science and Economic Development and with other national statistical offices. Numerous and broad consultations took place. Finally, a strong governance was put in place with a modernization head and a modernization steering committee. Test/Do. Four pathfinder projects were identified to test the modernization agenda. They were the measurement of cannabis, transition to a low-carbon economy, international tourism to Canada and foreign-owned housing. Tests also involved new leading-edge methods such as modelling in the form of projects involving small area estimation or machine learning, to name a few. Analysis. Lessons learned were studied and a decision was made to continue and expand modernization based on intelligence gathered by the pathfinder projects. These projects were actual live tests and the information obtained through them was used and published. The quality was assessed and as these were but one iteration of a larger process, some estimates (for example in the case of the housing program) were only produced for two large cities with a view to expand the scope in subsequent iterations of the project. Communication. Employees have been fully informed during the process as were also stakeholders, decision makers and Canadians. For example, an internal modernization bulletin is regularly issued to keep all employees informed. Communication is not limited to the “communication” step as it needs to be pervading through the entire process. For example, discussion taking place with subject matter specialists may lead to new projects being launched. Or, once a set of hypotheses have been formulated, discussion among peers and external experts ought to take place. The check point is, by definition, a communication process and the test will involve planning requiring careful/effective communication. Further, this is an important aspect of transparency. Results are not communicated at the end of processes to Canadians but much earlier. With the creation of a Trust Centre on its Web site, Statistics Canada can inform the public on its activities as they take place. Iteration. Now that the pathfinder projects were successfully accomplished, the modernization approach has been expanded to many more programs. As well, lessons learned related to new methods (e.g. machine learning) and new approaches (e.g. housing program based on no survey data; only administrative data) are promoted to other statistical programs.
Gather – Using new types of data in statistical programs
As Statistics Canada progresses through its modernization, it is moving towards an admin-first par-adigm [18] which will require more use of new data types from a greater variety of sources. Some of these sources are the private sector and the web. The following highlights some of the issues of the Gather part of the data life-cycle as we apply the scientific approach.
Needs. While Statistics Canada does have provision in the Statistics Act and has been using data from the private sector for many years, new needs call for types of data that are either not available through traditional means such as surveys or already exist somewhere outside the traditional pool of administrative data within the government. Observation. Under the admin-first paradigm, it is now the instinct of program managers and analysts to try to discover and consider already-existing data sources. Numerous contacts with other NSOs and organisations are made to collaborate on how such data can be incorporated into estimates. As well, the literature on how to use and incorporate data from non-random sources is expanding. Statistics Canada actively consults and contributes to this body of information. Hypotheses. One of the main benefits of new types of data (for example from the private sector) is that they could contribute to improving timeliness and comprehensiveness faster and at a lower cost than surveys. However, there could be issues related to biases and coverage and so there is a need to use or develop the theory. Some strides have been made on the theoretical side [19], and combined with observation, practice and use these limitations will be further apprehended. Check point. In the traditional approach to producing statistics, this step was not as explicitly considered as it is now for the use of new types of data. Questions that are posed at this step are related to the ethical use of the desired data. If this is established, it is necessary to determine if the new type of data could be striking a sensitive chord with the public (e.g. sensitive personal information). In this case, there could be a need for increased communication and/or engagement. Gathering of data that are deemed sensitive needs to be cleared through the appropriate governance mechanisms. Finally, it may be necessary to ensure that the extent to which such data are accessed be made proportional to the importance of the need. Test/Do. As data gathering may involve sensitive information and/or types of data or files that have never been processed, it is necessary to proceed in incremental steps by testing the operational feasibility, assessing the quality of data, conducting a pilot and then actually having access to the data. Each of these steps is informed by the conclusions from the previous iteration. Analysis. Lessons learned are studied and a decision is made to continue and expand the access based on information obtained. As well the data can then be pre-processed for subsequent use by the programs who will make the data grow into information. Communication. Throughout the gathering activities, there is on-going communication between Statistics Canada and the data provider. In some cases, it may be necessary to engage the public to ensure transparency and obtain inputs to improve the approach. Further, as this often involves information about people, the Office of the Privacy Commissioner is a major partner in consultation, guiding Statistics Canada in the development of solid privacy impact assessments and developing and implementing statistical and security methods that are commensurate to the levels of sensitivity of the data needed. Iteration. The typical route taken be data gathering activities is that there will first be an operational test, followed by a data analysis test to understand the data and their quality, followed by a pilot. Once each step is deemed successful, then the next step starts. When data are fit for purpose, the process is fully launched to gather all the data needed.
Grow – Developing methods for statistical programs
At Statistics Canada, methodology services are centralized in a branch where expert resources are assigned to support projects. This enables the development of consistent methods in surveys and facilitates knowledge exchange between experts working on different programs. Still in this structure, there are numerous interactions with subject matter experts and other specialists.
Whether the work is oriented towards research, development or production, in all cases the scientific approach is followed. This approach has traditionally been implicitly imbedded into the practices, but substantial efforts are deployed to make the approach even more explicit. The aim is not only to increase transparency but also to actively promote rigour through a consistent principled-based approach. Concretely, the scientific approach materializes itself as follows:
Needs. A proactive approach, focusing on user needs and dwelling on prospective work to identify needs sooner than before, has been increasingly adopted in the wake of Statistics Canada’s modernization and methodology vision. This allows experts to gain a head start in the application of the scientific approach. Observation. In methods development, this often takes the form of a literature review, accompanied by research on what was done in the past for the same or similar programs and how international colleagues have approached the issues. It may also involve conducting descriptive analysis using prior information from surveys or administrative files. Hypotheses. Based on the evidence obtained from prior information, from the literature, methods are developed and planned. This may require development or extension of methods; it may also involve the adoption of already-existing methods or an adaptation of these. Check point. Once hypotheses are formulated and plans are established, the approach/method is presented to an internal scientific review committee and, when appropriate, to Statistics Canada’s Advisory Committee on Statistical Methods (ACSM) for further guidance. Depending on the impact and the reach of the method, it may also be presented to a subject matter steering committee, an external subject matter advisory committee and/or a senior management committee. These committees provide the breadth and depth needed for scientific, practical, management, ethical and social appraisal. In some cases, such as questionnaire design, data collection or record linkage, ethical and social issues might call for a more explicit or comprehensive outreach to citizens or organizations such as NGOs. Test/Do. It is part of best practices to test the approach on a small scale in order to gather further information that will be used to refine the hypotheses. This could mean conducting a pilot, producing a beta version of a computer program, or conducting simulation studies on real or artificial data. If a first iteration of the scientific approach has taken place, then this step can be the actual implementation of the method. Analysis. Study of the results (from a simulation study or from a pilot) takes place and decisions are made. At this step a method is selected over other options and implementation can begin. Communication. The methods implemented are documented and shared with colleagues as well as subject matter specialists and program managers. In some cases, research studies, methods and findings will lead to an internal working paper or be submitted to a conference or a refereed journal. Iteration. Normally the first iteration is a test and the second one is the implementation of new methods. This would normally mean that methods developed by methodologists are then transferred to the production side. However, there could be more than one iteration before this takes place.
Application of the scientific approach takes place regularly throughout Statistics Canada. One could consider numerous activities such as price index development, production of national accounts and field and processing operations, IT development and even HR, Finance and Communications as a non-exhaustive list where the scientific approach is applied or could be more explicitly applied.
By increasing communication and by making documentation available throughout all steps of the scientific approach, statisticians are increasing transparency and hopefully building and/or solidifying trust in the statistical system.
Conclusion
The scientific approach is increasingly used more explicitly within Statistics Canada. It was first made a formal framework within its methodology branch [20] for the development of statistical methods and management activities and then for all Statistics Canada’s programs. Such a framework provides a solid backbone for all activities and enables statistical and managerial activities to be rigorous, transparent and defendable. As a result, it contributes to maintaining or increasing trust. Adaptations of this framework could be used by other NSOs to support their own practices. This can have a positive influence on the level of trust they inspire through transparency.
Footnotes
Acknowledgments
The author would like to thank Gabrielle Beaudoin, André Loranger, Guillaume Rochefort-Maranda as well as the Editor and a referee for their invaluable comments. The author also wishes to thank Stéphane Dufour, Claude Girard, Andrea Leigh MacMillan, Claudia Sanmartin and Nora Taki for their comments on an earlier version of this paper.