





Abstract
The French population census method evolved in the early 2000s. Few studies have been published on the quality of the population estimates produced by this new method, apart from a few observing sample variance resulting from the introduction of a survey in large municipalities. However, the French census is subject to numerous quality controls throughout the process: development of a housing register, preparation of the collection, the collection itself and the post-collection, adjustment and estimation operations. The extensive involvement of stakeholders (municipalities and INSEE) in the preparation and conduct of the census leads to a very good understanding of the process. The many checks carried out throughout the process guarantee that the estimates produced are of a high quality. In addition, the census benefits from a very low non-response rate (3.9% in 2019). However, some features are not yet well known. Although many instructions are included in questionnaires, the answers given by enumerated persons are imperfect due to misunderstandings, an inability to adapt questions to real-life situations, or deliberately incorrect answers.
Keywords
Introduction
The French population census method evolved in the early 2000s. After the most recent exhaustive census of French territory carried out in 1999, INSEE set up a five-year rotating census, which consists of conducting an annual census survey over part of its national territory. Two municipality categories are to be distinguished. Municipalities with a population of fewer than 10,000 residents (also referred to as “small municipalities”) are exhaustively surveyed every five years. Municipalities with a population of more than 10,000 residents (“large municipalities”) are surveyed each year on the basis of only select housing. Each year, around 8% of the dwellings in each large municipality are surveyed. The dissemination of census results is based on the group of five successive annual surveys.
The population census is conducted under the responsibility and supervision of INSEE, while municipalities are responsible for preparing and conducting the census surveys in the field. In particular, each municipality recruits enumerators.
In-depth information concerning this new census method was produced when the project started (see, for example, [1]). At that time, INSEE had only limited information about the quality of the results produced. Nevertheless, in December 2008, it published a general document on the quality of the population census [2]. In particular, this document addressed compliance with international quality standards (i.e. UN and Eurostat standards) and indicated how quality was managed throughout the process. Since then, INSEE has published several studies on the accuracy of estimates for municipalities with at least 10,000 residents (see, for example, [3]). The sample census is the main novel feature of the rotating census. However, variance of the estimates due to randomness of the sampling is not the only indicator of the quality of results.
The European Statistics Code of Practice [4] is “the cornerstone of the common quality framework of the European Statistical System”. It defines sixteen (16) principles covering the institutional environment, statistical processes and statistical outputs. The Code therefore covers both the quality of the results (relevance, accuracy, topicality, accessibility, etc.) and the process through which they are obtained (suitability of the methodology, management of the burden on respondents, cost-effectiveness).
This document does not intend to analyse the quality of the census in the light of all the principles defined by the European Statistics Code of Practice. It aims to document the robustness, accuracy, and precision of the results produced from the census by describing the implemented process, the quality checks carried out during this process and the comparison with other data sources. It questions three principles: the principle of accuracy and reliability (principle 12), the principle of sound methodology (principle 7) and, to a lesser extent, the principle of appropriated statistical procedures (principle 8).
The population census obviously aims to adhere to the 16 principles. For example, the census has evolved twice in recent years to better meet user expectations (principle 11 of relevance). Changes to the questionnaire have been made in 2015 and 2018, in line with the recommendations of the National Council for Statistical Information, expressed in 2012 in a report on the evolution of the population census questionnaire [5].
The scope of this paper is also limited to the legal municipal population. Future papers may address other aspects of quality or other areas of analysis, such as the quality of estimates of statistical results from the census.
For a general presentation of the population census in France, the reader may first refer to Appendix 1.
This document presents the process through which population estimates are obtained, highlighting the quality checks carried out during each phase. There are different types of checks such as plausibility checks and consistency checks. It also presents the methods used for adjusting data. Quality indicators are also established for different phases of the process (sampling frame, collection, adjustments, etc.).
From the register of localised buildings (RIL) to the calculation of the populations: Quality checks throughout the process
The process of making population estimates involves multiple steps (preparation of the collection phase, the collection itself, post-collection checks, calculations, etc.). To ensure the quality of the population estimates, a series of controls are carried out during the various stages of the population census process. Through the GSDEM (Generic Statistical Data Editing Model), UNECE groups data editing into one of three categories [6]: consistency checks, plausibility checks and unit checks. Consistency checks verify statistical equations (equality, inferiority, superiority) between variables. For example, one consistency check is to verify that the municipal population is the sum of the household population, the communal establishment population (see Appendix 2 for the definition of this), and the populations for mobile housing, the homeless and boatmen. Plausibility checks verify the likelihood of a given data item and most often compare the data studied with the same data from a previous period or in relation to an auxiliary source. For example, to prepare the collection of the population census in municipalities with fewer than 10,000 residents, INSEE carries out checks by comparing the number of dwellings on a given road, indicated in the exhaustive list of dwellings updated by the municipality, with the figure given in the tax database. The unit check is based on the calculation of scores to isolate atypical units. For example, this type of check may consist in identifying units with a strong influence on an aggregate (a strong contribution to the evolution, for example), as this may be the case for some atypical addresses in municipalities with more than 10,000 residents with an average number of persons per dwelling that is very different from other addresses. They can subsequently be the subject of specific processing.
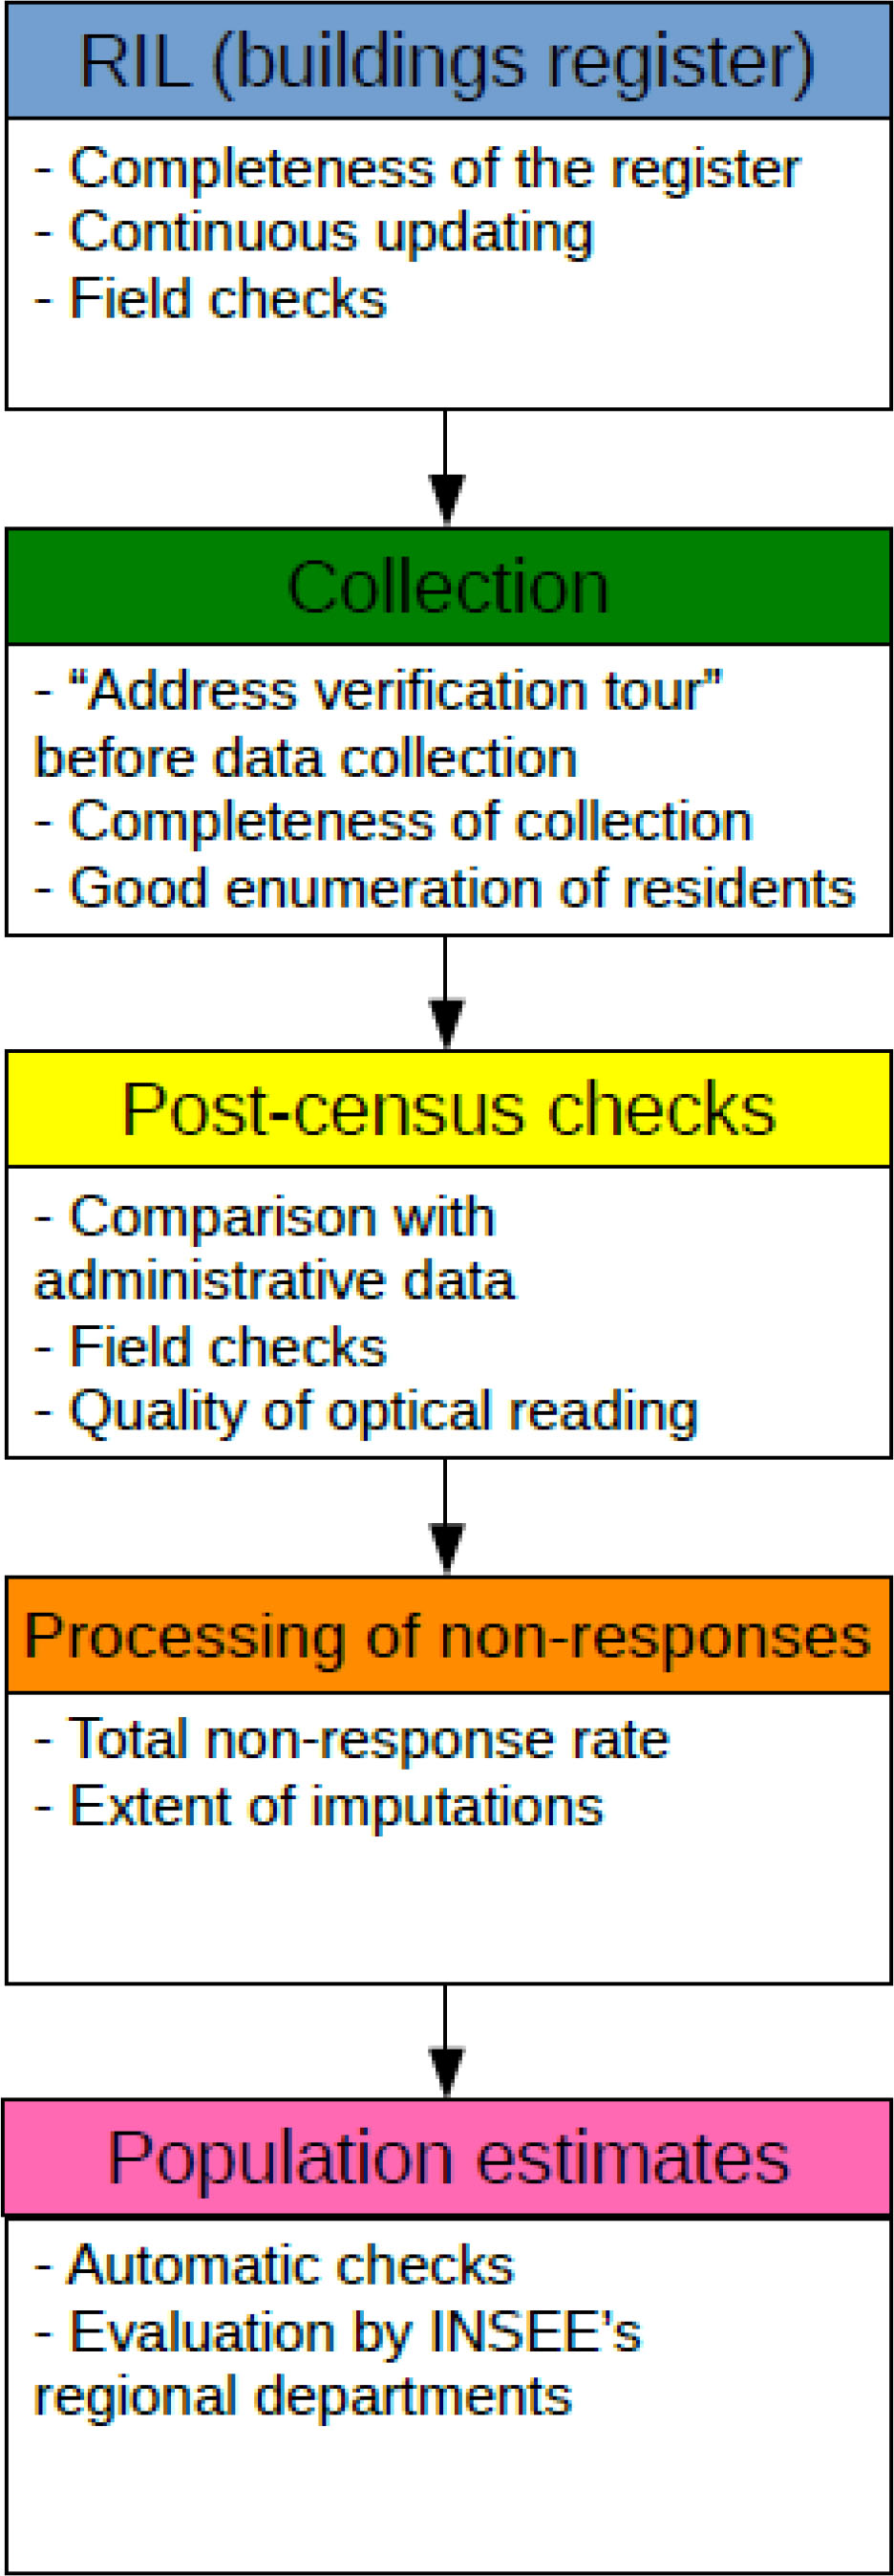
These three types of checks are carried out throughout the process of estimating legal populations. This document reviews the entire process, from the establishment of the sampling frame to the validation of the produced estimates, and highlights the checks carried out during each phase. The main checks are listed in the diagram below.
Quality of the sampling frame in large municipalities: The register of localised buildings (RIL)
Definition of the RIL
The RIL exists only in large municipalities.1 It is the exhaustive list of residential addresses for municipalities with at least 10,000 inhabitants and it includes the number of dwellings at each address. It lists every habitable dwelling in large municipalities, including tourist and communal establishments, as well as the location of these dwellings. It is constantly updated, because this proves useful for three stages of the population census in municipalities with at least 10,000 residents:
Before data collection: It is used to create the address sampling frame (BSA) from which address samples are drawn for the following year’s annual census survey (EAR); During data collection: The RIL enables collection plans to be drawn up. These are processed by the enumerators to help identify the addresses to be investigated and to monitor the progress of the collection phase; After data collection: The RIL allows legal populations to be calculated. It provides the number of dwellings as of January 1.
Update of the RIL
The RIL was created for the first sample census survey in 2004, from documents relating to the exhaustive 1999 census.2 Communal plans were digitised and residential addresses were geo-located. Since then, the register has been updated by INSEE in collaboration with municipalities or public inter-municipal cooperation establishments (EPCI). An RIL correspondent (CorRIL) is appointed within each municipality or EPCI by municipal decree. They are the main contact person for matters concerning the RIL for INSEE.
Since 2016, the RIL has been updated using the Rorcal application, an online tool developed by INSEE that it has shared with municipalities. Rorcal’s mapping tools ensure high quality geo-location of residential addresses. RIL addresses are based on the IGN’s Large-Scale Reference Frame (RGE), a national geographic data infrastructure (cadastral parcels, administrative boundaries, etc.). Each new address is geo-located manually using the RGE, which is available in the RIL management application. RGE calibration allows for the use of different map bases, plans or satellite or aerial views provided by IGN, OpenStreetMap or Google. The Rorcal interface developed for municipalities also makes these easier to manage. Municipalities can easily report any change in the characteristics of an address for instance (e.g. the number of dwellings) or the construction or destruction of buildings. INSEE must validate changes manually whenever they have a significant impact. The municipality can change its RIL whenever this is appropriate, which helps to keep it up to date. In addition to these spontaneous updates by the CorRIL, a continuous update makes use of several sources and results: building, development and demolition permits, integration of census collection results, cartographic surveys (survey of a part of the territory to locate all dwellings, particularly in the overseas departments) and annual RIL-related analysis for municipalities.
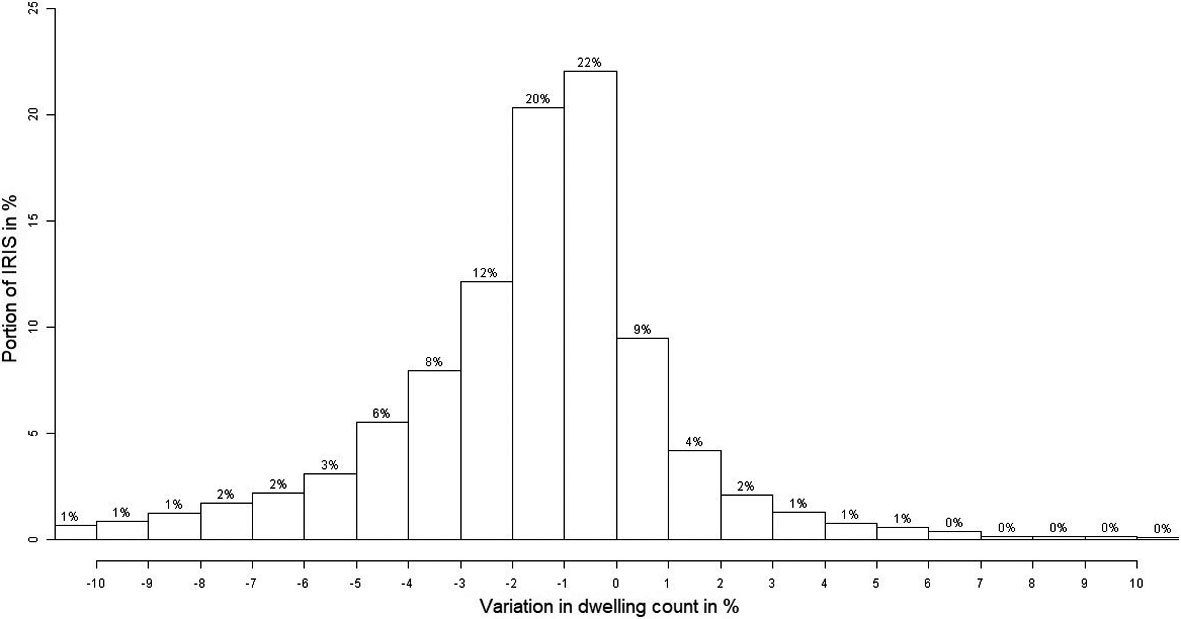
Distribution of IRIS according to the variation in dwelling count in the sample following data collection. Reading Note: for 22% of IRIS, the number of dwellings in the sample drops by less than 1% following data collection. Note: the share of IRIS is calculated taking into account the weight of each IRIS in terms of number of dwellings. Sources: 2015 to 2019 Annual Census Surveys.
INSEE and municipalities share responsibility for the RIL. The updating process described above and the annual analysis of the municipalities ensure that the RIL is complete. This analysis is regulated by Decree No 2003-485 of 5 June 2003, as amended. Municipalities are strongly encouraged to update the register as this has a direct impact on population estimates and therefore their allocation of financial support. Register quality surveys consequently estimate that fewer than 1% of dwellings are missing from the RIL (see Section 2.1.4).
INSEE defined a quality assurance framework in 2016 to ensure that the RIL meets certain objectives, particularly in terms of accuracy, reliability, consistency and comparability.
This RIL quality assurance framework recommends that several quality indicators be monitored.
One of these indicators compares the number of dwellings in every address sampled in the census, both before and after data collection. This helps to identify errors in the RIL, highlighted by census collection. These discrepancies refer to addresses surveyed in the EAR and therefore included in the RIL with at least one habitable dwelling. During the collection phase, it is possible to detect a difference in the number of dwellings (surplus or deficit in the RIL) or an error in the RIL concerning the habitability of a dwelling (a dwelling in the RIL mistakenly recorded as habitable – for example if the dwelling has been destroyed – which would represent a surplus in the RIL). Nevertheless, the data collected cannot be used to identify dwelling addresses missing from the RIL, since, by definition, they are not surveyed by an enumerator. Therefore, this indicator does not allow any conclusions to be drawn with respect to any surplus or deficit in the RIL. However, it does highlight certain quality-related gaps or shortcomings in the RIL.
On average, over a period of 5 years (2015–2019), and on balance, i.e. by quantifying the difference between added and removed dwellings following data collection, the EAR includes 1.46% fewer dwellings than the sample extracted from the RIL. This figure should not be interpreted as a surplus of 1.46% of the RIL, since the habitable dwellings of addresses absent from the RIL are by definition not included in this percentage.
In detail, the difference is irrelevant in most IRIS,3 although it is more than 3% for 18% of IRIS – most likely those IRIS in which analysis have been applied in a less accurate way (see Figs 1 and 2).
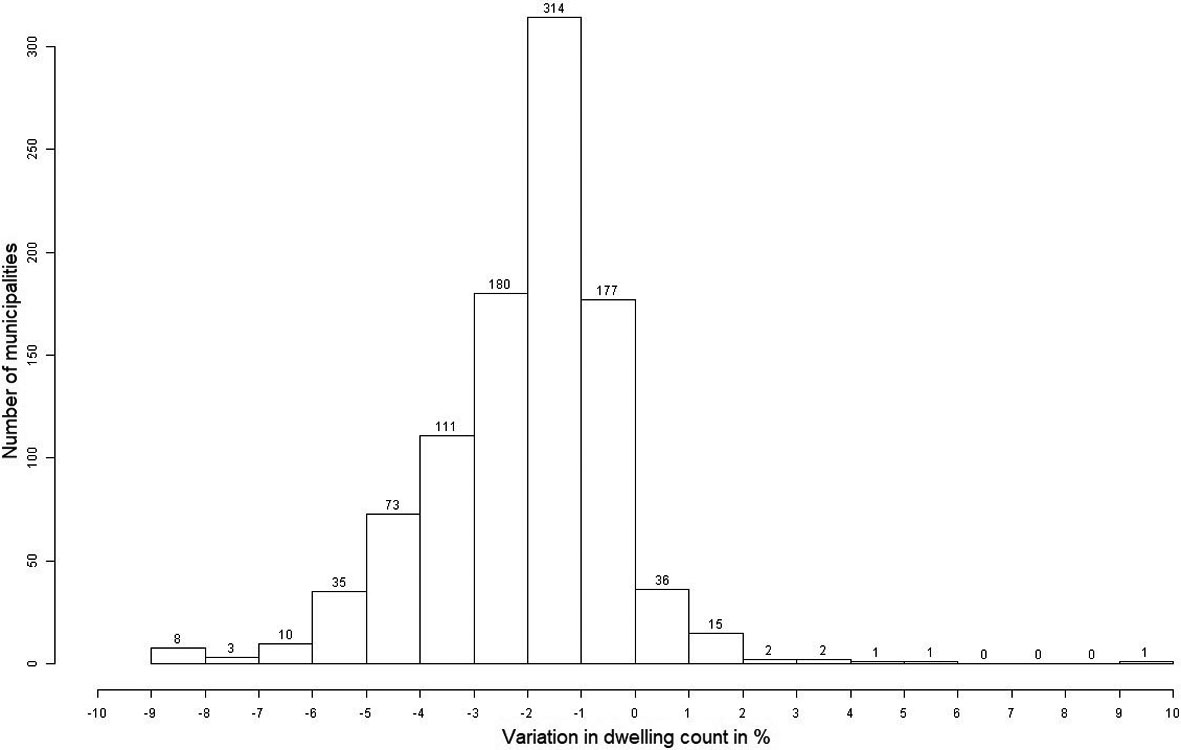
Distribution of municipalities according to the variation in dwelling count in the sample following data collection. Reading Note: in 180 municipalities, the number of dwellings in the sample decreases by between 2% and 3% following data collection. 15 municipalities have an increase in the number of dwellings in the sample of between 1% and 2% following data collection. Note: the label indicates the number of municipalities. Sources: 2015 to 2019 Annual Census Surveys.
Another indicator included in the quality assurance framework is the evolution of the number of dwellings in the RIL, which is split into two parts.
The evolution of the number of dwellings over 5 years in the RIL is initially compared with housing tax data. A discrepancy may indicate that the RIL has not been sufficiently updated or that the management of the housing tax files is having an effect. In practice, the difference between the average annual evolution of the RIL over 5 years and that of the housing tax exceeds 1% for the dwellings of only 23 large municipalities, with 2.2% being the largest result recorded.
The evolution of the RIL over the past year is also compared with that of the previous 5 years. The aim here is to identify breaks in a given trend. These do not necessarily indicate that the quality of the RIL is poor, because a one-year evolution differing from the 5-year trend can be justified, for example when construction programmes come to an end, but this indicator helps to maintain a level of oversight in certain municipalities.
Other indicators refer to the management of the RIL, for example the rate of active municipalities in the Rorcal application, i.e. those that have carried out at least one update during the campaign. This rate was 99.5% for the 2018–2019 campaign in metropolitan France. The high level of this indicator confirms that municipalities use the tool correctly, but it does not allow for the quality of the work carried out to be assessed.
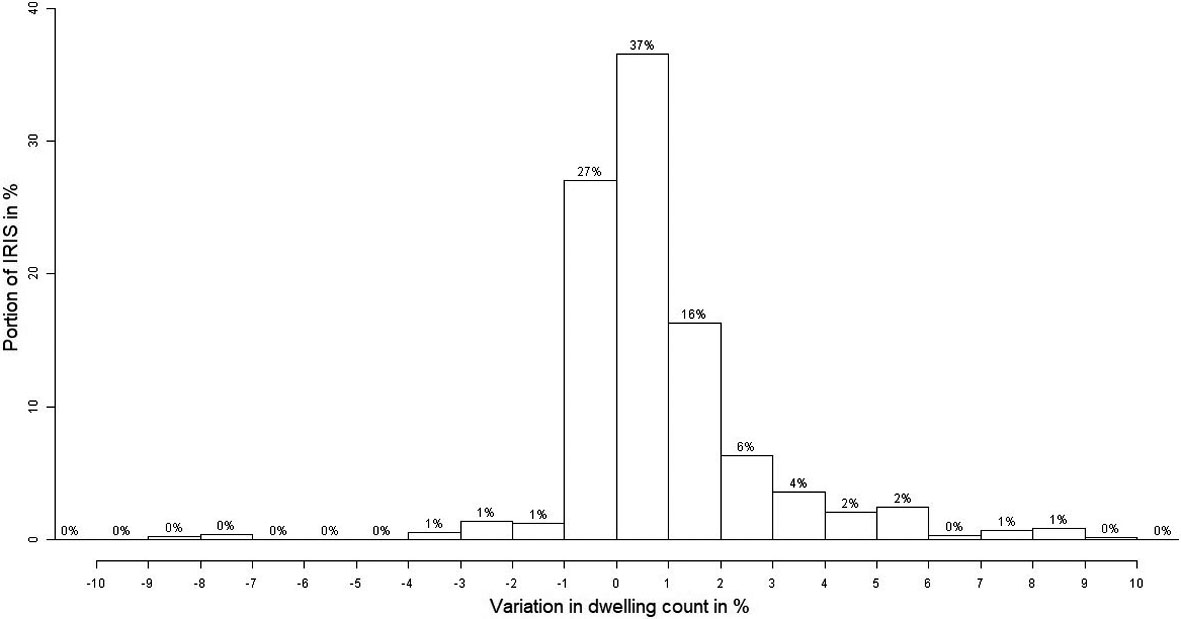
Distribution of IRIS according to the change in the number of dwellings following the EMQR. Reading Note: for 37% of IRIS, the number of dwellings increases by less than 1% following the EMQR. Note: the proportion of IRIS is calculated by considering the weight of each IRIS in terms of the number of dwellings and the sampling rate in each stratum of the EMQR draw.
INSEE conducts occasional field surveys to check the quality of the RIL in a given area. These surveys usually take place between August and December. The RIL quality measurement survey (EMQR) measures the quality of the RIL in metropolitan France and Reunion. To this extent, the selection based on stratified sampling of several IRIS from municipalities with more than 10,000 residents ensures a level of representativeness of the national territory. They are thoroughly scanned in order to identify any discrepancies between the RIL and findings on the ground such as differences in the number of dwellings at a given address or new addresses and destroyed addresses, for example. In particular, these surveys assess, at national level, the surplus or deficit of the RIL in terms of the number of dwellings. In municipalities where errors are identified, those errors are corrected in the RIL.
This section presents only the results for metropolitan France, the territory in which the last EMQR was conducted in 2017. Through a complete scan of a sample of IRIS, INSEE investigators determine the number of habitable IRIS dwellings. Thus, the difference between the number of habitable dwellings in the RIL and in the field is estimated. As this operation is carried out between August and December, i.e. between 1 and 6 months after the validation of the RIL by the municipality, a discrepancy observed between the field and the RIL may be the consequence of a real change in the field.
This survey identifies dwellings that are incorrectly included in the RIL count, inexistent or uninhabitable, thereby leading to an overestimation of the population or a deficit of dwellings producing an underestimation of the population (see Section 2.5). In practice, the deficit is larger than the surplus. In 2017, the following was observed:
The distribution of the balance, weighted by the number of dwellings, shows that there are few IRIS with a high deficit or surplus (see Fig. 3): 10% with a deficit greater than 3%, and 4% with a surplus greater than 1%. Figure 3 represents the change in the number of dwellings following the EMQR, meaning that an increase in the number of dwellings indicates a deficit in the RIL.
Completeness of data collection
The completeness of the collection phase is subject to multiple indispensable steps:
The starting point is an exhaustive and up-to-date list of accommodation. In municipalities with fewer than 10,000 residents in metropolitan France, where the collection phase is exhaustive every five years, the quality of the population count in the field relies on the quality of the identification of dwellings. Enumerators must have an exhaustive and up-to-date list of dwellings in the municipality (whether inhabited or uninhabited). Therefore, six months before the survey (in June), INSEE sends the list of addresses surveyed five years earlier to municipal officials. Municipalities are responsible for assessing and updating this list. During this process, INSEE carries out its verifications by comparing the number of dwellings per municipality, road or sometimes address with tax information. In the event of discrepancies, the municipality will be contacted to explain or correct them. In municipalities with more than 10,000 residents in metropolitan France, the completeness and proper updating of the list of addresses of a given municipality are part of the preliminary work on the RIL (see Section 2.1). Afterwards, every enumerator’s work area or address sample must be clearly defined. When the list of addresses and the associated number of dwellings have been stabilised by the evaluation of the municipality and INSEE, the enumerator checks it once more in the week before interviewing the residents. On the basis of a pre-established list, the enumerator carries out an “address verification tour” in order to set boundaries for their sector and to check that addresses have not been forgotten or overlooked. In municipalities with more than 10,000 residents, the enumerator checks that they are able to identify every address included in the sample. The “address verification tour” also allows for local communication (posting letters announcing the survey, putting up posters in building foyers, etc.). Finally, the tour enables the enumerator to anticipate any potential difficulties. Lastly, residents of each dwelling are counted. The last step is to determine the category of housing and to count the residents of primary residences. The definition of ‘population’ stipulates that residents should be counted only in the municipality of their primary residence. Residents are not counted in secondary residences, vacant housing or intermittent housing.
Criteria for counting permanent residents and self-administered questionnaires
The resident counting procedure follows two successive criteria. First, it must be determined whether the person is eligible to be counted in France. Second, the municipality to which that person should be included must be defined. The method used in France follows UN recommendations (see Appendix 1).
The key concept is “usually resident population”. The “usually resident population” of a country is composed of persons who have their usual place of residence in the country at the census reference time and who have resided (or intend to reside) in the country for a continuous period of at least 12 months. “Continuous period” means that absences (from the country of usual residence) shorter than 12 months do not change the place of usual residence. The same criteria apply to every territorial division in the country.
No matter the response format – online or paper – the questionnaire is self-administered.4 Residents fill in their answers by themselves. The enumerator can inform the respondents if they have questions about the criteria to be considered as a resident of the housing, but they cannot correct choices made by residents. Here, there are two ways in which errors can occur. The first is a voluntary misrepresentation committed by the subjects of the survey. The second is a failure to understand the underlying questions and instructions.
It is important to inform respondents properly in order to minimise these errors. This information begins with a reminder of the legal context and the purposes of the census. In particular, a general statement is made that the anonymity of responses is guaranteed and that individual information collected during the census is never transmitted to another administration. The population census is a survey covered by Act No 51-711 of 7 June 1951 on the obligation, coordination and secrecy of statistics and has a purely statistical purpose. Answers are compulsory and will remain confidential. This specifically means that the paper or online questionnaires are physically destroyed before 31 December of the survey year and that last and first names of individuals are not included in any data files. Nevertheless, they are necessary during collection for completeness checks and after collection for post-collection checks.
Secondly, in order to restrict measurement errors, questions and instructions are formulated in such a way that respondents can be counted in a way that reflects their real situation as closely as possible, under the constraints of ergonomics and space on the questionnaire. On the online questionnaire, a list of situational questions is given, automatically filtering the rest of the questionnaire according to whether or not the person permanently resides in housing.
For anyone not living in ordinary housing (persons without fixed housing or persons living in a communal establishment), the collection procedure is adapted: see Appendix 3.
What happens when someone refuses to answer?
There are three types of non-responses to the survey: long-term absentees, people who cannot be contacted and refusals. In total, the proportion of non-responses is very low; it amounted to 3.9% in 2019, of which 36% were explicit refusals. This non-response rate is extremely low, compared to non-response rates observed for other statistical surveys, even mandatory ones. For instance, the non-response rate for the French Labour Force Survey is about 20%. This very good result is largely due to the close collaboration between residents and organisers in the field (the organising municipality and the enumerator living in the municipality or neighborhood). It is also undoubtedly explained by the convincing arguments made to take part, based on the social usefulness of the survey and the fact that it is compulsory. Finally, the questionnaires are relatively short and the topics covered are simple compared to thematic surveys.
However, this good overall rate conceals a wide variety of situations. In municipalities with more than 10,000 residents, the average non-response rate is 5.6%. In 9% of these municipalities (i.e. about 90 municipalities), it is higher than 10%.
In the event of a refusal, municipalities employ various means: a letter from the mayor, a call from the communal services and a change of enumerator. As the census is a compulsory survey, a €38 fine can be imposed on anybody who refuses to provide answers. However, this method is rarely used, as the general principle is predominantly to convince people of how useful the census is.
If it is not possible to carry out the survey, the enumerator estimates, if possible, the number of residents in the housing by collecting information within the neighborhood. At national level, in 2019, among the 3.9% of non-responses (of primary residences), information on the number of persons usually residing in the housing could be obtained in 74% of cases. Whenever this is not possible, the enumerator indicates that they do not know this information and a statistical estimation procedure is used (see Section 2.4).
Survey checks
Checks on the conduct of the survey are carried out by municipalities and INSEE.
A municipal coordinator is responsible for the day-to-day supervision of enumerators. The INSEE supervisor is responsible for ensuring that the survey is correctly carried out by municipalities.
Checks carried out by the municipal coordinator
First, the municipal coordinator must meet with their enumerators at least once a week. During this meeting, they review the progress of the collection phase and the coordinator examines the documents submitted by the enumerators. In particular, they check the document produced during the “address verification tour”. This shall include details on addresses. They shall also review a sample of paper questionnaires to ensure that they have been completed correctly. They also ensure that the enumerators’ tour books are filled in with consistent information (the tour book is a working document of the enumerator which includes the list of addresses and dwellings to be surveyed).
During these meetings, enumerators raise any challenges encountered and the coordinator discusses possible solutions, including the introduction of reminders for residents who are refusing to provide answers.
In addition, the coordinator has access to the information included in the collection management application provided by INSEE (Omer) on the number of listed dwellings at a given address and on the number of residents in every dwelling. By comparing this information with the data from the survey preparation phase, the coordinator can identify any discrepancies that need to be addressed.
The coordinator can also check online responses given for situations where such verification is worthwhile, such as situations where the household surveyed has changed the address of its dwelling, which is a warning that the enumerator may have gone to the wrong address. In municipalities with more than 10,000 residents, compliance with the sample is essential for the quality of results and a dwelling cannot be surveyed unless it has been drawn.
At the end of the survey, the municipality is responsible for checking its completeness. In the inventory of the fixtures management application, the municipal coordinator can access listed addresses and dwellings and can identify any omissions. Once inspections have been completed, the mayor signs a document certifying the number of dwellings and residents listed in their municipality.
Checks carried out by INSEE
INSEE’s checks are carried out by the field supervisor during the collection phase, and then by regional INSEE establishments after the survey.
Several means are used for this:
Training of stakeholders and advisory assistance given to municipalities; Documentary check of a sample of documents during the investigation; Monitoring compliance with the sample in municipalities with more than 10,000 residents; Check of fake questionnaires on the Internet; Comparison of the number and type of dwellings collected with tax information or results from previous censuses, during and after the survey; Field checks by INSEE investigators after the survey; Checks during the optical reading phase of the questionnaires.
In any case, INSEE only checks the number of dwellings, the category of housing and the number of persons counted in the housing. During the collection and post-collection checking phases, INSEE never checks answers to socio-demographic questions (date of birth, nationality, marital status, training, employment, etc.), which are the sole responsibility of the survey subjects.
Training of stakeholders and advisory assistance given to municipalities
The training of stakeholders and their sound knowledge of the survey protocol is a major lever for guaranteeing high-quality results. Every year, 10,000 municipal coordinators receive one day of training from INSEE. Similarly, the 24,000 census takers are trained in two half-day sessions. A census manual and numerous thematic documents are made available to municipal coordinators and each enumerator is given an instruction booklet.
These training sessions are insufficient to fully master the process. They are supplemented by assistance during the preparation of the survey and during data collection. 400 INSEE staff members, known as “census supervisors”, regularly visit the municipality to review the progress of the survey and to provide additional training. Depending on the size of municipalities, a supervisor may be in charge of 5 to 30 municipalities (5, in metropolitan France, in the case of municipalities with more than 100,000 residents, 30 in the case of municipalities with fewer than 1,000 residents). The supervisor physically enters the premises of the municipalities to speak with the municipal coordinator and remains available at all times.
Checking a sample of documents
During visits to the municipality, the supervisor must have access to the investigation documents and carry out a number of checks. The aim is not to check all the documents, but to ensure that the various stakeholders in the field have understood the instructions. In particular, the supervisor must ensure that the municipal coordinator has checked the documents completed by the enumerators. To do this, they also examine the documents returned from the “address verification tour”, a sample of paper questionnaires and the tour notebooks.
On paper questionnaires, the supervisor checks, among other things, that the handwriting is different and that answers are not repetitive (to possibly identify an enumerator who may have personally filled in forms, without visiting anyone).
The supervisor also makes sure that the municipal coordinator processes cases of online questionnaires where the address has been changed by the residents.
Checking compliance with the sample in municipalities with more than 10,000 residents
Compliance with the sample is essential to ensure that results are relevant. It is an important parameter for supervisors. There may be discrepancies between the name of an address from the RIL and the reality in the field. There are also complex building configurations (inner courtyard, several buildings at the same address, multiple access on different streets, etc.). Furthermore, there may have been changes between the RIL preparation phase and the field survey.
A “fiche-navette” circulation form is in place to manage situations where the enumerator may have doubts about the correct address to be surveyed. In the event of any questions or doubt, the municipal coordinator sends this form to INSEE, which explains the configuration of the area and answers any questions raised. INSEE uses various mapping tools and analyses the situation and informs the municipality of the action to be taken (whether or not to take a census). In the majority of cases, these reports concern differences in the number of dwellings (22%) or changes in the use of the building (17%). 7% of alerts concern destroyed or walled up addresses, which are subsequently not recorded and deleted from the RIL.
This system is in addition to checks of addresses declared by residents, whether online or on paper, which allows for the reporting of cases where the enumerator has entered the wrong address.
Checking fake questionnaires on the Internet
The aim of this check is to identify possible cases where an unscrupulous enumerator has personally completed fictitious online questionnaires without meeting the residents. For this purpose, checks are carried out to detect mass concentrations of responses from the same IP address.
This check complements the one carried out on paper questionnaires by checking the diversity of handwritten entries.
Comparison of the number and type of dwellings collected with tax information or results from previous censuses, during and after the survey
The purpose of this check is to identify unusual developments in comparison to the recent past or discrepancies with tax information sources. For the census, INSEE has information from tax files, particularly housing tax. This only covers the number of dwellings and the names of occupants at each address, not income or the amount of taxes.
During the survey preparation phase and during the survey itself, the supervisor has the number of dwellings per address or per road known as a result of the housing tax information. This information enables them to identify significant discrepancies that require an explanation. This is obtained through dialogue with the municipality. During the collection process, the tax information available is 2 years old, which explains a large proportion of the discrepancies. For municipalities with fewer than 10,000 residents, the supervisor also has access to the results of the previous census, which enables them to identify unusual developments that require an explanation.
After collection, INSEE has more up-to-date tax information (one year old). A more systematic and automated checking system is then put in place. For all surveyed municipalities, several relevant indicators are calculated in order to estimate the quality of data collection:
Discrepancies in the number of dwellings with the tax source or with the RIL. Discrepancies in dwelling categories with the tax source (main residence, secondary residence, vacant housing). Average number of people per atypical dwelling (in level or evolution). Extent of the number of non-responses (in level or evolution). Estimated number of people per atypical or, very often, unknown dwelling.
These indicators are calculated per municipality or for sub-municipal areas. Areas where these indicators exceed certain thresholds are checked. The aim is to examine the consistency of the information for each dwelling. The names of the people living in the dwellings are useful to identify possible anomalies. Once checks have been completed (and certainly by 31 December of a given year at the latest), surnames and first names are permanently deleted from the files in accordance with the census processing order of 4 February 2016.
If discrepancies cannot be explained using the information available in office, field checks can be triggered.
Field checks by INSEE investigators after the survey
Post-census field check investigations are triggered after the municipal systematic and automated checks on a selection of cases with significant anomalies. These surveys may have multiple objectives depending on their anomalies, for example:
Check the real existence of an address or dwelling (fraudulent addition of dwellings). Check the real absence of an address or dwelling (omission of the enumerator). Check the dwelling category (main residence, secondary residence, vacant housing). Retrieve responses from non-respondent housing.
There are resource constraints in carrying out field checks. As a result, they are only carried out in areas with a sufficient concentration of anomalies to justify sending out an investigator.
Number of municipalities whose population has been amended as a result of field checks
Number of municipalities whose population has been amended as a result of field checks
In the end, few anomalies are reported in the 8,000 municipalities surveyed each year. For example, in 2019, 486 municipalities were subject to a field inspection. 418 of these municipalities had their survey results changed as a result of these checks (see Table 1).
The mayor of the municipality is informed in advance of the checks that may be carried out in their municipality. The mayor is informed by mail if these checks have led to a change to the results of the survey.
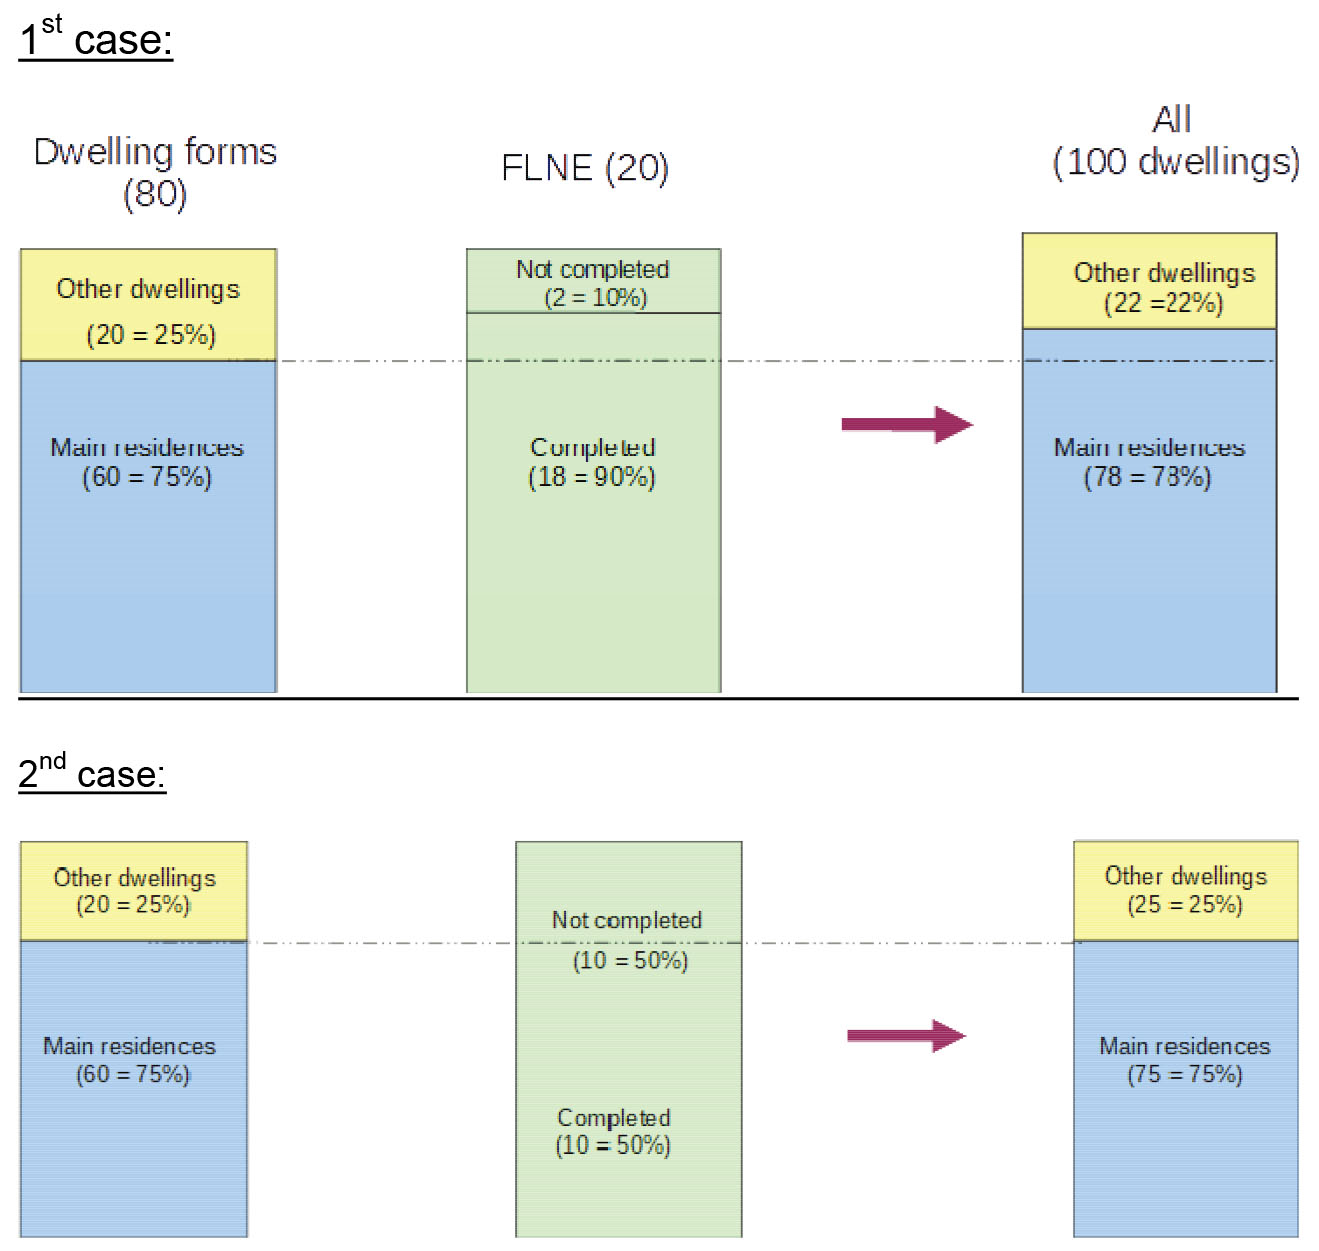
Determination of the proportion of primary residences among “incomplete” FLNE.
The data on paper questionnaires are digitised via an optical reading system. This phase of the process also includes combining paper and Internet questionnaires by address (for example in cases where residents of the same building have responded online while others have responded on paper).
This process benefits from a specific device for measuring the quality of optical reading, the main objective of which is to guarantee the quality of socio-demographic data. However, it also has an impact on the check of the enumeration of individuals in two situations in particular:
When internal responses to the questionnaire may change the category of housing (for example, housing is actually found to be a secondary residence and not a primary residence, as it is impossible to find any permanent resident); When a duplicate questionnaire is found (Internet and paper).
These cases are rare, but theses checks contribute to the quality of the results.
Processing of non-responses
Instead of a housing form, a non-surveyed housing form (FLNE) is completed at the end of the collection phase when the enumerator has been unable to obtain responses from the residents of a dwelling, when the residents refuse to answer, or when they are absent for an extended period. It should be completed only for primary residences.
The essential information of a FLNE is the assumed number of persons living in a given dwelling. A FLNE is:
“Completed” when the enumerator indicated the presumed number of persons in the housing. “Not completed” when the enumerator did not indicate the presumed number of persons in the housing.
In order to complete a FLNE, the enumerator interviews people in the neighborhood to determine whether the non-responsive housing is a primary residence and the number of residents in the housing. This information is essential to provide the most accurate population count.
If the enumerator was unable to contact the residents of the housing, it is impossible to ensure that it is a primary residence, especially when they have been unable to obtain this information with certainty from the neighborhood. Thus, a FLNE may be incorrectly created for non-primary residences mainly referring to an incomplete FLNE.
In the population count, only incomplete FLNE correspond to true non-responses. They must be adjusted to determine the share of primary residences and to determine the number of individuals per FLNE (see Fig. 4). On the other hand, the information provided in “completed” FLNE is integrated into the population count.
FLNE rates by size of municipalities
FLNE rates by size of municipalities
Reading Note: the FLNE rate of a bracket is defined as the ratio between the number of FLNE of all municipalities in the bracket and the sum of main residences and FLNE. Source: 2019 EAR.
The total non-response rate for the annual census survey is very low when compared to non-response rates for household surveys. In 2019, it is 3.9% (see Table 2). This low proportion shows that the adjustment of the number of persons in non-surveyed housing does not lead to a highly inaccurate population estimate. Moreover, among the FLNE, only 26% are “not completed”, that is to say 1% of the surveyed housing. This represents 43,000 dwellings for the 2019 EAR.
The FLNE rate increases with the size of municipalities: from 2% on average for municipalities with fewer than 500 residents to 6% for municipalities with more than 100,000 residents. Moreover, the share of incomplete FLNE among all FLNE is higher in large municipalities.
Different stages of the adjustment of “Incomplete” FLNE
The adjustment of “incomplete” FLNE is carried out via two steps:
Determination of the proportion of primary residences among “incomplete” FLNE. Imputation of the number of residents for “incomplete” FLNE classified in a main residence.
Determination of the proportion of main residences among “incomplete” FLNE
A FLNE should normally be completed when the dwelling is a non-responsive primary residence. However, in many cases, enumerators are unable to determine whether an empty dwelling is a primary residence. In some cases, a FLNE may therefore report that a dwelling has not been surveyed without really knowing whether it is a primary residence. In order to avoid overestimating the population, some incomplete FLNE are considered non-primary residences. In practice, a proportion of primary residences among incomplete FLNE is determined for each municipality in a way that, if possible, the rate of primary residences among FLNE (completed or not) is equal to the rate of primary residences compared to the respondent housing.
There are two cases (see Diagram F):
1st case: The rate of “completed” FLNE is higher than the rate of primary residences observed for the respondent housing in the municipality. In this case, all “incomplete” FLNE are considered to be non-primary housing; 2nd case: The rate of “completed” FLNE is lower than the rate of primary residences observed for the respondent housing. In this case, some “incomplete” FLNE are considered to be non-primary residences, up to the rate observed for the respondent housing. The remainder, once the rate is reached, is considered to be primary residences.
“Incomplete” FLNE not classified as primary residences are divided into secondary residences, intermittent housing and vacant housing in the same proportions as the total number of dwellings in the municipality. For the 2019 EAR, 72.3% of the unclassified FLNE are considered main residences, that is to say slightly more than 30,000 dwellings.
Imputation of the number of residents for “incomplete” FLNE considered primary residences
In order to impute the number of residents in “incomplete” FLNE, a distribution of the number of persons per informed FLNE is used, stratified according to the size of municipalities (more or fewer than 10,000 residents) and according to their location (metropolitan France/French overseas departments). It is considered that the distribution of individuals in “incomplete” FLNE is closer to that of the “completed” FLNE than to that of individuals in the sum of primary residences. Indeed, interviewers may encounter more challenges when contacting residents of small housing. The distribution used was calculated from “completed” FLNE from the cumulative EAR in 2006–2010 (see Table 3). This distribution has not significantly changed for the more recent EAR: the average number of individuals per dwelling in “incomplete” FLNE increased from 1.69 over the period 2006–2010 to 1.74 over 2015–2019 for large metropolitan municipalities, and from 1.84 to 1.89 for small metropolitan municipalities. The distribution will be updated for the next EAR.
Distribution of the number of persons imputed in “incomplete” FLNE according to the municipality (in %)
Distribution of the number of persons imputed in “incomplete” FLNE according to the municipality (in %)
PC: municipalities with fewer than 10,000 residents; GC: municipalities with at least 10,000 residents; ind: individual; Reading Note: in municipalities with at least 10,000 residents in metropolitan France, primary residences with an “incomplete” FLNE have a 61.08% probability of having an imputed number of residents equal to 1.
Distribution of coefficients of variation (in %) of the household population by municipality size
Scope: Municipalities in metropolitan France with at least 10,000 residents. Source: 2006 population census.
For “incomplete” FLNE with an imputed number of residents equal to 5 or more, the actual number of persons is determined per hot deck.
In 2019, the average number of persons in “incomplete” FLNE considered to be primary residences is 1.7, compared to 1.8 in “completed” FLNE5 and 2.2 in responding primary residences.
In the 2016 census, 370,200 individuals (weighted) were imputed in “incomplete” FLNE, representing approximately 0.6% of the total population. Ultimately, even if the total non-responses are adjusted under certain assumptions (proportion of primary residences, imputation of the number of persons per housing), and therefore surrounded by a margin of uncertainty, this has marginal consequences on the population level due to the low non-response rate and the preponderance of “completed” FLNE.
Population estimates and the analysis of the quality of produced results
Presentation of population estimate methods
In the framework of the French census, population estimates at a municipal level are unique, as they depend on the method of questioning: collection every five years and annual collection based on a sample. The estimation methods are only briefly detailed in this document. Populations are established every year with a 3-year time lag. Therefore, on 31 December of year
Municipalities with fewer than 10,000 residents are exhaustively surveyed, on a rotational basis, every five years, with one municipality in five being surveyed each year. In the year of the census of a municipality (
In municipalities with more than 10,000 residents, population estimates are obtained on the basis of the number of dwellings found in the register of localised buildings (RIL), which is exhaustive, and the average number of persons per dwelling, estimated on the basis of the five most recent annual census surveys (
This imprecision varies according to the size of the municipality (the smaller the size of the municipality, the greater the relative imprecision is likely to be, because the estimate of this size is based on fewer observations). The main results can be found in Table 4.
Evaluation in pre-release population estimates
Initial estimates are made in July, even before the end of the post-collection checks and optical reading of questionnaires for the annual census survey at the beginning of the year. Several checks are carried out on these first estimates. These checks ensure the quality of the produced data by detecting possible errors that may occur during the different phases of the production process (collection, RIL, population estimates, etc.). These checks are carried out once more on estimates produced at the end of the year, taking into account all checks and adjustments made after collection. Populations are consequently published on the insee.fr website and validated by decree.
Automatic consistency and plausibility checks
A series of automatic checks are implemented using the data each time population estimates, even provisional ones, are produced. These checks (for consistency and plausibility) have two main objectives. On the one hand, they check that the data produced are consistent, for example by testing that the municipal population is the sum of the household population, the communal establishment population, the mobile home population and the homeless population. On the other hand, plausibility checks aim to detect impossible evolutions of certain population categories or in certain geographical areas. The purpose of these checks is not to produce a list of municipalities with a significant change in population (see the following section on the analysis of INSEE’s regional offices), but to detect changes that are not credible. The idea is to run an automatic check that can be analysed quickly (and not to look at individual cases) before making the data available to INSEE regional directorates for further evaluation. During this phase, it is checked, for example, that the average size of households in every municipality is between 1 and 6.
These checks are recent and are intended to be improved over time to consolidate population estimates.
Evaluation of populations conducted by INSEE’s regional departments
Population estimates are sent to INSEE regional departments for in-depth analysis. Contrary to previous automatic checks, the objective is to analyse population estimates on a case-by-case basis in order to identify atypical developments for each municipality and to correct any errors.
To aid this analysis, a digital application was created by INSEE (Apolline) in 2015. In addition to population estimates, this application includes contextual data for each municipality: historical population data of a given municipality, data on the number of dwellings, primary residences, the average number of persons per dwelling, populations of communal establishments, number of mobile dwellings and homeless people, etc. These data can originate from different sources: housing tax or EAR. Data are presented in the form of tables, graphs or maps.
Since it is impossible to analyse the situation of 35,000 municipalities on a case-by-case basis, tools have been created to assist prioritisation. A variable (“score”) assesses, among other parameters, whether the population has undergone a recent change in trend (for example, a growth followed by a decline). Regional departments are then asked to analyse, in depth, municipalities with a high score. Large municipalities with a population change that does not fall within the confidence interval of the population of the previous year are also identified. Contribution variables have been created in order to highlight components of the population that significantly contribute to the evolution of the population of each municipality.
The analysis provided by regional departments is critical. Firstly, it makes it possible to identify and possibly correct problems occurring during the different upstream phases of the population estimate production process. These could be collection-related problems that have not been dealt with during the collection or post-collection checking phases, errors in the RIL of a municipality, the effect of a transfer between the scope of communal establishments and the scope of households having an effect on the population estimates, incorrect consideration of the opening or closing of a communal establishment, for example. The analysis also makes it possible to validate population estimates outside the scope of the classical estimation procedure. Municipalities affected by these specific estimates are municipalities undergoing a change in geography (mainly municipalities that have merged) and municipalities that have crossed the threshold of 10,000 residents (upwards or downwards) and for which, for several years, the estimate is in transition between a small or large municipality. These specific estimates, which cannot be easily automated due to their increased complexity, require a higher level of human intervention. Special attention should therefore be paid to them during the evaluation.
The evaluation of estimates in large municipalities also makes it possible to detect registered addresses that strongly influence population estimates. As such, due to the sample draw, certain atypical addresses (in terms of number of dwellings or average number of persons per dwelling) may have a significant effect on the population measure depending on whether or not they are drawn in the EAR sample. Winsorisation procedures can be implemented in order to reduce the effects of these addresses and to reduce the volatility of estimates.
Analysis of estimates at aggregate level
Plausibility checks are carried out at more aggregated levels, for example at departmental, regional or national level. These checks are simpler than those at municipal level because populations evolve in a more regular way. It is therefore easier to detect a possible error. Checks carried out mainly concern the different components of the population (population in ordinary housing, communal establishments, mobile housing and the homeless population) at different geographical levels (national level, large municipalities, small municipalities by rotation group, etc.).
Conclusion
The heavy involvement of stakeholders (municipalities and INSEE) in the preparation and conduct of the census leads to an excellent understanding of the process. The sheer number of checks carried out throughout the process ensures the quality of the estimates made. In addition, the census benefits from a very low non-response rate (3.9% in 2019). However, some features are not yet fully understood. Even though many instructions are included in questionnaires, answers given by survey subjects are not perfect due to misunderstandings, the failure of certain questions to reflect real situations, or deliberately incorrect answers.
Quantitative information available for INSEE to measure the quality of population estimates remains only partial in nature. The RIL quality measurement survey is the main source of information on dwelling surpluses and deficits observed in this register. In 2017, the RIL has a maximum net deficit of 0.9% of habitable dwellings. Information on elements of the survey variance of population estimates in municipalities with more than 10,000 residents is also available. However, INSEE does not have information on other components, such as measurement errors for the permanent residents of a dwelling, the category of housing, and the exhaustiveness of dwellings in small municipalities.
To date, the information available is limited and insufficient to make an overall assessment of any over- or under-estimation of the population. Several analyses [8] explore the way in which census results can be compared with other data sources. If they lead to the provision of figures on a possible over- or under-estimation, they will be based on either assumptions that can be discussed or sources whose quality can also be questioned. These results do not put the French census in a different position to censuses in other countries when compared with the quality of censuses at European level.
However, all these results should be consolidated. For this purpose, a direct measure can be envisioned by conducting a census coverage survey. This type of survey has been carried out twice in France, after the 1962 and 1990 censuses. These have made it possible to highlight the surpluses and deficits in the measurement of the population via past censuses. The 1990 survey estimated the number of duplicate counts at nearly 1% and the number of omissions at between 1.5% and 2% [9], which confirms the estimates of the 1962 survey. The census coverage survey consists of returning to selected census dwellings a few weeks after the census and interviewing members of the household face to face to observe reporting discrepancies with census questionnaires. This method also has some shortcomings (reporting bias related to the method of collection, reformulation of questions by the interviewer, etc.), but is, a priori, the method that makes it possible to obtain the optimal measure of the true value, meaning the number of permanent residents in the main residences.
This census coverage survey has not been conducted since the new census was introduced in 2004. The rotating census may complicate its implementation. For example, the concept of double counting is more difficult to understand insofar as it fails to provide an overview. It would, however, make it possible to estimate omissions and the number of individuals incorrectly counted, i.e. those counted as permanent residents of a dwelling when they should not have been (non-primary residence, multi-resident to be counted in another dwelling, etc.). On the other hand, it would be difficult to deduce the number of “duplicate counts” because a person incorrectly counted may not lead to double counting in the case of an omission in the dwelling where he/she should be counted. Still, this information would be of interest for quantifying the quality of population estimates by the census.
The implementation of this survey to measure the quality of the census is currently under consideration by INSEE and should be carried out in the coming years, if INSEE resources allow. Work on comparisons with social or fiscal sources should be continued in order to better document the differences observed and to understand them.
Footnotes
In French overseas departments, municipalities with fewer than 10,000 residents also have an RIL.
When a growing municipality crosses the threshold of 10,000 residents, INSEE creates an RIL using the most recent exhaustive collection of data. This initial RIL is then updated with the permits issued between the last exhaustive data collection and the current year. The RIL is then subjected to the standard updating process by INSEE and the municipality.
The IRIS (Ilots Regroups pour l’Information Statistique) is the basic building block for the dissemination of infra-communal data. It adheres to geographical and demographic criteria and its boundaries do not change over time. Municipalities with at least 10,000 inhabitants and most municipalities with a population of between 5,000 and 10,000 inhabitants are divided into IRIS.
Exceptions to this may occur if someone is incapable of answering the questionnaire by themself.
The difference in the average number of individuals per primary residence between incomplete and completed FLNE is due to the fact that FLNE are less often completed in large municipalities than in small municipalities, and the average number of persons per primary residence for completed FLNE is lower in large municipalities than in small municipalities.
Acknowledgments
The authors would like to thank Cristina D’Alessandro for her suggestions on how to improve this article.