In recent years there has been much debate about the need to supplement existing economic indicators, most notably gross domestic product (GDP), with a more rounded and balanced set of indicators that better reflect the complexity of today’s economic, societal and environmental needs. To address this need, the United Nations Conference for Trade and Development (UNCTAD) in cooperation with the Eurasian Economic Commission (EEC) developed a first prototype composite index measuring inclusive growth tailored to that region. This paper summarises the conceptual objectives and some of key methodological challenges and considerations faced in compiling such an index. Many of the challenges and methodological considerations are universal and not specific to EEC. A brief outline of results and future work is also detailed.
The issue of fostering inclusive growth is relevant for the five Eurasian Economic Union (EAEU) Member States (Armenia, Belarus, Kazakhstan, the Kyrgyz Republic, and the Russian Federation). In accordance with Article 4 of the Treaty on the Eurasian Economic Union, one of the main objectives of the Union is to create conditions for stable economic development of the Member States in order to improve the living standards of the population. As the external economic environment has been somewhat unfavorable for the EAEU Member States in recent years, the need to establish a fuller picture of the challenges faced by the population, and the policy options available, is pressing.
Unlike the Millennium Development Goals, which focused primarily on social targets, the 2030 Agenda emphasizes the development of productive capacity as the basis for achieving inclusive and sustainable development. As part of that broad shift in emphasis towards economic, equality and environmental issues, the notion of inclusive growth has received a prominent place in the 2030 Agenda, notably Goal (SDG) 8 – ‘promoting sustained, inclusive and sustainable economic growth, full and productive employment and decent work for all’ and Target 17.19 – ‘by 2030, build on existing initiatives to develop measurements of progress on sustainable development that complement GDP and support statistical capacity building in developing countries’. These aspirations reflect a burgeoning movement for a better measurement tool for progress than GDP [1].
In 2017, during the plenary session of the Astana Economic Forum the President of the Republic of Kazakhstan, Nursultan Nazarbayev, noted ‘GDP does not reflect the long-term nature of economic activity, does not consider damage caused to the environment, including depletion of natural resources. Moreover, it does not reflect the quality of life in a country. GDP per capita does not reflect the real well-being of citizens, nor does it consider income inequalities. I believe that the world community should adopt an updated method of calculating GDP on the basis of “green” GDP and such indicators as the Human Development Index and the Organisation for Economic Co-operation and Development (OECD) Better Life Index. The calculation method should adequately reflect the need for a balanced development of countries.’1
Against this background, the Eurasian Economic Commission (EEC) and United Nations Conference on Trade and Development (UNCTAD) joined forces to examine the methodological challenges involved in developing a measure of inclusive growth that could contribute to the ‘Beyond GDP’ debate and provide a useful policy tool for the EAEU region. This study should be considered work-in-progress as it is the first of its kind for EAEU Members States, and as there is no globally agreed concept and methodology for measuring inclusive growth. Nevertheless, this paper highlights some of the challenges and considerations involved in developing a composite indicator of inclusive growth that might inform countries’ economic policy in the path towards a more inclusive economy.
This paper is presented in 3 parts. The first part – The ‘Importance of Inclusive Growth’ examines some of the issues noted above in more detail, investigating the background to, and attempts to measure, inclusive growth, and the impetus to move beyond GDP. Section 2 – ‘Measuring Inclusive Growth’ examines some of the technical issues involved in compiling an inclusive growth index, including issues with composites, data availability and indicator selection, pillars of inclusive growth, using Principal Component Analyses, imputing and transforming data and assigning weights. The final Part (3) – ‘Results, Discussion and Conclusion’ presents some key results and discusses the strengths and weaknesses of the approach taken.
Part 1 – The Importance of Inclusive Growth.
This section provides a brief overview of GDP’s dominant position, including the background and impetus to move beyond GDP and attempts to measure inclusive growth, including the different concepts, definitions and measures of that term.
GDP and attempts to move beyond it
Gross Domestic Product (GDP) emerged from the Great Depression of the 1930s, World War II and the 1944 Bretton Woods conference as the preeminent economic indicator [2, 3]. Philipsen [4, p. 237] notes ‘GDP is not just a measure of the economy. It defines the economy’. Although a purely economic measure, GDP has frequently been used as a proxy measure for overall welfare of a country. Palmer [5] described GDP as the ‘chief criterion for national welfare or progress.’
The founding fathers of national accounts statistics, Clark and Kuznets, understood from the beginning that GDP was not an appropriate or reliable measure of welfare or well-being. Yet today, despite protests from many of our most eminent economists that GDP is not a good measure of welfare [6, 7], it has been adopted as the barometer for our collective success and well-being [8, 9, 10]. This is curious, for just as Kuznets warned the US Congress in 1934 that ‘the welfare of a nation can scarcely be inferred from a measure of national income’ [11, p. 29], compilers today caution that ‘GDP is often taken as a measure of welfare, but the SNA makes no claim that this is so and indeed there are several conventions in the SNA that argue against the welfare interpretation of the accounts’ [12, p. 12].
As the post war economic model faltered, and environmental concerns also began to emerge, the ‘growthmanship’ paradigm was questioned [13]. The first gauntlet was laid down in 1972 when the King of Bhutan declared, “Gross National Happiness is more important than Gross Domestic Product” [14], arguing for a more holistic approach toward progress that balances material and non-material values, and which led, many years later to the GNH index. One of the first actual alternate measures was the Measure of Economic Welfare proposed by Nordhaus and Tobin [15]. Since then, there have been several attempts to challenge the primacy of GDP as the definitive measure of progress, including the Physical Quality of Life Index (1979), the Index of Social Health (1987), the Genuine Progress Index (1995) and the Human Development Index (1990).
The beginning of the twenty-first century, fueled by the global financial crisis of 2008–2009, witnessed a renewal in the debate regarding the limitations of GDP to provide adequate measures of economic performance, social progress and sustainable development. Talberth et al. [8] contended that GDP was out of sync with people’s everyday experiences while the Economist [16, p. 22] declared that GDP was ‘a relic of a period dominated by manufacturing’. These events and criticisms rekindled efforts to develop a more wide-ranging measure of progress. Perhaps the best known, the Stiglitz – Sen – Fitoussi Commission was established in 2008 to determine whether a better or more comprehensive measure of economic and social progress could be established [1]. In 2009, the European Commission published their roadmap ‘Beyond GDP’ [17], which is an amalgam of ‘enlarged GDP’, social and environmental indicators and other measures of well-being. The following year, the OECD launched their ‘Better Life Index’ to address similar questions. The same year the Obama administration formally established the Key National Indicators Commission in the United States, to develop a comprehensive indicator system (KNIS), which comprises over 300 key and twelve composite indices. The United Nations University’s International Human Dimensions Programme on Global Environmental Change (UNU-IHDP) in collaboration with the United Nations Environment Programme (UNEP) also developed an Inclusive Wealth Index. With the exception of the latter index, all of the other recent initiatives adopted a dashboard approach rather than attempting to develop a single aggregate index. This reflects the complexity of trying to bundle all of the issues that are now included under the ‘progress’ umbrella together: environmental sustainability; economic stability and sustainability; and social equality and health, life satisfaction, and general well-being.
The multitude of alternative measures noted above illustrates the challenges involved in replacing or supplementing GDP, a number with considerable cultural authority, with another number or indicator that is complex enough to incorporate the varying interpretations of ‘progress’ [18]. The purpose of this paper is not to add further to the confusion, but to explain how and why a composite indicator that incorporated the domains of inclusive growth tailored to the specific circumstances and needs of the EAEU Members States was constructed.
The origins and definitions of inclusive growth
Article 1 of the 1948 Universal Declaration of Human Rights states ‘All human beings are born free and equal in dignity and rights’ [19]. Equality means ensuring that every individual has an equal opportunity to make the most of their lives and talents, and no one should have poorer life chances because of where or into what circumstances they were born, what they believe, or whether they have a disability [20].
Traditionally, economic growth and inequality were seen as an inverted-U curve, first formulated by Kuznets [21], where inequality is low in slowly growing traditional, agricultural economies, and then starts to increase in the more dynamic phase, when developing countries embark on a catching-up process, and then again becomes low in more mature, developed economies with slower growth. In essence, increasing inequality was seen as a price for modernization and higher economic growth. The expected end-result was a modern economy with low levels of inequality. However, the economic policies of the 1980s and 1990s saw inequality increasing in developed economies as well, while developing countries were taking different paths, some characterised by high inequality and low growth (mostly Latin American countries), and others by high growth and low inequality (some East Asian countries).
A new line of thinking emerged, arguing that equity and growth are in fact complementary [22, 23]. Thus, instead of focusing on the inequality of outcomes (income and wealth), an alternative approach also examined the inequality of opportunities, such as education or social structures. Inequalities negatively affect investment and innovation possibilities, and therefore restrict economic growth. Thus, if GDP growth is the objective, inequality is a constraint rather than an outcome. But equal participation does not imply economic inclusion. People may be integrated in economic processes, and yet excluded from the benefits. The so-called ‘working poor’, those who despite having a job live below the poverty line, are a perfect example. According to the International Labour Organization [24] there were approximately 630 million working poor worldwide in 2019, almost one in five of all those employed.
Of special significance to understanding inclusive growth is the relationship between inequality and growth. Oxfam [25] shows, for example, that from 1980 to 2016, the top one percent of the world income distribution captured 27 per cent of real income growth in the world economy. At the same time, the bottom 50 per cent accounted for only 12 per cent of total real income growth. Similarly, the wealth of the world’s billionaires increased by US$900 billion in 2018, or US$2.5 billion per day, while the wealth of the poorer half of humanity, 3.8 billion people, fell by 11 per cent. These numbers show that the benefits of economic growth are not shared equally among people.
The definition of inclusive growth
Any definition of inclusive growth must, therefore, go beyond equal participation and consider how the benefits are shared. The OECD [26], for instance, defines inclusive growth as economic growth that is distributed fairly across society and creates opportunities for all. The UNDP [27] defined inclusive growth as ‘equity with growth or to broadly shared well-being resulting from economic growth’, arguing it should be measured in terms of the increment of income accruing disproportionately to those with lower incomes. The IMF in a note to G20 leaders in 2017 [28] defined inclusive growth in terms of ‘a broad sharing of the benefits of, and opportunities for, economic growth’, describing benefits as income and wealth, and opportunities as access to the labour market and to basic services. UNCTAD [29] highlighted the need to address power imbalances, reduce inequalities and promote inclusive outcomes at both global and national levels and identified three potential barriers to achieving this: the automation of production; segmentation of labour markets; and corporate strategies that concentrate market power.
In this paper, the concept of inclusive growth used is inspired by these definitions and also builds on the 1948 Universal Declaration of Human Rights which states ‘We resolve also to create conditions for sustainable, inclusive and sustained economic growth, shared prosperity and decent work for all, taking into account different levels of national development and capacities’ [19, para. 3], the principle of the 2030 Agenda to leave no-one behind and in particular SDG 8 which promotes ‘Promote sustained, inclusive and sustainable economic growth, full and productive work for all’. Thus, for the purposes of this analysis, inclusive growth is defined as equal and non-discriminatory opportunities for everyone to both participate in the economy and to benefit from economic growth.
Alternate measures of inclusive growth
Translating inclusive growth into a concept that is easily measured is not straightforward. Inclusive growth is a multifaceted phenomenon, and its main characteristics are not easily captured. Nor, as noted above, is there a commonly agreed definition of inclusive growth. The measurement exercises carried out to date have employed different definitions, approaches, source data and indicators depending on the purpose of their analyses.
Although the 2030 Agenda explicitly calls for the development of ‘measurements of progress’ to complement GDP (SDG target 17.19), the indicator framework agreed at the 47th session of the United Nations Statistical Commission in 2016 [30] did not propose any indicators addressing this issue [31]. No doubt this reflected the lack of consensus on a suitable indicator, but perhaps also a more fundamental lack of consensus on whether and how quantitative measurements of progress could be made at all [8]. Although the indicator framework does not directly address inclusive growth, the key elements of the concept, including many indicators of economic growth and environmental sustainability (which is important from a temporal equality perspective) are evident. SDG 1 and SDG 2 aspire to build a more caring community that protects vulnerable population groups and provides for their most basic needs; SDG 5 aims to reduce gaps between men and women; SDG 8 addresses full employment and decent work; SDG 16 aims to build just and peaceful societies; and SDG 10 addresses reducing inequalities by closing socio-economic gaps within and across nations, generations and households. Thus, linkages between SDG 8 and other SDGs are several and taken together are consistent with the concept of inclusive growth.
Beyond the 2030 Agenda, there are several dashboards, indicators or analytical approaches that set out to measure inclusive growth or elements of inclusive growth. For instance, increasing economic inclusion is one of the goals of the Asian Development Bank (ADB) Strategy 2020 [32]. In its framework for inclusive growth, the ADB [33] defines inclusive growth as economic growth with equality of opportunity. Their indicator framework proposes a set of 35 indicators centered on the following themes:
Poverty and inequality: indicators on income, years of schooling and child health.
Growth and expansion of economic opportunity: economic, employment and infrastructure indicators.
Social inclusion to ensure equal access to economic opportunity: indicators of education and health, basic infrastructure and gender equality.
Social safety nets: Social protection and security expenditure indicators.
Good governance and institutions: indications of voice and accountability, government effectiveness and control of corruption.
OECD dashboard of indicators on inclusive growth
Category
Core indicator
1. Growth and ensuring equitable sharing of benefits from growth
1.1
GDP per capita growth (%)
1.2
Median income growth and level (%, USDPPP)
1.3
S80/20 share of income (ratio)
1.4
Bottom 40% wealth share and top 10% wealth share (% of household net wealth)
1.5
Life expetancy (number ofyears)
1.6
Mortality from outdoor air pollution (deaths per millon inhabitants)
1.7
Relatve poverty rate (%)
2. Inclusive and well functioning markets
2.1
Annual labor productivity growth and level (%; USD PPP)
2.2
Employment-to-population ratio (%)
2.3
Eamings dispersion (inter-decile ratio)
2.4
Female wage gap (%)
2.5
Invduntary part-tme employment (%)
2.6
Digital access (businesses using cloud computing services) (%)
2.7
Share of SME loans in totall business loans (%)
3. Equal opportunities and foundations of future prosperity
3.1
Variaton in science performance explained by students’socio-economic status (%)
3.2
Correlation of earings outcomes across generations(coefficient)
3.3
Child care enrolment rate (children age 0-2) (%)
3.4
Young peope neither in employnvnt nor in education & training (18-24) (%)
3.5
Share of adults who score below Level 1 in both liteacy and rumeracy (%)
Achieving inclusive growth is one of the three priorities of the European Commission [34] strategy Europe 2020. Here, inclusive growth is defined as support for the population through the provision of high employment rates, investment in acquisition of skills, fighting poverty and modernising the labour market. A prerequisite for achieving inclusive growth is the expansion of positive effects across all the EU regions, including the remote ones. Eurostat publishes dashboards for the five targets with additional indicators but does not separate inclusive growth indicators from those that reflect the other two EU priorities (smart growth and sustainable growth). The five targets are measured using the following key indicators:
Employment rate
Gross domestic expenditure on research and development (R&D)
Greenhouse gas emissions, share of renewable energy and energy efficiency
Share of early school leavers and educational attainment
People at risk of poverty or social exclusion
The OECD [35] has developed a Framework for Policy Action on Inclusive Growth with a dashboard of 24 inclusive growth indicators to monitor progress over time around key outcomes and drivers of inclusive growth. The dashboard is organised around four categories (see Table 1).
The United Nations Development Programme (UNDP) attaches great importance to inclusion in the context of the 2030 Agenda, and links inclusive growth with sustainability. The UNDP’s Strategy for Inclusive and Sustainable Growth [36] raises two issues as especially significant for the discussion on inclusive growth: First, the interplay between income distribution and growth, and second, the interplay between income distribution and extreme poverty. In addition to their Human Development Index, the UNDP conducts analyses of inclusive growth in selected countries and regions, formulating analyses based on the development needs and economic structures of each country. While the strategy does not identify a set of common indicators, it refers to several statistics, bundled into three themes:
Poverty measures using the international US$1.90 per day poverty line, the multi-dimensional poverty index and national poverty lines.
Statistics on the working poor, defined as those active in the labour force, but whose income still falls below the higher poverty line of US$3.10 per day.
Statistics on population groups experiencing the greatest inequalities and exclusion in terms of access to opportunities and achievements of outcomes, especially women, female-headed households and youth.
The World Bank Strategy [37] defines inclusion as empowering all citizens to participate in, and benefit from, the development process, and removing barriers against those who are often excluded. The strategy also emphasizes sustainability to ensure that progress is not reversed. In 2009, the World Bank [38] employed a three-step inclusive growth analysis using available statistics and surveys, using Zambia as a case study:
Background analysis of factors explaining the country’s past growth and poverty reduction trends and trend-breaks, productivity and employment dynamics, challenges and opportunities with statistics on GDP per capita, poverty lines, export and import, export diversification, etc.
Profiling economic actors paying attention to excluded groups, income distribution, income earning activities of self or wage-employed by sector, size of firm, area (e.g. rural, urban, regions), type (e.g. formal or informal), value added per worker etc.
Analysis of the constraints to inclusive growth with statistics on schooling, access to health facilities, costs of and access to finance, investment and savings, land use, energy, tourism, infrastructure and governance.
The World Economic Forum [39] compiles an inclusive development index (IDI), a composite indicator calculated using12 source indicators. The IDI is a relative indicator in which each country is ranked from one to seven for each of the 12 indicators. The IDI is calculated for each country as a simple arithmetic mean of the 12 ranks. In addition, the WEF analyses each country’s economic policy in seven key areas, to assess future prospects for inclusive growth: education and professional skills; basic services and infrastructure; absence of corruption and cost of rents; financial intermediation of real economy investment; asset-building and entrepreneurship; employment and labour compensation; and fiscal transfers. The IDI source indicators are equally distributed across three pillars:
Growth and development analysed with GDP per capita, employment, labour productivity and healthy life expectancy statistics.
Inclusion looking at household income, poverty rates, income and wealth distribution.
Sustainability measured by net savings, public debt, dependency ratio and carbon intensity of GDP.
The challenges of conceptualizing and measuring inclusive growth is evident from the many attempts noted above. Each approach has emphasized one aspect of inclusive growth over another. In fact, given the complexity of inclusive growth, it’s not clear how successfully all elements can be included in a single measure. Consequently, some international organisations have used a dashboard approach, whereas others have opted for a composite index. Either approach has pros and cons. Finding a limited set of indicators that incorporate all of the required elements while simultaneously not being so complex as to be incomprehensible for users is a high-wire act. Irrespective of which approach is taken, the results must be sufficiently authoritative and scientifically rigorous to be credible.
Part 2 – Measuring Inclusive Growth
This section describes the operationalization of the definition of inclusive growth and its essential dimensions into a set of pillars and readily measurable indicators. Issues of data availability and complementarity are also be discussed.
Designing composite indicators
The OECD [40] defines a composite indicator as an indicator that is formed when individual indicators are compiled into a single index, on the basis of an underlying model of the multi-dimensional concept that is being measured. Composite indicators can be useful in summarising large amounts of information, sometimes making data easier to digest, compared with a battery of separate indicators. By incorporating many dimensions, for instance, the social, economic or environmental aspects of inclusive growth together, composite indicators can improve interpretability, making complex topics more accessible to different audiences. Of course, there can be disadvantages too. Inevitably, some nuance or richness is lost when summarising multidimensional concepts into a single indicator. It may also be difficult to identify the drivers of change in a composite indicator. Publishing a dashboard of sub-indices alongside the main indicator can help in this regard.
Conceptual and methodological issues need to be addressed in a very transparent way, prior to the construction and use of composite indicators, to avoid misunderstandings or misrepresentation. The OECD [41] identifies the following steps in composite indicator construction: Develop a theoretical framework to ensure fitness-for-purpose; indicator selection based on defined criteria; imputation of missing data; multivariate analysis to investigate the structure and suitability of the indicators; normalisation to render data comparable; weighting and aggregation; robustness and sensitivity analysis; conceptual verification by linking to source data and related indicators as well as presentation and visualisation.
While a composite indicator can be calculated for national policy purposes only, it may be more useful if a country’s development can be put into perspective by benchmarking progress against other countries regionally or internationally. This approach, adopted by the EAEU, enables comparisons with countries that have adopted different policy choices.
Dimensions of inclusive growth for the EAEU Region
As outlined in Sections 4 and 5, there is no universally accepted concept or definition of inclusive growth (Annex 1 provides a summary of themes considered by the current inclusive growth approaches). While there is a high degree of overlap or consensus in the cases noted above, there remain considerable and important differences in each approach. In order to construct a measure of inclusive growth for the EAEU region, a clear concept of inclusive growth and the dimensions to be included must first be articulated. This is necessary, not only from a practical measurement point of view, but also to avoid any misinterpretations of what the indicator represents. The conceptual or theoretical framework for the EAEU inclusive growth index is set out below. Five dimensions are identified:
Economic;
Quality of life;
Inequality (economic and social);
Natural resources; and
Governance.
In constructing a measure of inclusive growth for the EAEU region, the following dimensions and elements were considered:
As economic performance remains the basis of inclusive growth, an economic perspective must be included through measures, not only of production and income, but also complemented with statistics on employment, labour productivity, trade and indicators of access to resources and financial services.
Economic measures alone are insufficient in identifying access to the opportunities and benefits of growth. Therefore, inclusive growth should also include indicators on the quality of life and living conditions of the population, such as health, education, access to essential services, social protection, digital access, etc.
Inequality is central to the concept of inclusive growth adopted by the EAEU. Therefore, the measure of inclusive growth should take into account whether everyone enjoys equal and non-discriminatory access to the economic and social benefits included in the first two dimensions. Economic equality measures could include, for instance, risk of poverty and income distribution statistics (e.g. Gini index2). Social equality measures could vary from gender equality indicators to statistics on equality of access to goods and services, rights, information, and technology.
The exploitation or unsustainable use of natural resources could result in unequal benefits and costs for different groups of a population. Intergenerational imbalances can shift benefits to the current generation at the expense of future generations, leaving them with the costs and externalities (such as air and water pollution or ecosystem degradation). Therefore, it is important to include this fourth dimension in any measure of inclusive growth. This could include, for instance, carbon dioxide (CO) emissions, renewable energy, energy efficiency, carbon intensity of GDP, mortality from air pollution, natural resource use, energy intensity or sustainable water access.
Owing to the cross-cutting role in the equal and fair distribution of benefits arising from economic growth, it is important to include indicators representing institutional and governance structures, including, government effectiveness, corruption, confidence in government, voter turnout, political participation, spending on essential services, infrastructure, etc.
Data availability and indicator selection
In selecting indicators, a balance must be struck between including the most comprehensive assessment of inclusiveness possible (see Section 7), data availability, and maximizing the number of countries included in the analysis. An initial assessment of the availability of relevant official statistics revealed an abundance of indicators on economic and social issues, gaps in inequality and governance indicators, but a relative paucity of data for many environmental indicators. The strength of any composite indicator will also depend on the selection and quality of the source data. Therefore, in selecting indicators for inclusion, quality dimensions from the UNCTAD Statistical Quality Assurance Framework [42] were applied. These criteria include relevance (in this case meaning relevance to inclusive growth), completeness, comparability, timeliness, accessibility, accuracy and reliability.
Taking relevance and general statistical quality into account, a review of data availability was conducted of all the major global statistical databases. As a result, the following 21 indicators were selected as the were identified as being the most relevant to inclusive growth and offered the best availability of robust data across dimensions, countries and time (see Appendix 2 for details and metadata):
Economic dimension: 6 indicators – GDP per capita, national income per capita, labour productivity (GDP per person employed), electric power consumption per capita, employment rate, and exports of goods and services (share of GDP).
Social dimension: 6 indicators – Under-five mortality rate, access to safe water services (share of population), secondary school enrollment, coverage of essential health services, fixed Internet broadband subscriptions (per 100 people), and access to bank account or mobile-money services (percentage of adults).
Inequality dimension: 6 indicators – youth to adult employment rate, female to male employment rate, female to male labour force participation rate, income concentration ratio (Gini index), poverty headcount ratio, and secondary school enrollment/gender parity index (GPI).
Environmental dimension: 1 indicator – CO emissions (kg per unit of GDP).
Governance dimension: 2 indicators – logistics performance index and seats held by women and men in national parliaments.
The list of selected indicators was matched against the SDG indicator framework, and ten SDG indicators are used for the index3. The remaining indicators are also closely linked to indicators included in the SDG indicator framework, but were chosen in preference, owing to their more targeted relevance to inclusive growth. For instance, employment rates by age and sex were used rather than the more general unemployment rates used by the 2030 Agenda (SDG 8.5.2), as disaggregated employment rates reveal age and gender differences within overall labour force participation, not only differences in unemployment among those working or actively looking for work (the economically active population). Owing to better data availability, and arguably a better measure of income inequality, the Gini index was selected to assess income distribution, rather than indicators SDG 10.1.1 (growth of household income among the bottom 40 per cent of the population and the total population) or SDG 10.2.1 (proportion of people living below 50 per cent of median income).4
Environmental indicators with data available for a wide range of countries are scarce. A similar challenge exists for the 2030 Agenda, where UNEP [43] noted that more than 30 per cent of environment-related SDG indicators still lack an agreed methodology. Even where progress has been made on methodological development, it will take several years before countries begin data collection and compilation of the new indicators. In the short term it was decided that one indicator was sufficient to form an environmental pillar and was subsumed into a living conditions pillar (see Section 9). This decision will be revisited as additional indicators become available with sufficient country coverage – see discussion in Section 13.2.
Pillars of the inclusive growth index
Based on the linkages between the five dimensions of inclusive growth and given the availability of complete cross-country data, an index of inclusive growth was constructed around three pillars (see Table 2):
The pillars of the inclusive growth index and selected indicators
Pillar 1 – Economy
Pillar 2 – Living conditions
Pillar 3 – Inequality
1.1 GDP per capita (constant 2011 PPP US$, from SDG 8.1.1; WB)
2.1 Under-five mortality rate (deaths per 1,000 live births; SDG 3.2.1; WHO)
3.1 Ratio of youth to adult employment rate (modeled ILO estimate)
1.2 National income per capita (adjusted net; constant 2010 US$; WB estimate)
2.2 Access to safe water services (% of population; from SDG 6.1.1; WHO/UNICEF)
3.2 Ratio of female to male employment rate (modeled ILO estimate)
1.3 Labor productivity (GDP per person employed; constant 2011 PPP US$, from SDG 8.2.1; ILO)
2.3 School enrollment, secondary (% gross; UNESCO)
3.3 Ratio of female to male labour force participation rate (%; modeled ILO estimate)
1.4 Electric power consumption (kWh/ person; International Energy Agency)
2.4 Coverage of essential health services (SDG 3.8.1; UHC by WHO/WB)
3.4 Income concentration ratio (Gini index units; WEF for the latest data and SWIID)
1.5 Employment rate (ratio to labour force; %; modeled ILO estimate)
2.5 Logistics performance index: Overall ( low to high; WB)
3.5 Poverty headcount ratio (at 5.50 US$ a day; 2011 PPP; % of population; from SDG 1.1.1; WB)
1.6 Exports of goods and services (% of GDP; WB and OECD)
2.6 Fixed Internet broadband subscriptions (units per 100 people, SDG 17.6.1; ITU)
3.6 School enrollment, secondary (gross), gender parity index (UNESCO)
2.7 Access to bank account or mobile-money services (proportion of adults (15 years and older); SDG 8.10.2; WB)
3.7 Gender parity in the number of seats held by women and men in national parliaments (derived from SDG 5.5.1; IPU)
2.8 CO emissions (kg per unit of GDP in PPP US$, SDG 9.4.1; Carbon Dioxide Information Analysis Center)
Pillar 1 – Economic, composed of GDP and national income per capita, power consumption, employment and trade.
Pillar 2 – Living conditions, composed of social and health conditions, logistics and finance, natural environment; and
Pillar 3 – Inequality, composed of measures of inequality in labour participation, income, school enrolment and political participation.
In this clustering, the indicator of CO emissions per unit of GDP becomes part of the natural environment of the living conditions pillar. The logistics performance index belongs to the logistics and finance component of Pillar 2, as a measure of access to goods and services. The indicator on parliamentary seats by sex naturally falls under the equity pillar (Pillar 3). The clustering was done using Principal Component Analysis (PCA) by reducing the dimensionality of data consisting of interrelated variables, while retaining, as much as possible, the variation present in the data set that explains the measured phenomenon.
For the governance pillar, the World Bank’s logistics performance index that measures countries’ performance on trade logistics was used. This index is itself a composite with data available for 160 countries, measuring six dimensions, including, customs and border clearance, ease of arranging shipments, quality of logistics services, trade and transport infrastructure, tracking of consignments and timeliness of shipments. On governance, an indicator for conditions for doing business in a country, was included. This served as a summary indicator, with good data availability and coverage, covering issues related to public service effectiveness, infrastructure, corruption and confidence in government. A second governance indicator, the share of parliamentary seats held by women and men, also introduced an important gender inequality dimension.
Table 2 summarizes the selected indicators by pillar.
Imputation and transformation of data
As a general rule of thumb, the higher a country’s level of development, the more complete the data available. The PCA requirement for complete data was therefore only fulfilled for a limited number of relevant variables or countries. If all incomplete variables and country data led to exclusion, it would result in a very limited measure of inclusive growth and, most likely, a bias towards developed countries. It would also introduce complications in the application of PCA, as this requires a relatively large sample to produce stable results. Consequently, some imputation was required to maximise the inclusion of the available source indicators and countries.
Imputation was applied on a variable-by-variable basis. For super-annual variables, but with a fixed frequency (i.e. every two or three years), gaps in time series were filled using linear interpolation.5 In other cases, external data were used to complete datasets.6 Imputation also enabled a blended use of more relevant indicators.7 Although imputation enlarged the data available considerably, not all series could be restored and had, therefore, to be excluded from the analysis. To minimize data loss, all countries with complete information for at least one pillar’s indicators were included in the calculations. Consequently, analyses were based on data from 167, 131 and 90 countries for the first, second and third pillars, respectively. However, the final index was computed only for the 86 states with complete data available for all three pillars.
Some of the source indices had to be inverted to make the interpretation of the PCA results more straightforward. Values were inverted by deducting the original value from the theoretical maximum value of that variable, or the observed maximum value in the absence of a clear theoretical maximum. After this transformation, for all source indices, a higher value signified a better result.8 This approach greatly simplified the interpretation of results.
Inversion was especially relevant for the inequality pillar, where four indicators were inverted, namely: the ratios of youth to adult employment (indicator 3.1); female to male employment (indicator 3.2); income concentration ratio (indicator 3.4); and the poverty headcount ratio (indicator 3.5). For instance, the income concentration ratio, based on the Gini coefficient, ranges between 0 and 100, where 0 signifies total equality and 100 total inequality. The Gini was inverted (using the theoretical maximum of 100) so that, counterintuitively, a higher value signified less income inequality i.e. now 100 represents maximum equality. The poverty headcount ratio, which also ranges between 0 and 100 per cent of population, was also inverted (again using the theoretical maximum of 100). In the inverted form, a higher value signifies less poverty i.e. less people with an income below US$5.50 per day. Indicators in the inequality pillar were also transformed into parity ratios, where necessary i.e. to compare differences between two groups of population.9
Compiling the index – challenges, issues, decisions
Using PCA
Compiling composite indicators requires the use of multivariate analysis in order to investigate the overall structure of the indicators, assess the suitability of the data and guide methodological choices e.g. weighting and aggregation of the indicator components. Composite indicators calculated in an arbitrary manner where little attention is given to the interrelationships between the source variables may lead to misleading results that are unhelpful for policy purposes.
Principal component analysis (PCA) is one of the most widely used techniques for multivariate analysis. First introduced by Pearson [47] and developed independently by Hotelling [48], PCA can be used to reveal interrelationships among a set of variables. This is done by transforming potentially correlated variables into a set of uncorrelated variables using their covariance matrix or its standardised form, the correlation matrix. This enables the variability within the underlying information contained in N variables to be identified. As such, PCA can be used to emphasise patterns among multivariable data.
Retained principal components (eigenvectors) for pillar 1 – economy
Number of observations: 168
Number of principal components: 3
Variance retained: 0.9062
Components
Variance
Difference
Share in original variance
Cumulative variance
PC 1
3.2971
2.1632
0.5495
0.5495
PC 2
1.1339
0.1276
0.1890
0.7385
PC 3
1.0063
0.1677
0.9062
Rotated components (blanks correspond to coefficients with absolute value 0.34)
Rotation: orthogonal varimax (Kaiser off)
Variables
PC 1
PC 2
PC 3
Unexplained variance
GDP per capita
0.4769
0.0598
National income per capita
0.5037
0.1379
Labour productivity
0.4664
0.0660
Electric power consumption
0.5490
0.2353
Employment rate
0.9956
0.0010
Exports, % GDP
0.9086
0.0626
Through an orthogonal linear transformation, PCA calculates the projection of the original data into a new set of N coordinates, known as principal components. This new space has some interesting characteristics, including that its coordinates are mutually orthogonal and that they are ordered in decreasing order according to the amount of information contained from the original variables. Therefore, the first principal component (pc1) accounts for the largest amount of the total variability in the set of N original variables. The second vector (pc2), orthogonal to the first, accounts for the largest amount of the remaining variability in the original variables. Each succeeding pc is linearly uncorrelated to the others and accounts for the largest amount of the remaining variability [49]. By selecting the first N principal components, the number of dimensions to be included in an analysis can be reduced (from N to n) while retaining as much of the information in the original variables as possible, a process called dimensionality reduction. The ranking of the principal components in order of their significance (based on the proportion of total variability that they capture) is denoted by the eigenvalues associated with each pc.
In this study, the principal components associated with all variables identified as relevant for measuring inclusive growth (Table 2) were calculated. By retaining only those principal components that account for a substantial proportion of the variability (at least 80 per cent) in the original data, a smaller number of independent indices of inclusive growth were generated.
Before undertaking PCA, it was necessary to convert the original variables into standard comparable units as different scales could affect the application of the method. Therefore, each variable was standardized to have a mean of zero and a standard deviation of one. The PCA was then applied to the completed, standardised data. The results presented here correspond to PCA output following an orthogonal rotation (varimax). The rotation increases the specificity of each component, leading to a simpler structure and easier interpretation of the results. All calculations were undertaken using Stata software.
Matching principal components to economic theory
For the first pillar, Economy, three principal components were retained. The analysis is based on 168 observations, i.e. those countries that had data for all six indicators. Together, these three principal components explain 91 per cent of the total variance of the six original variables selected to measure the economy. Table 3 presents the three components and their contribution to explaining the variance in the observed variables for this pillar. In this case, the first component (interpreted as Economic Development, see also Table 6) accounts for 55 per cent of total variance. The second component (Trade) accounts for 19 per cent of total variance, while the third component (Employment) accounts for a further 17 per cent.
For the second pillar, Living Conditions, three principal components were also retained. The analysis was based on the 129 countries with complete data for all eight indicators. Together, the three identified principal components explained 90 per cent of the total variance of the eight variables selected for the measurement of this pillar. Table 4 presents the three components and their contributions to explaining the information contained in the original variables. The first component (Social & Health conditions) accounts for 44 per cent of total variance, while the second (Logistics & Finance) and third (Environmental Conditions) account for 33 and 13 per cent of total variance, respectively.
Retained principal components (eigenvectors) for pillar 2 – living conditions
Number of observations: 129
Number of principal components: 3
Variance retained: 0.9016
Components
Variance
Difference
Share in original variance
Cumulative variance
PC 1
3.4925
0.8266
0.4366
0.4366
PC 2
2.6659
1.6116
0.3332
0.7698
PC 3
1.0543
0.1318
0.9016
Rotated components (blanks correspond to coefficients with absolute value 0.3);
Rotation: orthogonal varimax (Kaiser off)
Variables
PC 1
PC 2
PC 3
Unexplained variance
Under-5 mortality rate
0.6084
0.0760
Access to safe water services
0.4523
0.1159
School enrolment, secondary
0.3800
0.1397
Coverage of essential health services
0.5105
0.0831
Fixed Internet broadband subscriptions
0.4643
0.1475
Logistics performance index
0.6650
0.1038
Access to bank account or mobile-money
0.5477
0.1127
CO emissions per GDP
0.9714
0.0087
Retained principal components (eigenvectors) for pillar 3 – inequality
Number of observations: 90
Number of principal components: 4
Variance retained: 0.8313
Rotated components (blanks correspond to coefficients with absolute value 0.3);
Rotation: orthogonal varimax (Kaiser off)
Components
Variance
Difference
Share in original variance
Cumulative variance
PC 1
2.2002
0.7233
0.3143
0.3143
PC 2
1.4769
0.3349
0.2110
0.5253
PC 3
1.1420
0.1421
0.1631
0.6884
PC 4
0.9999
0.1428
0.8312
Variables
PC 1
PC 2
PC 3
PC 4
Unexplained variance
Employment: youth/adult
0.5778
0.2415
Employment: male/female
0.6137
0.1815
Labour force: male/female
0.5212
0.2589
Income concentration ratio
0.7587
0.1737
Poverty headcount ratio
0.5599
0.3413
0.2431
School enrollment: boys/girls
0.9136
0.0765
Number of seats in national parliaments: male/female
0.9926
0.0060
For the third pillar, Inequality, correlation between the original variables was more limited. Therefore, four principal components were retained. The analysis is based on 90 observations. Together, these four principal components explained 83 per cent of the total variance of the seven original variables selected to measure inequality. Table 5 presents the four principal components and their contribution to explaining the variability in the observed variables for inequality. The first component (Equal LabourParticipation) accounts for 31 per cent of total variance. The second component (Income Equality) accounts for 21 per cent, whereas the third (School Enrolment) and fourth (Equal Political Participation) components account for 16 and 14 per cent, respectively.
Assigning weight to pillars
Weights can have a significant effect on the overall composite indicator and country rankings. Attributing weights to source indicators or pillars of a composite index can be done in several ways. They can be set to equality and such an unweighted index would imply that each pillar has equal importance for measuring inclusive growth. Weights can also be assigned based on expert assessment, policy priorities or theoretical factors. Finally, they can be determined using statistical techniques. Irrespective of which method is used, weights reflect value judgements. Opinions on which approach is the best vary. It should also be noted that even ‘unweighted’ indicators are implicitly weighted.
An equal weight could be assigned to each source indicator i.e. to each of the 21 indicators. The risk is that some source indicators are correlated and may be driven by common factors or trends. Combining correlated variables may potentially introduce an element of ‘double counting’ into the overall index. The equal weights approach also implies that all variables have the same importance to the index, and that a strong statistical, empirical and theoretical basis is missing. Equal weights can be tempting where knowledge regarding the causal relationships between source indicators is insufficient or consensus on the theoretical approach or policy priorities is lacking. Furthermore, as the source indicators are grouped into pillars that are subsequently aggregated, applying equal weights to the indicators implies an unequal weighting of the pillars as each pillar contains a different number of indicators. In this case, the Economy pillar includes six indicators, Living Conditions eight, and Inequality seven indicators.
For the purposes of this study, pillar weights were determined by quantifying the interconnections of source indicators using PCA. The advantage of this approach is that risk of subjective bias associated with experts’ views or other non-statistical methods is reduced. PCA is one of the most widely recognized statistical techniques used to calculate index component weights. As described above, this methodology transforms correlated source indicators to form new variables referred to as principal components, which account for decreasing shares of the original variance of data. Each principal component was attributed a weight corresponding to the share of variance explained.
The number of principal components identified within each pillar vary as they were selected according to a statistical criterion, namely the cumulative share of variance explained. The weights assigned to different principal components and source indicators are presented in Table 6. An interpretation of the principal components (based on the indicators included), and an explanation or link to inclusive growth is also provided in this table.
Weights of principal components and source indicators
Weight in pillar
Main indicators and their loadings
Link to inclusive growth
Pillar 1: Economy
Number of countries ranked: 168
Number of principal components identified: 3
PC 1: Economic development
0.55
GDP per capita
0.48
Indicators of economic activity, productivity and income reflect the level of
Adjusted net Income
0.50
economic development.
GDP per person employed
0.47
Electricity consumption
0.55
PC 2: Employment
0.19
Employment rate
0.996
Labour force is an essential driver of economic growth. Employment rate of the population reflects the extent to which a country’s population can participate in economic activity.
PC 3: Trade
0.17
Export to GDP ratio
0.91
This component echoes the economy’s openness and its participation in the international markets, which reflects its level of competitiveness and participation in international markets.
Pillar 2: Living conditions
Number of countries ranked: 129
Number of principal components identified: 3
PC 1: Social and health conditions
0.44
Under-5 mortality rate
0.61
This component measures basic life conditions and access to essential services, such
People using safe water
0.45
as safe water, education, and health.
School enrolment
0.38
Health services
0.51
PC 2: Logistics and finance
0.33
Internet connection
0.46
Access to Internet, financial services and logistics, reflect conditions to do business
Logistics
0.67
and be connected, important indicators of access to opportunities for the population.
Bank accounts
0.55
PC 3: Environmental conditions
0.13
CO emissions per GDP
0.97
This component adjusts the index for damage caused to the natural environment by economic production.
Pillar 3: Equality
Number of countries ranked: 90
Number of principal components identified: 4
PC 1: Equal labour participation
0.31
Adult vs youth
0.58
This component presents equality in labour markets, between men and women, and between young and old. Since labour is one of the most important sources of income for the population, access to jobs is a major indicator of inclusiveness in economic development.
Male vs female in labour force
0.61
Male vs female employed
0.52
PC 2: Income equality
0.21
Index Gini
0.76
In the same vein, this component reflects equality in the distribution of income and wealth.
Poverty headcount
0.56
PC 3: Equal school enrolment
0.16
Poverty headcount
0.34
As education largely influences future income and access to opportunities, this component addresses school enrollment as an important indicator of inclusive growth. Poverty also loads in this component.
School enrollment
0.91
PC 4: Equal political participation
0.14
Seats in parliament
0.99
The fourth component measures women’s and men’s equal opportunity to influence political decision-making.
Benchmarking the index of inclusive growth
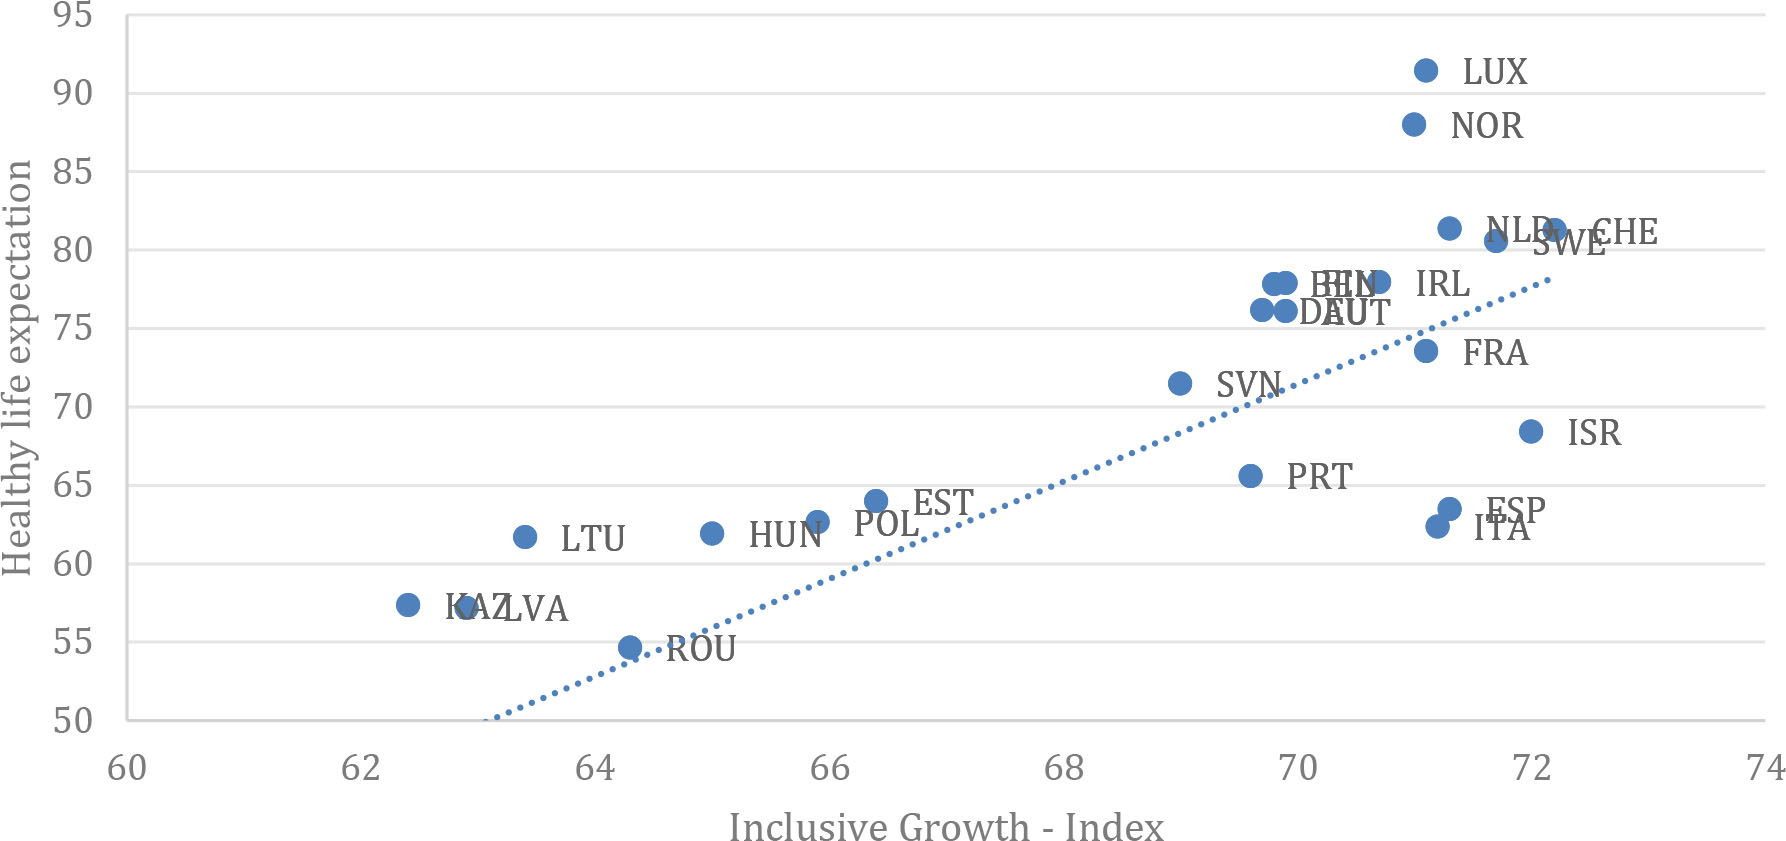
To test the explanatory power of a composite index, simple cross-plots should illustrate the linkages of the index to well-known and measurable phenomena. The inclusive growth index, for example, could be linked to healthy life expectancy (or public expenditure on education), where good performance on the composite indicator of inclusive growth (i.e. higher) would be expected to yield higher health life expectancy or to have high public expenditure on education. Correlating inclusive growth with healthy life expectancy (see Fig. 1) and with public expenditure (see Fig. 2) show this linkage.
In Fig. 1, most countries are close to the trend line. Only Norway and Luxembourg are clear outliers. Norway is an outlier due to both, effective public health policies that have reduced the prevalence of risk factors and health care system’s capacity to deliver high quality care to its population (Norway spends more than 10 per cent of GDP on health – more than any other EU country) [50].
Inclusive growth and healthy life expectancy (years) – Europe, 2019.
Inclusive Growth and education expenditure (public).
Part 3 – Results, Discussion and Conclusion
This section presents some summary results, followed by a discussion of the strengths and weaknesses of the inclusive growth measure. This is followed by some concluding remarks.
Summary results
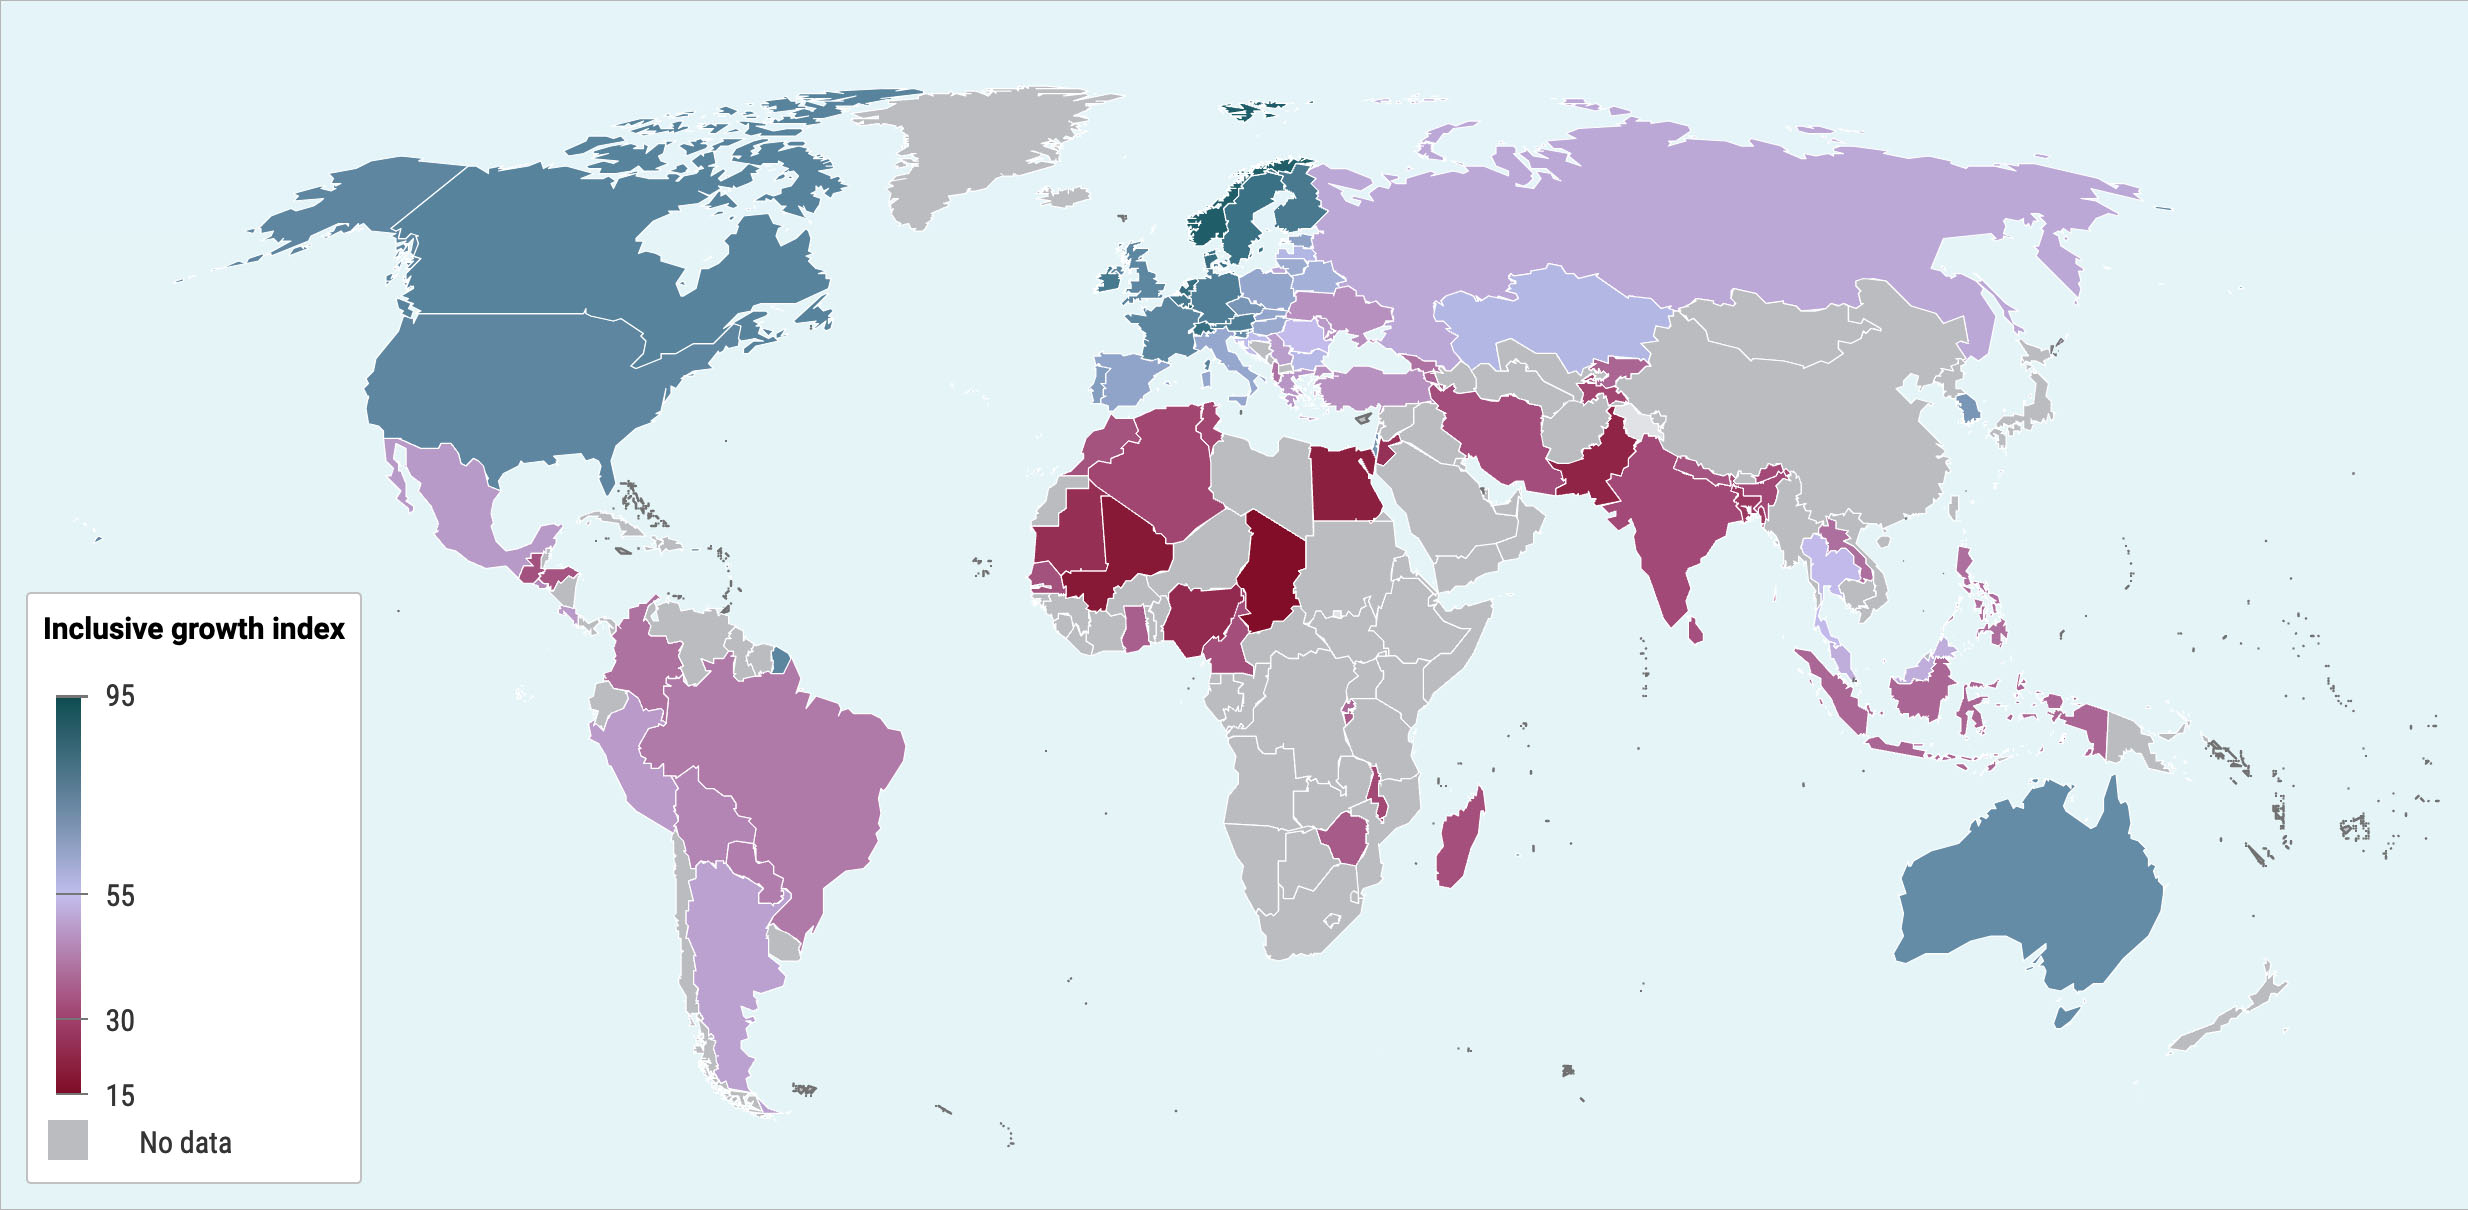
The construction of a composite index of inclusive growth has helped to reveal the disparities between regions of the world. An examination of the pillars provides some insights into the underlying reasons. The full list of the assessed countries and the attributed scores are detailed in Annex 3.
As could have been anticipated, higher levels of inclusive economic growth are generally associated with the more developed economic countries. Among the highest-ranked countries (by overall index score), are Luxembourg, Norway, and Denmark. In fact, the top-ranked 18 countries are all advanced economies. At the other end of spectrum are the least developed countries. The results suggest that issues, such as inequality, generally receive attention only after a certain level of economic development has been attained.
Israel and the Republic of Korea, which appear to be the highest-ranked developing countries (a curious classification anomaly outside the scope of this paper), score highly within the economic pillar. While Luxembourg ranks highest and Lesotho ranks lowest in Pillar 1, which is related to economic performance, they have different rankings for Pillars 2 and 3, which relate to living conditions and inequality, respectively. This demonstrates that a country’s overall ranking on the composite index is not solely determined by its economic performance. In fact, ensuring that the benefits of economic growth are distributed equally among all members of a society can be challenging. This issue may not be fully addressed until a country has reached a certain level of economic growth and prosperity. Policymakers should keep this in mind when developing strategies for promoting sustainable development and reducing inequality.
Developing countries appear to be the most heterogeneous group characterized by the largest gap in overall index scores between Israel (highest: 0.68) and Egypt (lowest: 0.21). This heterogeneity is most pronounced with regard to inequality, where scores for the same two countries range from 0.86 to 0. The most homogeneous group is the LDCs, for which the difference in the overall index scores does not exceed 0.28 points.
Inclusive growth index, 2019.
Discussion – Strengths and weaknesses
The discussion below will focus on three areas. The first discussion will focus on the limitations of composite indices, the second on the challenges associated with including emissions into the index, and the third will address some general methodological issues.
Limitations of composites
Compiling a robust composite indicator is complex and challenging, hence, transparency around the methods used and choices made is crucial. Poor choices in the weighting or aggregation of an indicator may result in a ‘meaningless’ measure which will in turn lead to misplaced conclusions. Even a well-constructed composite indicator that provides a valid measurement of the phenomenon in question will be imperfect. There is no such thing as a ‘perfect aggregation’ scheme [51, 52]. This is one of main drawbacks in using composite indicators and why caution must always be exercised when interpreting results [53], especially when the indicator is being used to guide policy actions [54].
Although PCA provides a technique to minimise bias while attributing weights, critics of the PCA method argue that the results are difficult to interpret, that weights can be unstable [55] and that PCA results can suffer from considerable year-on-year fluctuations [56]. Finally, policymakers should not solely rely on the composite index scores to make decisions about a country’s development but should also pay attention to the changes happening within each dimension of the index. Each dimension of the index should not be evaluated separately from the others but should instead view them as interdependent and integrated parts of a larger whole. The same logic applies to the pillar weights.
Composite indicators should be tested for their robustness [41]. One such tool for undertaking such a test is ‘uncertainty analysis’ which refers to observed changes in the composite index from potentially different choices when constructing the index. Ideally, uncertainty analyses provide some assessment of the impact or effect of choices made at each step during the construction of the index e.g. the selection of indicators, imputation of missing data, normalization of data, weighting and aggregation [57]. Another robustness test is ‘sensitivity analysis’ which measures how much variance of the overall output can be attributed to those uncertainties [53].
Irrespective of what robustness analyses are done, they cannot provide an assessment of robustness or validation of whether the index is ‘sensible’ or not [41]. There always remains a subjective element. In this case, the compiler must decide what constitutes ‘inclusive growth’. Consequently, transparency regarding the theoretical or conceptual framework and the methods used is of paramount importance, as it helps users to identify the values and logic underpinning the indicator. As the OECD [41] note ‘the peer community is ultimately the legitimate forum to judge the soundness of the framework and fitness for purpose’.
Including the environmental dimension
Much of the debate surrounding the development of a complementary or replacement index to GDP stems explicitly or implicitly from concerns with the growth paradigm – in particular the limitless growth paradigm. As the name suggests, the IGI still aspires to growth, but more inclusive and sustainable growth. Thus, the IGI should not be confused with static or degrowth ideologies. An important shortcoming in the IGI as currently constructed is that the sustainable element is weak. Due to poor country coverage of environmental indicators, it was not possible to include a full environmental pillar in the inclusive growth index. For stable and reliable results, PCA requires a high number of countries with full indicator coverage relative to the number of variables. Given this data limitation, there is still some way to go before it will be feasible to add an environmental pillar with indicators that enjoy comprehensive country coverage. However, a lot of progress is being made in this domain, thanks both to the SDG Global Indicators Framework and the incremental adoption of the System of Environmental-Economic Accounts by countries [58]. It is anticipated that the next generation of this Inclusive Growth Index will be able to incorporate more environmental indicators, which have gained prominence, and consequently greater country coverage, owing to growing concerns regarding climate change and environmental degradation. This will hopefully allow the IGI 2.0 to have an environmental pillar as theoretically envisaged.
As it was not possible to create a pillar for environmental sustainability (based on a single indicator) into this first generation of the index, CO emissions per GDP were included as part of the second pillar, Living Conditions, as this variable is directly connected with health and access to basic services. There, it forms its own principal component as the only environmental indicator, while the other two principal components represent Social and Health Outcomes (PC1) and Logistics and Finance (PC2). As a robustness test, this variable was also included in the first pillar, where it also formed its own principal component, but the corresponding factor loadings had an opposite sign meaning that it contributes to the given component but in an opposite direction, compared to other economic indicators of the pillar 1. This reflects how, up to now, economic growth has been achieved mostly at the expense of environmental sustainability. Indeed, recent studies have shown that for some countries, it is hard to demonstrate the “intuitive positive” correlations between growth and CO emissions. The environmental Kuznets curve (EKC) hypothesis which postulates an inverted U-shaped relationship between emissions and per capita income, suggests that early stages of economic development show a negative relationship, but that there is a turning point where once a country reaches a certain standard of economic growth, emissions would be reduced and environmental conditions improved [59].
When added to the second pillar, CO emissions tends to generate a separate PC, exactly in the same way it did within the first pillar. A sensitivity test was performed by varying the maximum limit of components, which did not yield different satisfactory results, if CO is not included in Pillar 2. When CO2 is not included in Pillar 2, the distribution of variables within the index resembles “Maslow’s pyramid”.10 This is because the basic life conditions characteristics, such as access to water, education, and healthcare, have been separated from those less vital, such as access to the internet and financial services.
Another test was made by changing the indicator (the CO) with close ones – “air pollution, % of population exposed” and “air pollution, mean annual exposure”. The purpose of this test was to see if using different indicators would yield different results. During this test, it was discovered that one observation (Macedonia) had to be dropped, while the data for the rest of the sample remained present. Unfortunately, it was also found that in each case, the corresponding indicator composed a separate principal component (PC3) within pillar 2.
As a result, the meaning of PC3 has been the only reason for a country not to be ranked higher than another country (i.e., there has been no country which has been ranked higher than another while having higher estimations for PC3 while lower for both PC2 and PC1.) Nevertheless, despite the difficulty in explaining the separation from the economic perspective, pondering the prospects for the update of the IGI in the coming years, it may prove challenging to obtain interpretable results. Finally, CO emissions were included in the second pillar. However, the concerns noted above should be borne in mind.
A study of the relationship between CO, economic growth, and openness, showed some results which suggest that economic growth is not the only way to improve the quality of the environment and that the resulting EKC hypothesis is inconclusive [60]. The authors expected that CO emissions and free trade would have an inverted U-shaped relationship. However, if a country’s income level is not high enough for it to care about the environment, then trade liberalization is likely to be an important factor influencing the deterioration of the quality of the environment. This suggests pollution is likely to decrease when the country becomes more open. Increased levels of income from free trade can elevate a country’s standard pf living; the public may not only be concerned about the quality of their environment but also their ability to increase their consumption of environmental goods. Developing countries’ markets pursuing a policy of openness tend to accept pollution-intensive industries to achieve a higher rate of economic growth. By contrast, developed countries typically apply strict environmental standards to attract eco-friendly industries. Another study [61] showed that for most rich countries CO intensity fell over time with a negative correlation to GDP per capita. Many poor and medium rich countries show the opposite, a positive time trend with a positive correlation to GDP per capita. For about half of the countries with a negative correlation between CO intensity and GDP per capita, and in particular the largest economies of the world, there is strong evidence that CO2 intensity falls at a diminishing rate as countries get richer. There are indications that poor and medium rich countries experience a boost in CO intensity as they embark on industrialization. As countries get richer, CO intensity falls, but at a declining rate. Hence, economic growth will not by itself go very far in reconciling economic growth and reductions in CO emissions. In poor and medium rich countries that are industrializing, emissions may increase rather than fall as a result of industrialization. This will make it harder to reconcile economic growth and cuts in CO emissions. Structural changes in GDP (more services) will not be enough; new technologies are needed.
Other methodological issues
Initially, the healthy life expectancy indicator was included in pillar 3 – Inequality, where it explained 80 per cent of the total variance of the sub-indices that that had been selected to measure inequality. The first component, labour participation inequality, accounts for 25 per cent of total variance. The second component, life expectancy inequality, accounts for 23 per cent of the remaining variance. The third component, income & political inequality, accounts for 20 per cent of the remaining variance, and the fourth component, participation in society, accounts for 13 per cent of the remainder. This posed a challenge for interpretation i.e. there was no intuitive explanation of principal components’ values within the third pillar owing to the inclusion of life expectancy which represents a relatively high variance. Three EAEU Member States (Belarus, Kazakhstan, Russia) were ranked highly (TOP-6 rated), which was in no small measure owing to the equality in healthy life expectancy among males and females (the second PC) in those countries. In contrast, Russia’s scores for PC 3 and PC4 were far below average. Consequently, the life expectancy variable was moved to the second pillar, living conditions, then removed completely due to its high correlation with the other indicators in the second pillar.
Conclusions
The broad concept of inclusive growth envisages economic growth that simultaneously contributes to improving everyone’s quality of life equally. In practical terms however, it remains an open question as to what precisely that means. This has implications for how it should be measured and how it can be achieved.
Inclusive growth is recognised as a multifaceted phenomenon. The main characteristics are not easily conceptualized, measured or presented in statistical form. Consequently, there are no generally recognized set of indicators or policy prescriptions for countries to adopt. To date, the international focus has been on economic performance, but the limitations of GDP as a metric of progress are now increasingly recognized. Today, we are in an interregnum period, where it is accepted that GDP not suitable for the purposes for which it is being used, but a suitable, universally accepted alternative has not yet emerged. Arguably the 2030 Agenda and SDGs, in their totality, approximate inclusive growth quite well. However, no indicators have been proposed to address the 2030 Agenda call to develop ‘measurements of progress on sustainable development that complement GDP’. As a result, in order to address the challenge of elaborating inclusive growth metrics, different international organisations have developed a variety of competing dashboards and composite indices. In recognition of this situation, the UN published a consolidated position paper ‘Valuing What Counts –United Nations System-wide Contribution on Progress Beyond Gross Domestic Product (GDP)’ in 2022, which may signal a concerted effort by the UN to reach a consensus on this complex topic [62].
The choice between a dashboard and an aggregate index is important, as countries need to target or prioritise elements of economic development, education, political participation, depending on local circumstances. But how should countries identify targets to be prioritized or understand the trade-offs between choices? A dashboard may have the advantages of avoiding problems, such as, weighting and prioritization of underlying indicators. But a single composite index, accompanied by sub-indices (pillars), can facilitate an understanding of trade-offs and can also produce rankings, which can be useful in understanding the impact of policy choices. In this study, a dual approach is adopted whereby inclusive economic growth is examined, using a global composite indicator with rankings, combined with principal components or pillars.
For the purposes of this study, inclusive growth is defined as a convergence in the quality of life for all population groups within EUEU countries, achieved not only through the governmental redistribution of economic performance outcomes but also through the creation of favorable, non-discriminatory economic conditions, that allow each population group to achieve self-sufficiently quality of life comparable to other groups and contributing to the improved quality of life of the entire population.
Many inter-related factors potentially affect the inclusiveness of economic growth. Consequently, policymakers may struggle to design effective policy measures that avoid unanticipated negative consequences. Equally statisticians face challenges in trying to measure inclusive growth. On the one hand, some argue that complexity is unavoidable and that all dimensions of inclusive growth must be quantified. On the other hand, a counter argument can be made that it is possible, and indeed necessary, to distil information to inform more ‘focused’ policy responses. The approach adopted in this paper has adopted the latter approach and presents a synthesis of the principal components of inclusive growth based on a selection of indicators. For the aggregate composite index, three pillars were identified:
Economic pillar composed of economic development, trade openness and employment clusters;
Living conditions pillar composed of three clusters on social and health conditions, logistics and finance, natural environment; and
Equality pillar composed of four clusters looking at equality in labour participation, income, school enrolment and political participation.
Weights were assigned according to the extent to which a variable influenced the dataset variance; the same technique was used to attribute coefficients to the pillars within the index, with the advantage that they are the most neutral and least biased.
According to the rankings established by the composite indicator, higher inclusive economic growth is generally observed in more advanced economies. At the other end of the spectrum are the least developed countries. It appears that the issues of inequality generally receive attention only after a certain level of economic development has been attained.
The indicator framework presented above may well require adjustments in the future as new indicators become available and as country coverage of relevant indicators improves. It may also be necessary to include new elements or dimensions into the concept of inclusive growth. In May 2019, the Interagency and Expert Group on SDG Indicators (IAEG-SDGs) noted that 15 per cent of indicators were still classified as Tier 3, meaning they have no internationally established methodology or standards for their measurement yet. Since then, methodological work has progressed fast, and there are currently no remaining Tier 3 indicators, but it will take time for countries to begin producing data for these new SDG indicators. These limitations will be considered as the composite index of inclusive growth is developed, and as further research studies in the fields of inclusiveness and sustainability become available.
The Eurasian Economic Union member-states have experienced unequal levels of inclusive economic development. The analysis suggests that the member states all appear to have similar challenges. For example, common to all five countries, the challenges associated with logistics or environmental protection, appear to represent avenues for prospective joint action. At the same time, intra-union rankings are not consistent from one pillar to another and hence there is no clear best performer within the union. This suggests that there are opportunities to share experiences and better practices, which could take place in three major forms: (1) institutional reforms; (2) infrastructural enhancement; and (3) social policy adjustment.
The composite inclusive growth index contributes to the ongoing beyond GDP and inclusive growth debates. Moreover, it provides a working methodology for how inclusive growth could be measured and provides a working tool for policy makers to consider alternatives to traditional economic growth.
The Gini index measures the extent to which the distribution of income (or, in some cases, consumption expenditure) among individuals or households within an economy deviates from a perfectly equal distribution [].
Five indicators are the same as used in the SDG indicator framework: (1) Under-five mortality rate (SDG 3.2.1); (2) coverage of essential health services (SDG 3.8.1); (3) fixed Internet broadband subscriptions (per 100 people, SDG 17.6.1); (4) access to bank account or mobile-money service (SDG 8.10.2); and (5) CO emissions (kg per unit of GDP, SDG 9.4.1). A further five were derived from indicators used in the SDG indicator framework, including (1) GDP per capita (derived from SDG 8.1.1); (2) labour productivity (GDP per person employed, derived from SDG 8.2.1); (3) access to safe water services (derived from SDG 6.1.1); (4) poverty headcount ratio (below US$5.50 per day, derived from SDG 1.1.1 for below US$1.90 per day); and (5) proportion of seats held by women (derived from 5.5.1).
See UNCTAD [44], Fukuda-Parr [45] and Adams and Judd [] for a fuller discussion on the contested issue of measuring inequality in the context of Agenda 2030.
Variables, such as the logistics performance index (indicator 2.5) and the proportion of adults with an account at a financial institution (indicator 2.7), are good examples of time series that were repaired using this approach.
For example, gaps in CO emissions per unit of GDP since 2014 (Indicator 2.8), were filled using data from the Global Carbon Atlas (http://www.globalcarbonatlas.org/en/content/welcome-carbon-atlas). These data, up to year 2017 had a very high correlation (0.9971) with the principal data source.
For instance, the indicator ‘people using safely managed drinking water’ (indicator 2.2) is seen as a more relevant indicator for medium-to-high income countries, but this variable is unavailable for some countries. However, a similar indicator, ‘people using at least basic drinking water’, is available for almost all countries. Thus, missing data for the preferred indicator were populated using a regression model based on the highly correlated (0.8213) variable on basic water services as the auxiliary variable.
For example, under-five mortality rate (deaths per 1,000 live births) was inverted by using the observed maximum among the countries. In the inverted form, a higher value signified more live births. CO emissions per unit of GDP is another example, where in an inverted form, the higher value signified fewer CO emissions per unit of GDP.
A symmetric transformation was undertaken of the ratios of youth to adult employment (indicator 3.1); female to male employment (indicator 3.2); female to male labour force participation (indicator 3.3); secondary school enrollment (indicator 3.6); and seats held by women and men in national parliaments (indicator 3.7). After the transformation, the same rate for female and male (or youth and adults) equals one - the best possible value. The proportion of seats held by women in national parliaments (percentage of total number of seats) was transformed so that a 50-50 parity in Parliament (the optimal solution) equates to the highest possible value (value 1) and all other distributions or solutions are less than one.
Maslow’s pyramid is a theory that suggests that human needs are arranged in a hierarchy, with basic physiological needs at the bottom and higher-order needs, such as self-actualization, at the top.
Supplementary data
The supplementary files are available to download from http://dx.doi.org/10.3233/SJI-230025.
References
1.
StiglitzJESenAFitoussiJP. Report by the commission on the measurement of economic performance and social progress. 2010. Available at: http://www.cfr.org/world/report-commission-measurement-economic-performance-social-progress/p22847 (accessed 7 March 2013).
2.
DickinsonE. GDP: A brief history – One stat to rule them all. Foreign Policy, January–February 2011. 2011. Available at: http://foreignpolicy.com/2011/01/03/gdp-a-brief-history/ (accessed 16 August 2020).
3.
FioramontiL. Gross domestic problem: The politics behind the world’s most powerful number. London: Zed Books. 2013.
4.
PhilipsenD. The little big number – How GDP came to rule the world and what to do about it. Princeton, NJ: Princeton University Press. 2015.
5.
PalmerEZ. The meaning and measurement of the national income. University of Nebraska Press. Lincoln. 1966.
6.
DeatonA. The great escape: Health, wealth, and the origins of inequality. Princeton University Press. Princeton, New Jersey. 2013.
7.
StiglitzJE. America’s GDP fetishism is a rare luxury in an age of vulnerability – traditional measures seem more abstract than ever as they fail to recognise the struggles of wage-earners in the real world. The Guardian, 13 October 2014. 2014. Available at: http://www.theguardian.com/business/2014/oct/13/gdp-fetishism-luxuryvulnerability-economic-measures (accessed 30 March 2016).
8.
TalberthJCobbCSlatteryN. The genuine progress indicator 2006 – A tool for sustainable development. Redefining Progress, Oakland, CA. 2007.
9.
HoekstraR. SNA and beyond: Towards a broader accounting framework that links the SNA, SDGs and other global initiatives. Statistical Journal of the IAOS. 2020; 36(3): 657-675.
10.
MacFeelySvan de VenP. GDP and the SNA: Past and present. In (SnijkersG, et al.) (Eds.). Advances in Business Statistics, Methods and Data Collection. John Wiley and Sons, New Jersey, USA. 2023.
11.
KuznetsS. How to judge quality. New Republic 1962 issue, October 2029–2031. 1962. Available at: http://www.unz.org/Pub/NewRepublic-1962oct20-00029 (accessed 26 September 2016).
12.
United Nations, European Commission, IMF, OECD, World Bank. System of national accounts 2008. 2009. Available at: https://unstats.un.org/unsd/nationalaccount/docs/SNA2008.pdf (accessed 19 May 2021).
13.
MacekuraSJ. The mismeasure of progress: Economic growth and its critics. The University of Chicago Press, Chicago and London. 2020.
14.
KaganJ. Gross National Happiness (GNH): Definition of index and 4 pillars. Investopedia, October 5, 2021. 2021. Available at: https://www.investopedia.com/terms/g/gnh.asp#:∼:Text=King%20Jigme%20Singye%20Wangchuck%20told,idea%20and%20run%20with%20it [last accessed: 31.03.2023]
15.
NordhausWDTobinJ. Is growth obsolete? In: Economic Research: Retrospect and Prospect, Economic Growth, vol. 5 (ed. Nordhaus WD and Tobin J). NBER. e ISBN: 0-87014-254-2. 1972. Available at: https://www.nber.org/system/files/chapters/c7620/c7620.pdf [last accessed: 31.03.2023]
16.
The Economist. The trouble with GDP. April 30, 2016. 2016. Available at: https://www.economist.com/briefing/2016/04/30/the-trouble-with-gdp [last accessed: 31.03.2016]
17.
European Commission. GDP and beyond measuring progress in a changing world. Communication from the Commission to the Council and the European Parliament. Brussels, 20.8.2009 COM(2009) 433 final. 2009. https://ec.europa.eu/eurostat/cros/system/files/06_GDP%20and%20beyond.pdf (accessed 05 February 2021)
18.
MacFeelySvan de VenP. GDP and the SNA: Future challenges. In (SnijkersG, et al.) (Eds.). Advances in Business Statistics, Methods and Data Collection. John Wiley and Sons, New Jersey, USA. 2023.
19.
United Nations. Universal declaration of human rights. New York (US): United Nations General Assembly; General Assembly Resolution 217 A of 10 December 1948. 1948. Available at: http://www.un.org/en/universal-declaration-human-rights/. (accessed 13 February 2017).
20.
Equality and Human Rights Commission United Kingdom. Understanding equality. 2020. Available at: https://www.equalityhumanrights.com/en/secondary-education-resources/useful-information/understanding-equality (accessed 19 August 2020).
21.
KuznetsS. Economic growth and income inequality. American Economic Review. 1955; 45(1).
22.
LustigNAriasORigoliniJ. Reduccion de la pobreza y crecimiento economico: La doble causalidad. Serie de informes tecnicos del Departamento de Desarrollo Sostenible, IDB. Washington, DC. 2002.
23.
BirdsallNSzekelM. Bootstraps not band aids: Poverty, equity and social policy, in KuczynskiPPWilliamsonJ (eds.). After the Washington Consensus: Restarting Growth and Reform in Latin America. Institute for International Economics. 2003.
24.
ILO. World employment and social outlook. Trends 2020. Geneva. 2020. Available at: https://www.ilo.org/wcmsp5/groups/public/—dgreports/—dcomm/—publ/documents/ publication/wcms_734455.pdf (accessed 19 August 2020).
25.
Oxfam. Public good or private wealth, New Zealand. 2019.
26.
OECD. Inclusive growth. 2020a. Available at: https://www.oecd.org/inclusive-growth/ (accessed 19 August 2020)
27.
UNDP. Humanity divided: Confronting inequality in developing countries. UNDP Bureau for Development Policy. 2013. Available at: https://www.undp.org/sites/g/files/zskgke326/files/publications/HumanityDivided_Full-Report.pdf [Last accessed: 11.08.2022].
28.
IMF. Fostering inclusive growth. G-20 leaders’ Summit, July 7–8, 2017, Hamburg, Germany. 2017. Available at: https://www.imf.org/external/np/g20/pdf/2017/062617.pdf [Last accessed: 11.08.2022]
29.
UNCTAD. Trade and development report, 2017 – beyond austerity: Towards a global new deal. 2017. Available at: https://unctad.org/webflyer/trade-and-development-report-2017 [Last accessed: 11.08.2022]
30.
United Nations Statistical Commission. Report of the inter-agency and expert group on sustainable development goal indicators – note by the secretary-general, presented to the 47th Session, 8–11 March 2016, New York. Doc E/CN.3/2016/2/Rev.1. 2016. Available at: http://unstats.un.org/unsd/statcom/47th-session/documents/2016-2-IAEG-SDGs-Rev1-E.pdf. (accessed 30 March 2016).
31.
MacFeelyS. Measuring the sustainable development goal indicators: An unprecedented statistical challenge. Journal of Official Statistics. 2020; 36(2): 361-378.
32.
Asian Development Bank. Strategy 2020. The long-term strategic framework of the asian development bank, 2008–2020. 2008. Available at: https://www.adb.org/sites/default/files/institutional-document/32121/strategy2020-print.pdf (accessed 19 August 2020).
33.
Asian Development Bank. Framework of inclusive growth indicators. Key Indicators for Asia and the Pacific 2014. Special Supplement. 2014. Available at: https://www.adb.org/sites/default/files/publication/42813/ki2014-special-supplement_0.pdf (accessed 19 August 2020).
34.
European Commission. Communication from the commission. Europe 2020. A strategy for smart, sustainable and inclusive growth. Brussels. 2010. Available at: https://eur-lex.europa.eu/legal-content/EN/TXT/PDF/?uri=CELEX:52010DC2020&from=EN (accessed 19 August 2020).
35.
OECD. Opportunities for all - A framework for policy action on inclusive growth. 2018. Available at: https://www.oecd-ilibrary.org/economics/opportunities-for-all_9789264301665-en (accessed 19 August 2020).
36.
UNDP. UNDP’s strategy for inclusive and sustainable growth. New York. 2017. Available at: https://www.undp.org/content/undp/en/home/librarypage/poverty-reduction/undp_s-strategy-for-inclusive-and-sustainable-growth.html (accessed 20 August 2020).
37.
World Bank. World bank group strategy. DC2013-0009. 2013. Available at: https://www.devcommittee.org/sites/dc/files/download/Documentation/DC20013-0009%28E%29WBGStrategy.pdf (accessed 20 August 2020).
38.
IanchovichinaELundstromS. Inclusive growth analytics framework and application. Policy Research Working Paper 4851. World Bank. 2009. Available at: http://documents1.worldbank.org/curated/en/771771468180864543/pdf/WPS4851.pdf (accessed 20 August 2020).
39.
World Economic Forum. The inclusive development index 2018. Summary and Data Highlights. 2018. Available at: https://www.weforum.org/reports/the-inclusive-development-index-2018 (accessed 20 August 2020).
40.
OECD. Glossary of statistical terms. 2020. Available at: stats.oecd.org/glossary/index.htm (accessed 28 August 2020).
41.
OECD. Handbook on constructing composite indicators. Methodology and User Guide. 2008. Available at: https://www.oecd.org/sdd/42495745.pdf (accessed 31 August 2020).
UNEP. Measuring progress: Towards achieving the environmental dimension of the SDGs. 2019. https://www.unen-vironment.org/resources/report/measuring-progress-towards-achieving-environmental-dimension-sdgs (accessed 29 May 2019).
44.
UNCTAD. The many faces of inequality. In SDG Pulse 2019. 2019. Available at: https://sdgpulse.unctad.org/in-focus-inequality/ (Last accessed: 21.05.2021).
45.
Fukuda-ParrS. Keeping out extreme inequality from the SDG Agenda: The politics of indicators. Global Policy. 2019; 10(S1): 61-69.
46.
AdamsBJuddK. Who influences whom in the policy arena? Statisticians seek greater voice. Global Policy Watch Briefing 29. March. 2019. Available at: https://www.globalpolicywatch.org/wp-content/uploads/2019/03/GPW29_2019_03_25.pdf (Last accessed: 21.05.2021).
47.
PearsonK. On lines and planes of closest fit to systems of points in space. Philosophical Magazine. Series 6, 2(11): 559-572. 1901. Available at: http://www.stats.org.uk/pca/Pearson1901.pdf (accessed 2 September 2020).
48.
HotellingH. Analysis of a complex of statistical variables into principal components. Journal of Educational Psychology. 1933; 24: 417-441 and 498-520.
49.
JolliffeIT. Principal component analysis. Springer Series in Statistics. 2002.
50.
European Commission. State of health in the EU: Norway – country health profile 2019. 2019. Available at: https://www.euro.who.int/__data/assets/pdf_file/0006/419469/Country-Health-Profile-2019-Norway.pdf [Last accessed: 15.08.2022].
51.
ArrowKJ. Social choice and individual values (2nd ed.). New York: Wiley. 1963.
52.
ArrowKJRaynaudH. Social choice and multicriterion decision-making. Cambridge: MIT Press. 1986.
53.
SaisanaMTarantolaS. State-of-the-art report on current methodologies and practices for composite indicator development. European Commission, Joint Research Centre, Institute for the Protection and the Security of the Citizen, Technological and Economic Risk Management Unit, Ispra, Italy. 2002.
54.
SaltelliA. Composite indicators between analysis and advocacy. Social Indicators Research. 2007; 81(1): 65-77.
55.
NasdaqPD. Chapter 10 Introduction to Principal Component Analysis: Stock Market Values. 2010. Retrieved from: https://pdfs.semanticscholar.org/db59/f01a2e8c0aadb95488fbbe4ea4590790de42.pdf.
56.
AbeyasekeraS. Chapter 18: Multivariate methods for index construction. Household surveys in developing and transition countries: Design, implementation and analysis. United Nations Statistics Division. Studies in Methods ST/ESA/STAT/ SER.F/96. 2003.
57.
GrecoSIshizakaATasiouMTorrisiG. On the methodological framework of composite indices: A review of the issues of weighting, aggregation, and robustness. Soc Indic Res. 141, 61-94. 2019. doi: 10.1007/s11205-017-1832-9.
58.
United Nations. System of environmental-economic accounting 2012: Central framework. 2012. Available at: https://seea.un.org/sites/seea.un.org/files/seea_cf_final_en.pdf [Last accessed: 16.08.2022].
KostakisIArmaosSAbeliotisKTheodoropoulouE. The investigation of EKC within CO2 emissions framework: Empirical evidence from selected cross-correlated countries. Sustainability Analytics and Modeling. Volume 3, 2023, 100015, ISSN 2667–2596. 2023. doi: 10.1016/j.samod.2023.100015.
61.
United Nations. Valuing what counts – united nations system-wide contribution on progress beyond gross domestic product (GDP). Prepared by the HLCP Core Group on Beyond GDP. CEB Chief Executives Board for Coordination. Advance Unedited Version – 17 August, 2022. 2022. Available at: https://unsceb.org/valuing-what-counts-united-nations-system-wide-contribution-beyond-gross-domestic-product-gdp#:∼:Text=CEB%20tasked%20HLCP%20to%20develop,Sustainable%20Development%2C%20SDG%20target%2017.19. [last accessed: 31.03.2023].
62.
HannessonR. Is there a kuznets curve for CO2-emissions?Biophysical Economics and Sustainability. 2022; 7(4). doi: 10.1007/s41247-022-00099-w.