






Abstract
In a rapidly globalizing world, understanding the relationships between major stock markets is of paramount importance for investors and financial analysts. This study explores the interdependence and cointegration of stock markets in Japan, India, and the USA, and explores the dynamics of global financial markets as well as the survival of a long-term and short-term link between these three indices. These leading stock markets were selected because of the researchers’ desire to learn more about the connections between them. From April 2012 through March 2022, we used monthly data from three major stock market indices: the NIKKEI (Japan), theBSE SENSEX (India), and the NASDAQ (USA). Stock market performance in both the United States and India tend to move together. Additionally, the GC test is utilized in an effort to ascertain if the markets have any form of forecasting ability. Based on the results of the tests conducted, it was determined that the NASDAQ index can accurately predict the SENSEX index, but the NIKKEI index. The United States and the Indian stock markets are highly correlated. To further investigate the markets’ potential for foresight, the Granger causality test is applied. Tests showed that while the NASDAQ index predicted the SENSEX index with high precision, the NIKKEI index did not. After a causal relationship has been established, we then look for evidence of a short- and long-term connection.
Introduction
In recent decades, the phenomenon of globalization has occurred as a prominent characteristic of financial markets. Financial markets are progressively becoming more interconnected on a global scale [1]. Both governmental authorities and financial specialists have dedicated substantial attention to fostering this linkage. Numerous compelling arguments support such endeavours. They include the facilitation of competitiveness and efficiency in allocating resources, the reduction of capital costs, and the mitigation of price instability across interconnected markets, all of which contribute to the preservation of monetary stability. The integration of stock markets plays a pivotal role in stimulating domestic investments and savings, potentially yielding positive effects on overall factor productivity and economic progress [2, 3, 4, 5].The integration of stock markets refers to a state in which various stock markets exhibit a synchronized movement, anticipating similar trends [6]. This integration has become possible through the liberalization of stock markets, allowing investors to participate in multiple national markets [7]. The removal of investment barriers across international stock markets has not only broadened investment prospects for individuals but has also fostered the amalgamation of global stock markets. As a result, financial shocks can propagate swiftly across integrated markets, affecting one financial market after another [8]. Numerous researchers have undertaken extensive research on the factors that influence and the intricate connections between global equity markets. Stock market interlinkages among different countries are considered the most efficient channel for global financial integration, with financial fluctuations often traced back to these stock market connections. Financial integration refers to the extent to which financial markets, institutions, and instruments are interconnected across different regions or countries. It reflects the degree of openness and interconnectedness of financial systems, allowing for the free flow of capital, investments, and financial services. In this research, financial integration is vital as it provides insights into how closely linked equity markets are across Japan, India, and the USA. By understanding the level of financial integration, can assess the degree of interconnectedness between these markets and identify potential channels through which shocks or events transmit across borders. Various methodologies and indicators are employed to measure financial integration, with a focus on equity markets in this research. Common approaches include analyzing cross-border capital flows, assessing the correlation of stock market returns, and examining the degree of cross-listings or foreign ownership in equity markets. Specific metrics such as correlation coefficients, beta coefficients, and portfolio diversification benefits are often used to quantify the level of integration. Additionally, techniques like cointegration analysis and vector autoregression (VAR) models may be employed to examine the long-term relationships and dynamic interactions between equity markets [9, 10]. Furthermore, numerous investigations have explored the relationships between regional markets, revealing interconnections among the well-established markets of the USA, Japan, and Europe [11]. Other studies have provided evidence of interconnectedness between the US, Japan, and Asian markets [12]. Recent investigations have established a correlation between the downturns in stock market indices after major occurrences like the October 1987 US stock market crash, the 1997 Asian Financial Crisis, and the 2008 Global Financial Crisis [13]. This correlation is attributed to the idea of cointegration and the interdependence among stock markets [14, 15, 16, 17, 18]. The analysis of cointegration in stock markets proves valuable for global investors, aiding them in making more informed investment decisions, facilitating international diversification, and minimizing risk exposure [19, 20].
This research investigates the interconnections among three distinct stock markets: Japan, India, and the United States of America. The United States market holds a prominent status as one of the most advanced, garnering substantial attention from traders and investors. Its economy and stock exchanges wield a substantial influence over global financial markets. Moreover, the considerable volatility associated with the US dollar further sets the United States’ dominant position on the international financial stage. Particularly, the leading financial markets have observed its profound impact on other financial markets. For instance, it is highly likely that the US stock markets act as catalysts for volatility spillover into other financial markets, particularly during financial crises [21, 22, 23, 24, 25, 26, 27]. In the year 2019, the bilateral trade relationship between the United States and India, encompassing the exchange of goods and services, reached an approximate value of $146.1 billion. As a pivotal global stock index, the NASDAQ index is a crucial component of this study.
India and Japan hold significant positions within the Asian region, both showcasing consistent and sustained economic growth in recent years. Japan ranks as thelargest economic power, with the United States of America being the only nation surpassing it in terms of economic supremacy. The NIKKEI index, designed to reflect the financial performance of 225 Japanese companies listed on the Tokyo Stock Exchange, caters to investors by providing a wide array of indices that mirror the performance of major industry sectors in the Japanese market. India, boasts a substantial portion of the global population, creating a vast local market that has contributed to its increasing international prominence. India’s robust democracy and strong partnerships have played pivotal roles in its rapid ascent to become the world’s fastest-growing major economy [28]. The selection of the BSE SENSEX index for this study was based on two key factors. Firstly, the Bombay Stock Exchange boasts the highest number of listed stocks in the country, offering a comprehensive representation of the Indian stock market. Secondly, the SENSEX index holds the largest market capitalization, exceeding Rs. 266 trillion [29]. Several researchers, employing multivariate cointegration analysis to explore the cointegration properties of various economic and financial variables, found no evidence of cointegration among international stock markets [30]. This study aims to investigate the potential of these indices in predicting the performance of other markets within the same group while also examining their long-term and short-term interrelationships.
The study offers several contributions such as,
The research provides empirical evidence of the interdependence between stock markets in Japan, India, and the USA. The inclusion of cointegration analysis in the study contributes to the understanding of long-term relationships and equilibrium among the stock markets of these three countries. The research explores the level to which financial markets in these countries are united regionally and globally. Understanding the dynamics of financial integration is crucial for assessing the impact of international events, such as economic crises and policy changes, on these markets.
To observe the degree of interrelationship between the stock markets of Japan, India, and the USA. To assess the presence and nature of cointegration among the stock markets of the three countries, indicating the long-term relationships between them. To explore the effect of global economic events and regional aspects on the interdependence and cointegration of these stock markets. To analyze the implications of stock market interdependence and cointegration for international investors and portfolio diversification strategies.
This research provides insights into the interdependence and cointegration of stock markets in three major economies: Japan, India, and the USA. Understanding how these markets are interconnected is crucial in the era of global finance, as it clears how economic events in one country can impact others. Knowledge of the degree of interdependence and cointegration helps in diversifying portfolios and making informed investment decisions. The research findings can guide investors in optimizing their portfolios by selecting less correlated assets, thus potentially enhancing the risk-return profile of their investments. The results of this research can be used to develop investment strategies based on market interdependence and cointegration patterns. This is valuable for traders and asset managers looking to exploit short-term and long-term market trends. In an increasingly interconnected world, understanding the dynamics of global stock markets is essential for maintaining financial stability.
The research paper investigates the interconnectedness and cointegration of stock markets in Japan, India, and the USA. The paper begins with an introduction that outlines the research objectives and significance. A comprehensive literature review explores relevant theories and previous research, highlighting gaps in the existing knowledge. The methodology section describes data sources and data analysis techniques. The results and discussion section presents empirical findings and their interpretation, the presentation of stock market data, descriptive statistics, and the various analytical methods to assess interdependence and cointegration and their implications. The paper concludes by summarizing key findings and offering recommendations for further research.
Literature review
RedyHerinanto Albertus [1] analyzed to investigate the impact of South East Asia and the Indonesia Stock Exchange in the period from 2017 to 2018. The primary independent variables considered in this study included KLCI, STI, SET, and PSEI. The dependent variable used in the analysis was JKSE. Utilizing multiple regression analysis, it was found that KLCI had a statistically insignificant negative effect on JKSE, STI also had a statistically insignificant negative effect on JKSE, and SET had a statistically significant positive effect on JKSE. Moreover, the combined impact of KLCI, STI, SET, and PSEI on JKSE was found to be statistically significant.
Tom Jacob and Littleflower P.J. [5] conducted an in-depth analysis to investigate the nature of linkages and the potential for establishing enduring and short-lived associations among the stock market indices. Analyzing yearly data covering the period from 2000 to 2021, the researchers conducted a comprehensive examination of stock market indices in selected countries. Their findings unveiled significant correlations among all the countries under examination, the prospects for worldwidestockholders to expand their investment portfolios effectively and ensure long-term profitability in these nations seem to be somewhat constrained. Particularly, the NSE Nifty and other major stock exchange indices in Asian and African markets demonstrate a persistent and enduring interrelationship.
Umm E. Habiba et al. [8], explored an extensive examination was undertaken to investigate the fields of cointegration and the spillover between the United States and the stock markets of South Asian nations. The research revealed a sustained long-term integration between the US market and the escalating stock markets of South Asia. It was discerned that the US stock market maintains a fundamental association with these stock markets in the short term. Additionally, the investigation observed that both returns and volatility spillover effects exhibit heightened prominence during periods of financial crises in comparison to non-financial crisis periods.
Sajid Salim et al. [10], examined the interconnectedness of regional and established stock markets. Their investigation sought to evaluate the effects of the worldwide financial emergency on the stock markets of these countries, accomplished by dissecting stock index data into two distinct periods. The findings of this study brought to light a remarkable increase in financial integration between the chosen Asian markets and the developed countries markets in the post-financial crisis era, as compared to the pre-crisis duration. Consequently, this implies that investors should seriously consider diversifying their portfolios in order to mitigate risk by spreading investments across multiple markets.
Dr Nisarg A Joshi et al. [18], explored into investigating the range of the interrelationship between the Sensex and several stock markets situated in the US and European regions. Their findings strongly suggest a notable degree of interconnectivity among these stock markets. Furthermore, their research brought to clear association between these markets. Especially, this study unearthed both bi-directional and uni-directional causal relationships among the stock market indices. It is significant to note that this investigation demonstrated how the interdependence of markets can lead to enhanced short-term and long-term returns for investors, potentially attributable to the advantages of global portfolio diversification.
Y. Arul Sulochana and Dr S. Rajkumar [20] undertook an investigation that unveiled the existence of Cointegration within the Asian stock markets. Their primary focus revolved around exploring the mutual interdependence of the Indian stock market and a specific array of Asian stock markets. This comprehensive study encompassed emerging stock exchanges across Asian regions to assess Cointegration, they utilized the weekly returns of their stock indices during the research period. The study’s findings left no room for doubt, affirming the undeniable existence of Cointegration among the selected Asian stock markets.
Heitham Al-Hajieh [27] conducted an extensive analysis, exploring the dynamics of return and volatility within the S&P 500 and a portfolio of twelve Asian stock markets. This research was dedicated to assessing the effectiveness of employing a beta hedge strategy to manage the risk associated with returns in this particular stock market index portfolio while optimizing equity portfolios across these markets. The findings unveiled distinctive trends in the interplay of these markets. Particularly, Hong Kong and Singapore exhibited a pronounced inclination towards influencing other stock markets through their returns, while China emerged as a net beneficiary of this transmission. Surprisingly, the US market failed to present itself as a notably superior option for hedging purposes among Asia-Pacific nations.
Dr. Rajkumar S and Y. Arul Sulochana [30] explored cointegration relationships involving the Indian and European countries. Their research focused on examining the connection between the Indian and European stock markets. The JC test results indicated a significant cointegration between the variables. Additionally, the VECM analysis confirmed the occurrence of a long-term relationship, particularly between the Dax and Ftse 100 indices. Furthermore, the chi-square statistics derived from the VECM analysis provided further validation for the short-term relationship between all the variables.
Review performance
Review performance
The globalized financial landscape has observed an increased level of interdependence among stock markets worldwide, raising concerns and opportunities for investors, and economists. However, a comprehensive examination of the specific interrelationships and cointegration patterns among stock markets in Japan, India, and the USA is lacking in the existing literature. This research seeks to address this gap by inspecting the extent and nature of interdependence and cointegration among these three major economies’ stock markets. Understanding the dynamics of these relationships is important for risk management, investment decisions, and the development of effective financial policies.
Research gap
Previous research has extensively examined stock market interdependence and cointegration in individual countries and between certain pairs of countries, there is a notable lack of comprehensive studies that simultaneously investigate the dynamics and interconnections among the stock markets of Japan, India, and the USA. Existing studies often concentrate on bilateral or regional stock market relationships, overlooking the interdependencies and interactions among these three major economies. Investigating the simultaneous connections among the Japanese, Indian, and U.S. stock markets could offer a more nuanced understanding of the global financial system. As investors seek to diversify their portfolios in international stock markets, a comprehensive analysis of interdependence and cointegration between these three economies could explore opportunities for cross-continental diversification strategies. Such insights are invaluable for investors, asset managers, and financial analysts. The purpose of theresearch is to investigate an unprecedented tri-logical interaction between the markets in India, Japan, and the United States.
Methodology
Research questions
This research endeavour seeks to the following questions:
What underlies the core dynamics of the interplay between the stock market movements in the United States, India, and Japan? To what extent does the performance of one stock market influence the performance of another stock market? How can we characterize the enduring and short-term correlations among these stock market indices?
Data sources and collection
The data for this research was obtained from various sources including stock market indices such as the NIKKEI in Japan, SENSEX in India, and the NASDAQ in the USA, and historical data repositories. These sources provide comprehensive coverage of stock prices, trading volumes, market indices, and macroeconomic indicators for Japan, India, and the USA. These sources are widely recognized in the financial industry for their reliability and credibility. They are frequently used by professionals and researchers for conducting financial analysis and research studies. While these sources are generally reliable, it’s important to acknowledge potential limitations such as data lag, reporting biases, and occasional discrepancies between different data providers. Additionally, certain datasets may have limitations in terms of coverage, especially for smaller companies or less liquid markets.
Data collection involved accessing monthly time series data from the respective stock exchanges in Japan, India, and the USA from April 2012 to March 2022 under study. End-of-month data refers to the aggregation of daily stock market data into a single value after each month. This choice is likely from considerations related to data handling, analysis efficiency, or the desire to capture monthly trends rather than daily fluctuations. Aggregating daily data into monthly intervals has implications for the statistical distribution of the data. This process has the potential to smooth out short-term fluctuations and noise present in the daily data. Consequently, the statistical distribution and properties, including means, variances, and correlations, may be altered by this aggregation. One significant consequence of using monthly data is the potential loss of informational content and variance present in the original daily dataset. The granularity inherent in daily data allows for the capture of nuanced market dynamics and short-term trends. By converting to monthly intervals, some of this granularity is sacrificed, which could impact the accuracy of statistical estimates and the ability to detect subtle market movements. When analyzing the impact of using monthly data on capturing market shocks or events, it’s essential to understand how this choice affects the granularity and timeliness of information. Monthly data aggregation involves consolidating daily market activity into single points at the end of each month. This process may smooth out short-term fluctuations and potentially obscure the timing and magnitude of sudden market shocks or events. The paper emphasizes the importance of accurately capturing market shocks or events as part of its contribution to understanding stock market interdependence and cointegration. Therefore, it’s crucial to evaluate how the use of monthly data influences the paper’s ability to achieve this objective. Challenges encountered during data collection including data availability, especially for certain macroeconomic indicators and international stock exchanges. Additionally, ensuring consistency in data formatting and addressing missing or erroneous data points were key challenges. Consistency and accuracy were ensured through careful data validation, cross-referencing with multiple sources, and adherence to standardized data collection procedures. Raw data transformed such as logarithmic transformations and normalization to stabilize variance and improve interpretability. Missing data points were addressed using appropriate imputation methods such as mean imputation or interpolation to maintain the integrity of the dataset. Table 2 provides an overview of the stock indices employed in this research.
The stock indices used for the study
The stock indices used for the study
For data analysis, the monthly closing stock market index values were used. The investigation included the computation of the natural logarithm for the aforementioned stock market indexes.
Here,
The following Figs 1, 2 and 3 shows the graphical representation of the original data of three stock market indices.
NASDAC dataset graph.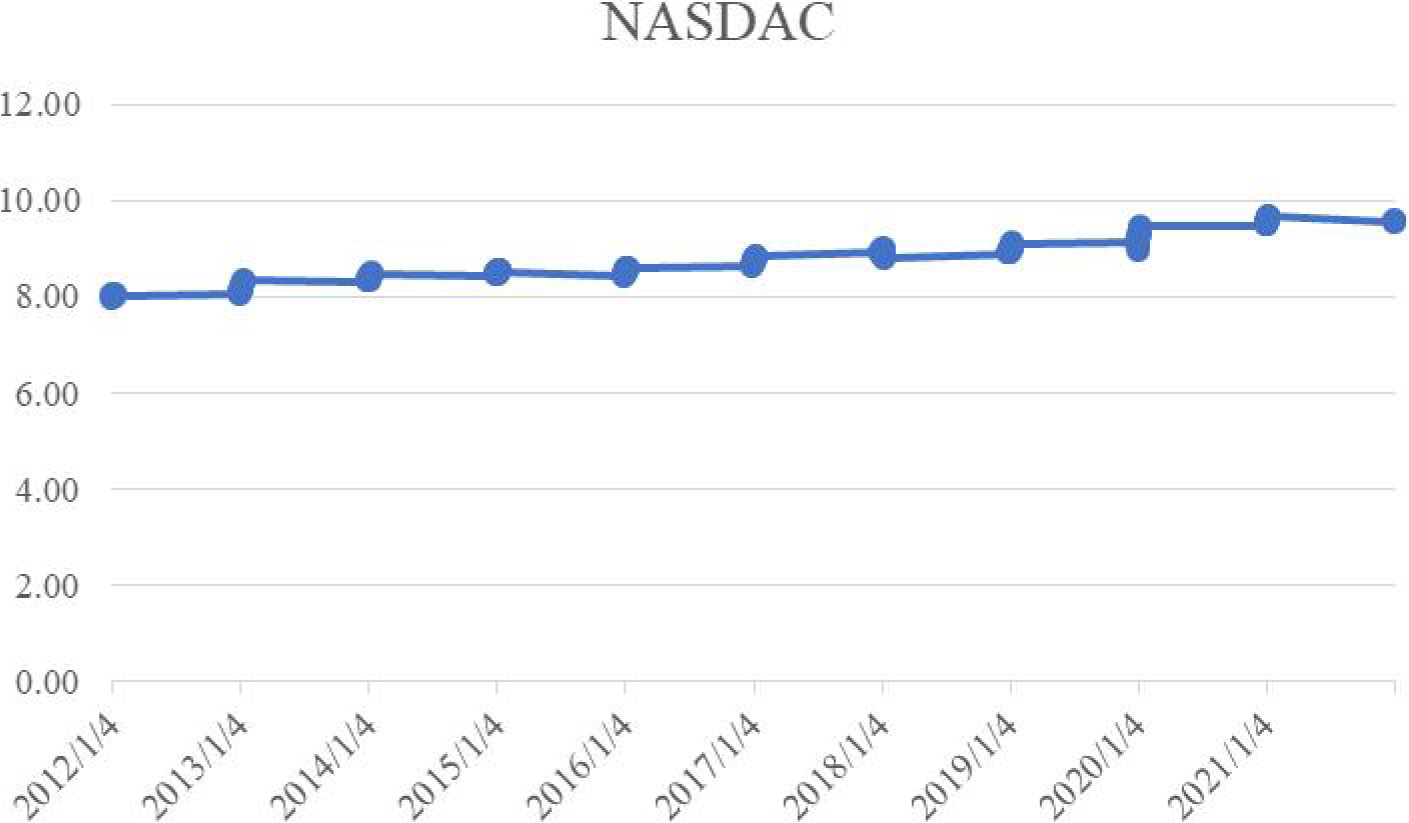
Sensex dataset graph.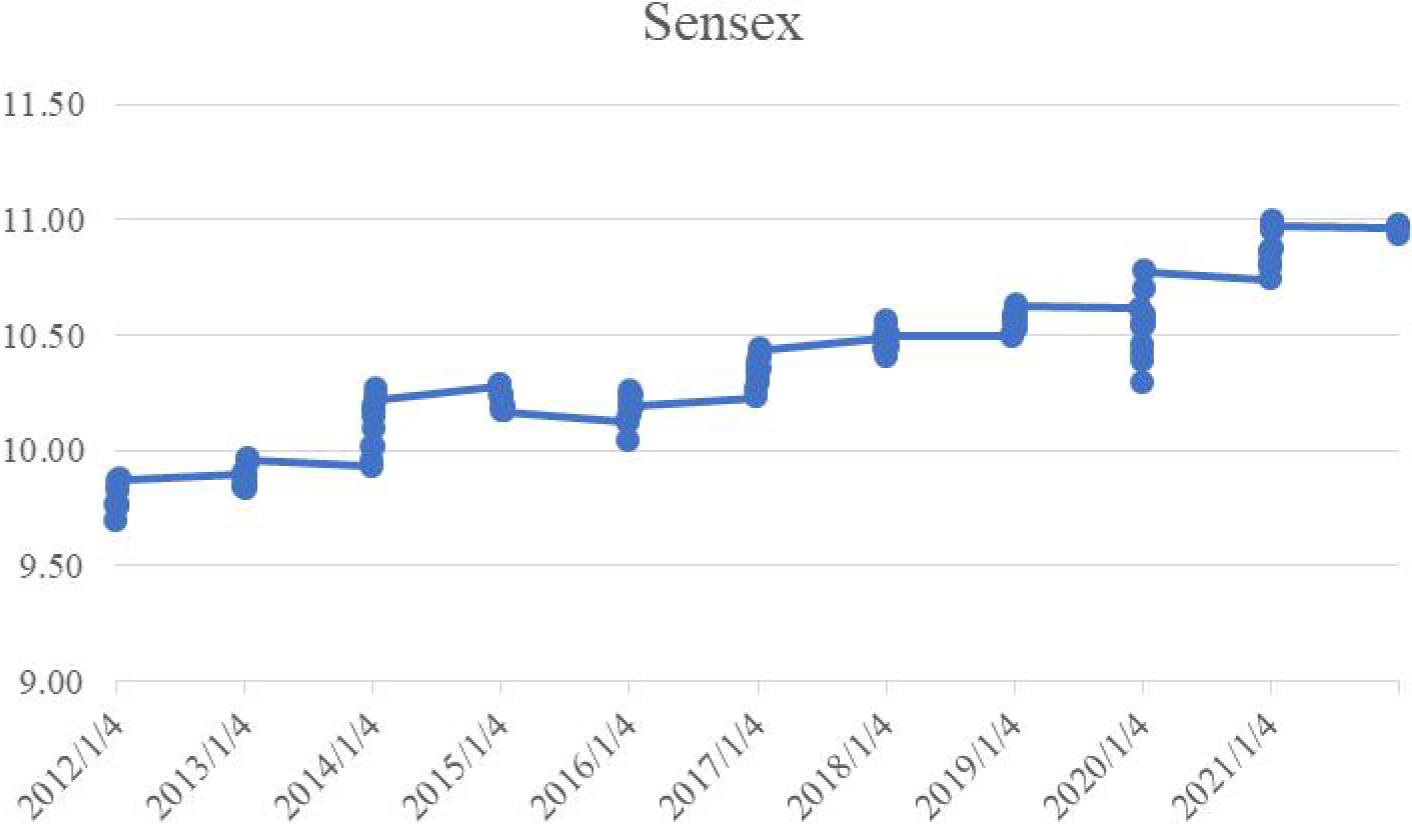
Nikkei dataset graph.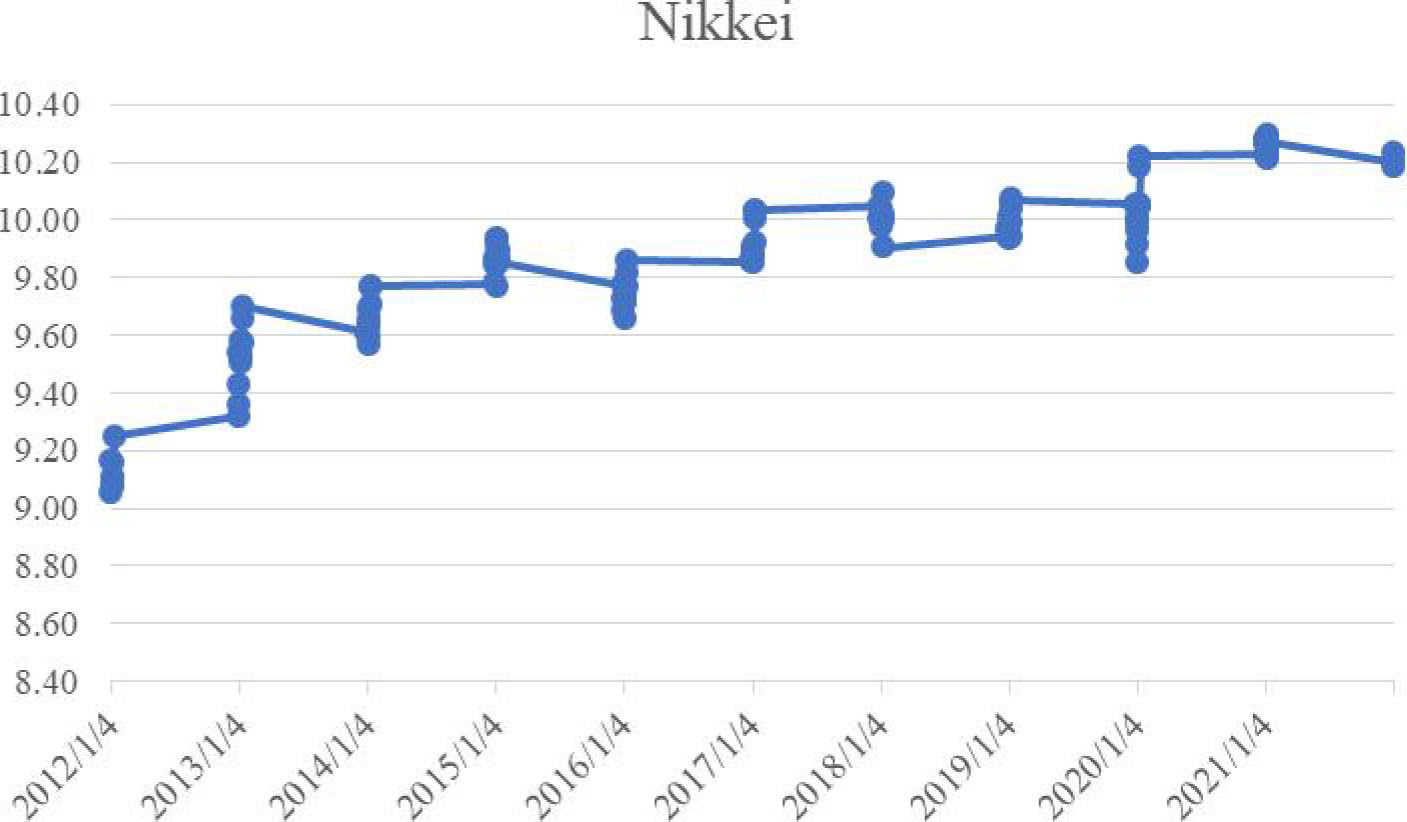
Normality test
Jarque-Bera (JB) test employed to evaluate the conformity of monthly closing index values from various stock exchanges to a normal distribution. The JB test stands as a widely employed method for scrutinizing the distributional traits of data sequences. The statistical procedure employed in the JB test can be summarized as follows:
when discussing normally distributed variables, the sample size is represented by
The unit root test serves the purpose of assessing the stationarity of a time series. When dealing with an autoregressive model, this test becomes particularly relevant. To examine time series data for the presence of a unit root, analysts commonly employ the Phillips-Perron (PP) test or the Augmented Dickey–Fuller (ADF) test. It is essential for all time series data to exhibit stationarity, devoid of any unit root, before conducting any form of analysis. In the ADF test, lagged difference terms of the dependent variable are included on the rightside of the regression equation, allowing for the incorporation of higher-order correlations. The ADF test relies on specific criteria to assess stationarity.
Where
To understand the association between two variables conduct a correlation analysis. This analysis additionally reveals how the variables interact and illustrates instances where the stock’s robustness is apparent between explanatory and response variables.
Apply GC tests to determine if there is a causal relationship between the returns of these markets. This can help understand the direction of influence between the markets. The research adopts the GC test methodology to explore the potential predictive capacity of one stock exchange’s indices for another market. Employing GC within the framework of a Vector Autoregression (VAR) analysis, it evaluates the magnitude and direction of the connections between various stock market indices. GC tests rely heavily on the correct choice of lag duration for variables. Use the lag length selection method of VAR to locate it. Hannan–Quin (HQ) information criterion, Log Likelihood, AIC, Schwarz Information Criterion and Final Prediction Error are just a few of the measures that can be used to regulate the best lag time. All of the metrics are lag-length-minimizing functions except for the likelihood ratio. Minimal individual criterion function, representing the best candidate for lag length selection. Each possible combination provides an identical equation for checking causality, and this is how the GC test is implemented.
Here, when there is non-stationarity in time series,
The JC test is a statistical method employed to assess the existence of cointegration among multiple time series. Within this study, the JC test serves as the analytical tool to investigate whether a persistent relationship exists among the stock market indices of Japan, India, and the USA. The JC test facilitates the estimation of cointegrating vectors, which symbolize the linear combinations of stationary variables. Multiple cointegrating relationships can be derived through the application of the JC test.
To evaluate the long-term association between the NASDAQ, SENSEX, and NIKKEI stock market indices, the Maximum Likelihood method is employed. The Maximum Likelihood (ML) method is utilized to determine the presence of a consistent, enduring link among the NIKKEI, SENSEX, and NASDAQ Composite stock market indices, all of which share the same integration order. The Johansen test comprises two fundamental assessments: the Trace and the Maximum Eigenvalue.
In Eqs (6) and (7), the symbols
The index-specific descriptive statistics
The linear interdependencies in various time series can be captured with the help of the VARapproach, It is advisable to solely employ an unconstrained VAR model to assess the short-term association among stock market indexes. The technique is commonly utilized to assess the forceful influence of stochastic disorders on a set of variables and to forecast interdependent time series data systems. In VAR, every variable is defined by its historical data, incorporating not only its own past observations but also those of all variables within the system.
The VAR mathematical representation can be written as,
Where,
Normality test
Table 3 presents descriptive statistics and the outcomes of normality tests conducted on three distinct stock market indices: NIKKEI, SENSEX, and NASDAQ. The key focus here is on the normality assessment, determined through the Jarque-Bera test, which is a statistical measure based on skewness and kurtosis. The
Unit root test
Table 4 presents the outcomes of ADF and PP unit root tests for three distinct stock markets. In the ADF test section, “At Level” signifies the test statistic when applied to the original data, while “At 1st order difference” represents the statistic for the first-order differenced data. The “Result” column indicates the stationarity status, with “I (1)” denoting that the data is integrated of order 1, implying it requires a single differencing to become stationary. The results consistently show very low
The unit root test
The unit root test
*Infer that the data is free from the unit root so, at a 5% level the null hypothesis is rejected.
Table 5 displays correlation coefficients between three major stock market indices. Each index exhibits a perfect positive correlation with itself, as indicated by a correlation coefficient of 1.0000. NIKKEI and SENSEX correlateat 0.9289, while NIKKEI and NASDAQ exhibit a correlation of 0.9196. SENSEX and NASDAQ show an even higher correlation of 0.9736. These values near 1 signify that when one of these indices experiences an increase, the others tend to follow, when one decreases, the others typically decline as well. This table suggests a strong positive relationship among these stock market indices, implying that their movements tend to be synchronized.
The correlation matrix between the NIKKEI, SENSEX, and NASDAQ
The correlation matrix between the NIKKEI, SENSEX, and NASDAQ
Table 6 provides the results of a GC Test with two different lag values, 1 and 6, to assess the causal relationship between two variables. GC is a statistical test that helps determine whether one time series can predict another. Each row in the table presents various statistics associated with the GC test. The lag column indicates the lag order used in the GC test. There are two different lag values: 1 and 6. Log L represents the logarithm of the likelihood value. The table contains values for Log L associated with each lag. The LR (Likelihood Ratio) column likely shows the likelihood ratio statistic, which is used in the GC test to compare models with and without the lagged variable. In this study, the LR statistic is computed for each lag. The FPE (Final Prediction Error) value is another statistic used in GC tests for fit goodness. AIC (Akaike Information Criterion) is a measure used for model selection. Lower AIC values indicate a better model fit. The SC (Schwarz Criterion) is another model selection criterion. Like AIC, lower SC values suggest a better model fit. The HQ (Hannan-Quinn Criterion) is also a model selection criterion, and lower HQ values indicate a better model fit. Particularly, some values in the table are marked with asterisks (*), suggesting statistical significance. In the first row (lag 1), the LR, FPE, AIC, and SC values are marked with asterisks, indicating their statistical significance. In the second row (lag 6), only the Log L and LR values bear asterisks, suggesting statistical significance at a certain level. The significance level is typically denoted by the number of asterisks, with more asterisks representing higher significance. The specific level of significance indicated by the asterisks is crucial for a conclusive interpretation of the causal relationship between the variables at different lag values. The lower values of the AIC, SC, and HQ criteria suggest better model fits, which can be important for model selection in the analysis.
Lag order selection – VAR framework
Lag order selection – VAR framework
*Number of lags to select.
Table 7 presents the results of GC tests aimed at determining the causal relationships between three stock markets. Granger causality tests assess whether one-time series can predict changes in another. In this analysis, the null hypothesis (Ho) for each test is that one variable does not Granger Cause the other. The results expose that there is no substantial GC connection between NIKKEI and either NASDAQ or SENSEX. Similarly, there is no significant causal relationship between SENSEX and NASDAQ, as the null hypothesis is also accepted in this instance. However, the analysis shows a significant exception, NASDAQ does GC SENSEX, as the null hypothesis is not accepted due to a low
Granger causality test
Johansen cointegration test
*At a 0.05 level, the null hypothesis is rejected; **p-Values, Mackinnon, Haug and Michelis.
Table 8 displays the findings from the JC Test, a statistical method widely employed in econometrics to assess the existence of a long-term connection, or cointegration, within a collection of time series variables. Within the Hypothesized column, various hypotheses regarding the number of cointegration vectors are introduced, spanning from “None,” signifying the absence of cointegration, to “At most 2,” indicating the presence of at most two cointegration vectors. The Eigen Value column exhibits the eigenvalues associated with each of these hypotheses.
The table also includes the Trace Statistics and cv (critical values) columns, which contain the test statistics and critical values for the Trace test. Additionally, there’s a section denoted as Critical Value (0.05), which furnishes the cv at a 5% significance level. The Prob.** column delivers the corresponding
Vector autoregression model (VAR)
Table 9 represents the results of a VAR model, a statistical technique used to analyze and forecast the relationships between multiple time series variables. In this VAR model, three variables are considered: NIKKEI, SENSEX, and NASDAQ, each with a lag of 1 time period. The table presents key information for each variable’s relationship with its lagged value. The Coefficient column displays the estimated impact of each variable on itself one period ago, while the Std. error column gives us an idea of the precision of these estimates. The
Vector autoregression (VAR) estimates
Vector autoregression (VAR) estimates
Exchange rate fluctuations between currencies can significantly impact the relationships between stock markets. Investors often consider exchange rate movements when making decisions about international investments and portfolio diversification. For instance, a strengthening or weakening of one currency relative to another can influence the attractiveness of investing in stocks denominated in that currency. Fluctuations in exchange rates introduce additional variability into the data used to analyze stock market interdependence. Changes in exchange rates can affect the relative prices of securities traded in different markets, potentially altering the observed correlations and cointegration patterns between stock markets. Market volumes, representing the total number of shares traded within a given period, serve as a crucial indicator of market activity and investor participation. Higher trading volumes typically indicate increased liquidity and active investor interest in the market. Changes in trading volumes can provide valuable perceptions into shifts in market sentiment and underlying market dynamics. By incorporating market volume data into the analysis, the research can better assess the degree of investor participation and liquidity in the markets under study, thereby enhancing the comprehensiveness and robustness of the study’s findings. Changes in macroeconomic conditions, such as fluctuations in GDP growth rates, inflation levels, and unemployment rates, can significantly influence investor sentiment and market dynamics. During periods of economic expansion, rising consumer confidence and corporate profitability often lead to bullish stock markets. Conversely, during economic contractions or recessions, declining economic indicators may cause investors to adopt a more risk-averse stance, resulting in bearish market conditions. This entails incorporating key macroeconomic indicators, such as GDP growth rates, inflation levels, and unemployment rates, into the analysis. By examining how changes in economic conditions affect stock market behavior and correlations across different markets, the research can offer valuable insights into the underlying mechanisms driving stock market interdependence. Additionally, identifying the impact of economic cycles on market relationships can inform investment strategies and risk management practices in diverse economic environments.
Conclusion
This research contributes to the understanding of the stock markets in Japan, India, and the USA. It highlights their interdependence and cointegration, emphasizing the need for a global perspective when analysing and managing financial assets. The resultshold significant relevance for investors and financial analysts navigating a world that is progressively more interconnected and interdependent. Based on the JB test results, the NIKKEI index is not normally distributed, while the SENSEX and NASDAQ indices are considered normally distributed. Both the ADF and PP assessments indicate that the NIKKEI, SENSEX, and NASDAQ datasets exhibit non-stationary behavior at the initial level but attain stationarity upon applying the first differencing. This information is essential in time series analysis, as stationary data is often a requirement for many statistical modelling techniques. Stock market indices have strong positive correlations with each other. A correlation coefficient of 1 specifies a positive correlation, and values close to 1 suggest a strong positive relationship, which means that when one index goes up, the others tend to go up as well, and when one goes down, the others tend to go down. According to the results of GC tests, it has been determined that a prominent GC relationship exists between NASDAQ and SENSEX(Ho is not accepted), while no significant GC relationship has been identified among the other pairs of variables (Ho is accepted for all other tests). This suggests that NASDAQ may have predictive power for SENSEX, but NIKKEI and SENSEX do not have significant predictive power for each other, and the same is true for NIKKEI and NASDAQ, as well as SENSEX and NASDAQ. The