
Abstract
BACKGROUND:
Diabetes is a chronic disease that can lead to a variety of complications and even cause death. The signal characteristics of the photoplethysmography signals (PPG) and electrocardiogram signals (ECG) can reflect the autonomic and vascular aspects of the effects of diabetes on the body.
OBJECTIVE:
Based on the complex mechanism of interaction between PPG and ECG, a set of ensemble empirical mode decomposition-independent component analysis (EEMD-ICA) fusion multi-scale percussion entropy index (MSPEI) method was proposed to analyze cardiovascular function in diabetic patients.
METHODS:
Firstly, the original signal was decomposed into multiple Intrinsic Mode Function (IMFs) by ensemble empirical mode decomposition EEMD, principal components of IMF were extracted by independent component analysis (ICA), then the extracted principal components were reconstructed to eliminate the complex high and low frequency noise of physiological signals. In addition, the MSPEI was calculated for the ECG R-R interval and PPG amplitude sequence.(RRI and Amp) The results showed that, compared with EEMD method, the SNR of EEMD-ICA method increases from 2.1551 to 11.3642, and the root mean square error (RMSE) decreases from 0.0556 to 0.0067. This algorithm can improve the performance of denoising and retain more feature information. The large and small scale entropy of MSPEI (RRI,Amp) was significantly different between healthy and diabetic patients (
RESULTS:
Compared with arteriosclerosis index (AI) and multi-scale cross-approximate entropy (MCAE): MSPEISS (RRI,Amp) indicated that diabetes can affect the activity of human autonomic nervous system, while MSPEILS (RRI,Amp) indicated that diabetes can cause or worsen arteriosclerosis.
CONCLUSION:
Multi-scale Percussion Entropy algorithm has more advantages in analyzing the influence of diabetes on human cardiovascular and autonomic nervous function.
Keywords
Introduction
Diabetes is a chronic disease. according to statistics, by 2021, approximately 537 million adults (20–79 years) are living with diabetes. It is estimated that the number will grow to 783.2 million in 2045 [1]. It may lead to the occurrence of various complications and even death. One of the main causes of death from diabetes is cardiovascular disease caused by hyperglycemia and related neurological dysfunction of fat and protein metabolism [2]. Traditional diabetes testing uses invasive methods to collect blood samples until people realize that diabetes has occurred, often with complications that lead to irreversible results. Therefore, the method of signal analysis is adopted to study the in-fluence of diabetes on human body through physiological signals, which can prevent the occurrence of complications in the early stage of diabetes.
Photoplethysmography signals (PPG) and electrocardiogram signals (ECG), as dynamic nonlinear signals containing a lot of physiological and pathological information, have been applied in the field of diabetes research [3]. The signal of ECG reflects a series of pressure changes that occur over a single heartbeat cycle [4]. Researchers have used its HRV heart rate variability to examine how diabetes affects the autonomic nervous function [5]. Stein et al. compared the HRV of the ECG signal between diabetic patients and healthy people and found that a decline in HRV is a marker of impaired autonomous neural activity [6]. Rathod et al. detected the stimulated HRV signal in upright and resting diabetic subjects and healthy subjects by using regression tree model, and found that HRV may be a better choice for detecting autonomic dysfunction in type II diabetes [7]. Swapna et al. obtained the HRV signal from the ECG and diagnosed diabetes through the high-order spectrum of the HRV [8]. Since the RR interval of the ECG signal must be used to compute the HRV features of heart rate variability, the method is more difficult. Therefore, Pachori et al. proposed a new method to decompose the RR interval signal using empirical modal decomposition (EMD) and extracted five features from the decom-posed IMF to distinguish between normal and diabetic individuals. The results revealed that the extracted features were statistically different between the normal and diabetic categories [9]. Diabetes causes increased resistance to blood flow, increased stress on blood vessel walls, and microvascular disorders [10]. The changes of arterial wall stiffness and blood viscosity directly affect the waveform of PPG, so the degree of arterial stiffness related to diabetes can be evaluated through the human pulse signal containing a large amount of pathological information [11]. Wei et al. proposed a multiscale cross-approximation entropy method based on human finger photoplethysmography waves that can be used to assess the degree of atherosclerosis in young people, middle-aged and elderly healthy individuals, and middle-aged and elderly diabetic patients [12]. Claudia et al. collected the pulse signals of 477 T2DM patients over the course of an average follow-up of 6.2 years. They found that the carotid-femoral pulse wave velocity (cf-PWV) was a reliable predictor of the development of peripheral neuropathy in the future and that patients with diabetic peripheral neuropathy had higher rates of aortic sclerosis [13]. The above method confirms that physiological signals can be used to analyze the effects of diabetes on autonomic nervous function and arteriosclerosis degree, but single PPG and ECG signals are susceptible to the influence of heart location, body fat, and the position of measuring electrodes [14]. Therefore, the relationship between the two physiological signal characteristics on a time scale can be used to analyze the cardiovascular function of diabetic patients. In order to avoid high and low frequency noise generated by mechanical and external environment during the acquisition of physiological signals, which causes inaccurate feature extraction, it is especially necessary to denoise the ECG and PPG signals first.
Therefore, the MSPEI based on EEMD-ICA is proposed in this paper to analyze the relationship between PPG and ECG, and to study the complex relationship between the pathological mechanism of diabetes and human signals. To pre-process the original signal and attenuate the impact of noise on inaccurate feature extraction, the algorithm uses EEMD-ICA. Next the amplitude sequence from the foot point to the peak point of the PPG signal during the synchronization period and the time interval sequence between two adjacent R waves of the ECG signal RRI are extracted, the two feature sequences of Amp and RRI are divided into 12 scales in time to calculate the multi-scale percussion entropy. Finally, the MSPEI were compared with the AI and MCAE, Interaction effects between physiologically synchronized time sequence and diabetes from multiple time sequence.
Materials and methods
Ensemble empirical mode decomposition-independent component analysis (EEMD-ICA)
The problem of modal confusion that occurs in empirical modal decomposition can be resolved by Ensemble Empirical Modal Decomposition [15]. In this paper, independent component analysis (ICA), is introduced in this study as a solution to this problem. The algorithm creates the multi-channel input of ICA from the EEMD-deconstructed IMF with the noisy signal along with the original signal, and accomplishes the effect of separating the noisy signal from the denoised signal after the operation. The flowchart for the denoising algorithm using the EEMD and ICA algorithms is illustrated in Fig. 1.
Flowchart of denoising algorithm.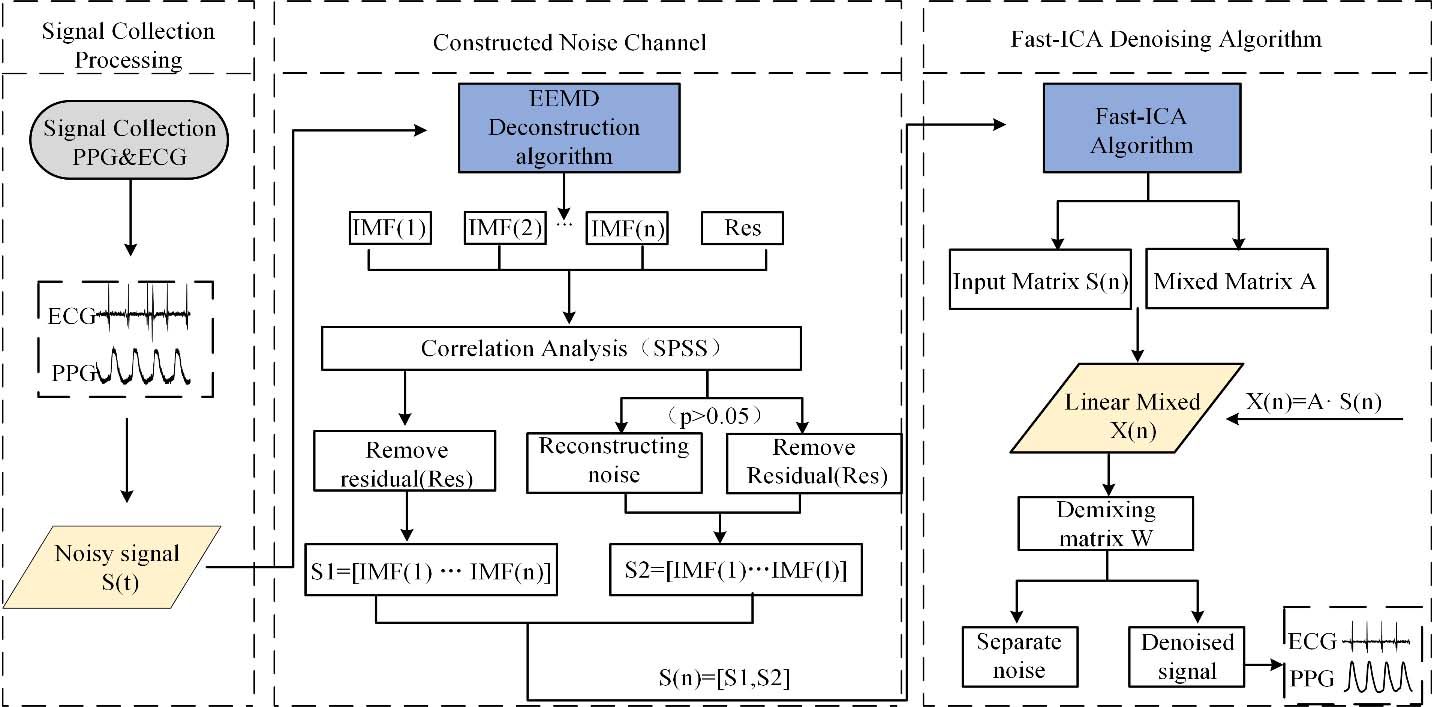
The noise removal process as follows:
Firstly, the original ECG and PPG signal
The noise level of each IMF component is estimated using Pearson correlation analysis to find the correlation between the original signal and the IMF component decomposed using EEMD, the correlation coefficient P value also determines the noise level of each IMF component; The virtual noise channel S2 is created by extracting the IMF component of the noise (
Linear mixed matrix:
Unmixed matrix:
Denoised signal
In this paper, a virtual noise channel was constructed by EEMD decomposition, and the original signal was reconstructed by extracting the principal components of each IMF component through ICA. This method eliminates the effect of noise on feature extraction while effectively preserving the original signal features.
The algorithmic flow of MSPEI is shown in Fig. 2.
Multi-scale percussion entropy calculation process.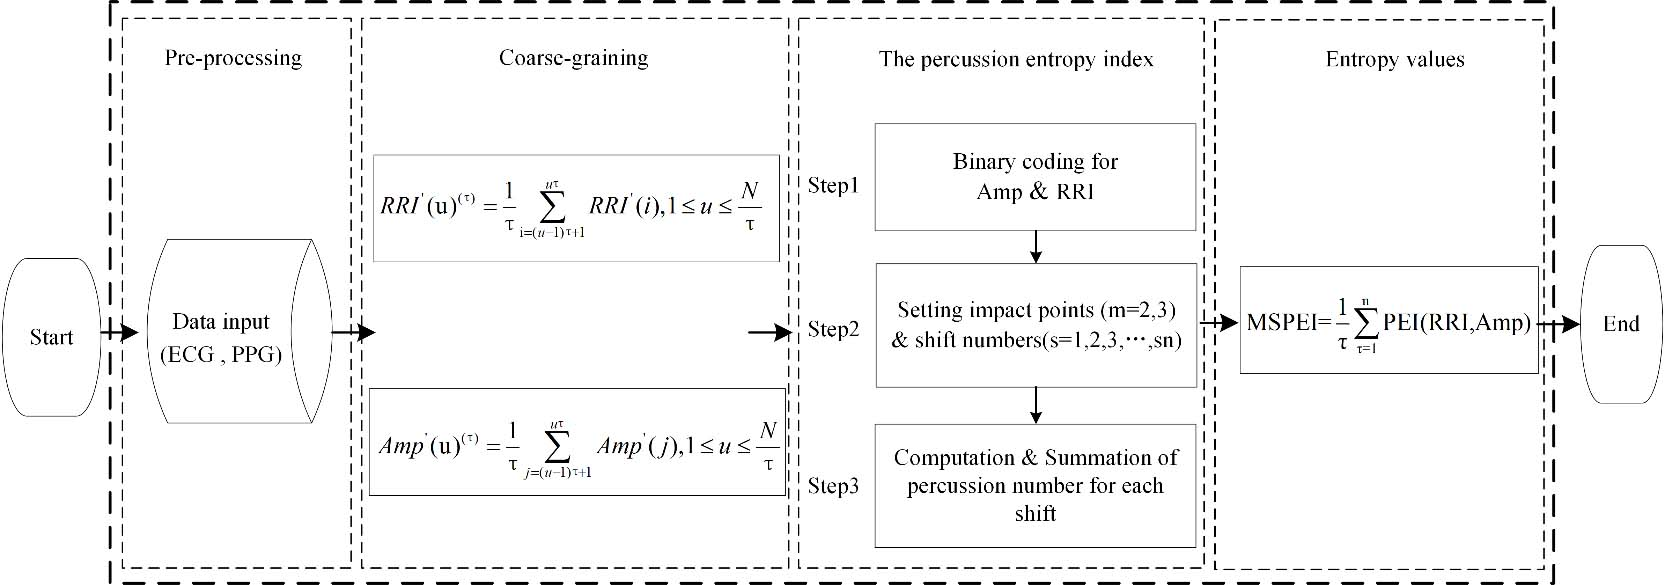
The multi-scale percussion entropy was calculated as follows:
Multiscale values were calculated for RRI and Amp [16]:
RRI is the time interval between adjacent The RRI and Amp sequences were subjected to the multiscale percussion entropy calculation as described above [17]. Where MSPEISS is scales 1–6 for the small-scale entropy values as in Eq. (8), and MSPEILS is scale 7–12 for large scale entropy values as in Eq. (9):
Based on the above theory, the Amp and RRI sequences of PPG and ECG signals were subjected to multiscale percussion entropy calculation, and the
Characteristic diagram of ECG and PPG.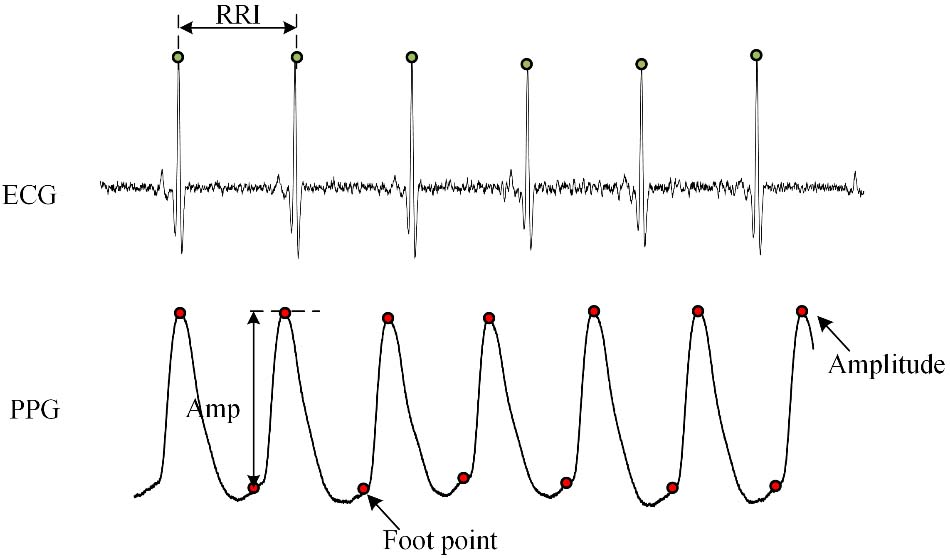
Data collection for this experiment was performed on 74 upper middle-aged and elderly subjects from the outpatient clinic of the hospital endocrinology department [18], all of whom were required to rest for at least five minutes in a room with constant temperature and quiet room, and who had not consumed irritating beverages or medicines within 8 h before data collection. Subjects all signed written informed consent Statement. An ana-log-to-digital converter (USB-6009DAQ) with a sampling frequency of 500 Hz was used to collect the pulse wave signal from the fingertip of the left index finger and the ECG graph signal simultaneously for 30 minutes. After that, the signals were digitally stored in a computer.
Statistical analysis of basic physiological data of all subjects (
74)
Statistical analysis of basic physiological data of all subjects (
Values are expressed as mean
All subjects were divided into two groups, including healthy middle-aged and elderly subjects (group 1, 16 males and 19 females, aged 50–70 years,
Through the above method, a total of 74 subjects’ synchronous PPG signals and ECG signals were collected for 30 minutes. Firstly, the signals were preprocessed by the EEMD-ICA method to remove the effects caused by noise on feature extraction. Secondly, the processed synchronized signals were subjected to feature extraction, and the RRI sequences of ECG signals and Amp sequences of PPG signals were extracted and divided into 12 scales for entropy calculation. The average of 1–6 scale entropy is defined as small-scale entropy value, and the average of 7–12 scale entropy is recorded as large-scale entropy value. Finally, the MSPEISS and cross approximate entropy at small scale MCAESS, and the MSPEILS and cross approximate entropy at large scale MCAELS are calculated respectively. Through the comparative analysis of parameters, it is able to explain the differences between healthy upper middle-aged people and upper middle-aged people with type 2 diabetes from two different perspectives of vascular elasticity and neurological function. To verify the reliability of the data results, independent sample t-test and Pearson correlation analysis were performed on the data using the Statistical Package for Social Sciences (SPSS, Windows version 14.0). Where the significance (i.e., p-value) between each parameter indicator was less than 0.05 was considered to be statistically significant
Analysis of signal pre-processing results
As shown in Fig. 4(a), in order to extract the RRI sequence from the ECG signal’s cycles, one must first identify the R wave in each cycle, locate the PPG cycle that is synchronized with it through the R wave position, identify the peak point and foot point in the PPG cycle, and then calculate the Amp sequence. The peak point or foot point of the PPG signal corresponding to the synchronization will be missed if the original ECG signal is disrupted by noise and the identification of the R wave is incorrectly identified during the ECG cycle. As a result, the feature sequence extraction of the two physiological signals will be erroneous. Therefore, it is necessary to filter out the interference noise and accurately locate the R wave position to improve the accuracy of feature extraction.
Comparison of denoising effects of EEMD-ICA and EEMD
Comparison of denoising effects of EEMD-ICA and EEMD
Comparison of feature detection before and after noise removal.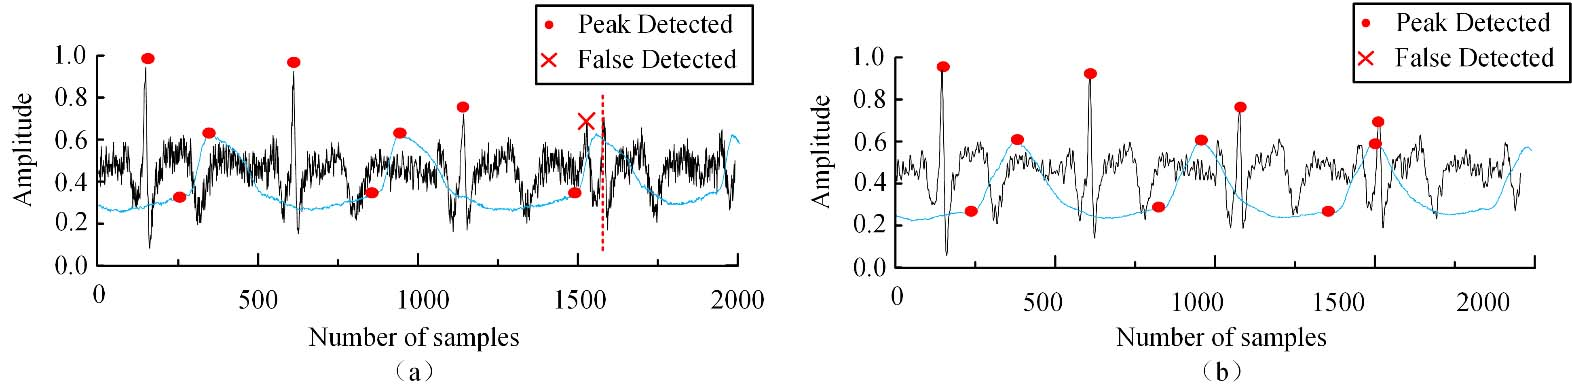
The feature recognition of the ECG signal following EEMD-ICA processing is depicted in Fig. 4(b). As can be seen, after preprocessing, the signal’s high frequency noise and clutter are filtered out, which improves the accuracy of signal feature detection and ensures the accuracy of the subsequent entropy operation. These benefits include accurately locating the R-wave position, preventing the peak point and foot point of the PPG signal from being missed in the same cycle, and preventing the R-wave from overlapping with other waves.
To quantify the effect on signal preprocessing, the SNR and root mean square error RMSE of PPG and ECG signals of 10 subjects each selected from two groups of subjects were calculated for their signal-to-noise ratio after EEMD and EEMD-ICA treatment Among them, SNR refers to the ratio between the effective components and noise in the signal, and the quality of the denoised signal can be analyzed [19] RMSE is the square root of the mean squared error and reflects the degree of difference between the original and denoised signals [20]. SNR is given in Eq. (10):
MSE is shown in Eq. (11):
where the larger the SNR, the smaller the RMSE, indicating a superior performance of this denoising algorithm. It is known from Table 2 that the evaluation index of the EEMD-ICA denoising algorithm proposed in this paper is better than that of EEMD, so the signal can effectively remove noise from the signal after this preprocessing is more complete and retain the original signal contained feature information.
The multiscale percussion entropy was calculated for the preprocessed synchronized time series RRI and Amp, and the results are shown in Fig. 5. According to the figure, For both large and small scales, it can be demonstrated that the multiscale percussion entropy values of healthy people are higher than those of diabetes patients, and both show a declining tendency as the scale increases, indicating that it is possible that diabetes leads to a decrease in the complexity of physiological information in the human body, which is consistent with the pathological mechanism that disease leads to a decrease in entropy values as previously found by researchers [21].
Comparative analysis of different indexes between two groups of subjects
Data are expressed as mean
Multi-scale percussion entropy of two groups of subjects. Small Scale: Average of scale 1–6 entropy values; Large Scale: Average of scale 7–12 entro-py values;Group 1: upper Healthy middle-aged subjects; Group 2: upper middle-aged subjects with type 2 diabetes.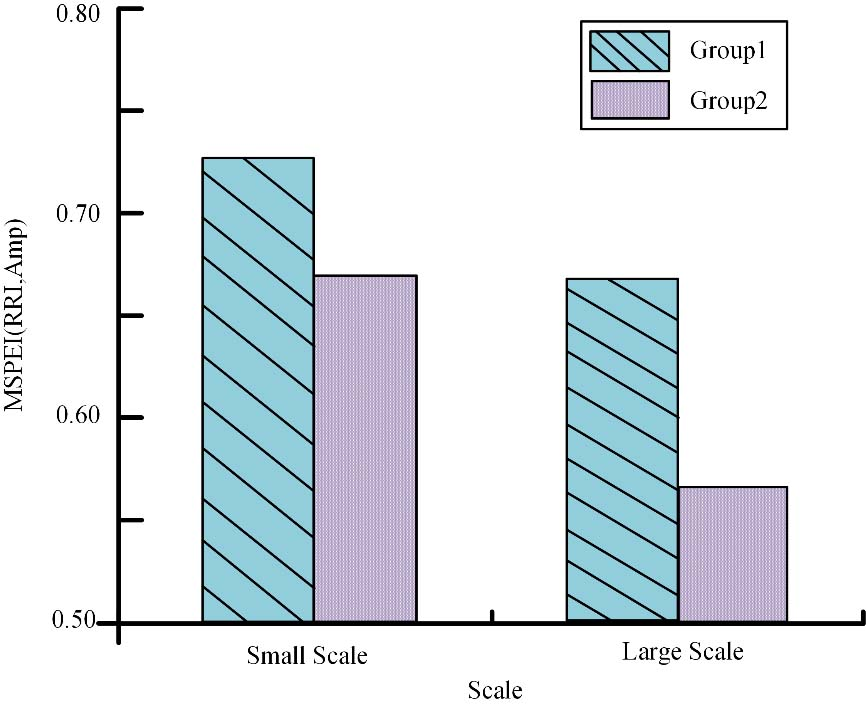
Research have shown that the complexity of physiological systems can be reflected in both large- and small-scale entropy values [22]. The complexity of autonomic nervous system signals can be reflected by small-scale entropy values, whereas the complexity of vascular system signals can be reflected by large-scale entropy values [23]. Table 3 displays the findings of comparing the AI with the small and large scale percussion entropy values and cross-approximation entropy values of RRI and Amp.
Correlation analysis between multi-scale entropy value and basic physiological parameters of all subjects (
Data are expressed as mean
The atherosclerosis index, which indicates the degree of atherosclerosis, was calculated by collecting serum total cholesterol and HDL from blood. AI indicators showed significant differences between healthy individuals and diabetic patients, indicating that diabetes is closely associated with the onset or worsening of atherosclerosis. From the analysis of the above table, the small-scale percussion entropy value MSPEISS in the two groups of people has a significant difference (
In contrast, the MCAE only showed a statistical difference (
To further investigate the relationship between different multiscale entropy values and diabetes, correlation analysis was performed between different multiscale entropy values and anthropometric, hemodynamic and serum biochemical parameters of all subjects as shown in Table 4. Among them, high-density lipoprotein cholesterol (HDL) showed positive correlation (
By analyzing the correlation between multi-scale entropy and anthropometry, hemodynamics and serum biochemical parameters, the significance of multi-scale percussion entropy parameters is further explained. In this study, the influence of age on cardiovascular health was excluded, and the subjects were all middle-aged and elderly people. Through the above parameter analysis, we found that the correlation between MCAELS and MSPEI and blood glucose parameters (FBS, HbA1c) (
Discussion
Diabetes is considered the epidemic disease of the 21st century, and several studies have found that neurological damage caused by microangiopathy induced by diabetes has a strong predictive value for cardiovascular morbidity and mortality risk [27]. Wei et al. proposed the concept of percussion entropy (PEI), which assesses a physiological system in terms of the degree of similarity of trends between two correlated time series [28]. This parameter only highlights its sensitivity in detecting diabetes-related auto-nomic dysfunction and fails to reflect the effect of diabetes on vascular function in terms of autonomic. Therefore, in this paper, we analyze the pathological significance of synchronized ECG and PPG signal in diabetic patients using EEMD-ICA fused MSPEI to represent the effects of diabetes on human cardiovascular and autonomic functions in the form of entropy values by comparing the trends of changes between the characteristic signals of the two synchronized physiological sequences in subjects.
However, because the human body is subject to a variety of internal and external conditions, some noise will be produced by physiological signals. The high-frequency noise close to the R wave will interfere with the extraction of the RRI features from ECG signals and will impact the location accuracy. Also, it will have an impact on the PPG signals’ synchronization period Amp calculation accuracy. Therefore, this study preprocesses the original signal using the EEMD-ICA denoising technique. In the course of the experiments, it was discovered that the EEMD, which processes the physiological signal, only uses empirical values to reconstruct the decomposed IMF, and that the effective features are lost in the discarded IMF components. Therefore, it was discovered that adding the ICA joint noise reduction can retain all of the features of the IMF components. The denoising assessment indexes show that the SNR of the signal-to-noise ratio is in-creased from 2.1551 to 11.3642 and the RMSE is decreased from 0.0556 to 0.0067 after EEMD-ICA compared with traditional EEMD, and the denoising efficacy has significantly improved.
In the present study the similarity of the two synchronous characteristics RRI and Amp after pretreatment was analyzed on multiple time scales for the trends of the two synchronous physiological signals. The negative correlation of MSPEILS with fasting glucose (
The complexity of physiological signals is measured in the process of dynamic changes of time series. It is easy to ignore some characteristic information contained in the original time series signals through entropy analysis of a single scale [32]. MSPEI not only overcomes the defect of single scale signal analysis, but also can study the impact of diabetes on human vascular function and autonomic nervous function through the nonlinear relationship between two different time series, which is more suitable for biological time series.
This study still has its limitations. First, since the acquisition process is affected by various environments and body movements such as breathing The process of effective data acquisition and signal processing and analysis takes a long time. Secondly, due to the limited sample size of this experiment, the correlation between the effect of some other factors including age, gender, pulse pressure with diabetes was not verified. However, this study used two synchronous physiological signals, which was more detailed than single signal analysis, and the signals were preprocessed and binarized before analysis to reduce the influence of noise as much as possible. Further analysis of the impact of multiple factors on diabetes combined with the study of multiple physiological signals can provide more effective information for future clinical application.
Conclusion
In this study, the EEMD-ICA fusion MSPEI (RRI,Amp) algorithm was proposed based on the characteristic parameters of ECG and pulse signals, and the EEMD-ICA denoising algorithm was used to eliminate the influence of noise on signal characteristics before feature extraction of the signal, which greatly preserved the characteristic trends contained in the original signal, and its MSPEI on both large and small scales The MSPEI showed significant differences (
Footnotes
Conflict of interest
The authors declare no conflict of interest.
Funding
This research was funded by the Graduate Student Innovation Project of North Minzu University (No.YCX22127), the Natural Science Foundation of Ningxia (2022AAC03244, 2022AAC03006), and the Leading Talent Project Plan of the State Ethnic Affairs Commission. Ningxia Technology Innovative Team of Advanced Intelligent Perception and Control, leading talents in scientific and technological innovation of Ningxia, National Natural Science Foundation of China (No. 61861001).