
Abstract
BACKGROUND:
Beamforming is vital for medical ultrasound imaging systems. The generalized sidelobe canceller (GSC) beamforming can improve the image quality of lateral resolution, but its performance improvement in contrast and robustness is limited.
OBJECTIVE:
This paper proposes an improved generalized sidelobe canceller algorithm based on multi-apodization with cross-correlation (MAXB-IGSC), which aims to improve the contrast and robustness of ultrasound imaging while maintaining the high image resolution and background speckle quality of GSC.
METHODS:
The proposed MAXB-IGSC uses multiple pairs of complementary received apodization functions to process the echo data individually to obtain multiple pairs of data sets. The average of their normalized cross-correlation coefficients is then calculated and utilized to determine the adaptive subarray length of the GSC covariance matrix and weights the output of the improved GSC.
RESULTS:
The MAXB-IGSC improves the contrast ratio (CR) by 171.18% in anechoic cyst simulation and by 91.23%/130.97%/171.76% in geabr_0 (a dataset from the University of Michigan) experiment compared with GSC, respectively. Furthermore, MAXB-IGSC exhibits significant noise immunity, which greatly improves the robustness of the imaging. The technology also maintains the brightness and uniformity of the background speckle.
CONCLUSION:
The proposed MAXB-IGSC has potential for obtaining high-quality ultrasound images in clinical applications.
Introduction
Because of its advantages in terms of safety, real-time and low cost, ultrasound imaging is widely used in medical clinical diagnosis [1, 2]. Beamforming is the core of the entire ultrasound imaging system. The traditional delay and sum (DAS) beamforming method, which is commonly utilized in existing ultrasound imaging systems, is computationally basic and straightforward to implement [3]. The traditional DAS often uses fixed weights for amplitude apodization, which reduces the side lobe level while increasing the width of the main lobe, which leads to relatively poor image quality [4]. To further improve the image quality, adaptive beamforming methods were introduced to ultrasound imaging. Such methods can dynamically calculate the weighting vectors while fully using the echo data, which can lead to better imaging performance because they take into consideration the real-time characteristics of the echo signal [5, 6].
The coherence factor (CF) is a type of adaptive beamforming methods in ultrasound imaging. Weighting the beamformed signal by the coherence factor can effectively suppress the off-axis incoherent signals such as clutter and noise, thus improving resolution and contrast [7]. However, CF tends to over-suppress the incoherent signals, thus introducing black-spot artifacts in the background speckle as well as dark-area artifacts on both sides of strong echo point targets [8]. The generalized coherence factor (GCF) uses the low-frequency part of the spectrum as coherent energy for imaging, which is closer to the actual target and thus reduces focusing errors [9]. The phase coherence factor (PCF), whose main research direction is the phase change, and the sign coherence factor (SCF) developed on the basis of PCF has also been proposed successively [10, 11, 12]. Dual apodization with cross-correlation (DAX) is a relatively new method to suppress side lobe and clutter, which can improve the contrast of ultrasound imaging without affecting the lateral resolution [13]. The dynamic DAX algorithm was proposed to reduce the artificial black spots caused by the randomness of speckles in the image [14]. Based on previous works, a multi-apodization with cross-correlation (MAX) algorithm with stronger robustness was proposed [15]. Robustness refers to the ability of the algorithm to maintain its performance and accuracy in the presence of various types of tissue and imaging conditions, ensuring stable and reliable imaging results.
The minimum variance (MV) beamforming method, first proposed by Capon [16], is a kind of adaptive beamforming methods in ultrasound imaging. Previous studies have shown that MV has higher lateral resolution than DAS, but the performance improvement in contrast is not satisfactory [17, 18, 19]. The generalized sidelobe canceller (GSC) algorithm is proposed based on the separability between the desired signal and the noise signal in the echo signal [20]. The literature related to GSC shows that GSC can greatly improve lateral resolution, but side lobe suppression remains weak, with almost no improvement in contrast [21, 22]. The adaptive beamformers such as MV and GSC are less robust due to the singularity problem when calculating the covariance matrix inversion [23]. To solve this problem, several approaches have been suggested, such as diagonal loading (DL) [24] and eigenspace methods [25]. Applying spatial smoothing methods to this class of adaptive beamformers can remove the correlation of the echo signal [26], while at the same time leading to a reduction in contrast. To improve the contrast of this class of adaptive beamformers, a series of algorithms combining coherence factor and minimum variance have been proposed [21, 27], but the problems of weakening background brightness and introducing artifacts caused by CF are difficult to solve.
This paper proposes a MAX-based improved generalized sidelobe canceller (MAXB-IGSC) algorithm. To improve the contrast of GSC and avoid the issues associated with CF-based weighting methods, such as reduced background speckle brightness and partial speckle pattern removal, we propose utilizing the average of normalized cross-correlation coefficients obtained from the MAX as a replacement for CF in weighting the output of the GSC, so as to improve the contrast while maintaining a uniform background speckle. The MAX method introduces only a small, if not negligible, additional computational complexity compared with the DAS algorithm. To further enhance the imaging contrast and robustness, the GSC is improved based on the characteristics of the average of cross-correlation coefficients. The coefficient can approximately distinguish the clutter from the desired signal, and using the coefficient to adaptively determine the subarray length of the GSC covariance matrix can balance the image resolution and robustness. By weighting the output of the improved GSC with this coefficient, the side lobe is suppressed, and the clutter is effectively removed, thus improving the contrast and robustness of the GSC while maintaining its resolution. Finally, the proposed MAXB-IGSC method was proven effective by simulations and experiments.
The following is a summary of the paper: Section 2 provides a brief overview of the related methods such as DAS, GSC, CF, and MAX. In Section 3, we analyze the basic principles and implementation of the proposed MAXB-IGSC method in detail. Section 4 refers to the simulation and experimental data used, as well as the metrics used to measure the image quality. In Section 5, we provide the experimental results based on simulated and actual echo data. Section 6 discusses the proposed method. Finally, the conclusion is drawn in Section 7.
Background
Array and signal model
Assuming an array with
As shown in Fig. 1, in the GSC structure, the delayed echo signal
Generalized sidelobe canceller.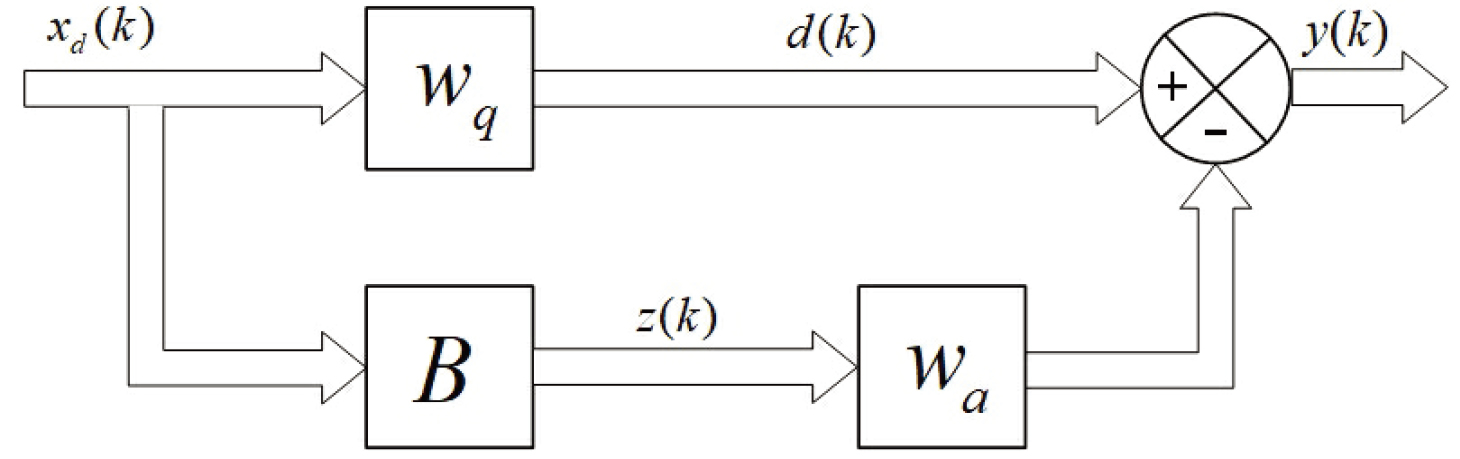
The minimum variance criterion is used to obtain the adaptive weighting vector
where
The final weighting vector of GSC is:
Then the output of GSC beamforming is as follows:
The coherence factor (CF) is defined as the ratio of the coherent energy to the incoherent energy in the array signal. This factor can be expressed as:
By utilizing coherence factors to weight the output of GSC beamforming, the CF
For an array with
(a) DAX (4-4) and (b) MAX (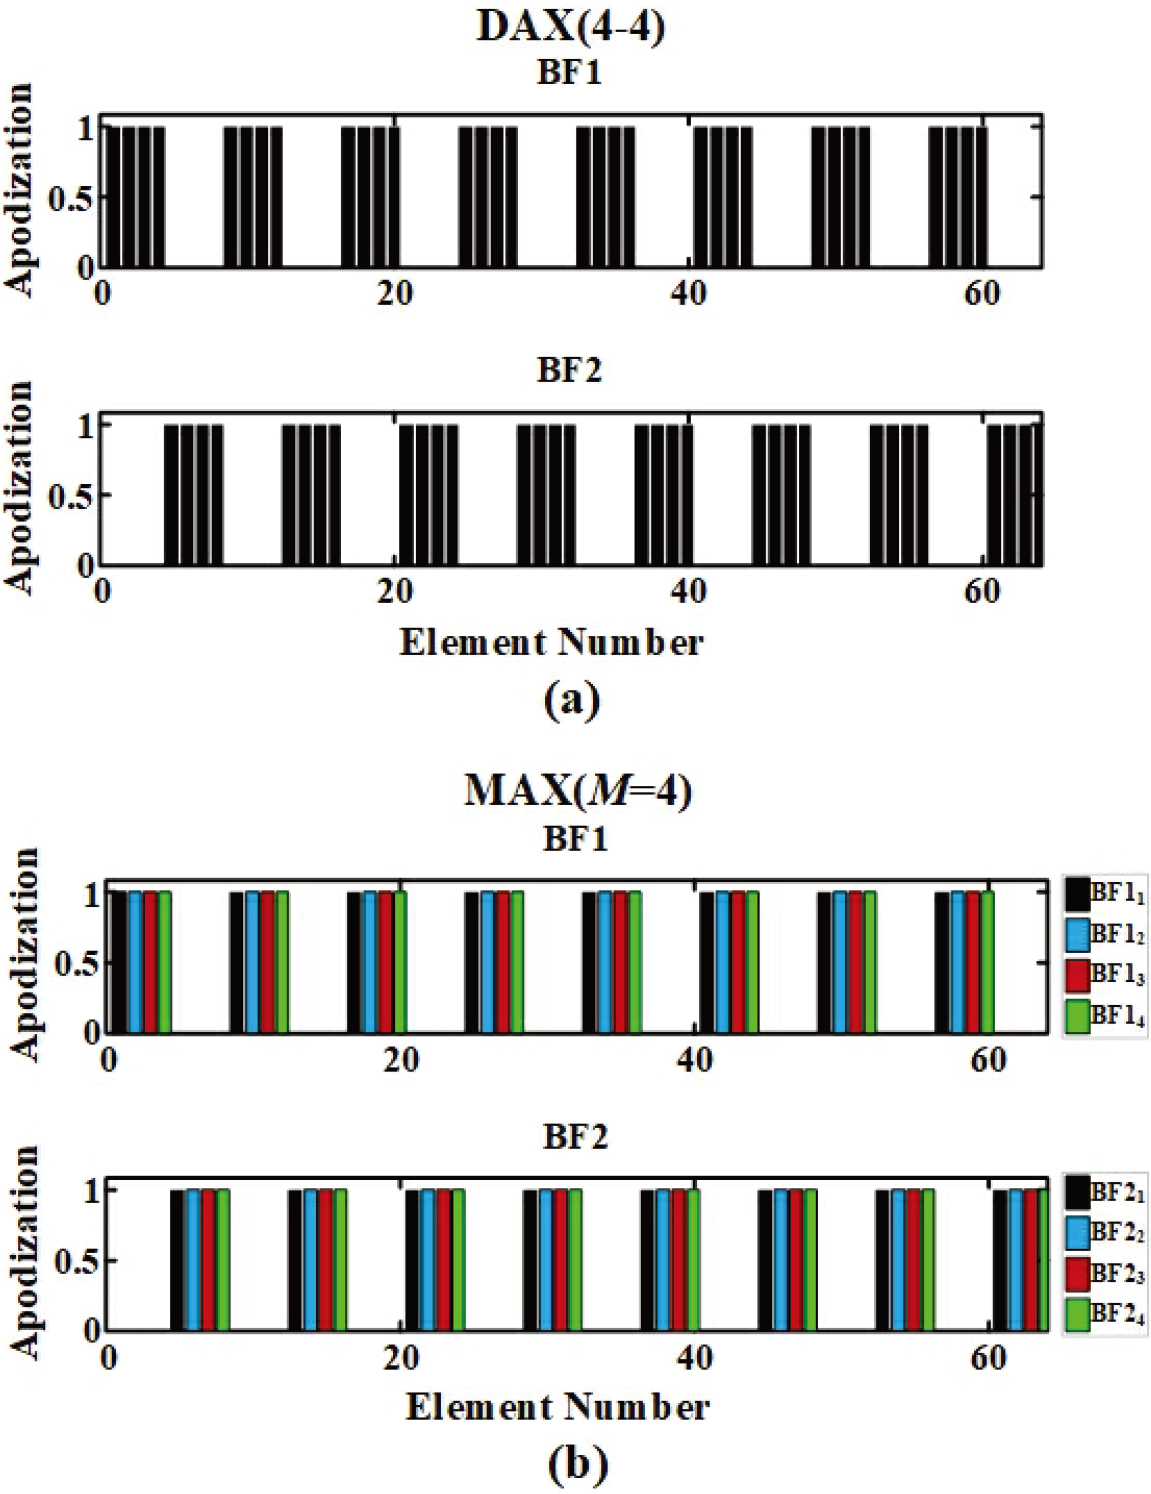
The delayed echo signal of each element is processed by using the sub-apodization functions to obtain
where
Due to 20
In this section, we propose a MAX-based improved generalized sidelobe canceller (MAXB-IGSC) algorithm. Figure 3 shows the flow chart of the proposed MAXB-IGSC.
Flowchart of MAXB-IGSC.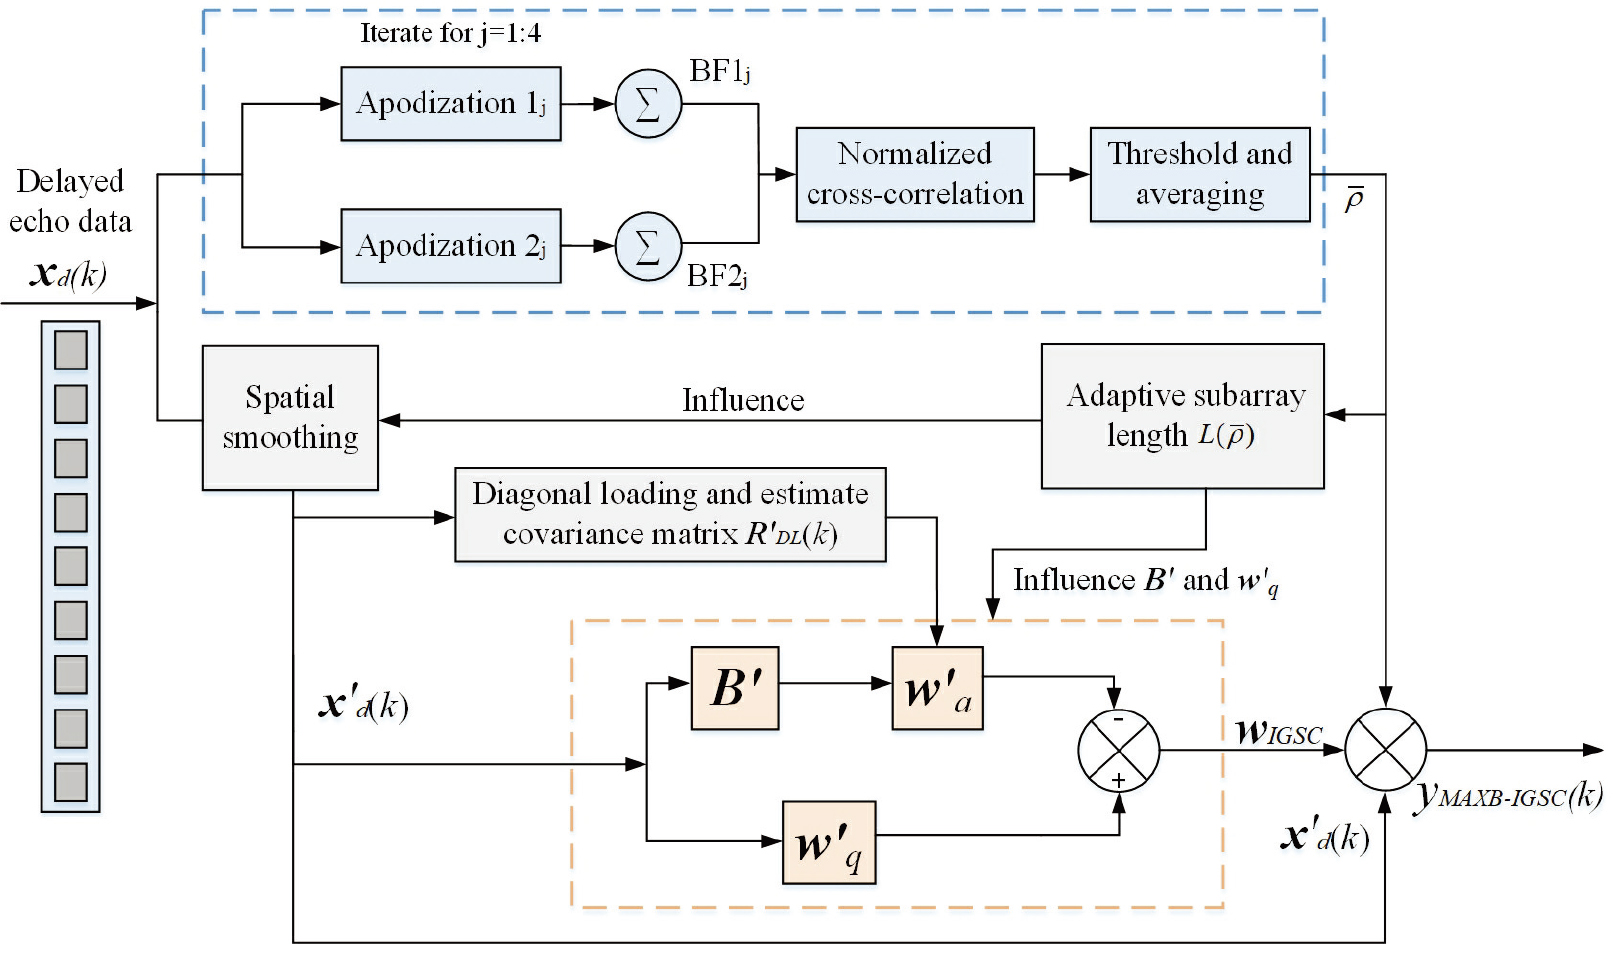
To decorrelate the echo signal and to obtain a better covariance matrix estimation, the spatial smoothing technique is usually used. The spatial smoothing method divides the
The average of the normalized cross-correlation coefficients
Firstly, to minimize possible black-spot artifacts in the image and maintain a homogeneous background speckle pattern, a median filter is applied to the weighting matrix consisting of the coefficient
Where
where
where
From Fig. 3, it can be seen that the non-adaptive weighting vector
The weighting vector of the new GSC system is as follows:
Then the output of the improved GSC beamforming is:
To further suppress the sidelobe and improve the contrast of the image, the coefficient
The beamforming signal at the corresponding pixel location in the imaging region weighted by this coefficient can effectively suppress the side lobe and clutter, and preserve the desired signal.
Simulation data sets
The echo simulation data obtained from Field II [29, 30] are utilized as raw data to inspect the imaging performance of the algorithm. In an anechoic cyst simulation, a circular anechoic cyst with a radius of 4 mm was set, located within the imaging range of detection depth of 30 mm
Field II simulation parameters
Field II simulation parameters
The tissue-mimicking phantom experiments were conducted by using two distinct datasets: geabr_0 data, obtained from the Biomedical Ultrasound Laboratory (BUL) at the University of Michigan [31], and ats_wire data, acquired from the wire region of an ATS Model 539 tissue-mimicking phantom. Furthermore, a mouse experiment was carried out by using the rat_tumor data, provided by the Bioacoustics Research Laboratory at the University of Illinois, Urbana-Champaign, Champaign, IL, USA [32]. The experiment is performed by the synthetic aperture technique for the transmission and reception of the ultrasound echo signals. The experimental parameters are summarized in Table 2.
Experimental parameters
Experimental parameters
In the field of ultrasound imaging, various parameters are used to evaluate image quality. When evaluating the lateral resolution for point targets, the full-width at half-maximum (FWHM,
where
It is well recognized that evaluations with generalized contrast-to-noise ratio (gCNR) are immune to dynamic range alterations and provide a metric of lesion detectability definition based on the separability of histograms of two regions. The gCNR is defined as follows:
where
In this section, simulations and experiments are conducted to evaluate the performance of the proposed MAXB-IGSC compared with DAS, GSC, CF, CF
Simulation of anechoic cyst
To more accurately evaluate the contrast and robustness of the proposed algorithm, a comparative evaluation for anechoic cyst imaging is performed by using various imaging methods, including MAXB-IGSC, DAS, GSC, CF, CF
Anechoic cyst simulation (a) DAS, (b) GSC (
Figure 4 shows that the traditional DAS is the worst, with extremely visible sidelobe artifacts inside the anechoic cyst. GSC also has a small number of artifacts, but there are some improvements compared with DAS. Moreover, the GSC background area is also significantly darker, which affects the contrast of the image. In Fig. 4c and d, the presence of noticeable graininess in the background speckle can be attributed to the influence of CF weighting. Furthermore, in Fig. 4c and d, there is a decrease in background brightness compared with Fig. 4a and b. The internal clutter and sidelobe of the anechoic cyst in Fig. 4c–h are effectively removed, and their edge contours are clearer. The observations from Fig. 4c–h reveal that MAX is capable of suppressing sidelobes and clutter while preserving the uniformity of the background speckle without diminishing its brightness. In comparison to CF, MAX is more suitable as a weighting coefficient for GSC.
CR, gCNR, and sSNR of different methods for anechoic cyst imaging
Lateral energy curves at 40 mm of Fig. 4.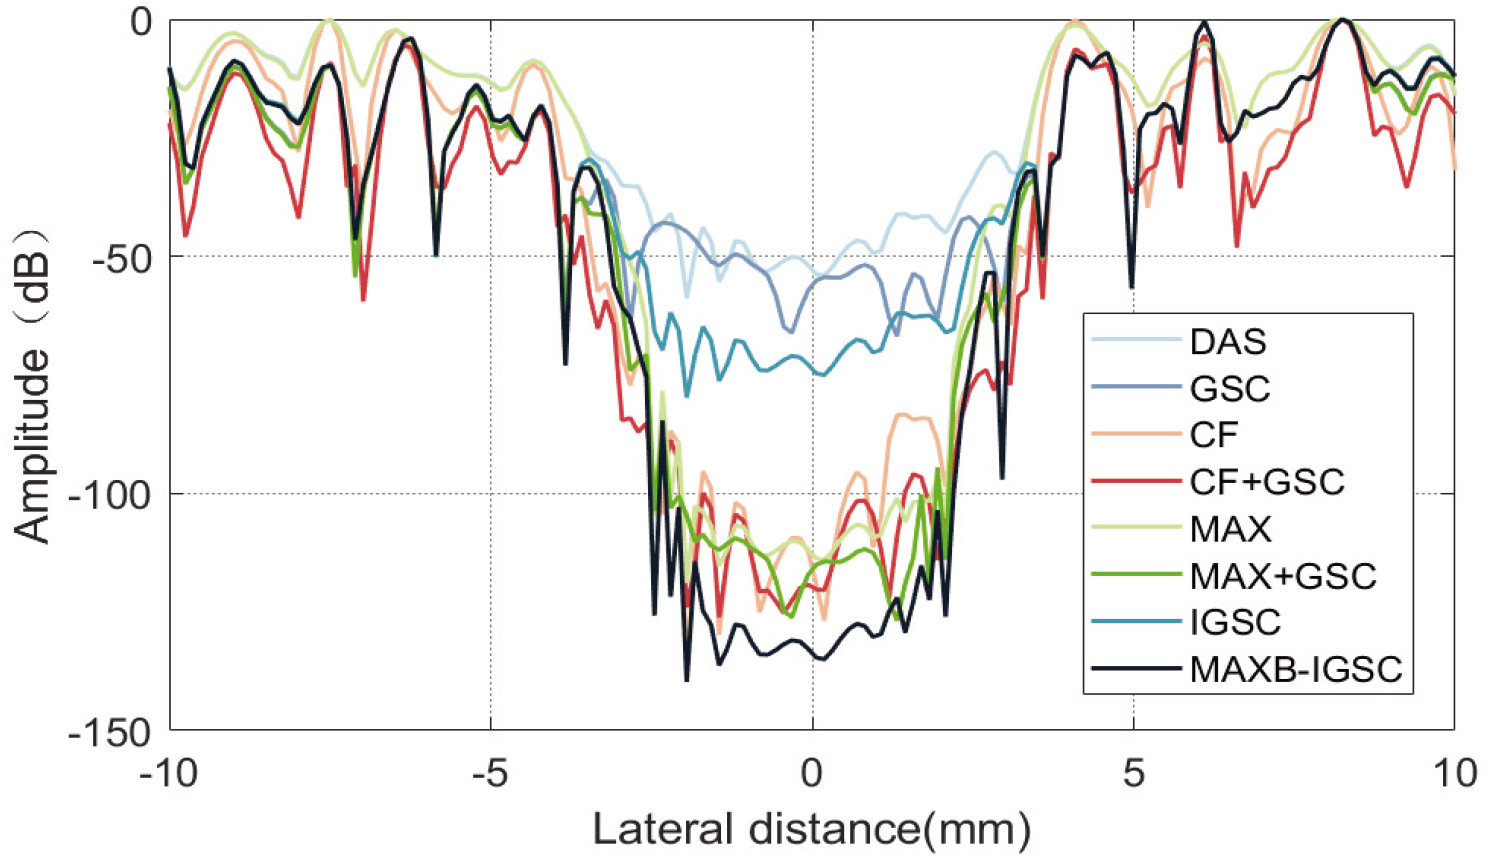
To assess the image quality with greater precision, Fig. 5 and Table 3 show the lateral energy curves at the depth of 40 mm obtained by using various imaging methods, along with the corresponding calculated quality metrics. The region of interest for calculating the metrics includes the cyst region and the background speckle region at the same depth, as indicated by the green circle and purple rectangle in Fig. 4, respectively.
As depicted in Fig. 5 and summarized in Table 3, the signal intensity in both the background and the anechoic cyst of CF
Gaussian white noise with a signal-to-noise ratio (SNR) of 10 dB/0 dB/
Simulated anechoic cyst images with (a) 10 dB, (b) 0 dB, and (c) 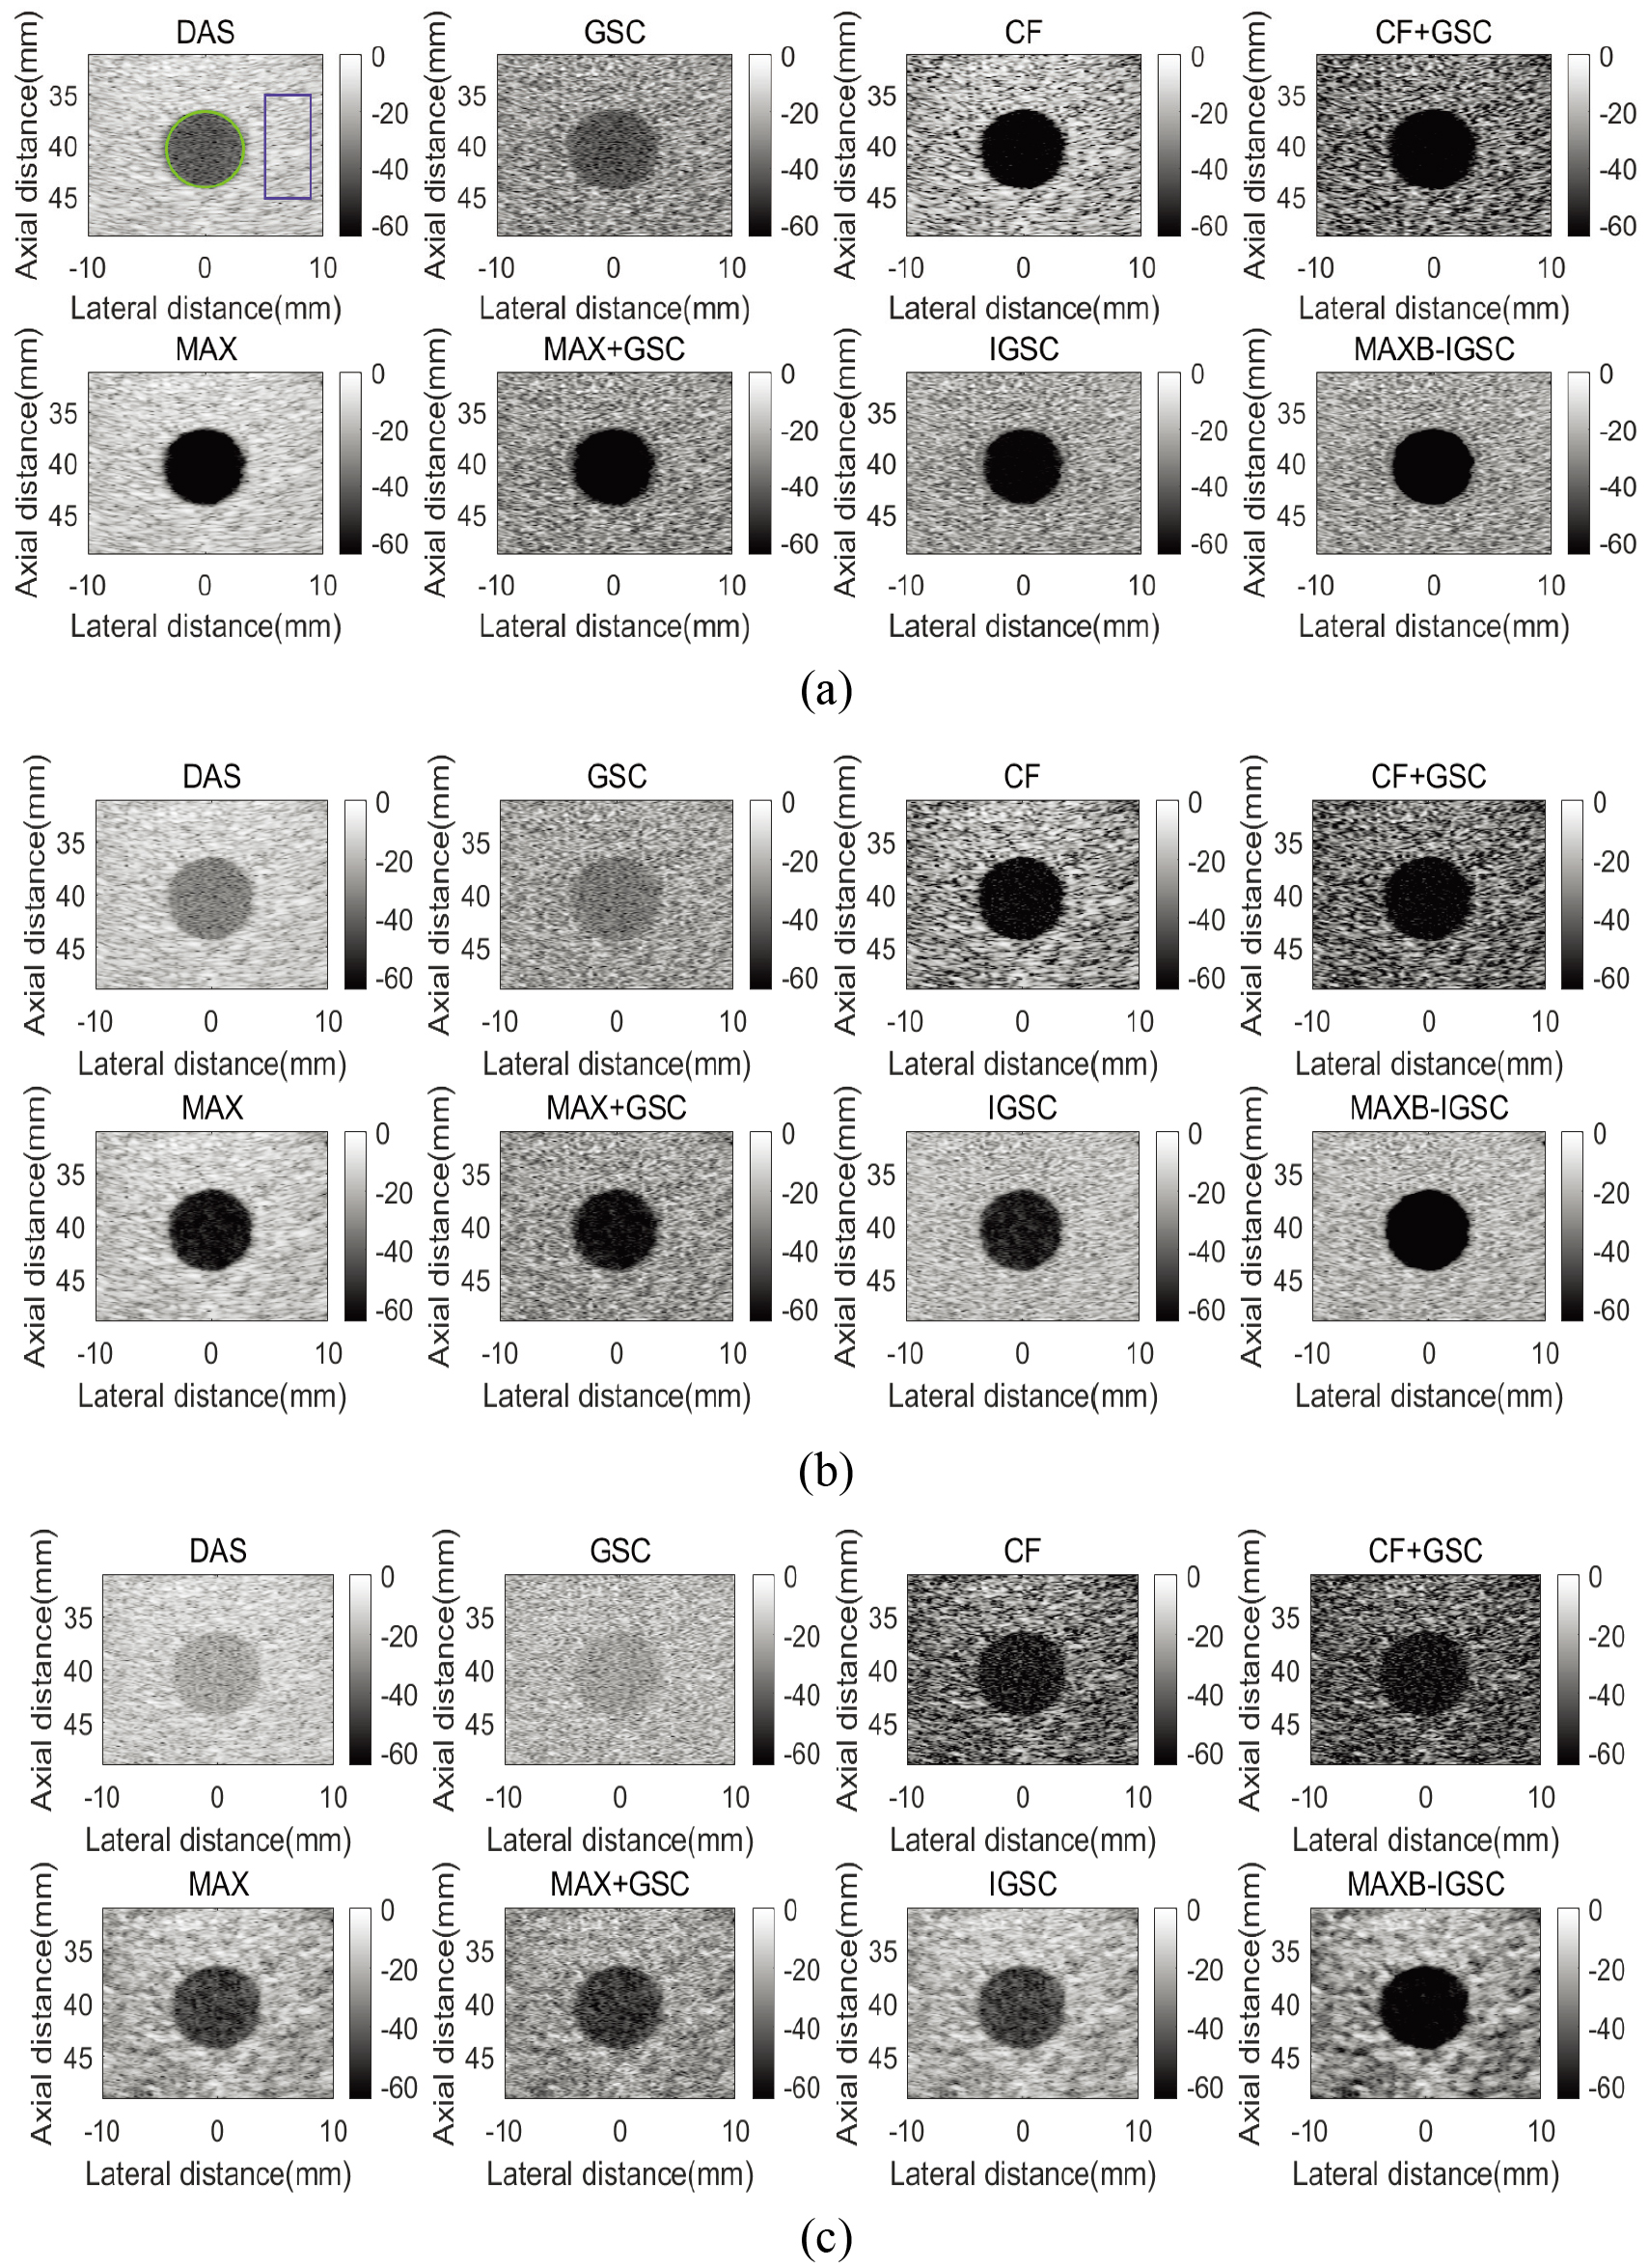
CR, gCNR, and sSNR of different methods (10 dB/0 dB/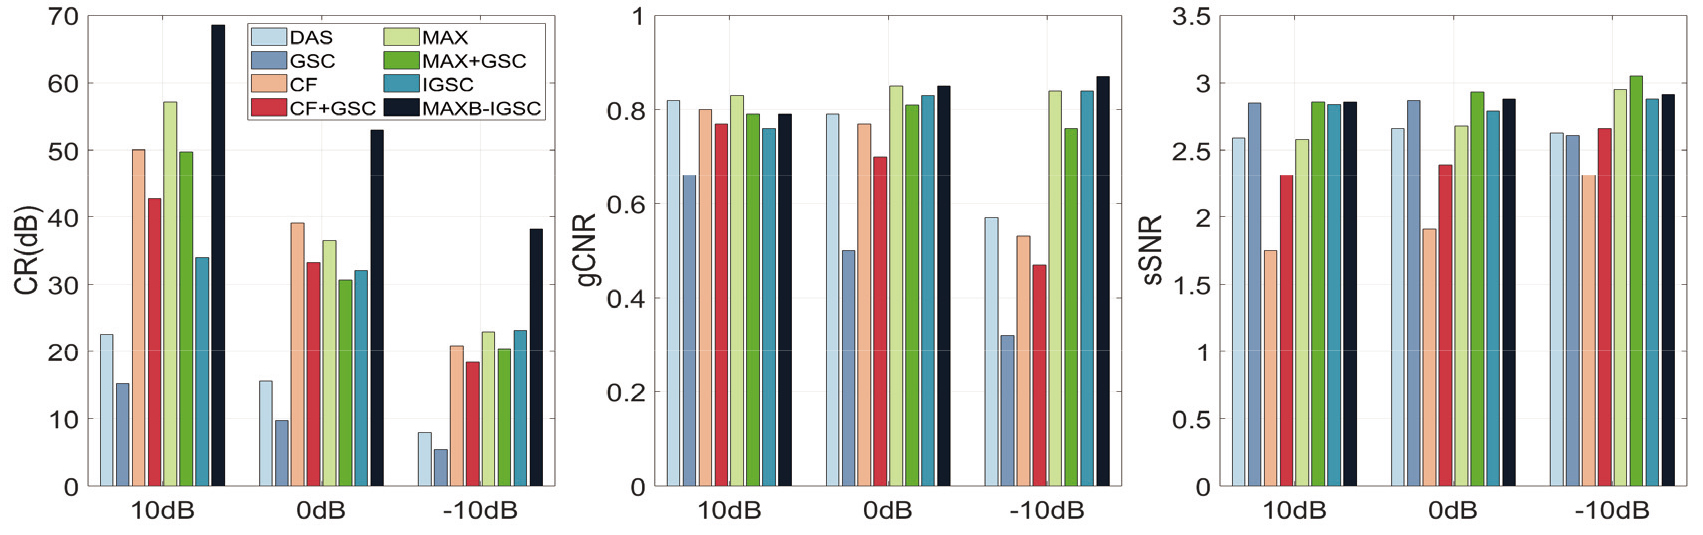
As depicted in Figs 6 and 7, the addition of Gaussian white noise with a signal-to-noise ratio (SNR) of 10 dB/0 dB/
To specifically analyze the resolution performance, the tissue-mimicking phantoms experiment is conducted by using the ats_wire data. Figure 8 illustrates the obtained imaging results, with a dynamic range of 60 dB.
Images of the ats_wire data (a) DAS, (b) GSC (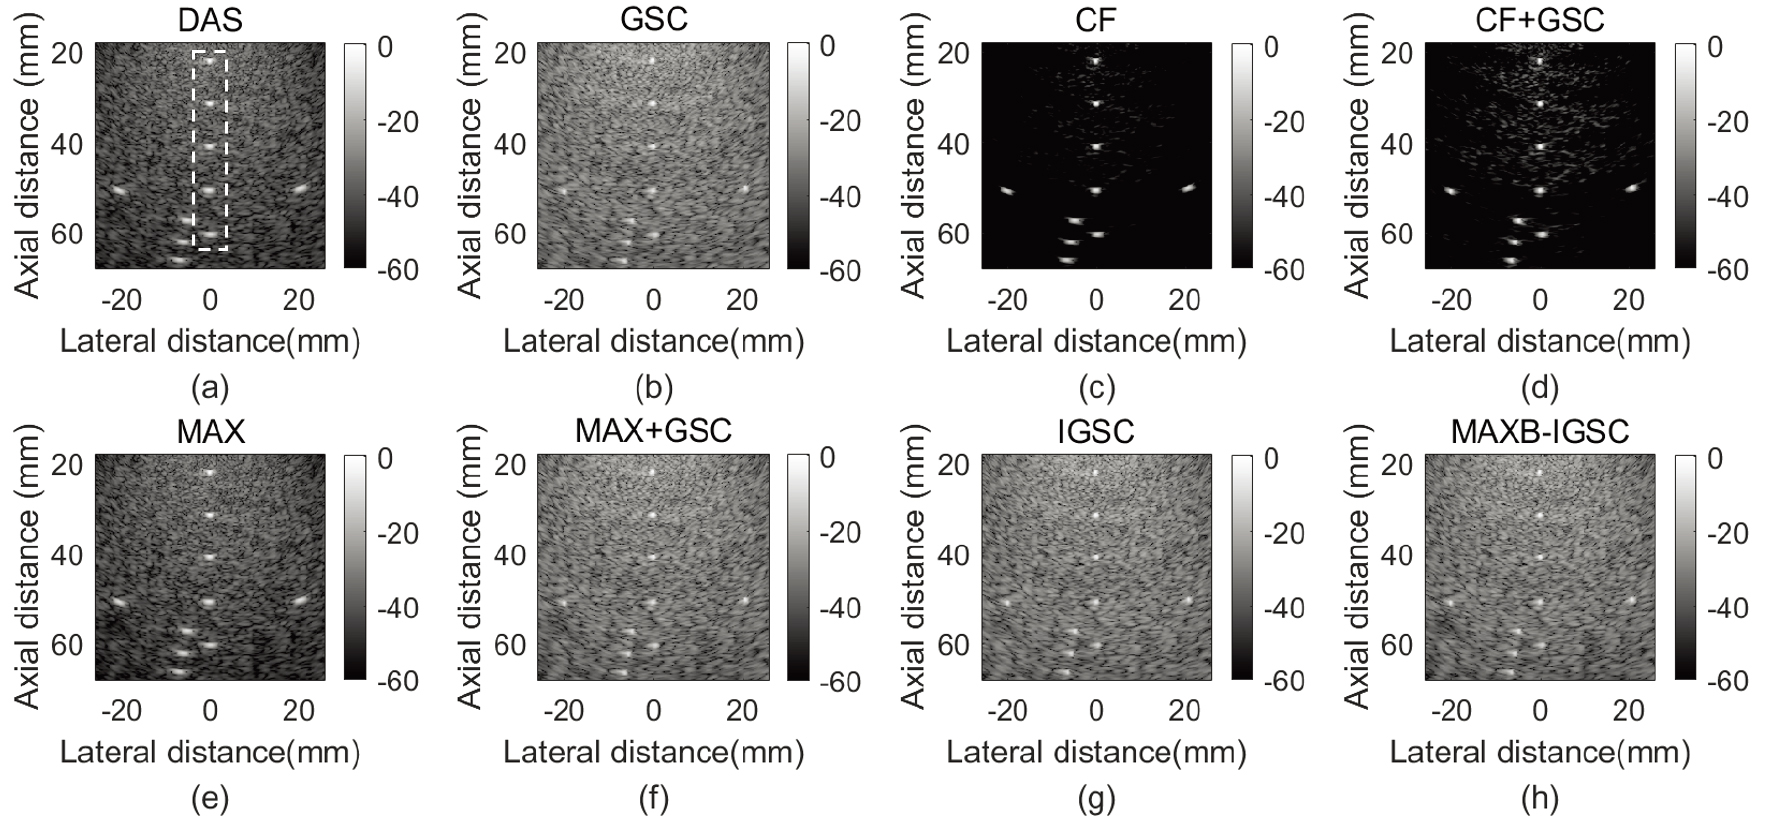
Figure 8 shows that DAS exhibits the worst lateral resolution, while MAX exhibits a similar resolution to DAS. In comparison to DAS, GSC shows a significant improvement in resolution, and MAX
The FWHM of different methods for vertical point targets (mm)
According to Table 4, the FWHM values of MAX
To further inspect the imaging performance of the proposed method, the tissue-mimicking phantoms experiment is conducted by using the geabr_0 data. Figure 9 illustrates the obtained imaging results, with a dynamic range of 65 dB. DAS has the worst resolution, while MAX demonstrates a similar resolution to DAS. GSC shows an improvement in resolution compared with DAS, and MAX
As shown in Fig. 9, the three cyst regions and the background speckle regions of the same depth used to calculate the quality metrics are respectively identified by the green circles and the purple rectangles. Table 5 shows the corresponding metrics.
CR, gCNR, and sSNR of different methods for the 3 cyst regions shown in Fig. 9
CR, gCNR, and sSNR of different methods for the 3 cyst regions shown in Fig. 9
Images of the geabr_0 data (a) DAS, (b) GSC (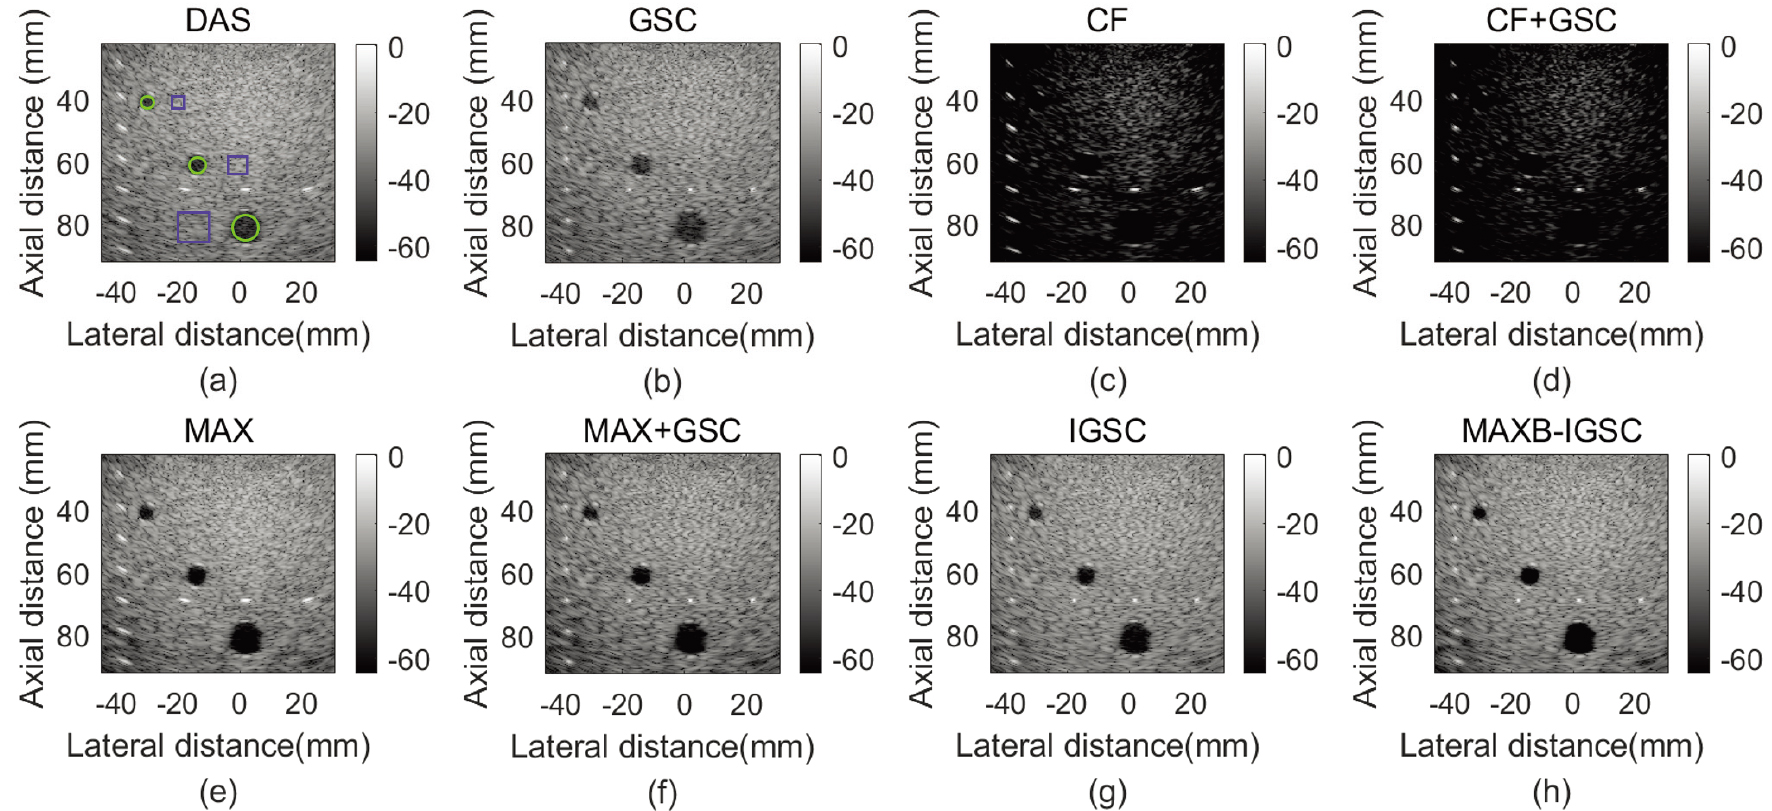
At the depths where the three anechoic cysts are located, CF
Images of the rat_tumor data (a) DAS, (b) GSC (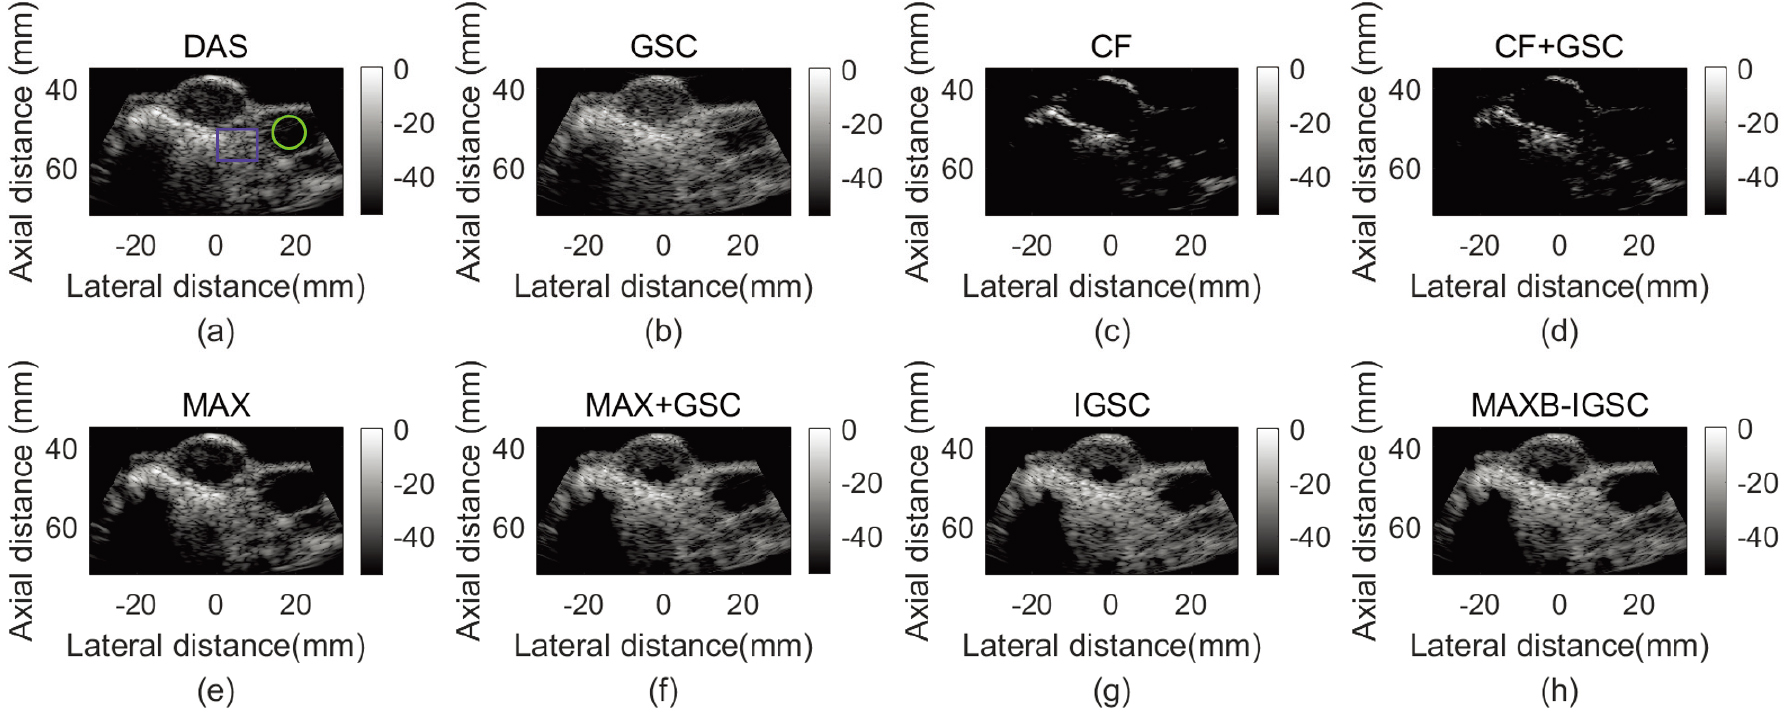
Coefficient weighting matrix obtained from (a) anechoic cyst simulation and (b) geabr_0 experiment.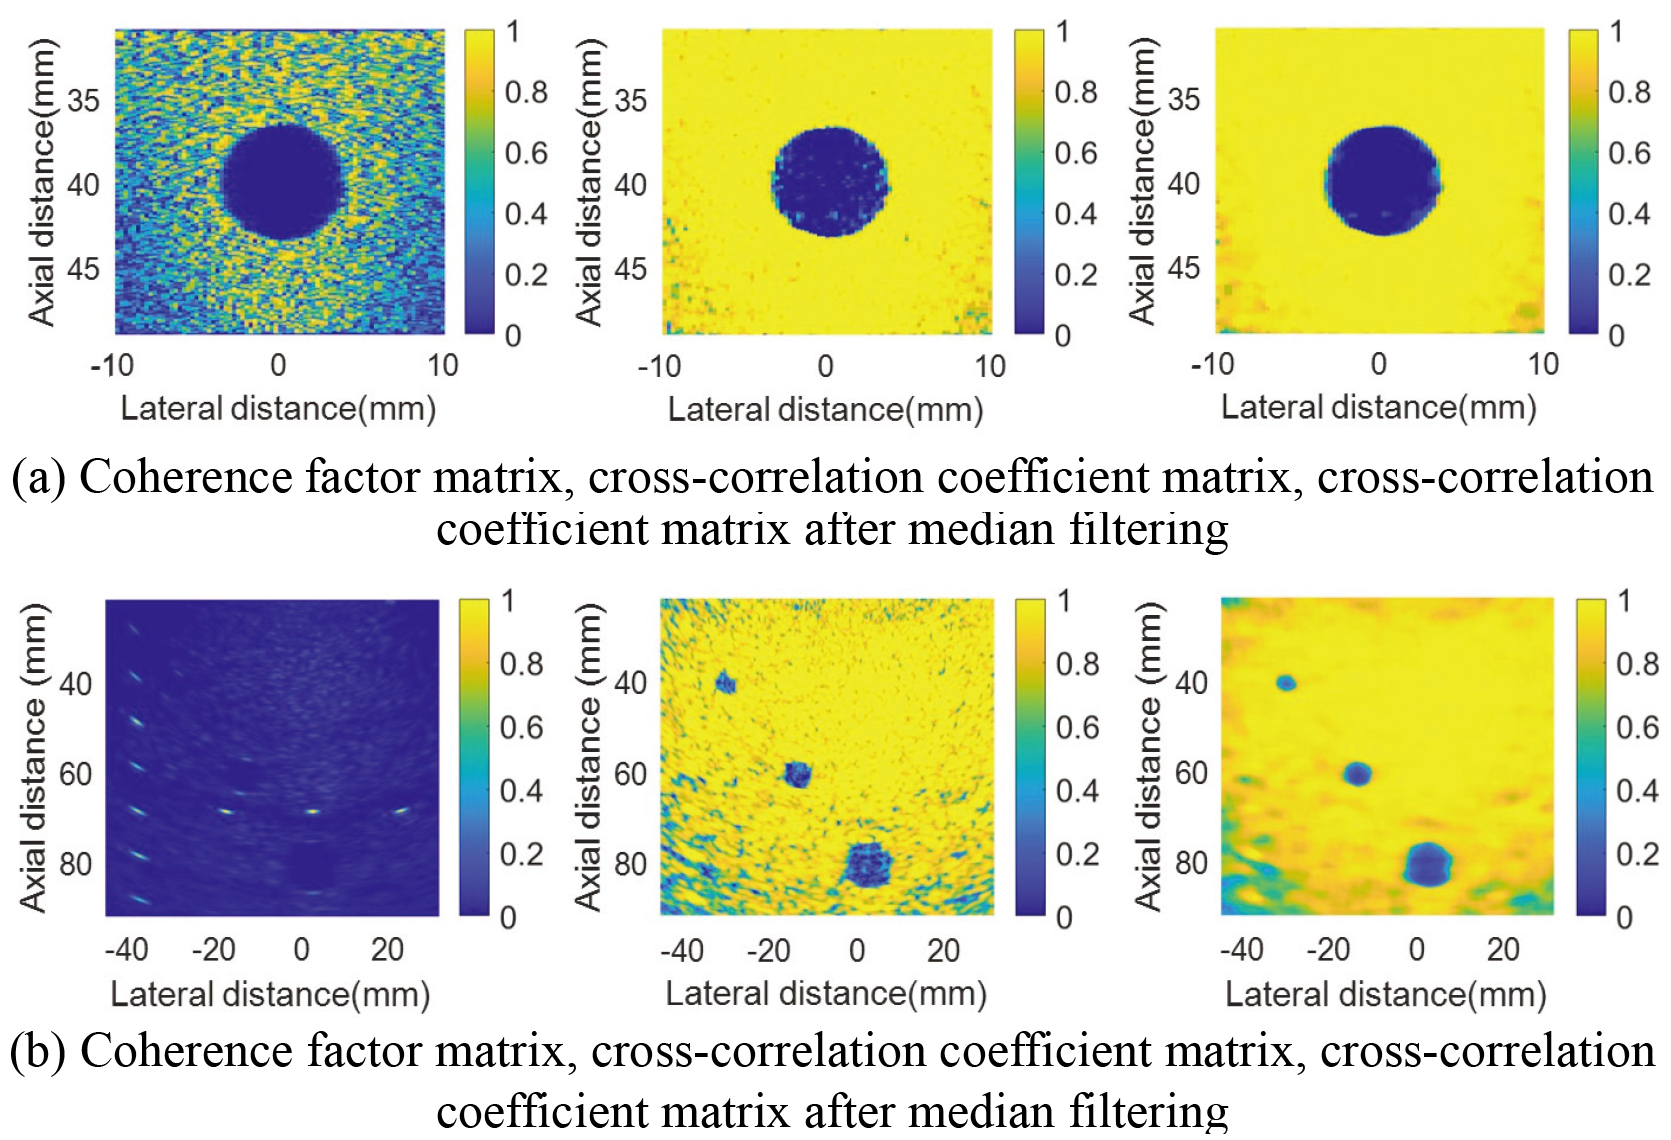
The performance of the proposed algorithm was further investigated by the rat_tumor data. Figure 10 illustrates the images obtained for the rat tumor, with a dynamic range of 55 dB. The regions of interest, indicated by the green circle and purple rectangle in Fig. 10, were utilized for calculating the quality metrics. Table 6 presents the corresponding metrics.
CR, gCNR, and sSNR of different methods for rat_tumor data
CR, gCNR, and sSNR of different methods for rat_tumor data
It can be seen that Fig. 10e–h provides effective clutter suppression, allowing the tumor to be more clearly identified. The background signal intensity in Fig. 10c and d is too low and there are severe dark-area artifacts, which leads to poorer image quality. Compared with GSC, the CR of CF
The traditional GSC has some difficulty achieving both high resolution and strong robustness simultaneously, and also has the problem of insufficient contrast. Aiming at the above issues, this paper introduces the normalized cross-correlation coefficient based on MAX to adaptively determine the length of the spatial smoothing subarray to construct the covariance matrix of GSC. On this basis, the normalized cross-correlation coefficient is used as a weighting vector that weights the output of the improved GSC beamforming.
As seen in Tables 3, 5, 6, and Fig. 7, the GSC with a fixed subarray length of N/2 has less contrast than the traditional DAS. After the introduction of Gaussian white noise, the CR of DAS decreases by 20.85%/45.42%/72.25% respectively, while the CR of GSC decreased by 45.95%/65.46%/80.77% respectively. DAS exhibits better robustness than GSC. This is because when the subarray length is set to N/2, the GSC can take advantage of the maximum array aperture width so that the best resolution can be achieved. However, this will lead to the worst robustness because the independent samples used to estimate the covariance matrix are reduced, resulting in a loss of signal-to-noise ratio and imaging contrast. Therefore, the choice of subarray length is critical to achieving a good trade-off between resolution and robustness. Figure 7 indicates that IGSC is less affected by noise interference compared with GSC, while MAXB-IGSC is less affected than MAX
As shown in Fig. 11, when imaging point targets, the CF values are relatively high, ensuring the preservation of output amplitudes. When imaging anechoic cysts, the CF values are calculated to be small due to the low coherence between clutter and noise, resulting in low weighted amplitudes. This achieves the purpose of clutter and noise suppression, effectively improving image contrast. However, when imaging scattered spot targets that contain both coherent and incoherent components, the calculated CF values are lower, leading to degradation in background speckle uniformity. This is manifested by a decrease in background speckle brightness and the appearance of black-spot artifacts.
To address the limitations of CF weighting, we propose the utilization of the normalized cross-correlation coefficient obtained from MAX to weight the output of the GSC beamformer. This approach aims to enhance the visibility of the cyst target by reducing clutter and noise, while simultaneously preserving the brightness and uniformity of the background speckle. The cross-correlation coefficient obtained by MAX is close to 0 in the clutter region, and close to 1 in the background speckle region and main lobe region. The proposed IGSC and MAXB-IGSC algorithms adapt the subarray length selection based on the clutter level. A larger subarray length is employed in the clutter-free region, while a smaller subarray length is used in the clutter region. This strategy ensures satisfactory imaging performance in both regions. However, the MAX-weighted method can only maintain the resolution of the original method and cannot be further improved, which is a slight shortcoming compared with the CF-weighted method in this respect.
Artificial black spots will be introduced to the speckle region by MAX, which can be eliminated by applying a median filter to a matrix formed by the cross-correlation coefficients corresponding to all pixel points. The median filter is used to remove the outliers and extremes corresponding to the artificial black spots in the speckle region, thus maintaining the uniformity of the background speckle texture. This is the reason why the sSNR values of MAX and DAS are at a similar level in Tables 3, 5, and 6, and similar results can also be found between MAXB-IGSC and GSC. As shown in Fig. 11, the cross-correlation coefficient matrix is much more uniform after applying the median filter, and the outliers in the matrix are removed.
The computational complexity of DAS and CF is
MV beamformers are already possible in real-time due to the powerful GPU [36, 37], In the MAX
Conclusion
This paper proposes a MAXB-IGSC method that uses a normalized cross-correlation coefficient to dynamically determine the length of the subarray to improve the GSC covariance matrix and introduces the normalized cross-correlation coefficient to weight the output of the adaptive spatial-smoothed GSC.
The proposed MAXB-IGSC is inspected by simulation and experimental data. The results show that the proposed method can overcome the difficulty of trade-off among the high image resolution, contrast, and strong robustness. The proposed method can also significantly suppress the artifacts in the anechoic cyst and can avoid the problems of background brightness weakening and the introduction of black-spot artifacts present in CF
Footnotes
Acknowledgments
This work was financially supported by the NSFC Grant (No.62071074) and Chongqing Natural Science Foundation Project (No. CSTB2022NSCQ-MSX0298).
Conflict of interest
The authors declare that they have no conflict of interest.