





Abstract
BACKGROUND:
Chronic kidney disease (CKD) is a major public health problem, so it is particularly important to quantitatively assess and intervene in the degree of early renal damage in CKD.
OBJECTIVE:
The objective of the research is to establish reference values for kidney elasticity by using real-time shear wave elastography (RT-SWE) technology to quantify Young’s modulus values in the renal cortex of normal adults. The intention is to provide a foundation for evaluating renal function and structural changes in patients with CKD. Furthermore, this research investigates the role of RT-SWE in the early detection of renal fibrosis in CKD, providing insights into its diagnostic value for detecting pathological changes at an early stage.
METHODS:
Between August 2019 and December 2021, we collected a sample of 100 healthy people (55 men with an average age of 43.5
RESULTS:
Healthy group: a) The average kPa values of the left kidney (4.2
CONCLUSION:
The study reveals no significant differences in the Emean value of bilateral kidneys in normal people and no differences in the elasticity value of kidneys and gender. However, age-based differences were statistically significant. pyEmean may be useful for comparing CKD stage 1, 2, and 3 patients, and RT-SWE can assess early renal damage.
Introduction
Chronic kidney disease (CKD) is a major public health problem, so it is particularly important to quantitatively assess and intervene in the degree of early renal damage in CKD. The study found that for chronic progressive renal injury, no matter what initiating factor or what signaling pathway is activated, the main pathophysiological changes in the kidney are inflammation and fibrosis. Inflammation originates from infiltration of inflammatory cells caused by local tissue damage, and inflammatory cells secrete inflammatory factors locally, aggravating kidney damage and triggering the repair process [1]. The essence of fibrosis is an excessive repair, resulting in continuous loss of renal parenchyma and continuous progress of renal disease. In this process, continuous excessive secretion of fibrogenic factors caused by chronic injury, resulting in inflammation and fibrotic lesions in kidneys are key molecular events in the chronic progression of CKD [2]. Therefore, to monitor the treatment status of CKD patients, in addition to routine biochemical indicators, the degree of renal fibrosis is also an important monitoring item. However, the current main criterion for evaluating the degree of renal fibrosis comes from pathological results of renal biopsy. Renal perforation is an invasive operation with certain risks [3]. The main complications include bleeding, infection, and subcapsular hematoma, and repeated operation is not suitable. Therefore, finding a convenient, quick, and reproducible non-invasive method to measure the degree of renal fibrosis is an urgent clinical problem [4].
RT-SWE technology is a non-invasive, rapid, simple, and objective method to quantitatively detect tissue hardness, and is currently a hot spot in ultrasound imaging. The measured Young’s modulus value is the ratio of stress to the strain of the target object. The larger Young’s modulus value, the harder the corresponding tissue [5]. A lot of exploration and experience summarization of application value of solid organs such as pancreas and pancreas have made certain progress in the clinical application of this technology. Internationally, the use of RT-SWE technology to quantitatively assess the degree of liver fibrosis has been widely recognized: RT-SWE is a reliable method for non-invasive evaluation of liver fibrosis, and the measured value of RT-SWE increases with the degree of liver fibrosis. In recent years, there have been many studies on kidney application. FlaviuBob et al. showed that shear wave elastography was reproducible for the measurement of kidney stiffness between different operators; Le-Hang Guo et al. [6]. Significance, confirms that shear wave elastography is an effective tool for monitoring chronic kidney disease. By measuring the rat renal fibrosis model, Derieppe et al. found that in the absence of pathological controls, renal cortical stiffness was significantly positively correlated with proteinuria and muscle stiffness (
In summary, shear wave elastography, as a new elastography technique, can directly reflect the basic biomechanical property of kidney stiffness, and technical advantages are obvious [9]. RT-SWE technology can obtain tissue elasticity that cannot be obtained by conventional imaging modalities. Information expands the diagnostic scope of conventional ultrasound, makes up for its shortcomings, and indirectly evaluates elasticity differences of different tissues, provides new ideas for early diagnosis of CKD, and has broad application prospects in clinical work, with potential economic benefits and positive effects social benefits [10].
Chronic kidney disease (CKD) is a progressive loss of renal function due to hypertension, diabetes, or primary kidney disease, leading to increased morbidity and mortality. A study of 405 CKD patients found that shear wave elastography (SWE) is highly accurate and clinically significant for evaluating renal fibrosis, especially when the shear modulus value is used as the threshold [11]. The study examined the impact of tissue fibrosis and microvessel density on shear wave-based ultrasound elastography (SWUE) in patients with CKD. Results showed fibrosis area and integrated optical density positively correlated with CKD stage, but positive area and integrated optical density were not. The diagnostic value of SWUE for CKD staging was poor [12]. The study compared shear wave elastography (SWE) to nuclear scans in evaluating fibrosis in children with CKD. 39 patients underwent SWE, grayscale ultrasonography, and DMSA scans to detect scar sites. The median SWE values were significantly higher with a scar on DMSA (12.6 kPa) compared to no scar (4.1 kPa). The study suggests that including SWE in routine ultrasonography testing saves time and avoids future radioactive testing [13].
The main contribution of the paper is discussed as follows:
To measure Young’s modulus values in the renal cortex of healthy adults, this research makes use of real-time shear wave elastography (RT-SWE). The objective is to develop reference values for kidney elasticity, which will serve as a foundation for assessing renal function and structural changes in patients with CKD. This research explores the function of RT-SWE in the early identification of renal fibrosis in patients with CKD, providing insights into its diagnostic utility for identifying pathological alterations in the early stages of the disease. Between August 2019 and December 2021, a sample of 100 healthy people was collected, with 97 people with the CKD1-3 stage being considered. After removing contraindications and confounding variables, a final cohort of 80 people was included. The average kPa values of the left and right kidneys, as well as the average kPa values of healthy adults 50 years of age and older, did not differ statistically significantly, according to the research. Age differences were statistically significant, implying that pyEmean may be useful for comparing CKD stage 1, 2, and 3 patients and that RT-SWE can assess early renal damage.
The structure of the paper is organized as follows:
Section 2 offers information about the materials and methods used in the research work; then Section 3 explains the statistical methods; followed by that, the results obtained by the research work are discussed in Section 4; then, Section 5 delivers information about the research findings of the research work; finally, the summary of the work and its limitations is discussed in section 6.
Materials and methods
Research objects
Normal population
Selected from August 2019 to December 2021, a total of 100 healthy adults who underwent physical examination in the Department of Ultrasound Medicine of xx Hospital were selected as the normal population in a preliminary experiment. Aged 18–73 years old, with an average of 41.3
The inclusion criteria were clinical diagnosis to exclude previous kidney-related diseases, and serum urea nitrogen, muscle protein, uric acid, and urinary albumin were within the normal range on the day of the ultrasound examination.
Exclusion Criteria:
Age Pregnant and lactating women; Patients with severe primary and secondary diseases such as cardiovascular, cerebrovascular, liver, kidney and hematopoietic system, and mental illness; Various congenital malformations of kidneys; Various renal space-occupying lesions; There is a 15 mm difference in the size of the long axis of bilateral kidneys; Patients with urinary tract obstruction caused by primary or secondary reasons, resulting in abnormal pressure in the urinary system; For obese people, the E value cannot be measured due to the large distance between kidneys and body surface; Those who cannot tolerate or cooperate with RT-SWE due to various other reasons.
From August 2019 to December 2021, a total of 100 inpatients in the Nephrology Department of our Hospital were selected. The inclusion criteria were clinically diagnosed patients with CKD confirmed by laboratory tests and planned to undergo renal biopsy. CKD patients were classified and selected, and CKD stage 1–3 patients were excluded and related contraindications were excluded. The specific exclusion criteria were generally the same as the healthy population exclusion criteria described above. There are a few other items that need to be noted:
Some renal cortical thicknesses are too thin to accurately measure Ean value; Patients with CKD combined with a large amount of ascites or in a state of peritoneal dialysis; Fever patients.
Renal puncture biopsy was performed on the same day or the next day of ultrasonography, and pathology after puncture was confirmed as CKD by electron microscope and fluorescent staining, and the report indicated a degree of interstitial fibrosis.
Using instrument
Ultrasound examination instruments and parameter adjustment: The French Supersonic AixPlorer ultrasonic diagnostic instrument was used in this study, and kidney-related examinations were all used: convex array probe S6-1, frequency 3.5–5.5 MHz, RENAL mode; 24 h urine protein quantitative machine: BioSystems BA400; Blood-related index detection machine: BECKMAN COULTER Au580000.
Preparation before examination: The patient needs to empty the bladder. In principle, there is no need to fast or water. To avoid intestinal gas interference, it is best to complete the examination in the morning. Before the examination, the patient should be routinely trained in breathing, usually holding breath at the end of calm exhalation to avoid affecting measured value due to deep breathing [14].
The body position during examination: the patient is placed in the left lateral position first, with the right arm raised and held on the head, and the right kidney is examined; During this process, if the patient’s body is shaking, a hard pillow can be placed behind him to fix position, and couplant can be heated if necessary to avoid patient’s body shaking and muscle tension due to cold, which will affect elastography. During the examination, the abdomen of the patient should be fully exposed, and the complaint should be applied evenly [15]. For example, if the cut surface of the kidney is located in intercostal space, the probe should be placed in intercostal space as much as possible, and a little pressure should be applied to open intercostal space. The contact surface is completely fitted with the skin of the patient’s body; the operator’s arm-holding probe can be placed on an acid part of the patient to maintain stability, and at the same time, the hand should be stably exerted to avoid excessive pressure on patient’s abdominal wall and elastic measurement may be caused by human factors [16]. Influences During the examination, any cases that may affect elasticity measurement were excluded from the group (such as inability to cooperate with breathing, local skin damage, inability to apply couplant evenly, excessive intestinal gas interference, etc.) [17].
During the inspection, first, select the RENAL mode of the machine, and adjust image depth and gain appropriately: first, obtain a satisfactory maximum long-axis two-dimensional sonographic image of the kidney, and routinely measure the diameter of kidney and other routine parameters (the renal arterial spectrum Doppler at all levels) [18]. In this process, various renal space-occupying diseases, nephrolithiasis, hydronephrosis, multiple or giant cysts, or renal damage due to vascular reasons should be excluded; After finishing, enter RT-SWE mode, make the renal capsule perpendicular to the direction of the sound beam as possible, instruct patient to exhale calmly and then stop breathing, until color in sampling frame is covered, and renal capsule and junction of renal cortex and medulla are elastic. When an image has a clearer boundary, it can be regarded as effective RT-SWE imaging [19]. Freeze image for measurement.
To successfully obtain RT-SWE elastic images, the following conditions should be met:
The two-dimensional image display is clear and complete; When the elastic image is stable, the color image in the sampling frame should be fully or mostly filled; The elastic color image shows that the renal capsule renal cortex and medulla have a clear boundary; Avoid artificially increasing hardness value due to excessive breath-holding or panting; The Q-Box should be completely located in the renal cortex, and should not contain perirenal fat and renal components. When the thickness of the renal cortex of CKD patients becomes thinner, the diameter of the Q-Box can be adjusted appropriately; Elasticity image dispersion index (standard deviation, SD) All gain settings in shear wave mode are normalized to 50 db; select region of interest (ROI) and Q-Box sampling frame diameter is set to 7–10 mm.
The renal Young’s modulus was measured at the upper, middle and lower poles of both kidneys, and measurement was repeated 3 times at each sampling site. The average of
For consistency, we limited our study to an investigator who performed all examinations using the above approach; images were saved in DICOM format, and quality control was performed by another senior sonographer with standardized training. Quality control indicators include clarity and completeness of DICOM format pictures, whether marking of patient information is complete, whether measured values are accurate, and whether parameters listed above meet the standard of keeping pictures [21].
All subjects were fasting, fasting, and water in the morning on the day of the ultrasound examination or the day before, and venous blood was drawn for relevant laboratory examinations: the interval between 24-hour urine protein quantitative examination and ultrasound examination should not exceed 48 hours. Note that emergency renal disease is excluded based on laboratory results: such as urinary tract infection, and acute or drug-induced renal impairment to exclude tumors or other infectious diseases [22].
Ultrasound-guided renal biopsy
All patients who met the diagnostic criteria of CKD stage 1–3 underwent ultrasound-guided needle biopsy in our department on the afternoon of the day of elastic ultrasonography. The patient was placed in the prone position, the puncture point was located at the lower pole of the right kidney, and 2–3 pieces of renal tissue about 1.5 cm were taken for examination [23].
Pathological examination
All pathological specimens were sent to the medical laboratory at Peking University Shenzhen Hospital: kidney tissue for light microscopy was preserved in tissue preservation solution, and electron microscopy specimens were preserved in 2% glutaraldehyde; paraffin-embedded renal puncture tissue, serially sectioned, and subjected to HE, PAS, PASM, Masson staining, observed under a light microscope, frozen section sent tissue, immunofluorescence staining, observed under electron microscope [24]. The final pathological result was issued by the medical laboratory at Peking University Shenzhen Hospital Medical Laboratory and issued after review by a pathologist of Peking University Shenzhen Hospital [25].
Statistics
According to glomerular filtration rate (CKD-EPI formula), CKD1-3 stages were divided into three groups in turn, and 24-hour urine protein quantitative (24hUTP), blood muscle crisp value (SCr),
Results
Comparison of elastic modulus between two kidneys of normal people
Comparison of elastic modulus between two kidneys of normal people
As shown in Table 1, the average
RT-SWE images of the left kidney and right viscera in normal adults (same case).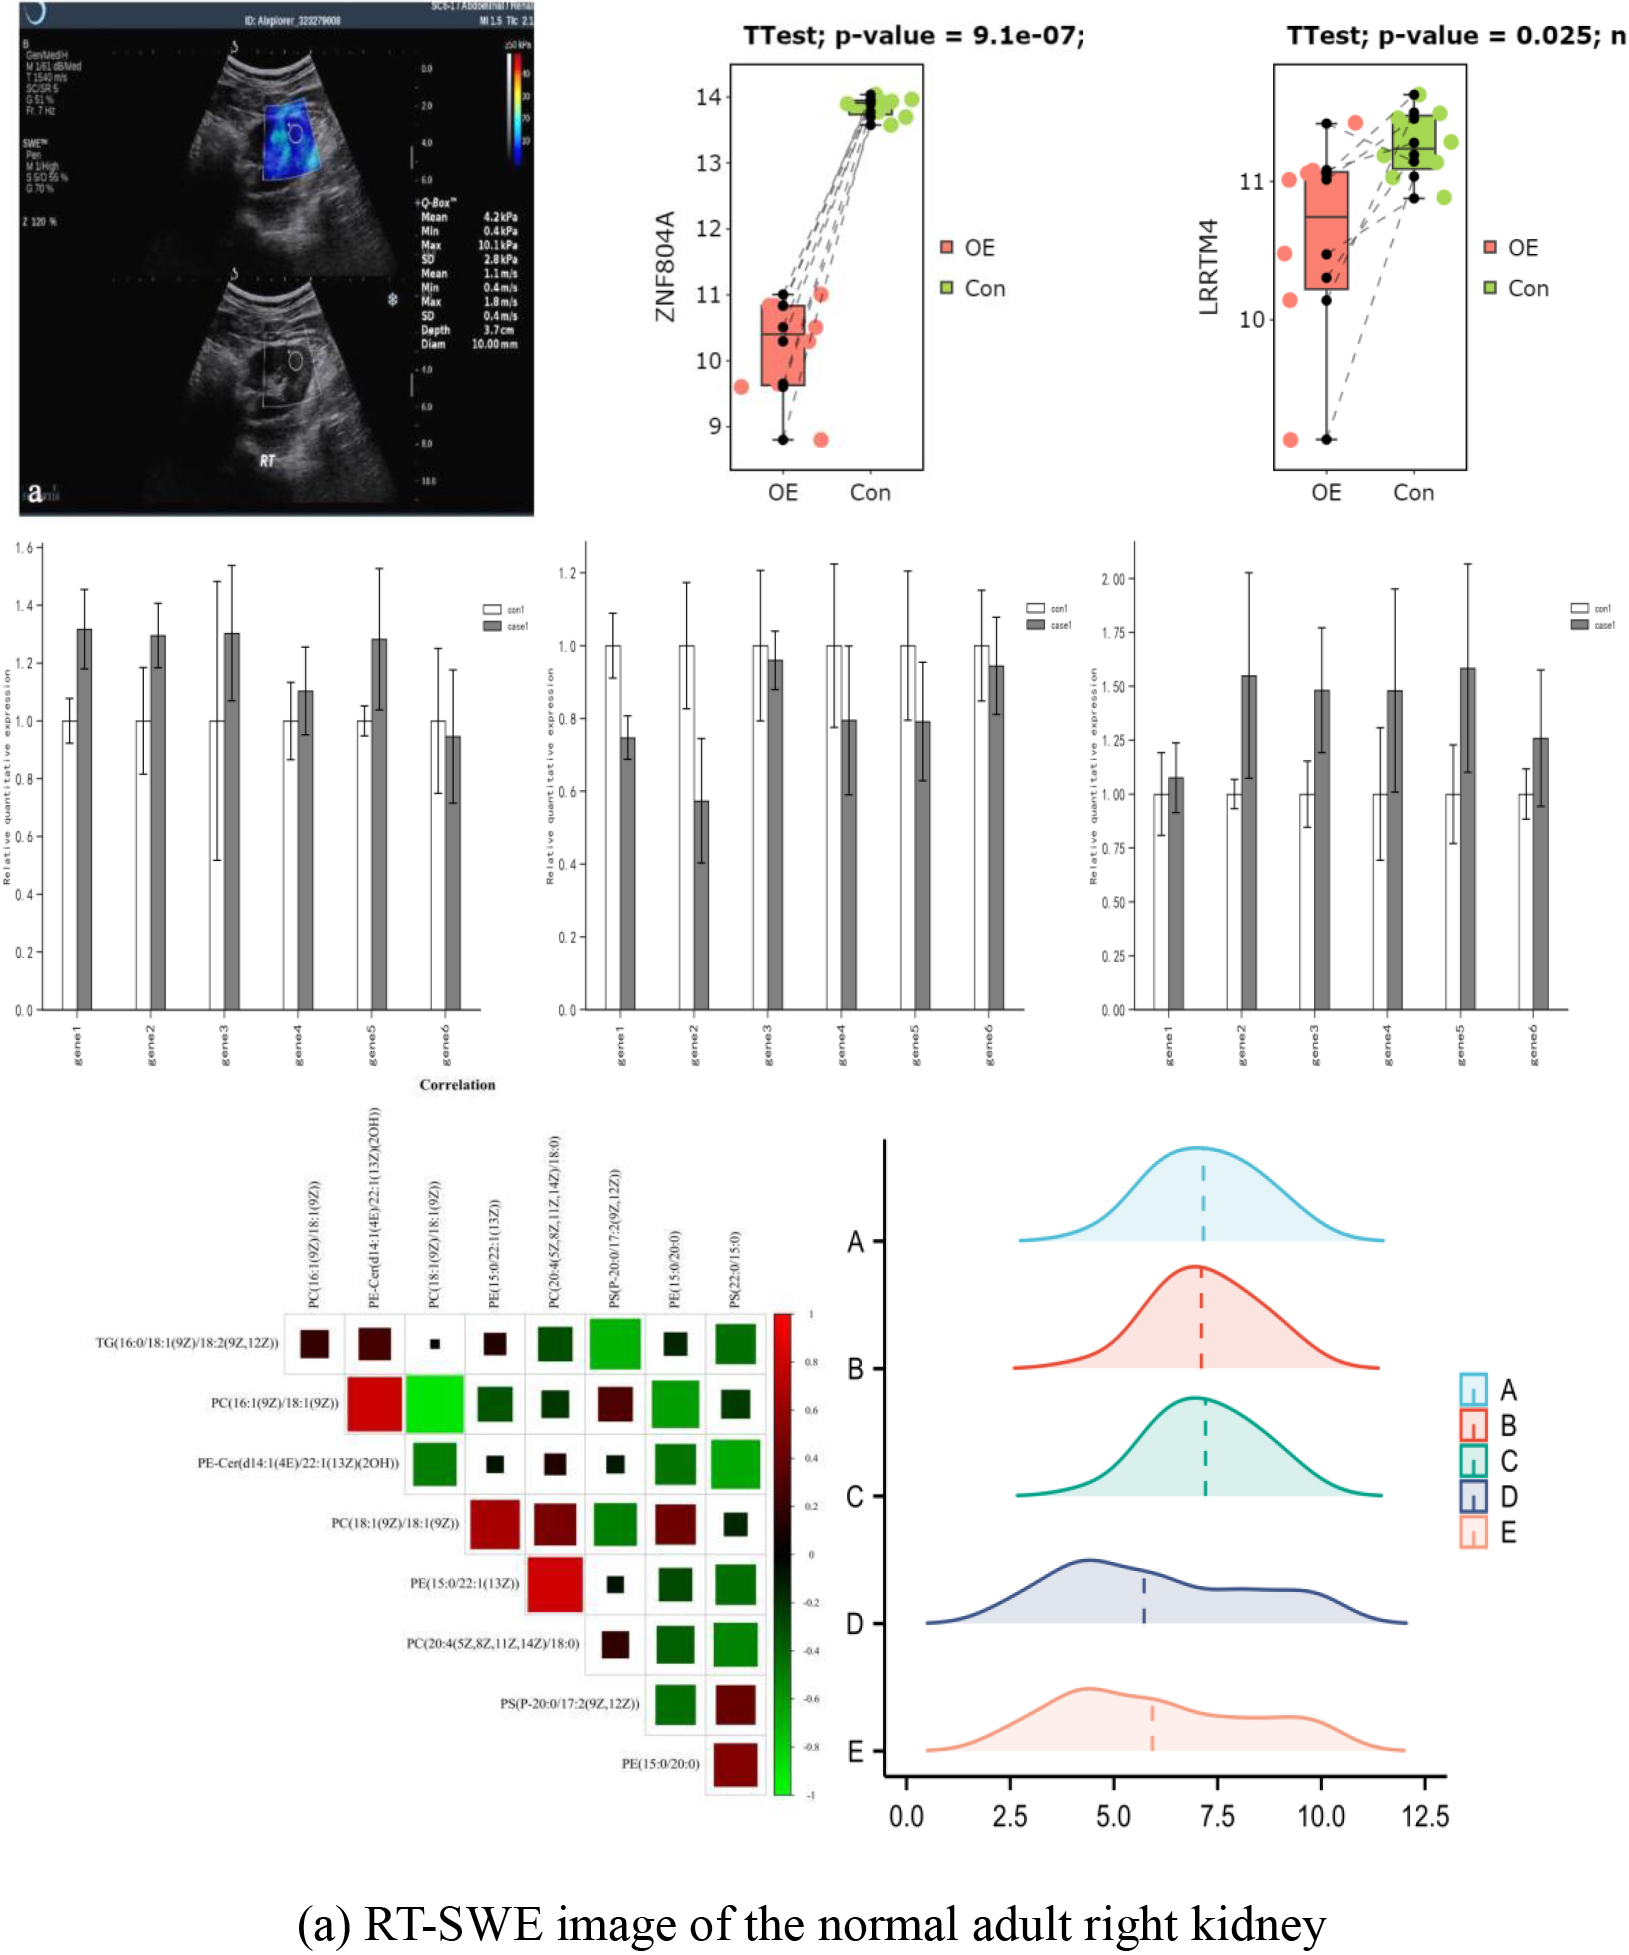
Continued.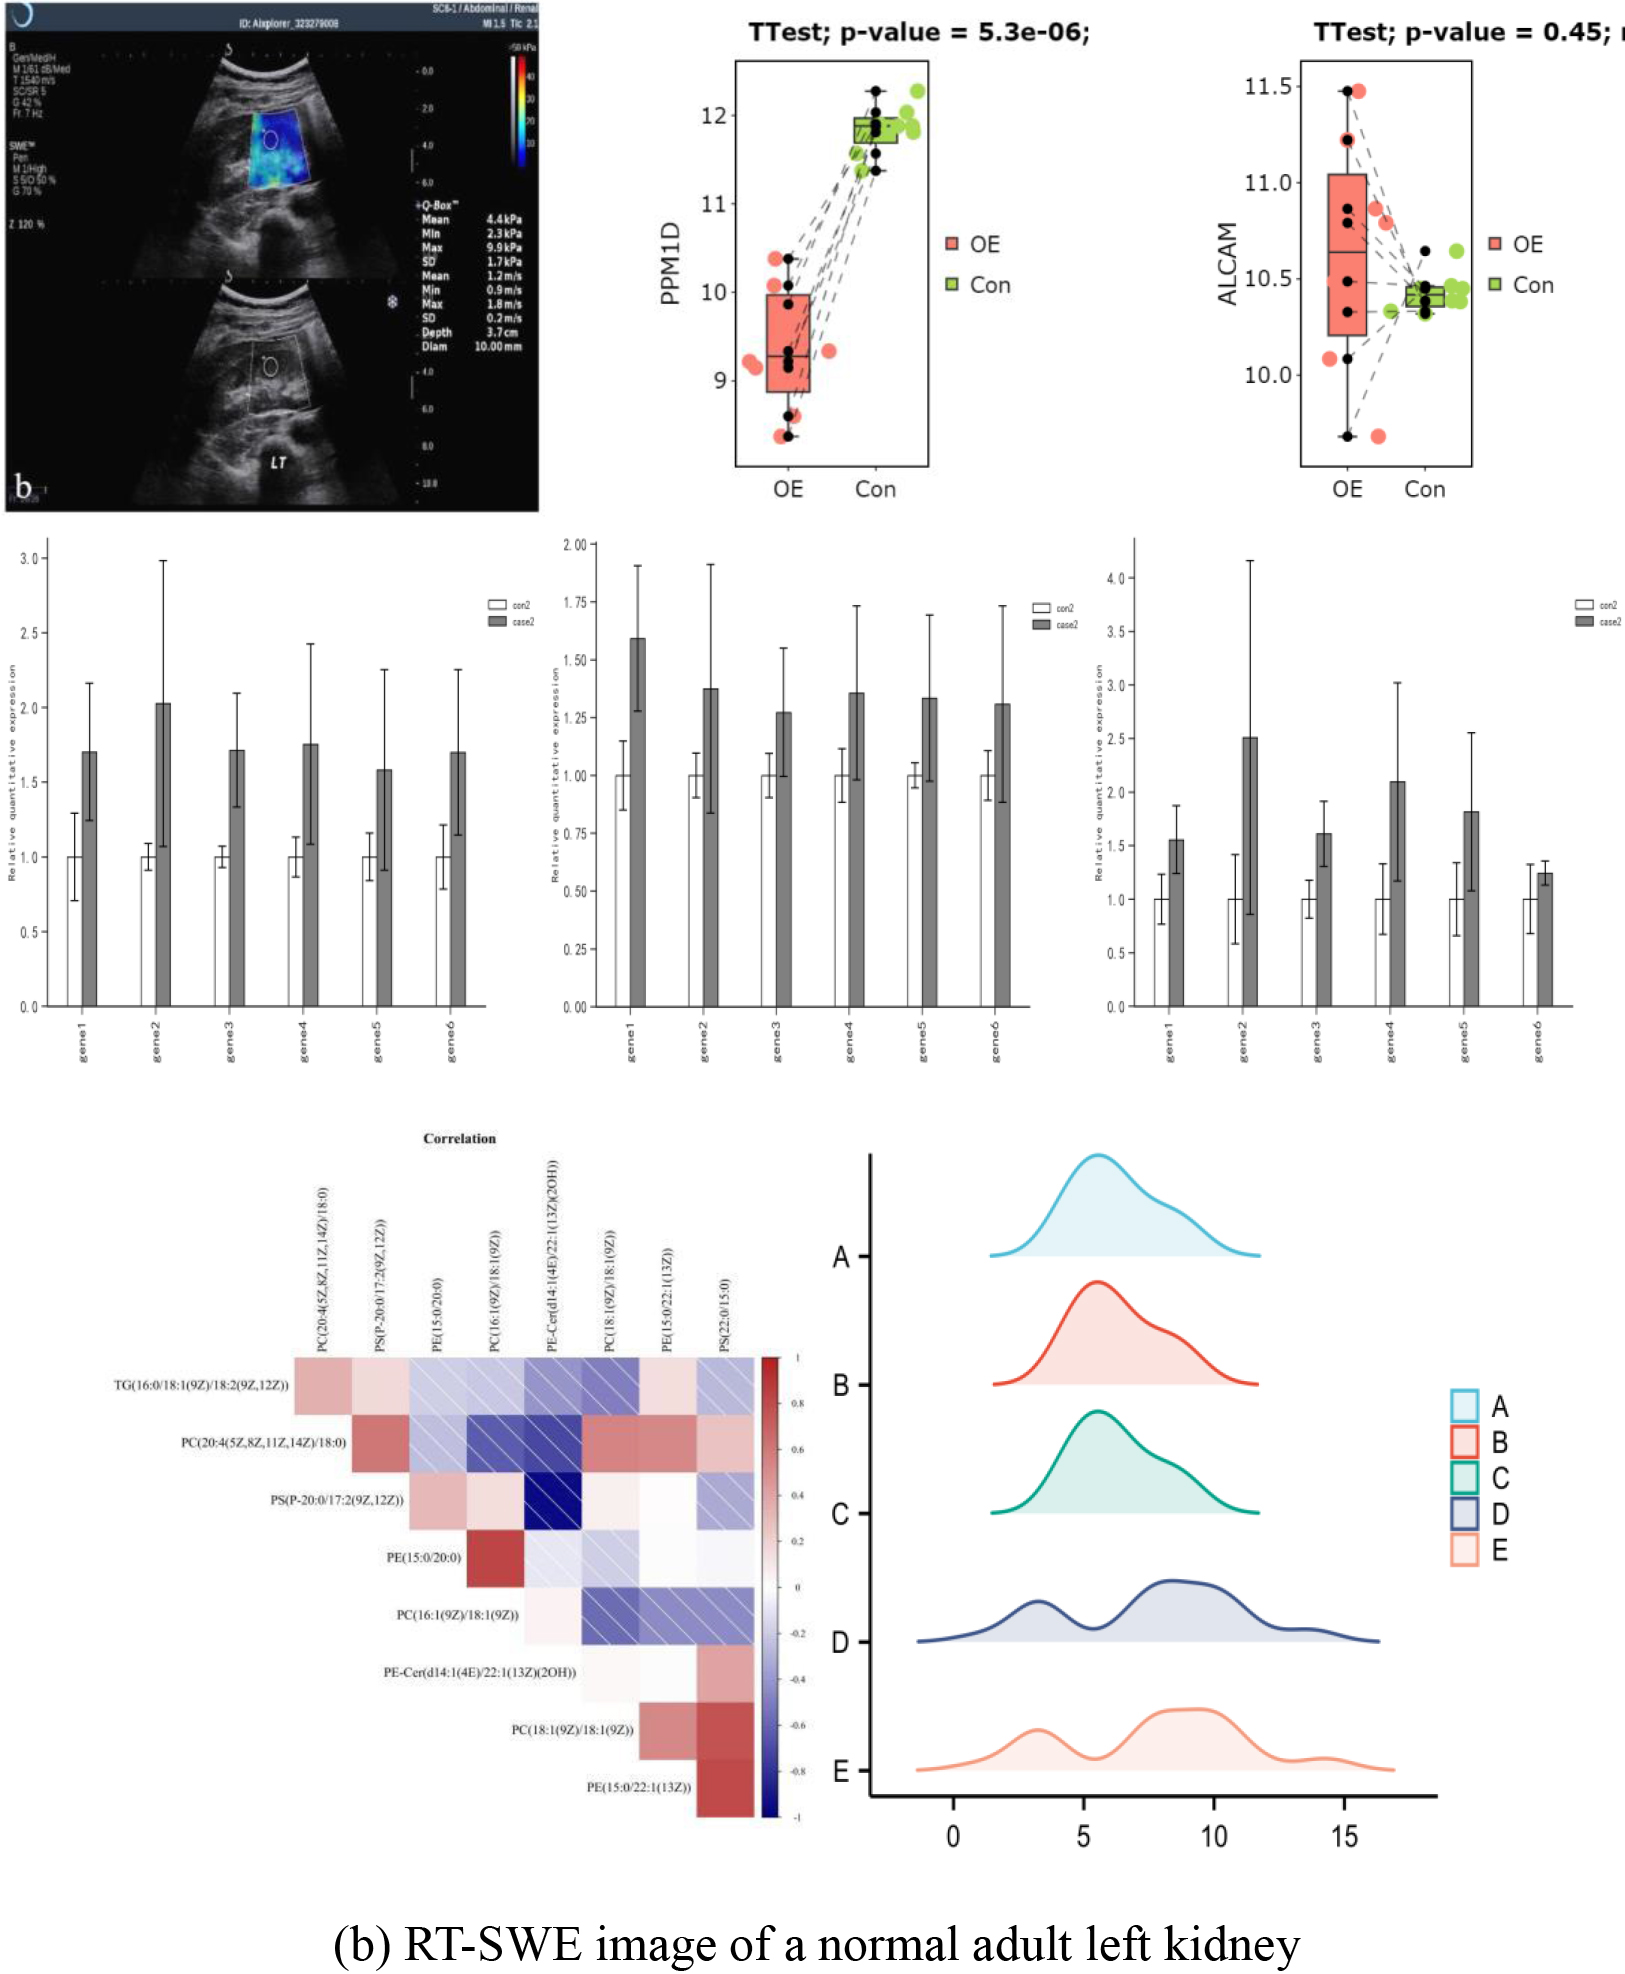
Comparison of elastic modulus of kidney between male and female normal subjects
As shown in Table 2, there was no difference between the mean
Comparison of elastic modulus of the normal kidney at different ages
As shown in Table 3, there was a difference between the renal Emean value (4.4
In summary:
No difference in elastic modulus values of normal adult renal parenchyma measured by RT-SWE in terms of gender, left and right kidneys, and other related factors. The conclusion of this study suggests that when performing renal RT-SWE testing in follow-up studies or future daily work if there is no obvious structural difference between bilateral kidneys in routine ultrasonography, measurement of unilateral kidneys can be used to represent the situation of both kidneys. Simplify the inspection process and reduce time. The Emean values of healthy adults were divided into two groups according to age, and the difference between groups was statistically significant, suggesting that we should consider the influence of age on the hardness value of autologous kidneys in a follow-up study. By measuring the elastic modulus value of normal kidneys, standardize the operation process of RT-SWE measurement of renal parenchymal elastic value in our hospital, and lay a pre-experimental foundation for later evaluation of renal structure and function changes in patients with chronic kidney disease.
Basic data and parameters of CKD1-3 patients
Calculation of continuous variable
Comparison between groups 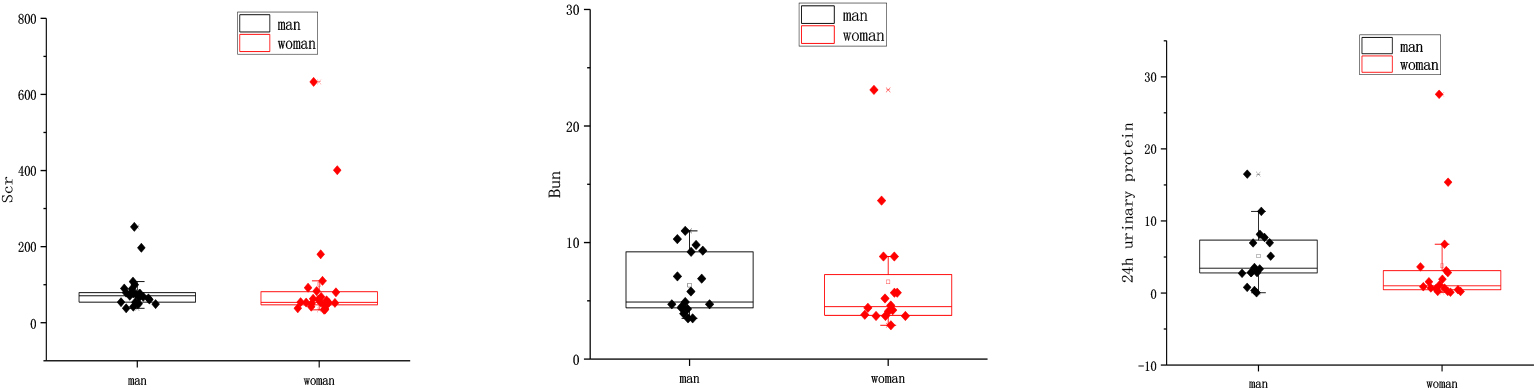
As shown in Table 4, among 50 patients enrolled in this study, an age difference of CKD stage 1, 2, and 3 patients was significant (
Comparison between groups 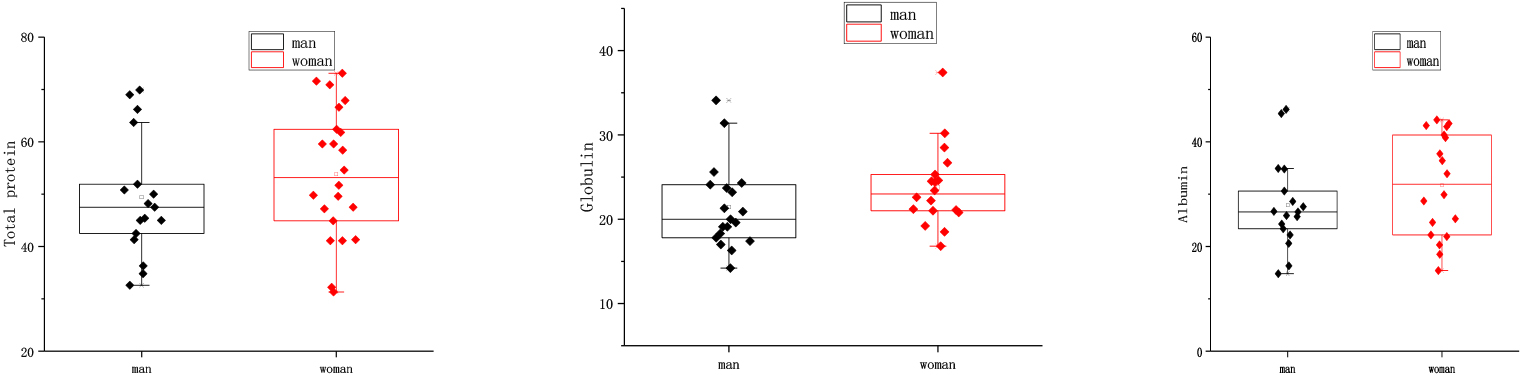
Comparison between groups 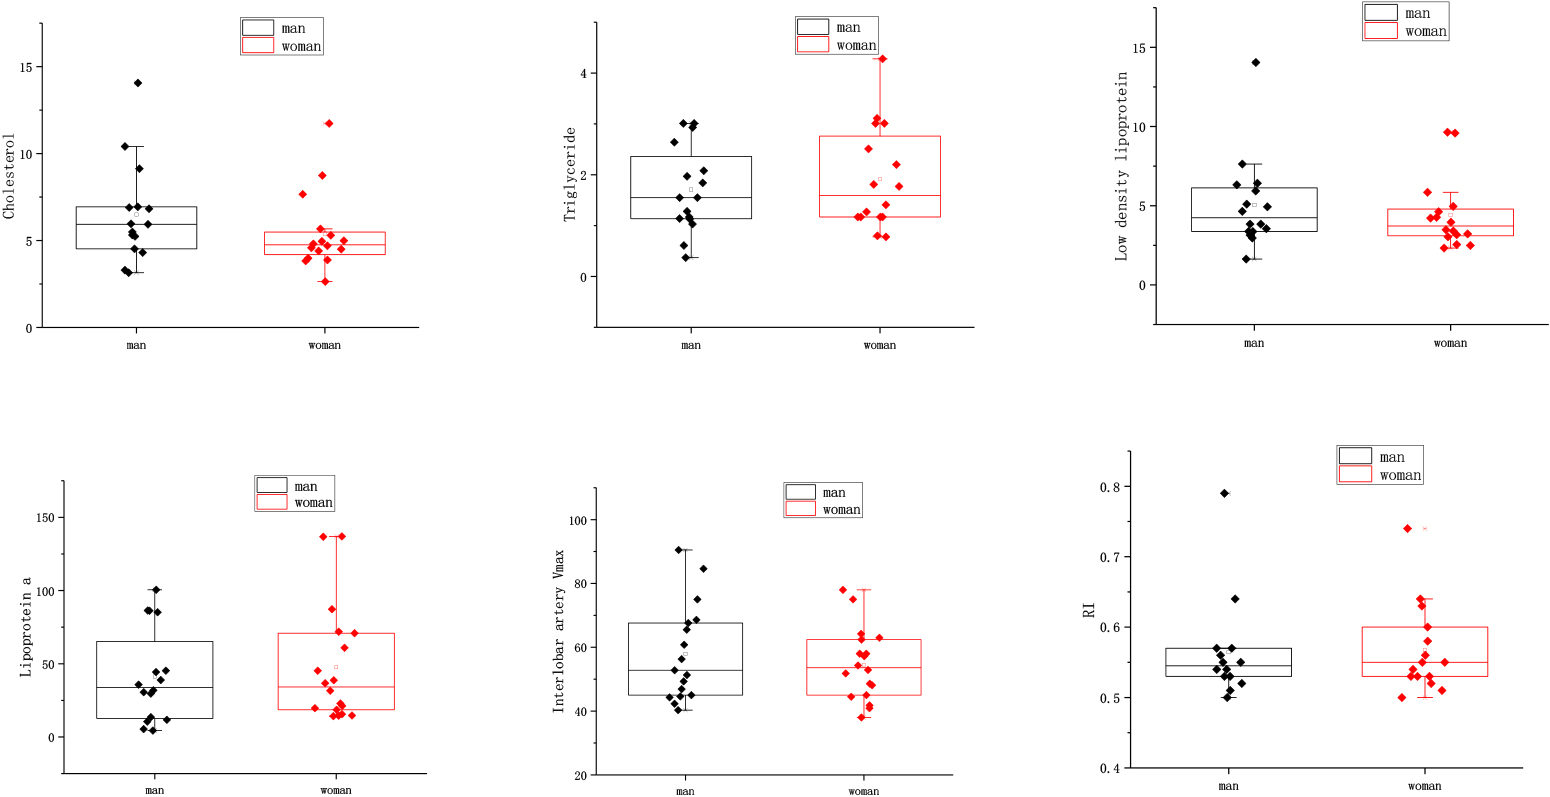
We note that the CKD-EPI formula is an age-adjusted formula for glomerular filtration rate. With the increase of human age, the glomerular filtration rate of human kidneys inevitably declines gradually, so the formula introduces the age parameter of Age to exclude the influence of age on renal function. Preliminary experiments also showed that there were differences in
As shown in Table 5,
CKD1-3 phase
Some doctors have found that for chronic progressive renal injury, no matter what initiating factor or what signaling pathway is initiated, the main pathophysiological changes in the kidney are inflammation and fibrosis. Pathological studies suggest that there is a significant positive correlation between the degree of renal function loss and the degree of renal fibrosis. Therefore, monitoring the treatment status of CKD patients and the degree of renal fibrosis is also an important monitoring item. Since the kidney is composed of a large number of glomeruli and has a strong compensatory function, when there is a slight or partial change in renal structure, blood laboratory indicators may still be normal, but glomerulus may have damaged changes; conventional biochemical indicators only It can reflect the degree of renal injury at a single time point, but it is often powerless to cumulative effect of risk factors leading to renal injury on kidney in past few weeks, months or even years, that is, degree of renal interstitial fibrosis.
The gold standard for routine evaluation of renal fibrosis is renal biopsy. However, renal biopsy is an invasive examination, and its operation has a certain risk of infection and bleeding, and it is generally not repeated. In addition, although CKD is a diffuse kidney disease, CKD such as IgA nephropathy may have an uneven distribution of lesions. In the case of renal biopsy, the sampling site of renal biopsy is limited and the amount of sampling is small, which may lead to false positive and false negative results, which greatly affects clinical decision-making and prognosis of patients. Therefore, how to achieve a non-invasive, safe, and real-time quantitative assessment of the progress of CKD renal fibrosis is an important problem that is urgently hoped to be solved in clinical practice.
RT-SWE technology is a new type of ultrasonic nonlinear acoustic radiation force elasticity that uses ultra-fast (20,000 ton/s) instantaneous recording to detect the velocity of shear wave conduction in kidney and tissue in real-time and to achieve non-invasive assessment of renal compliance imaging technology. RT-SWE has been used as a safe, convenient, and highly reproducible method, and is widely used in real-time quantitative assessment of the stiffness of various tissues and organs that have important clinical value. At present, CKD-related RT-SWE studies mostly focus on comparison and analysis between early CKD and middle and late CKD, but there are still few comparative studies of RT-SWE in early CKD1-3 groups. Its role in the assessment of early CKD renal fibrosis progression and comprehensive analysis of related indicators needs to be further studied.
This study showed that 24hUTP and SCr of CKD1-3 patients were significantly different among groups, but the E value was not significantly different. The results show that RT-SWE measurement cannot accurately assess the progression of renal fibrosis in early nephropathy. However, the elasticity of normal human kidneys will gradually decline with age, so this study adjusted the E value by age to obtain a new index, namely the annual elastic decline value (pyEmn). Further analysis in this study showed that there was still no difference in pyE between CKD stages 1 and 2, but it was interesting that pyEacan in patients with CKDI stage and stage 2 was significantly higher than that in stage 3 patients, suggesting that its measured value can be used to differentiate renal early CKD. Effective means and indicators of damage. In addition, CKD stage 3 is not only a key stage in the progression of early CKD to advanced CKD, but also a key stage in which the renal compensatory ability of CKD patients gradually loses and becomes qualitatively decompensated. How to accurately, early, and non-invasively assess the degree of early renal damage and fibrosis progression in CKD is of great significance for delaying patients’ entry into end-stage renal disease, and has become a current research hotspot. The pyEn proposed in this study not only may have important potential application value for patients with CKD stage 3 but also suggests that RT-SWE can be applied to the assessment of early renal damage in CKD.
Conclusion
Recent research on renal applications, particularly shear wave elastography (RT-SWE), has shown that it is reproducible in measuring renal stiffness values across operators, with no observed correlation between elastic modulus and various demographic factors. Notably, differences in kidney stiffness have been discovered between healthy individuals and those with CKD, establishing RT-SWE as an effective tool for CKD monitoring. The moderate to severe fibrosis group had significantly higher graft elasticity values than the mild fibrosis group, according to research on Chinese kidney transplant recipients. While some studies found no link between renal elasticity and fibrosis in transplanted kidneys, others found no link between chronic kidney injury markers and elasticity. The complexity of CKD as a chronic inflammatory disease implies the need for additional research into the progression of fibrosis and renal elasticity decline, despite indications that renal cortical elasticity values remain consistent across different CKD stages. It is important to note that studies, including this one, frequently have small sample sizes, emphasizing the need for large-sample, multi-center, prospective clinical case-control studies in the future to establish a robust theoretical foundation for the widespread clinical application of RT-SWE.
This study also has its shortcomings. The sample size of the normal group and CKD group is low; in the CKD group, there are only patients with stages 1–3, and there are fewer patients with stage 3. This is because most of the patients with renal biopsy are different. In the early stage of chronic kidney damage caused by this kind of disease, there are often no obvious clinical symptoms, and some laboratory indicators are also in the normal range, which also suggests that we can generally expand the value of the elastic modulus of renal parenchyma in future work. According to a multi-center clinical study, the reference value of pyE in the normal population and the cut-off value of elastic modulus between different stages of CKD patients were obtained.
Funding
No funding was received for this study.
Data availability statement
No datasets were generated or analyzed during the current study.
Author contributions
All authors contributed to the design and methodology of this study, the assessment of the outcomes, and the writing of the manuscript.
Footnotes
Conflict of interest
The authors have no conflicts of interest to report.