






Abstract
BACKGROUND:
Innovations in healthcare technologies have the potential to address challenges, including the monitoring of fluid balance.
OBJECTIVE:
This study aims to evaluate the functionality and accuracy of a digital technology compared to standard manual documentation in a real-life setting.
METHODS:
The digital technology, LICENSE, was designed to calculate fluid balance using data collected from devices measuring urine, oral and intravenous fluids. Participating patients were connected to the LICENSE system, which transmitted data wirelessly to a database. These data were compared to the nursing staff’s manual measurements documented in the electronic patient record according to their usual practice.
RESULTS:
We included 55 patients in the Urology Department needing fluid balance charting and observed them for an average of 22.9 hours. We found a mean difference of
CONCLUSIONS:
When used correctly, the LICENSE system performs satisfactorily in measuring urine and intravenous fluids, although the oral device requires revision due to identified errors.
Introduction
Innovation is increasingly seen as a solution to the challenges posed by factors such as an increase in elderly and multimorbid patients and a shortage of healthcare professionals. Technological advancements have led to transformative changes in the workflows of healthcare professionals [1], improved treatment options and enabled continuous and digital monitoring.
Monitoring fluid balance is an essential nursing task in hospitals to ensure appropriate clinical interventions. Fluid balance disorders have been linked to higher morbidity and mortality rates [2, 3, 4] and prolonged hospital stays [5, 6, 7]. However, previous studies have highlighted the prevalence of inaccuracies in fluid balance charts; a study in ICU found calculation errors exceeding 500 ml in 26.1% of the charts [8], while another study reported that at least 60% of charts were incorrect and inaccurate [9]. A literature review examining the quality of fluid balance charting revealed a common occurrence of inaccuracies [10]. Achieving satisfactory compliance with completed fluid balance charts (75%) remains challenging despite various interventions, such as education, visual aids and equipment [10].
Automation has the potential to address issues related to incomplete documentation, calculation errors, and staff shortages. However, existing systems typically focus on a single aspect of fluid balance monitoring, such as urinary output [11, 12], while comprehensive monitoring requires knowledge of parameters like oral fluid intake. To address this gap, we have developed a novel monitoring device called LICENSE (LIquid balanCE moNitoring SystEm), designed to record fluid intake and output automatically [13].
The development of LICENSE stemmed from the ongoing need for accurate fluid balance monitoring and the commitment to fulfilling it. The concept of an automated solution encompassing all aspects of fluid balance evolved, leading to the creation of the initial prototype. While the innovation process can be described as linear [14], it often takes a cyclical or unplanned form with interrelated phases overlapping one another [15, 16]. The development of LICENSE involved multiple cyclical processes, integrating research and development in an interdisciplinary collaboration among engineers, doctors, and nurses [13]. The equipment underwent initial validation in a laboratory environment, focusing on crucial technological functions such as continuous data transfer and accurate data processing, reaching a Technology Readiness Level (TRL) of 3–4 [17, 18]. Subsequently, LICENSE’s precision and devices were evaluated in a relevant environment (TRL 5) under controlled conditions, demonstrating that the LICENSE system accurately measures urine output, oral intake, and intravenous intake, comparable to or surpassing standard manual methods [13].
This study aims to assess the functionality and accuracy of the digital technology LICENSE compared to standard manual documentation in routine clinical practice. The primary outcome measure is the total fluid balance measured by LICENSE and the manual procedure and the agreement between the two methods. Secondary outcomes include the agreement between LICENSE and the standard procedure for each device measuring intravenous fluids, oral fluids, and urine output, respectively.
Methods
This prospective observational study was conducted at a university hospital in Denmark between August 2021 and June 2022. The study received approval from the Regional Scientific Ethics Committee (ID: SJ-848) and was conducted in accordance with the principles outlined in the Declaration of Helsinki [19].
Study population
Patients were consecutively recruited during their hospital admission and selected based on the following inclusion criteria: adult patients requiring fluid balance charting and catheterized patients expected to remain hospitalized for at least one day. Patients who were unable to provide informed consent (e.g., due to cognitive impairment) or scheduled for discharge on the same day were excluded. Participating patients were provided with both oral and written information about the study and provided written informed consent.
Data collection
Data were obtained from the digital technology LICENSE and the electronic patient record to compare the standard procedure with the LICENSE measurements to determine the agreement between the two methods.
LICENSE consists of three devices measuring intravenous fluids, oral intake and urinary output.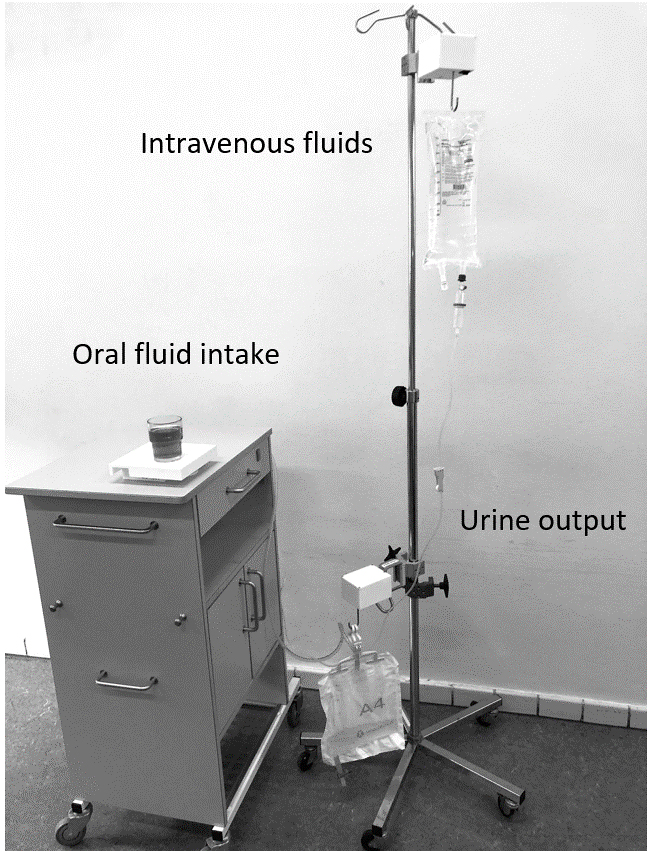
LICENSE comprises three independent measuring devices that monitor intravenous fluids, oral fluid intake, and urinary output through a catheter (as depicted in Fig. 1). The devices for intravenous fluids and urinary output are attached to a drip stand, allowing patients to move freely. Each device wirelessly collects and transmits data to a central database via Wi-Fi through the hospital’s secured medico network used for all medical devices transferring patient-related data. The database on the Microsoft Azure platform stored data and analysed it, applying software to ensure user-friendly dissemination. The results are presented to users through a user interface, displaying numerical data and graphs (as illustrated in Figs 2 and 3). The user interface includes several functions, such as graphs depicting fluid intake or output measured by each device for up to 10 hours, hourly fluid balance calculations, and total fluid balance calculations for a self-selected period. A key feature of the LICENSE technology is its ability to integrate fluid balance data from multiple sources (intravenous fluids, oral fluids, and urine output) and its high level of automation [13].
Graphic presentation of data in the LICENSE user interface.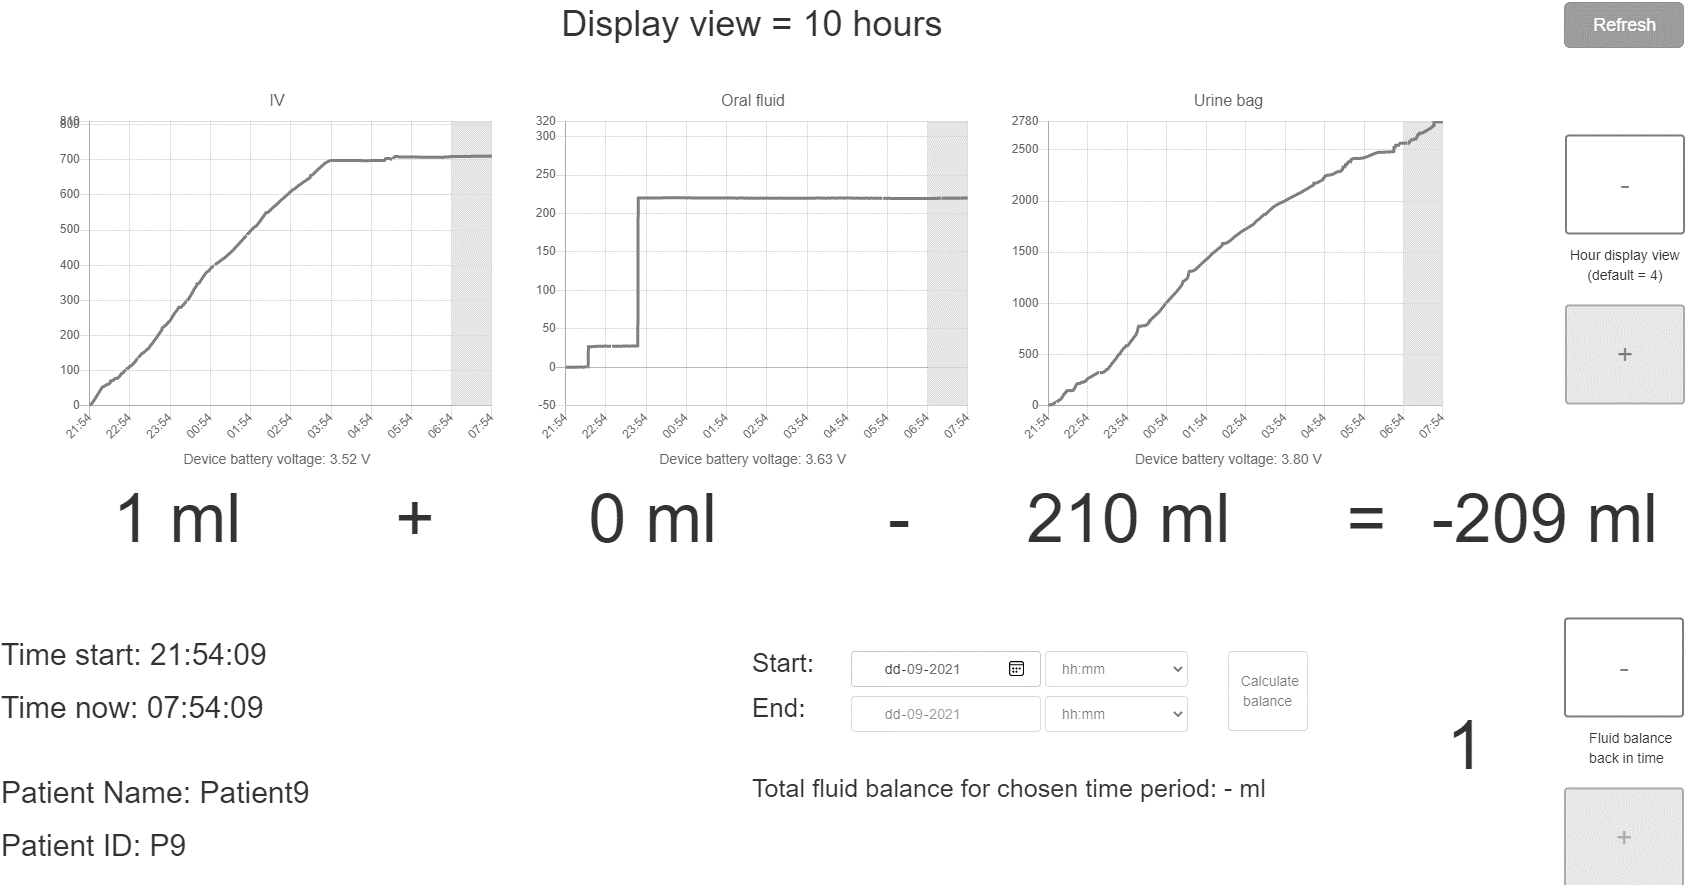
Numeric presentation of data in the LICENSE user interface.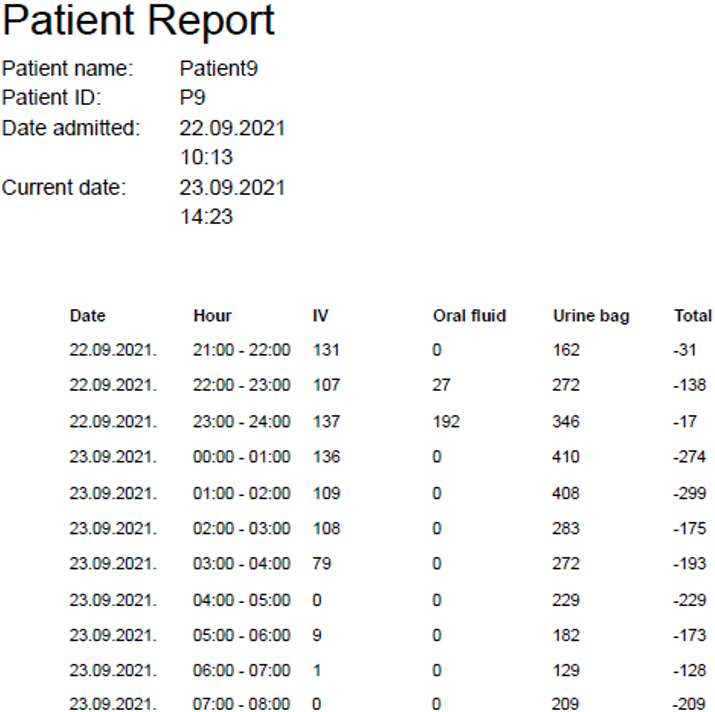
After recruitment, a researcher registered the patient in the LICENSE user interface and ensured that all devices were powered on and ready to collect data. LICENSE was connected to the patient’s drip stand, and all fluids were measured while ensuring the urinary catheter bag was emptied. Patients and staff members were educated on how to use the LICENSE devices, and a written manual was made available in the staff office.
To compare the measurements obtained by LICENSE with the standard manual procedure, manual measurements were performed in accordance with clinical guidelines, as typically done in daily clinical practice. Nursing staff served oral fluids, and their volumes were estimated using measuring lines on jugs or predefined volumes in different cups and glasses. Urinary bags were emptied once per shift, and urine volumes were measured using jugs with measuring lines. Intravenous fluids were documented based on the volume indicated on the manufacturer-labeled bag when emptied. The nursing staff documented the fluid measurements in the electronic patient record.
Data analysis
The primary outcome measure was the difference between the total fluid balance measured by LICENSE and the manual procedure. Total fluid balance was calculated for the entire individual observation period. In cases where the patient was discharged, or data collection was interrupted at an unscheduled time, the total fluid balance was calculated based on the last manual measurement, and LICENSE measurements were included until the same time.
Secondary outcomes included the agreement between LICENSE and the standard procedure for each device measuring intravenous fluids, oral fluids, and urine output, respectively. For all parameters, total fluid intake or output was calculated. For instance, the total urine output measured by LICENSE was compared to the total urine output measured by nursing staff. In cases of discrepancies, a detailed analysis of the fluid balance charts was conducted to explain the differences.
All differences were calculated by subtracting the measurements obtained by the standard method from the LICENSE measurements. Negative results indicated that manual measurements were larger than LICENSE measurements, while positive differences indicated that standard measurements were smaller.
Statistics
Considering the results of previous studies [8, 9], we conducted a power calculation for a one-sample proportion test, hypothesizing a divergence exceeding 500 ml in 35% of the fluid balance charts. The estimated sample size required was 51 participants. We considered a
For the statistical analyses, we utilized R software version 4.1.0. Descriptive statistics were presented as mean (SD) or median (IQR), depending on the normality of the data distribution, and proportions were also reported. To compare the results between the LICENSE measurements and the standard manual procedure, we employed paired
Agreement between manual charting and LICENSE measurements were illustrated by Bland-Altman plots, scatterplots and Pearson correlation.
Patient characteristics
Patient characteristics
*Operations include radical prostatectomy, nephroureterectomy, and heminephrectomy; AKI, acute kidney injury.
Fluid balance measurements
⋄Non-significant mean difference in paired
Histograms illustrating the difference between the standard manual method and LICENSE measurements (darker grey areas within 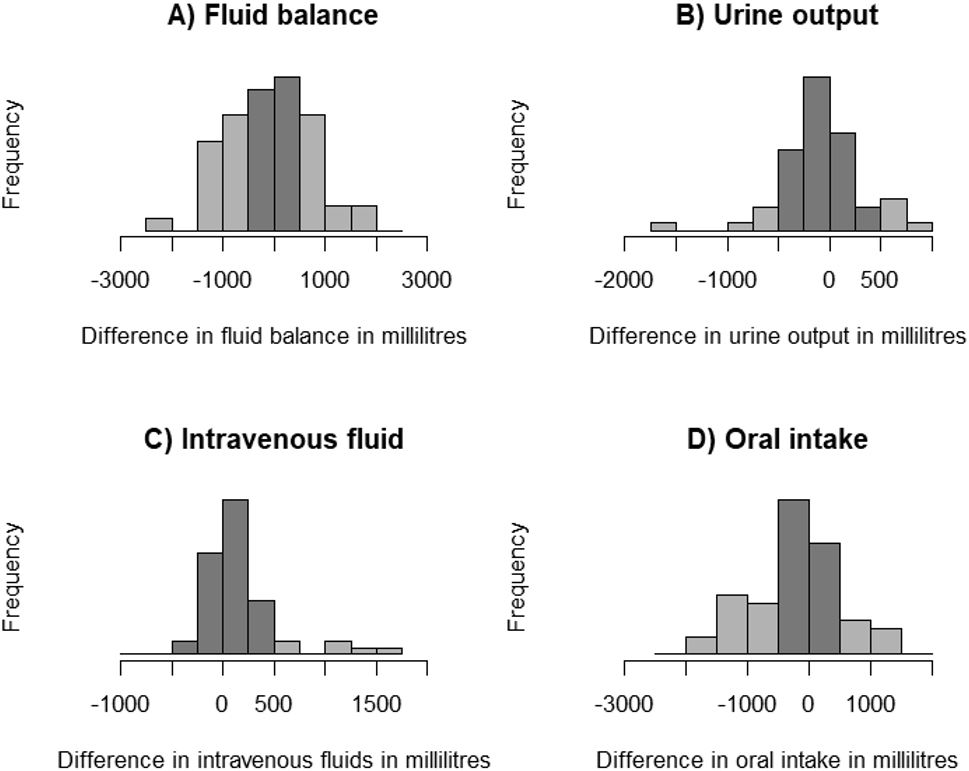
The agreement between manually charted urine output and LICENSE measurements illustrated by a Bland-Altman plot (left) and a scatterplot with Pearson correlation (right).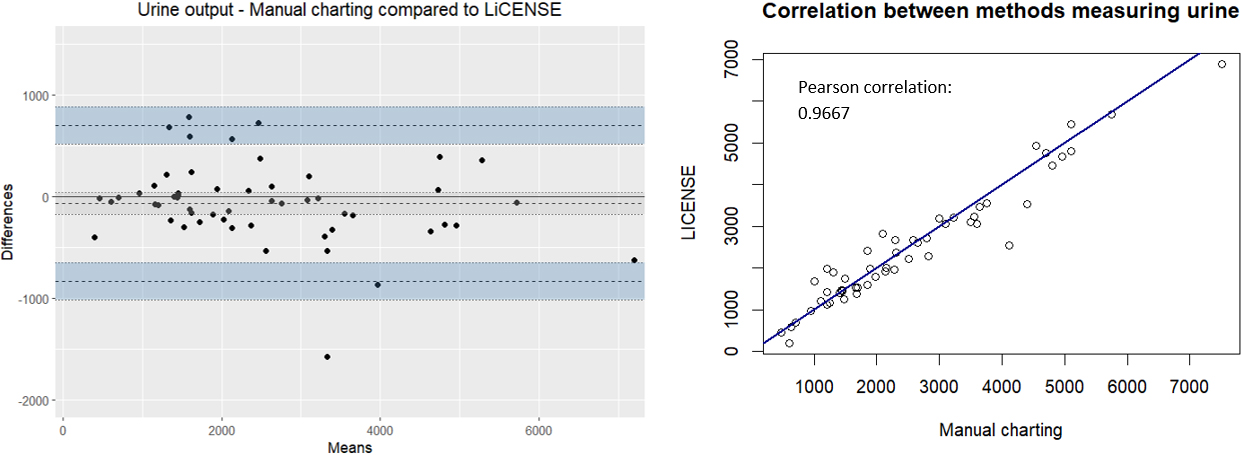
The agreement between manually charted intravenous fluids and LICENSE measurements illustrated by a Bland-Altman plot (left) and a scatterplot with Pearson correlation (right).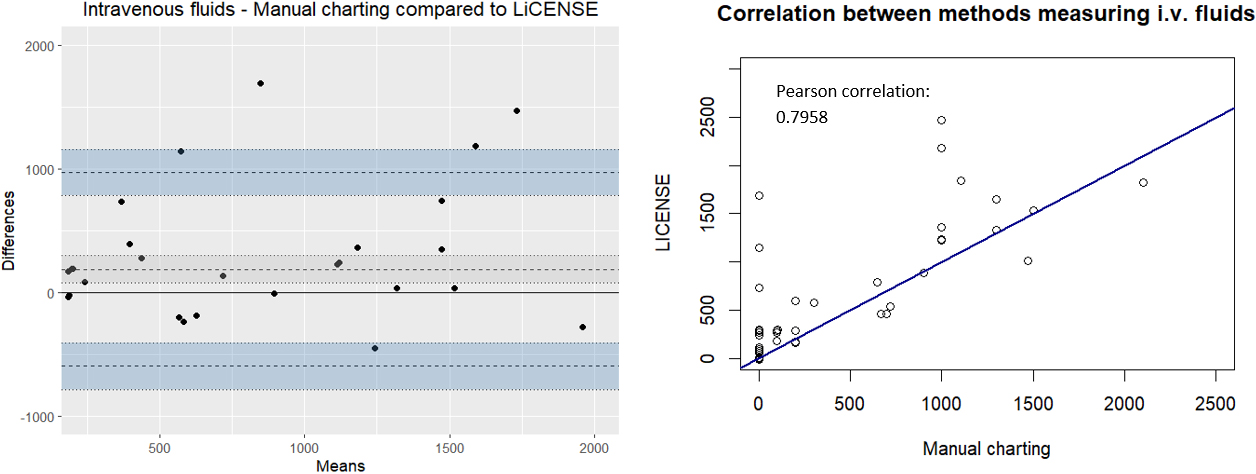
The agreement between manually charted oral fluids and LICENSE measurements illustrated by a Bland-Altman plot (left) and a scatterplot with Pearson correlation (right).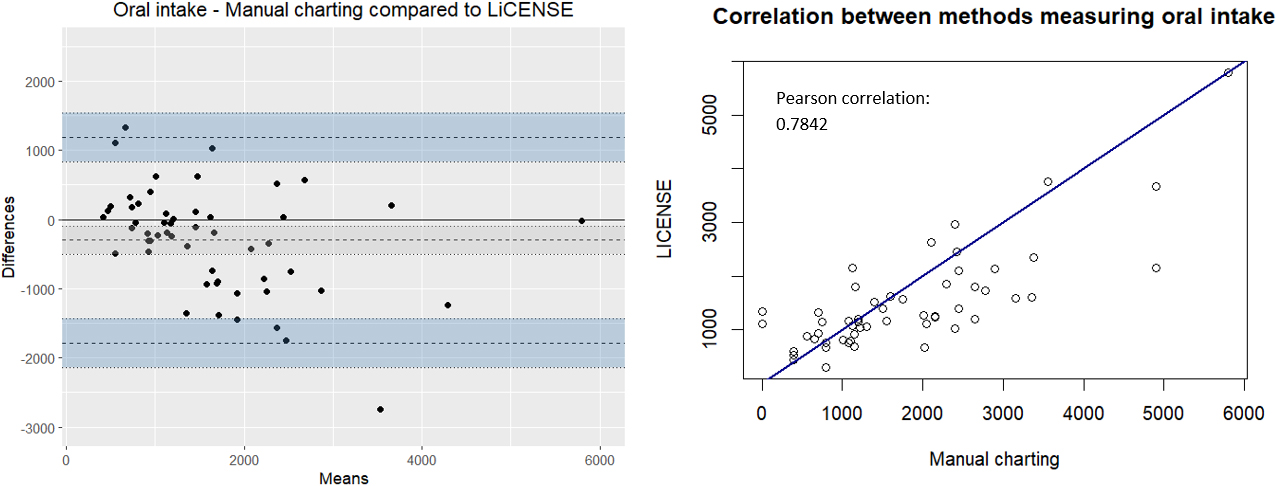
A total of 55 patients admitted to the Department of Urology were included in the study. These patients were observed for an average duration of 22.9 hours (SD 3.6). The mean age of the participants was 66.8 years (SD 12.5), and 74.5% were male. Among the participants, 22% were prescribed diuretics, and 65% received intravenous fluids or medication. The current fluid status was assessed in 25% of the patients, and 71% had fluid balance charting prescribed, which involved recording either intake only, both input and output, or hourly diuresis. The remaining 29% required postoperative fluid balance charting per local clinical guidelines. Additional patient characteristics are presented in Table 1.
The mean total fluid balance measured by the LICENSE system was
When comparing the LICENSE system to the standard manual procedure for each fluid balance parameter, we observed that in 18.5% of patients (95% CI 9.2% to 31.4%), the difference in urinary output measurements exceeded 500 ml. Regarding intravenous fluids documentation, differences of more than 500 ml were found in 11% of patients (95% CI 4.2% to 22.6%), and in oral fluid intake, the difference exceeded 500 ml in 42.6% of patients (95% CI 29.2% to 56.8%). We refer to Table 2 for a comprehensive overview of these findings.
The differences in total fluid balance calculations displayed a normal distribution centred around zero (Fig. 4). However, urine output differences exhibited a negative skewness, and a mean difference of
Discussion
The average discrepancy of
Urine output measurements
When comparing urine output measurements between LICENSE and the standard manual method, we observed both negative and positive differences, with 18.5% of patients exhibiting differences exceeding 500 ml and a mean bias of
Intravenous fluid measurements
The histogram and Bland-Altman plot depicting differences in intravenous fluid measurements (Figs 4 and 6) demonstrated positive skewness. Upon scrutinizing individual charts, we discovered that missing documentation of intravenous fluids, particularly intravenous antibiotics, in the electronic fluid balance chart was the underlying cause. Notably, 77.1% of patients received intravenous fluids or medication according to both LICENSE and the electronic medication list, but this information was not reflected in the electronic fluid chart. Consequently, fluid intake was underestimated in the electronic fluid chart, consistent with a study reporting that 66.9% of errors in fluid balance calculations were due to the omission of intravenous drugs [21]. Another study reported a discrepancy between intravenous volumes documented on paper charts and those recorded electronically, with 26.1% lacking electronic recording [22].
Inaccurate manual documentation, resulting from documenting intravenous fluid volumes based on the volume indicated by the manufacturer on the fluid bag, emerged as another reason for divergence. Firstly, some fluids remained in the infusion lines when infusions ended; secondly, the volume specifications provided by manufacturers are not always accurate. A study comparing fluid weights with nurses’ documentation identified a significant difference; however, it did not specify whether nurses documented higher or lower values [23]. Another study of 3-liter bags reported an average overfill of 3.8%, corresponding to a mean overfill of 115.3 ml [24].
Some patients received intravenous infusions when they were recruited to the project, and the remaining volume at enrollment was estimated; however, estimating volumes from intravenous fluid bags is imprecise.
Oral fluid measurements
Significant and common differences in oral fluid measurements were observed, with 42.6% of patients exhibiting differences exceeding 500 ml and a negative skewness with a mean bias of
Implications
This study illustrated that omissions in manual fluid balance charting play a significant role in discrepancies related to urine output, intravenous fluids, and oral fluids. Several factors have been identified as potential causes for missed nursing care, including communication issues, shift types, available nursing resources, and workload [28]. In the context of fluid balance charting, causes of errors and omissions include increased workload and time constraints due to staff shortages [9, 29, 30, 31], poor communication among staff members [29, 30], and frequent change of caregivers [32]. Thus, automating fluid balance charting may improve charting quality. However, LICENSE needs further revision.
Further, this study demonstrated the necessity of evaluating medical devices in real-life settings. The oral LICENSE device performed satisfactorily in a controlled validation study [13]; however, use in real life revealed possible mishandling, resulting in faulty data. When a revised LICENSE prototype has been developed, preventing the risk of errors identified in the current version, the usability and feasibility need testing. Initially, in a study including observations or video surveillance to ensure the new LICENSE prototype version is indeed improved. Subsequently, a larger-scale study validating the effectiveness of the revised prototype. Another essential step for LICENSE to reach the European market is CE marking, as this is mandatory to ensure that medical devices comply with standards in the European Union [33].
Limitations
This study is subject to several limitations. Firstly, due to uncertainties primarily associated with the oral LICENSE device, we were unable to draw meaningful conclusions regarding our primary outcome. However, the study provided valuable insights for improving the digital technology and identifying sources of errors in manual fluid balance charting. Additionally, while data supported some causes of errors, others relied on clinical experience and speculation. A more comprehensive understanding of error sources would require additional observations or video surveillance. The threshold of 500 ml is not supported by evidence and may vary depending on the clinical context, patient characteristics, comorbidities, and illness severity [34].
Conclusion
The LICENSE system shows promise in enhancing the quality of fluid balance charting. However, further adjustments are necessary to improve its accuracy and usability, particularly concerning the oral device. We anticipate that the implementation of such improvements will have a positive impact on the work environment of nursing staff by saving time. Nonetheless, the effects on the work environment should be investigated in future studies.
Footnotes
Acknowledgments
The authors have no acknowledgements.
Conflict of interest
The authors declare that they have no conflict of interest.