
Abstract
BACKGROUND:
Wnt activation promotes bone formation and prevents bone loss. The Wnt pathway antagonist sclerostin and additional anti-sclerostin antibodies were discovered as a result of the development of the monoclonal antibody romosozumab. These monoclonal antibodies greatly increase the risk of cardiac arrest. Three-dimensional quantitative structure-activity relationships (3D-QSAR) predicts biological activities of ligands based on their three-dimensional features by employing powerful chemometric investigations such as artificial neural networks (ANNs) and partial least squares (PLS).
OBJECTIVE:
In this study, ligand-receptor interactions were investigated using 3D-QSAR Comparative molecular field analysis (CoMFA). Estimates of steric and electrostatic characteristics in CoMFA are made using Lennard-Jones and Coulomb potentials.
METHODS:
To identify the conditions necessary for the activity of these molecules, fifty Food and Drug Administration (FDA)-approved medications were chosen for 3D-QSAR investigations and done by CoMFA. For QSAR analysis, there are numerous tools available. This study employed Open 3D-QSAR for analysis due to its simplicity of use and capacity to produce trustworthy results. Four tools were used for the analysis on this platform: Py-MolEdit, Py-ConfSearch, and Py-CoMFA.
RESULTS:
Maps that were generated were used to determine the screen’s r2 (Coefficient of Multiple Determinations) value and q2 (correlation coefficient). These numbers must be fewer than 1, suggesting a good, trustworthy model. Cross-validated (q2) 0.532 and conventional (r2) correlation values of 0.969 made the CoMFA model statistically significant. The model showed that hydroxamic acid inhibitors are significantly more sensitive to the steric field than the electrostatic field (70%) (30%). This hypothesis states that steric (43.1%), electrostatic (26.4%), and hydrophobic (20.3%) qualities were important in the design of sclerostin inhibitors.
CONCLUSION:
With 3D-QSAR and CoMFA, statistically meaningful models were constructed to predict ligand inhibitory effects. The test set demonstrated the model’s robustness. This research may aid in the development of more effective sclerostin inhibitors that are synthesised using FDA-approved medications.
Keywords
Introduction
Canonical Wnt signalling is mediated by Wnt ligand binding to Frizzled (FZD) and LRP5/6, resulting in dephosphorylation-mediated stabilization and nuclear translocation of beta-catenin [1, 2]. In osteocytes, the SOST gene [3, 4, 5, 6] expresses Sclerostin [7], which regulates bone remodelling and responds to mechanical stress [8, 9]. Antisclerostin monoclonal antibody (Scl-AbII) romosozumab [10, 11] reverses the estrogen-induced bone loss in ovariectomized rats. The romosozumab dosages were all well tolerated. At least one cardiac risk was experienced by 64% or 60% of subcutaneous placebo or romosozumab subjects and 50% or 25% of intravenous placebo or romosozumab subjects [12]. So, FDA-approved drugs were selected to reduce these risks. Since these drugs are needed for long-term usage and acceptance from patients, FDA drugs were chosen.
Quantitative structure-activity relationships (QSAR) have been used to predict the biological activities of novel chemical entities based on their physicochemical properties for decades. The concept of field-based three-dimensional quantitative structure-activity relationships (3-D QSAR) is that differences in biological activity are related to changes in shapes and intensities of noncovalent interactions surrounding the molecules. This concept was introduced in 1988 with Comparative molecular field analysis (CoMFA). The steps to build a Molecular interaction field (MIF)-based 3-D QSAR model include training-set selection, alignment of molecules’ conformations, molecular interaction field (MIF) calculation, statistical model definition, model validation, and graphical interpretation. Three-dimensional quantitative structure-activity relationships uses robust chemometric methods such as partial least squares (PLS), G/PLS, and artificial neural networks (ANNs) to predict biological activities of ligands based on their three-dimensional properties. Three-dimensional quantitative structure-activity relationships [13, 14, 15] CoMFA was used to study ligand-receptor interactions in this study. Lennard-Jones and Coulomb potentials estimate steric and electrostatic properties in CoMFA.
Methods
There are many tools available for QSAR analysis. Open 3D-QSAR [16] was used for analysis for this research because of its ease of use and ability to generate reliable results. Steps include: (1) Py-MolEdit for compiling data sets by uploading molecules or direct drawing; (2) Py-ConfSerch for conformational analysis; (3) Py-Align for automatic molecular alignment; and (4) Py-CoMFA for building and validating 3-D QSAR models. Food and Drug administration drugs were identified and retrieved from drug bank, zinc database targeting beta catenin-Wnt pathway. The analysis was carried out on this platform using four applications, Py-MolEdit, Py-CoMFA Py-ConfSearch.
Py-MolEdit
Before working on the Py-MolEdit application, we downloaded 50 FDA-approved drug ligands from online databases like PubChem and ChemBL with their names and IC50 values. We employed “Add Multiple Molecules” to upload 50 3D structures from our dataset to the data set folder for this project. Using Py-MolEdit, the dataset chosen for analysis was added, where IC50 was selected as the activity standard type. The training set was the file with all 50 ligand structures (Table 1) (Fig. 1).
Training set shows FDA approved molecules
Training set shows FDA approved molecules
Alignment based on most active molecule.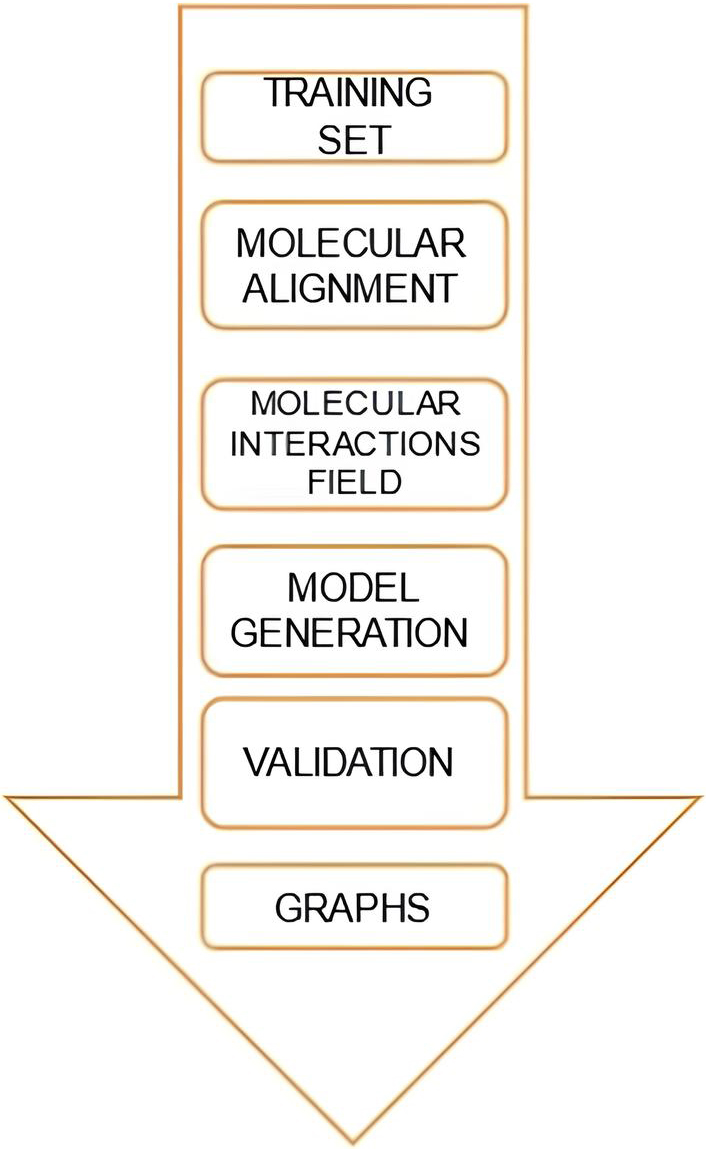
ConfSearch used the default configuration, the most common 3D-QSAR parameters on this platform. The balloon was used for conformer generation. This method builds conformers using 3D-Atomic Coordinates, distance topology. Only the conformations number and generations number were changed, which should be equal to or slightly less than the no. of molecules present in our dataset. They were kept at 49. Py-ConfSearch performed ligand-based (LB) conformation analysis on all compounds in this data set. With a family of conformations saved for every flexible molecule, its goal is to examine its conformational space and reveal its flexibility. It shows which molecule in our dataset is least effective, most active, largest, most elastic, most stiff, etc.
Py-Align
The aim is to try to impose (align) every molecule such that their atom identities and locations indicate field differences to create a good CoMFA model [17]. Each molecule’s conformation family’s individual single conformations were aligned using the Py-Align application. Py-Align provides 16 alignment algorithms, assuming each data set has several training sets, conformational analyses, and alignment complexes. The most active molecule was used to arrange the aligned dataset and molecules, and alignment was finished (Fig. 1).
Py-CoMFA
A 3D QSAR model for the matched training set was created by modifying the probe type, grid spacing, and minimal sigma minimax cutoff energy in Py-CoMFA module 70 [18, 19]. The following steps were taken to construct the model: The MIF (molecular interaction fields) were calculated after the aligned molecules were virtually placed in a grid with the appropriate dimensions. To test model robustness, cross-validation was done during construction. Additional random correlation tests can be done on the finished model. The whole data set was used to create PLS and models for the required number of extracted primary components. Using the results of our final QSAR, it opens a page for input.
Results
The screen r2 (Coefficient of multiple determinations) value and q2 (correlation coefficient) were obtained from generated maps. These values need to be less than 1, indicating a good and reliable model and models based on different no. Principal components were generated, and two new parameters were also calculated, Standard deviation in error calculation (SDEC) and Standard deviation in error prediction (SDEP) (Figs 2–7) [20]. An asterisk symbol could be seen in the table, indicating the best model. Changing the Model-Field gives us a Model individually based on the Steric and electrostatic field. We can also see the best model by taking both fields together [21]. Based on the observations of the graphs and our results, we selected the best model.
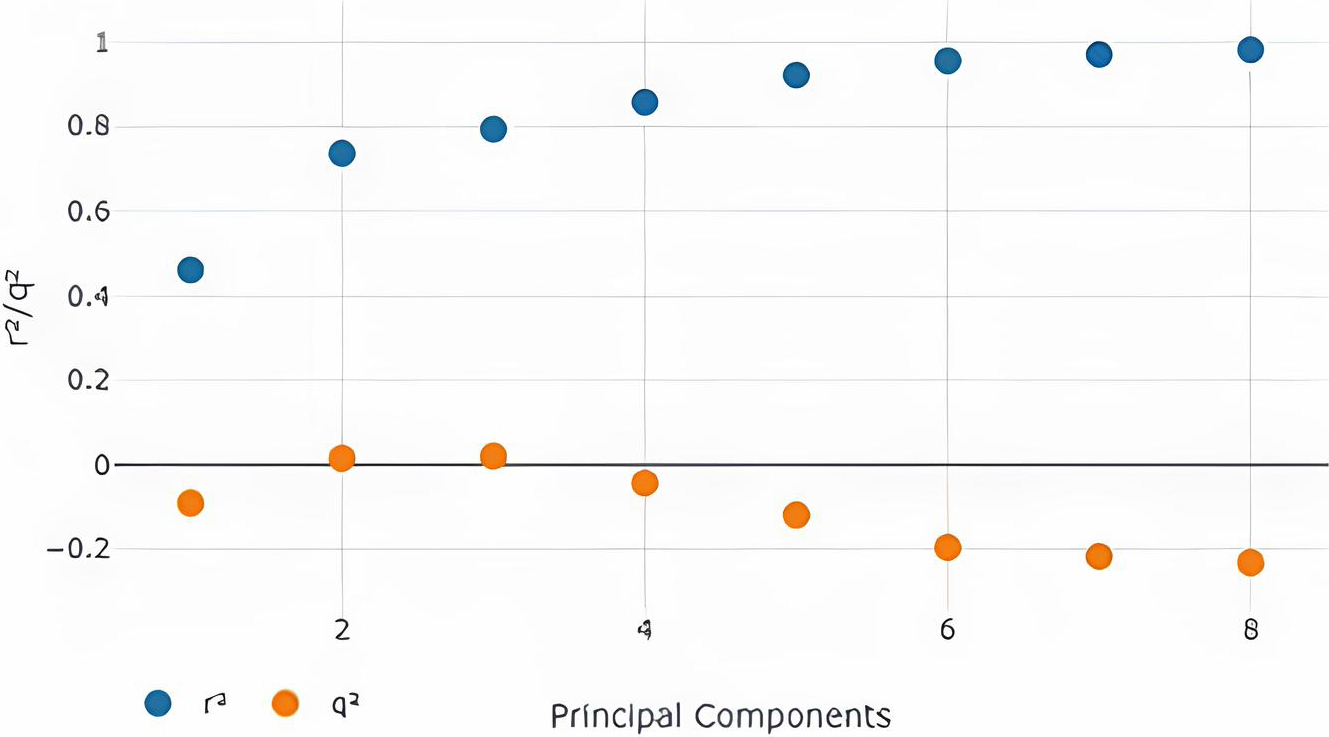
The best model (Table 2) was obtained with 3 Principal components (Fig. 2) with the Steric Model Field. It is, therefore, the optimal no. of components in our model.
Model with steric model field
Model with steric model field
SDEC/SDEP values with different no. of principal components with steric model-field.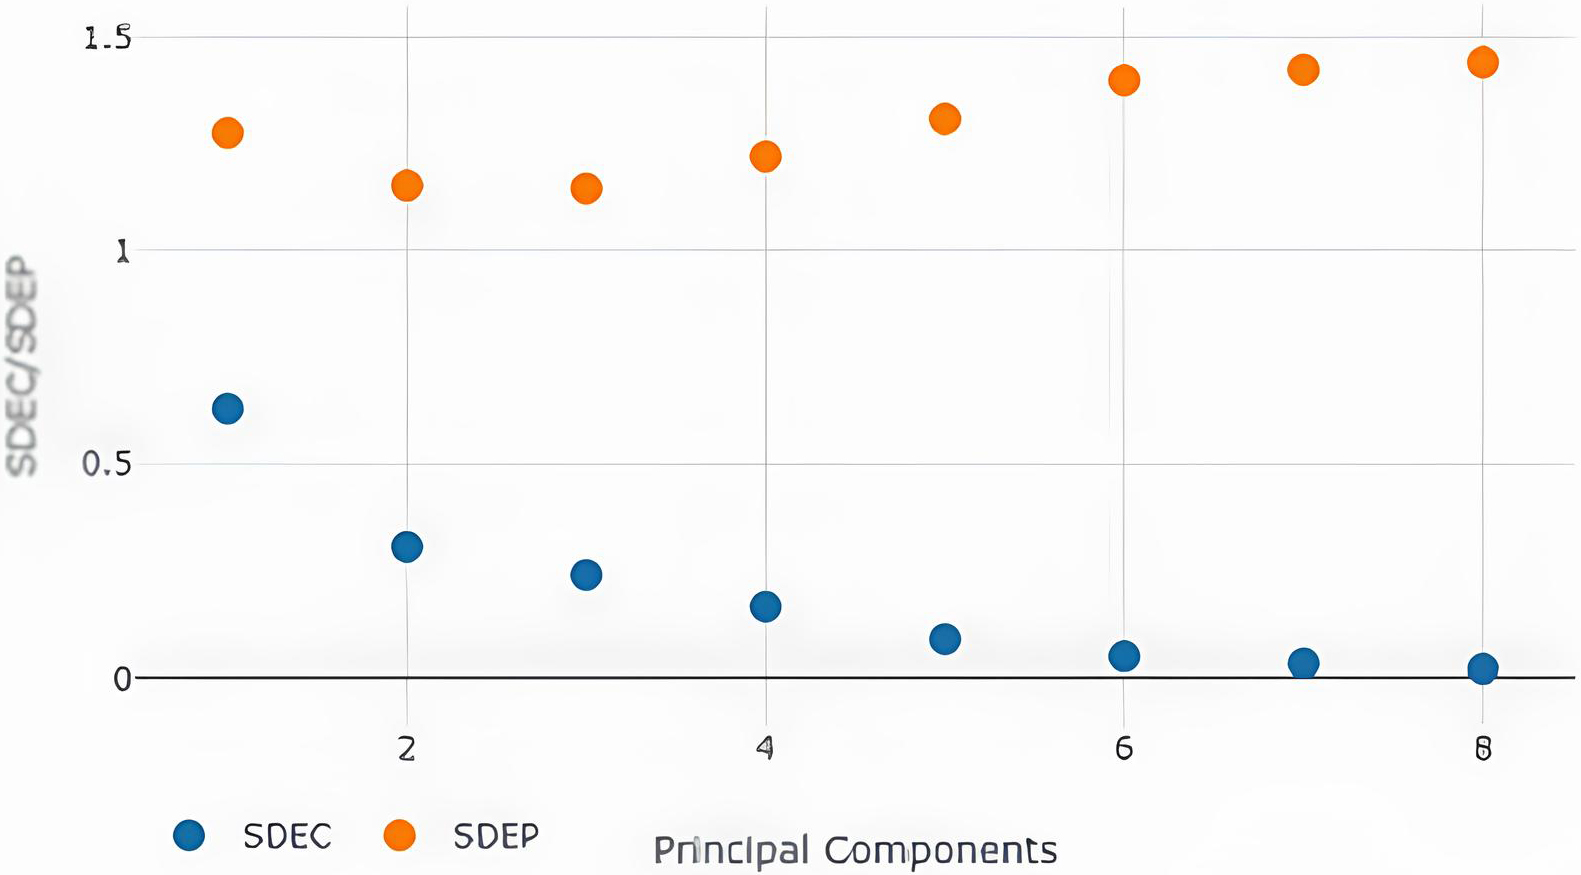
The best model (Table 2) at principal components three generated an
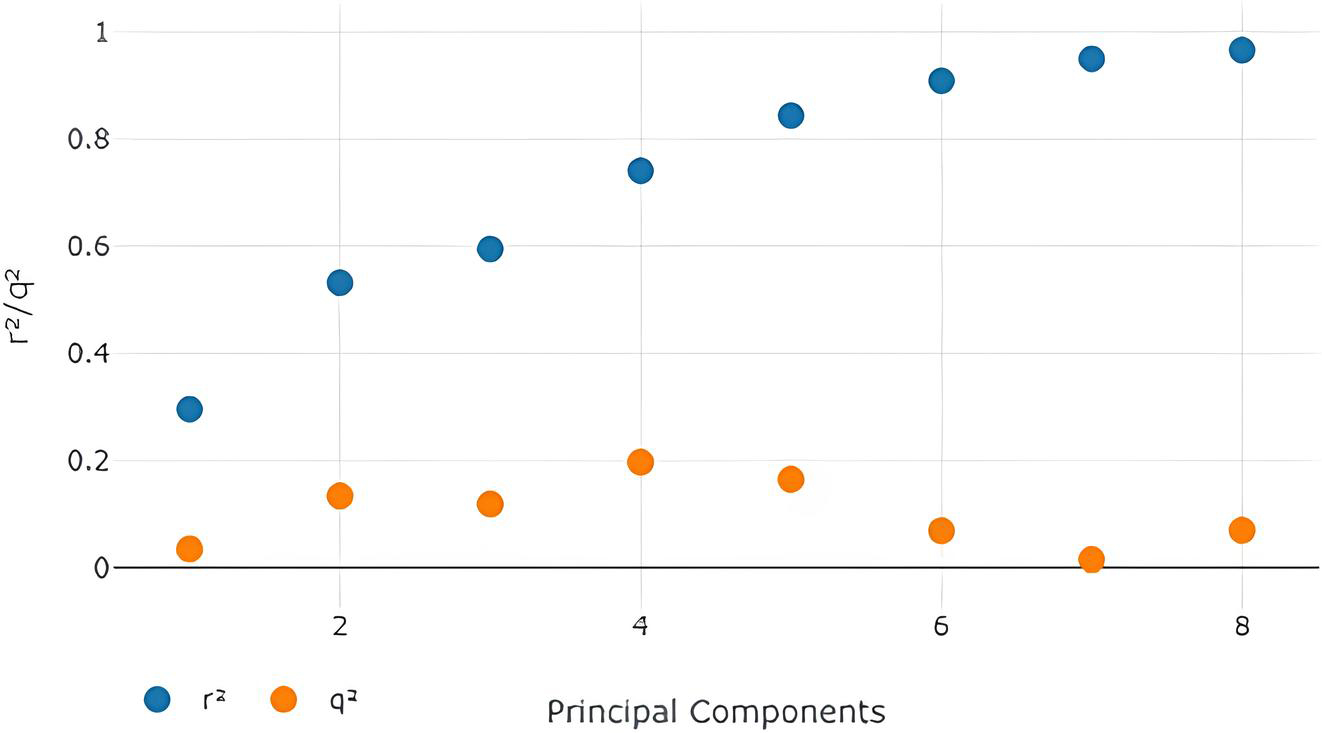
The best model (Table 3) was obtained with 2 Principal components with the electrostatic Model-Field. It is, therefore, the optimal no. of components in our model (Table 3).
Shows the electrostatic-model field
Shows the electrostatic-model field
SDEC/SDEP values with different no. of principal components with electrostatic model-field.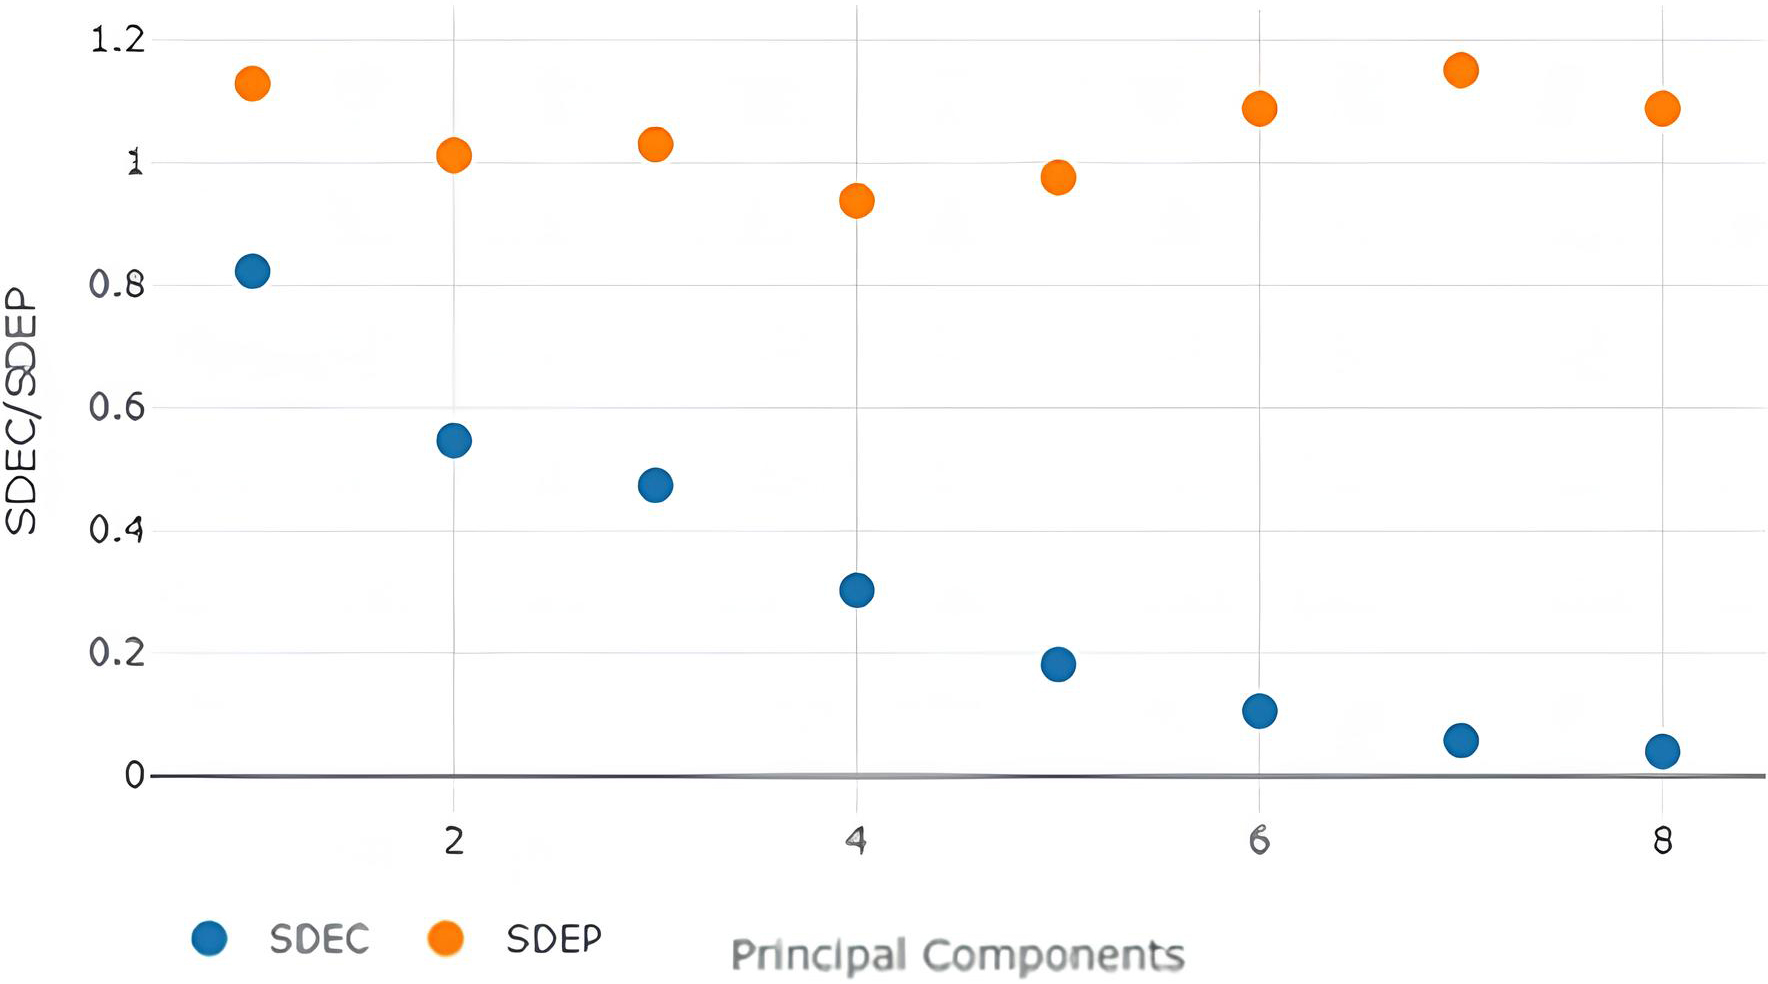
The best model at principal component two generated an
Shows the steric-electrostatic model
SDEC/SDEP values with different no. of principal components with steric-electrostatic model-field.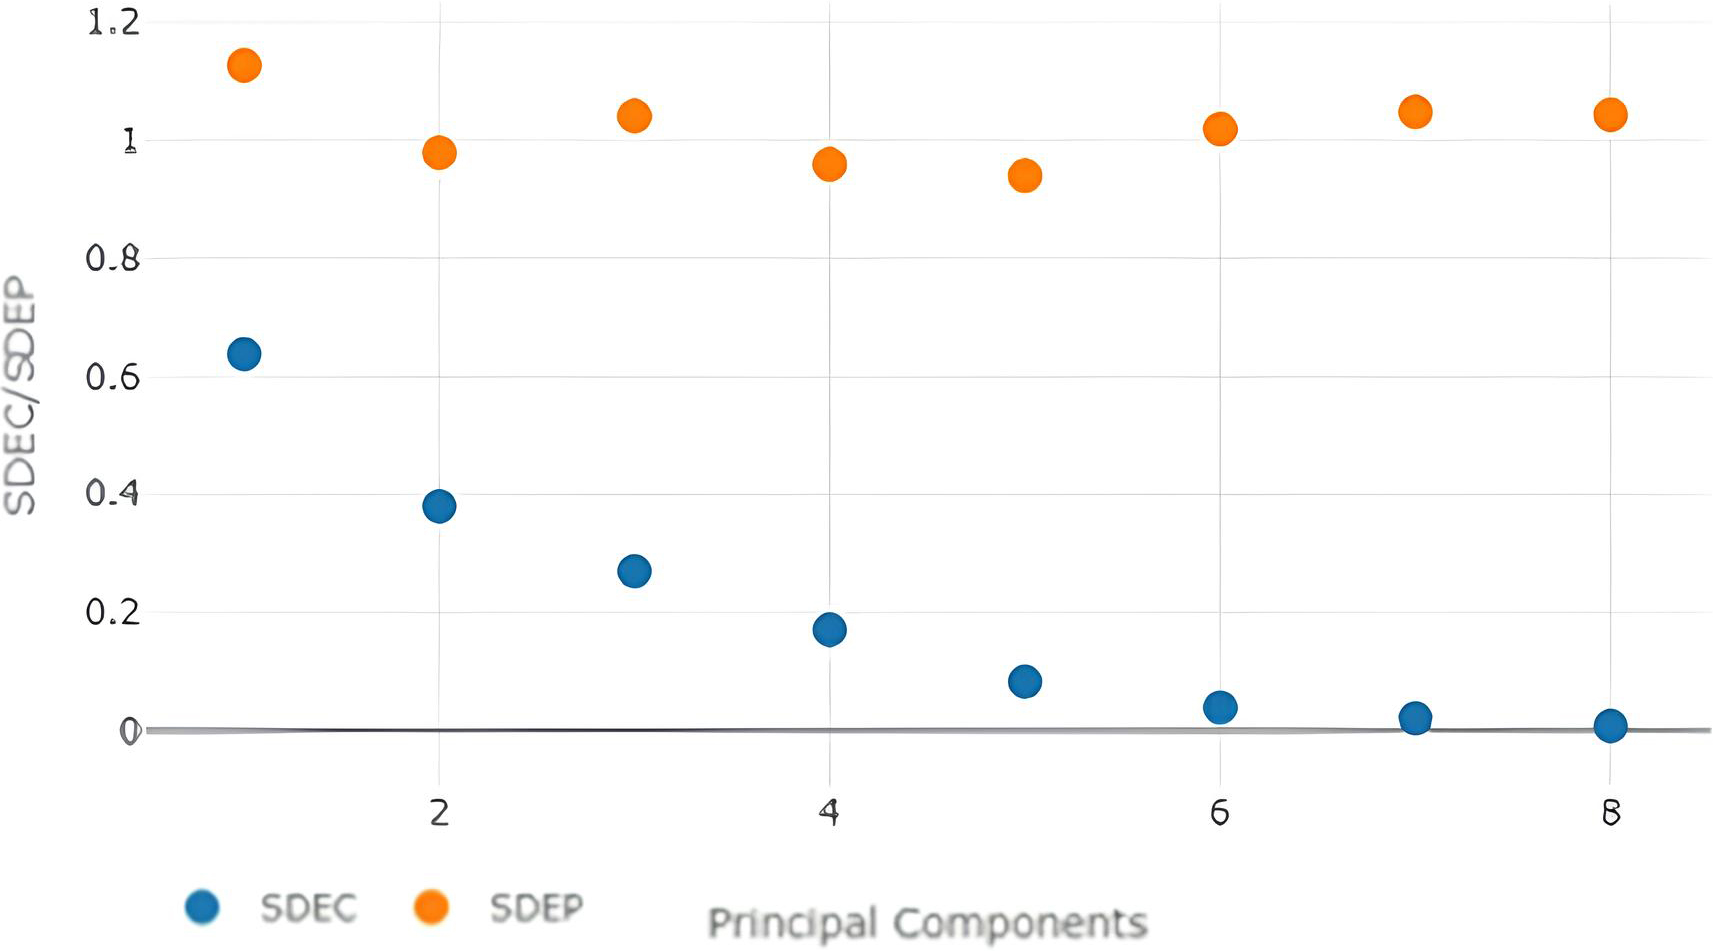
CoMFA steric contour map.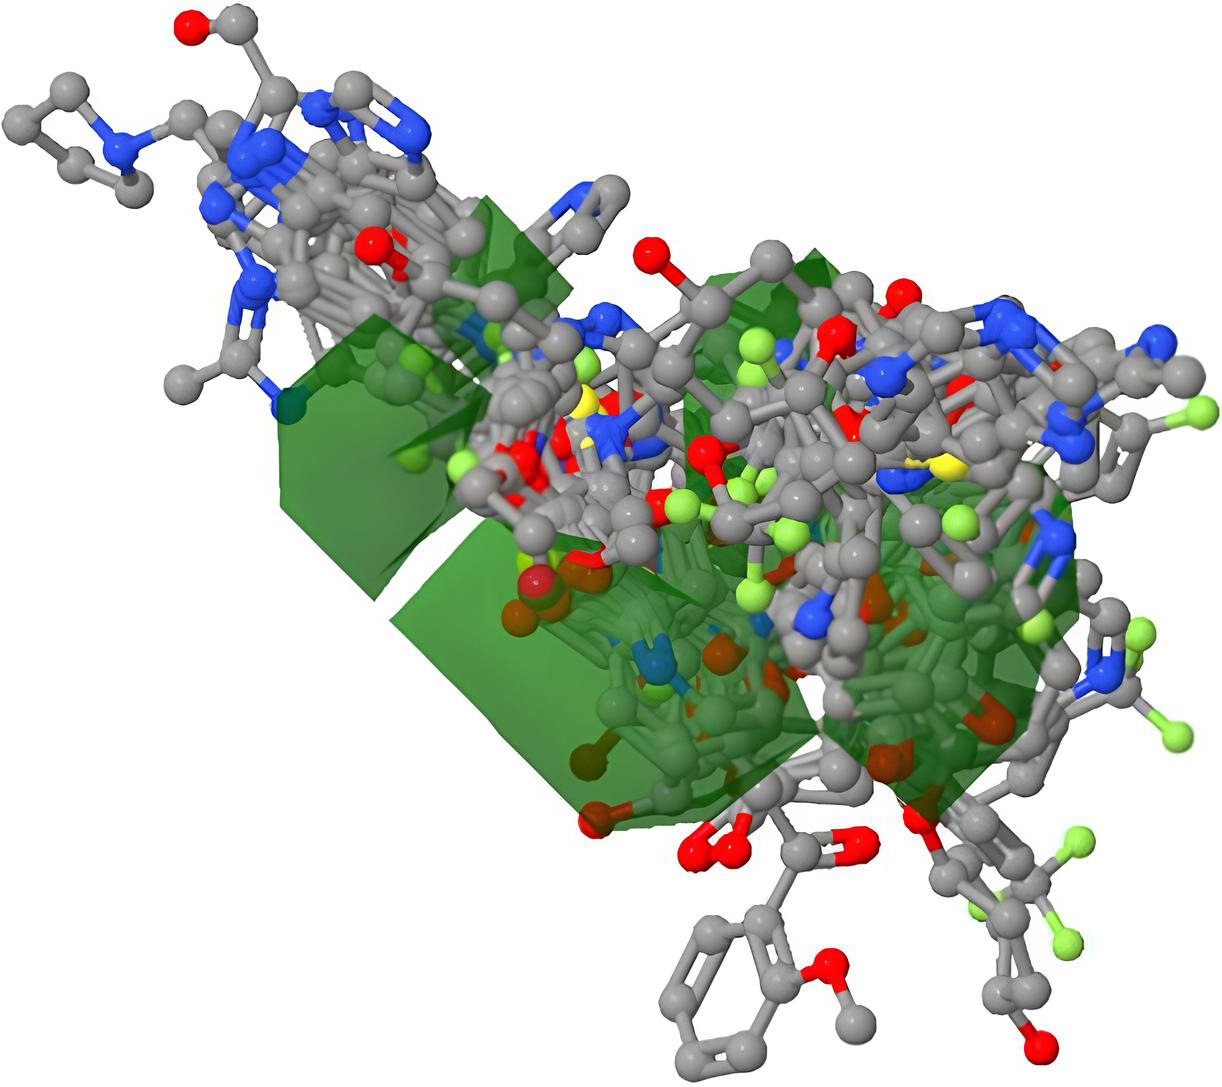
CoMFA electrostatic contour map.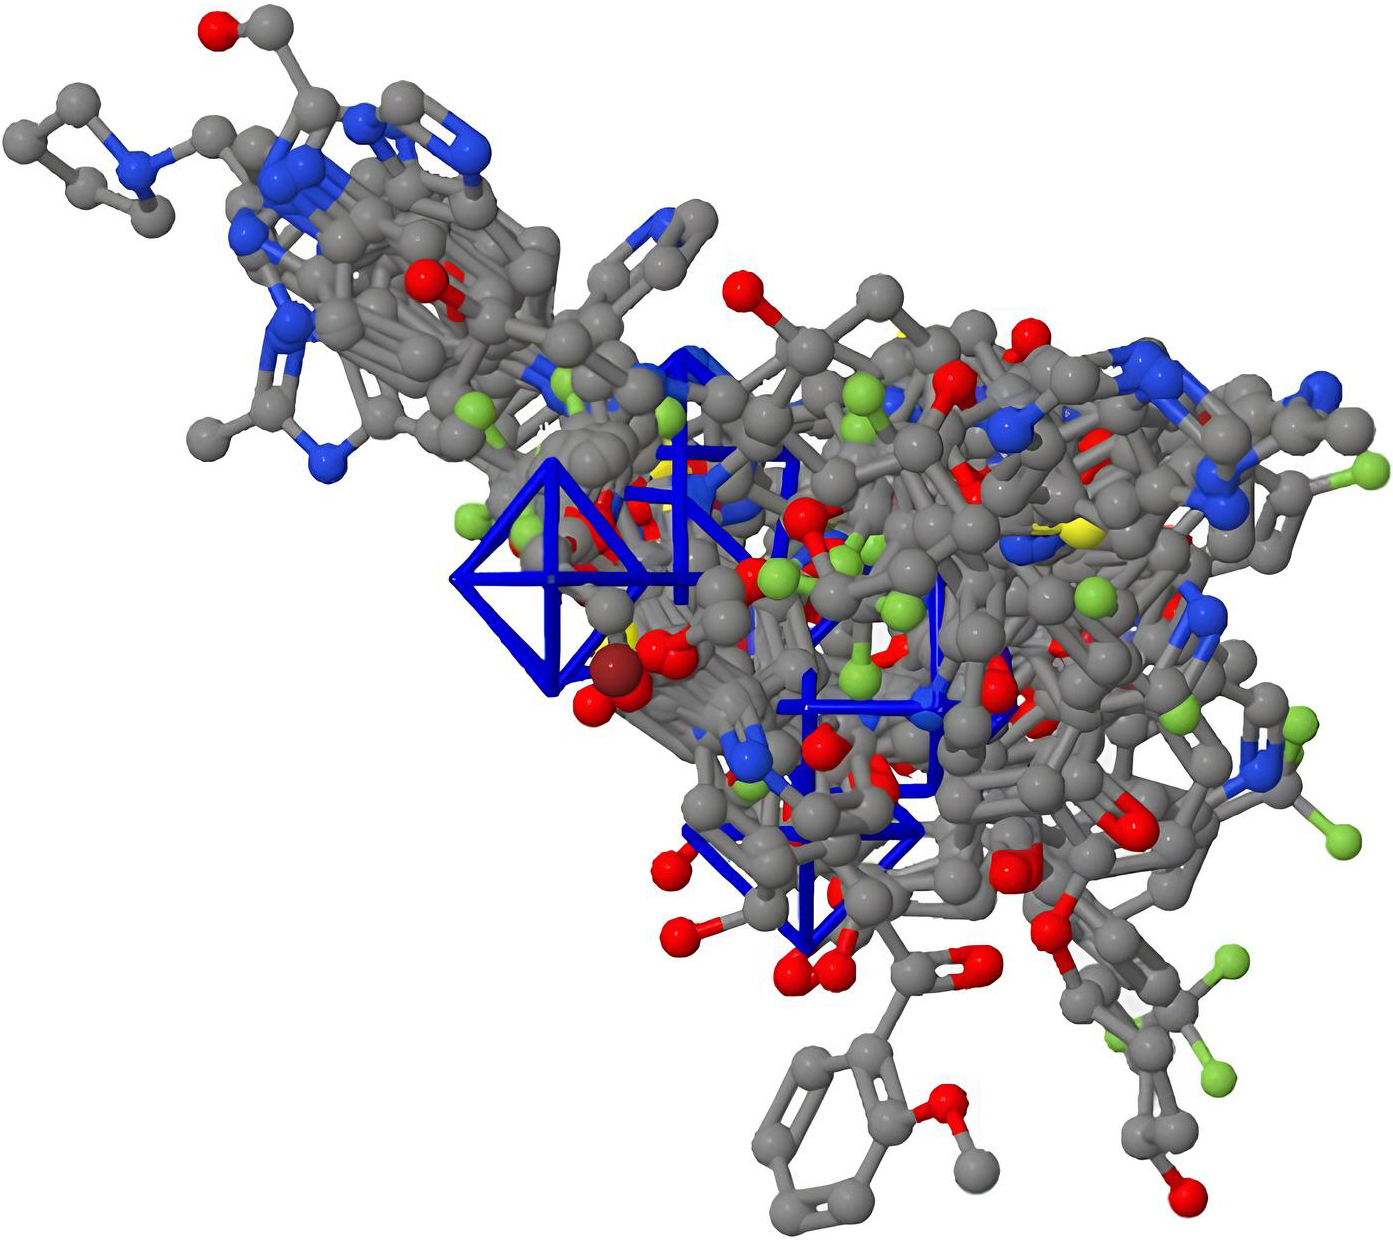
CoMFA steric-electrostatic contour map.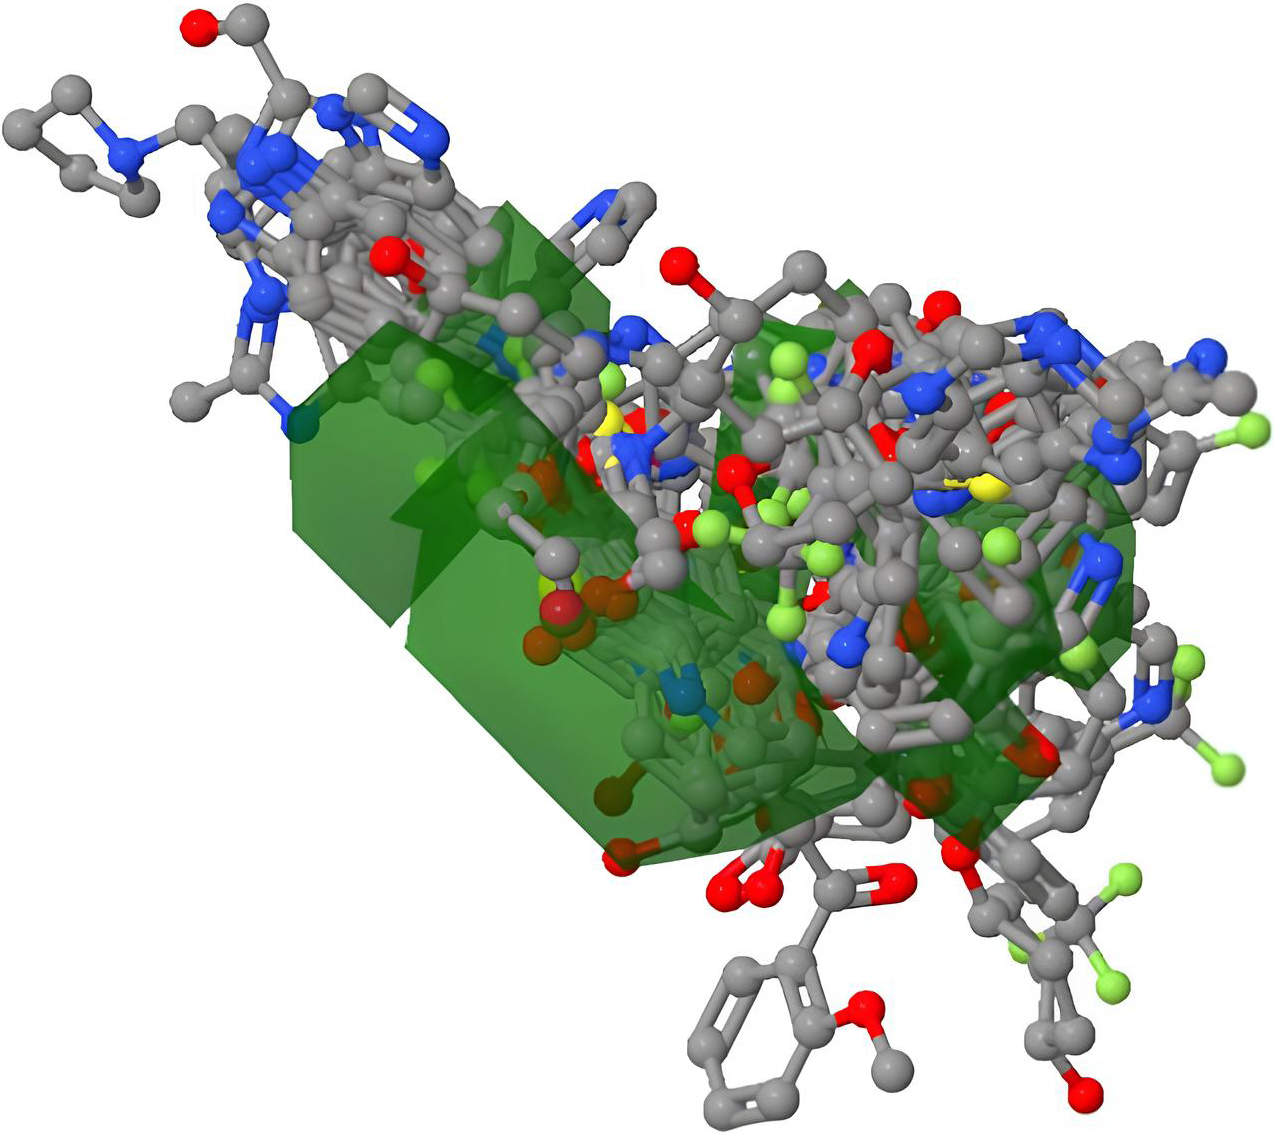
Shows 3D model of aligned molecules.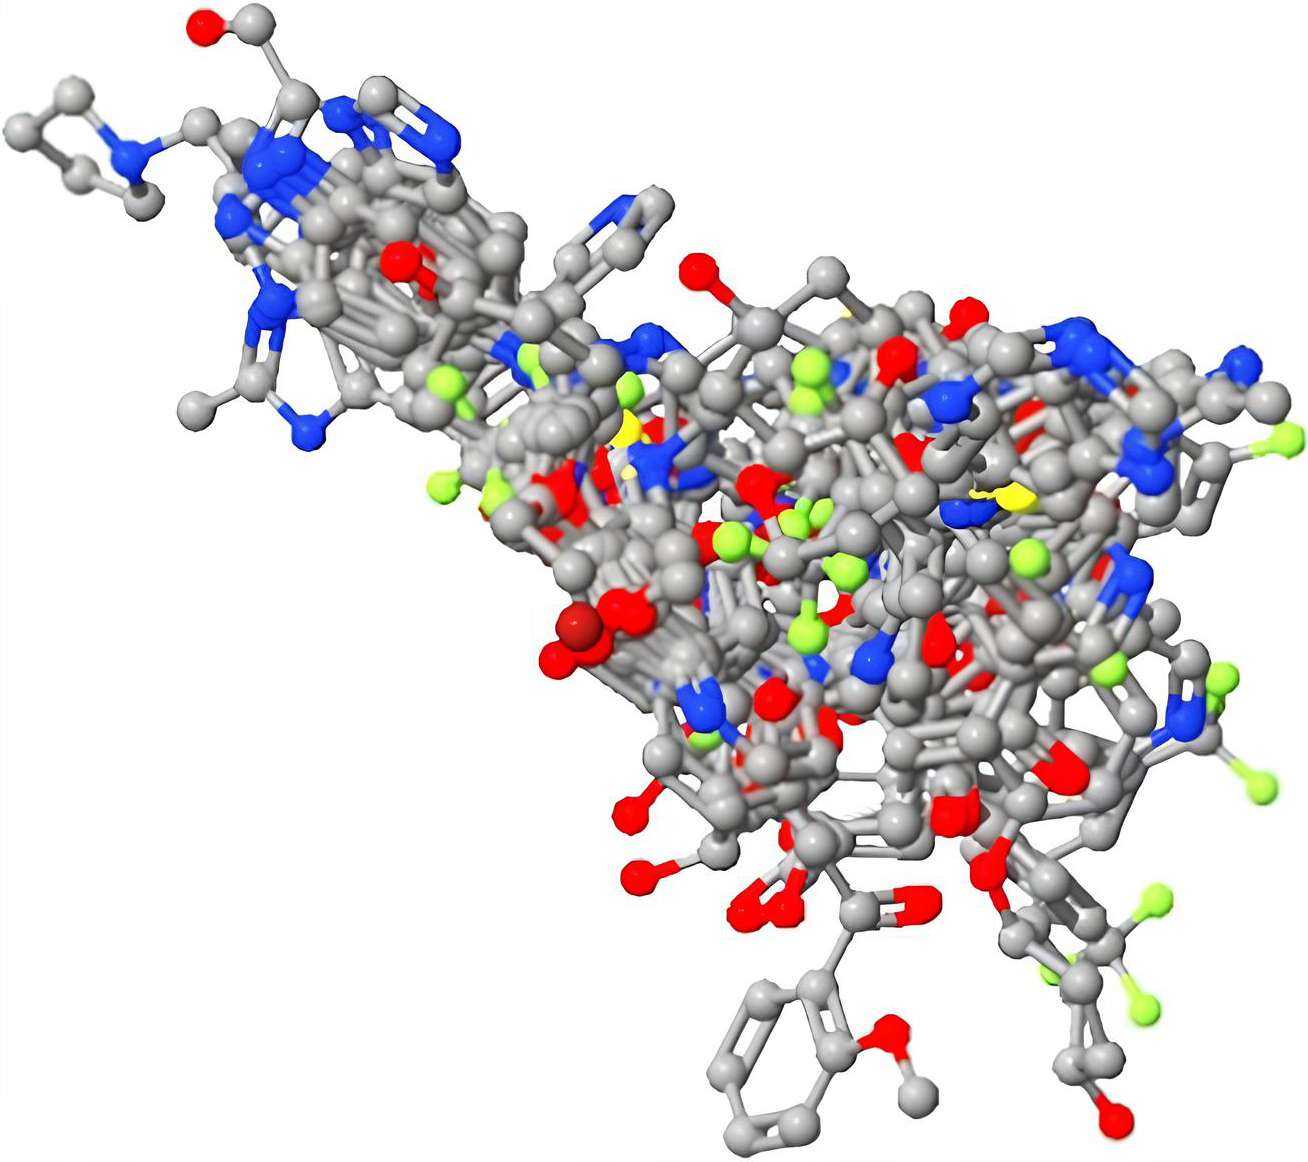
The best model (Table 3) was obtained with 2 Principal components with the Steric Model Field. It is, therefore, the optimal no. of components in our model.
The best model (Table 4) at principal component two generated an
After the model was created and verified, it was still possible to create and view the standard CoMFA 3-D map (Figs 8–11) within the Py-CoMFA application without the need for any additional software. The 3D QSAR model as a whole, as well as the MIF of each individual molecule, were created as polyhedron images. Selecting “View Dataset Contour Maps,” created 3D contour maps. First, we created a Steric field contour map for our molecules. Our reference molecule, the red atoms, was the most active, the blue atoms the least active, and the grey atoms the conformational changes produced by steric hindrance in these two molecules. The most active molecule is chosen, and its surroundings are completely sterile. Similar to how we combined the two fields to view contour maps based on electrostatic fields [17, 22].
Discussion
Quantitative Structure-Activity Relationship (QSAR) studies are crucial in drug design and development. They help predict the activity and selectivity of compounds against a target, allowing for lead optimization. Virtual screening filters out inactive compounds, guiding the design of safer drugs. QSAR models can predict toxicity, scaffold hopping, ADME/tox predictions, and structure-based drug design. They also help optimize drug-like properties and reduce the chances of failure in later stages. Combining QSAR with molecular docking or dynamics simulations can lead to the discovery of novel drug candidates with improved potency and selectivity. A 3D Quantitative Structure-Activity Relationship (QSAR) is a drug design technique that considers the three-dimensional structure of molecules and their interactions with target proteins. It offers four approaches: Ligand-Based, Receptor-Based, Atom-Based, and Field-Based. Ligand-Based QSAR aligns and superimposes compounds’ three-dimensional structures, calculates molecular descriptors, and predicts activity based on structural features. Receptor-Based QSAR uses target protein structure to predict binding affinity. Atom-Based QSAR assigns properties to individual atoms, and Field-Based QSAR generates molecular fields to predict compound activity. These methods offer a more accurate understanding of drug interactions and can improve potency and selectivity, especially in protein-ligand interactions. One previous study compared artificial neural networks and docking studies for predicting antimicrobial activity in new compounds. Two multilayer neural networks and docking studies were conducted, revealing improved antimicrobial activity in the new 2,2,5,5-tetramethyl-9-aryl derivative against Escherichia coli and Candida albicans strains.
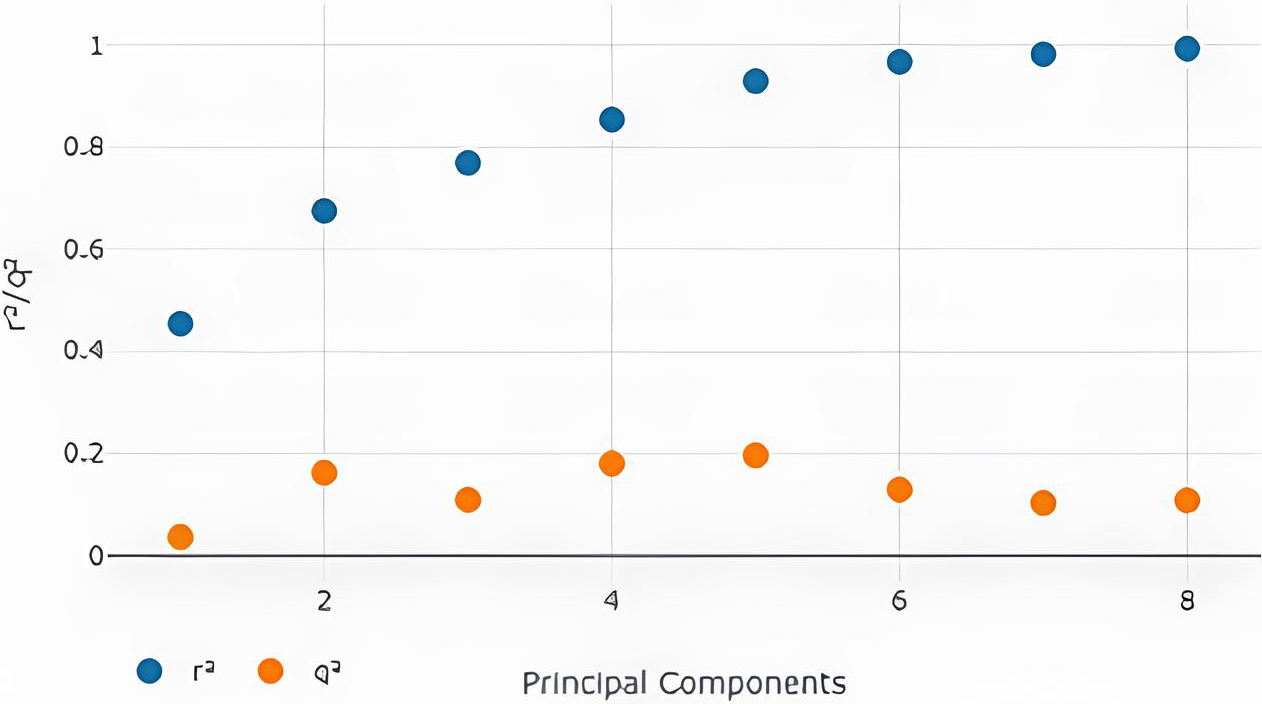
Three-Dimensional Quantitative Structure-Activity Relationship, also known as 3D QSAR, is a computational chemistry and drug development method for predicting the biological activity of compounds based on their three-dimensional structural characteristics. It is a development of the more established QSAR strategy, which takes into account two-dimensional molecular descriptors. When doing a 3D QSAR, molecules’ three-dimensional structures are taken into consideration to determine how their spatial configuration and electrostatic characteristics connect to their biological activity approved drugs were retrieved from pubchem and other sources and 3D QSAR model predicts unknown chemical functions using structure and alignment criteria. This resulting 3D QSAR model can be used to predict the biological activity or property of FDA approved molecules [23]. With the square correlation coefficient (r2) and cross-validated squared correlation coefficient (q2) of comparative molecular field analysis (CoMFA) being 0.675 and 0.162. Therefore, in this study an external test set was created in addition to the training set. External validation verified the model’s prediction ability. This functionality can be added to the 3D QSAR model by randomly selecting molecules from the test set in the data set container (Fig. 11). The study found a 3D QSAR model based on CoMFA with a r2 of 0.675 and q2 of 0.162, indicating reasonable predictive power. The model accurately predicted the biological activity of FDA-approved drugs for osteoporosis targeting sclerostin. An external test set was created to validate the model’s ability. The model’s robustness and applicability to real-world scenarios were evaluated using independent molecules. Overall, the 3D QSAR model is a valuable tool for drug design and development.
This 3d QSAR model will help in identifying FDA approved drugs prescribed for osteoporosis by targeting sclerostin.
Conclusion
3D-QSAR and CoMFA were utilized to develop statistically significant models with solid predictive potential for ligand inhibitory actions. This study may help develop better drugs and synthesize more powerful inhibitors for sclerostin using FDA approved drugs.
Ethical considerations
Considering a in silico nature of study, the ethical approval was waived by the approval of local ethics committee of Saveetha Dental college and Hospitals, Saveetha Institute of Medical and Technical Sciences.
Informed consent
Not Applicable.
Data availability statement
The data will be provided by the corresponding author on reasonable request.
Funding
No External funding.
Footnotes
Acknowledgments
None.
Conflict of interest
Authors declare no conflict of interest.