






Abstract
In order to improve the early warning effect of equipment abnormal state and shorten the early warning time, this paper designs an early warning method of laboratory equipment abnormal state based on the Internet of things and running big data. Collect the running status data of laboratory equipment in the environment of Internet of things, and implement dimension reduction processing on the collected running status data. After the dimensionality reduction, extract the abnormal characteristics of big data of laboratory equipment running. On the basis of iterative update, the real-time feature analysis results are compared with the abnormal feature set, and the early warning response program is started according to the abnormal. According to the experimental results, the maximum false alarm rate of this method is only 1.34%, and the abnormal state response is always kept below 4.0 s when applied, which fully proves that this method effectively realizes the design expectation.
Keywords
Introduction
With the wide application of intelligent laboratory, the number of high-level equipment and equipment in the laboratory is also increasing. The use of artificial intelligence technology to optimize the management of laboratory equipment can improve the efficiency of the use of laboratory equipment, and also greatly promote the regular management and operation of the laboratory [11,13]. The rapid development of modern industry has raised the performance requirements of equipment. Experimental instruments and equipment tend to be automated and intelligent. However, once the experimental equipment breaks down, it will cause huge economic losses. It is very necessary to give early warning to the abnormal state of laboratory equipment. Under the background of the continuous development of science and technology, the early warning method of abnormal state of laboratory equipment came into being [2,4].
In order to accurately warn the abnormal state of laboratory equipment, many scholars have carried out research and achieved certain results. Reference [10] proposes a safety warning method for laboratory equipment based on optical fiber communication. Based on the analysis of the research status of laboratory safety early warning, this method uses optical fiber communication technology to construct the laboratory equipment operation information communication module, and collects the equipment status data in real time. Then the abnormal data is detected and recognized by pattern recognition technology. Reference [6] proposes a method of equipment state early warning based on robust state estimation. In this method, the equipment state early warning model is constructed by improving the Auto Association regression equation, and the stability of the early warning model is improved by using the Mahalanobis distance operator. Then, the distance division is completed by clustering to realize the extraction of the equipment variable interval state. Then, the four fold cross validation learning process is used to obtain the state early warning results through iterative optimization in the training. Reference [8] proposes an abnormal operation state identification method based on multi classification support vector machine for large-scale experimental equipment. On the basis of eliminating statistical interference, this method extracts the optimal parameters of equipment state characteristics. Then, the kernel function is used to map the optimal parameters into the kernel space, and the time-frequency plane is established. Then, the training and self-learning results of the multi classification support vector machine are used as the identification criteria of the abnormal state of the equipment, and the abnormal state identification factors are combined to realize the identification and early warning of the abnormal operating state of the equipment.
However, in practical application, it is found that the above traditional methods still have some deficiencies in the false alarm rate and abnormal state response. To solve this problem, this research designs a early warning method of abnormal state of laboratory equipment based on Internet of things and running big data. The originality of this method lies in the accurate collection of the operating state data of laboratory equipment through the Internet of Things, and the abnormal state pre-warning through processing the big data of operating state, which can reduce the false alarm rate on the basis of shortening the pre-warning time. The specific research process is as follows:
First, ZigBee is used as a communication tool, and the coordinator, routing node, data acquisition node and data acquisition server are used to establish the IOT acquisition unit to collect the running state data of laboratory equipment. For the collected data, the dimensionality of the data is reduced by dimensionality reduction processing, which saves unnecessary feature extraction overhead while removing the noise information in the data, thus reducing the time complexity.
Secondly, the abnormal characteristics of big data of laboratory equipment running are extracted from the data after dimensionality reduction. Considering the influence of different features on the running state of laboratory equipment, the compensation distance evaluation algorithm is used to optimize the features, and the abnormal feature set is obtained.
Finally, on the basis of iterative updating, the real-time feature analysis results are compared with the anomaly feature set, and the anomaly index is used to express the deviation degree between the output feature and the anomaly feature. The larger the index is, the more likely the laboratory equipment is to be abnormal, so as to start the early warning response procedure.
Data collection of running status of collection laboratory equipment in the environment of Internet of things
This study uses the Internet of things environment to collect the running state data of laboratory equipment before warning the abnormal state of laboratory equipment. In the Internet of things environment, ZigBee is used as a communication tool, using coordinator, routing node, data acquisition node and data acquisition server component acquisition unit. Its structure is shown in Fig. 1.
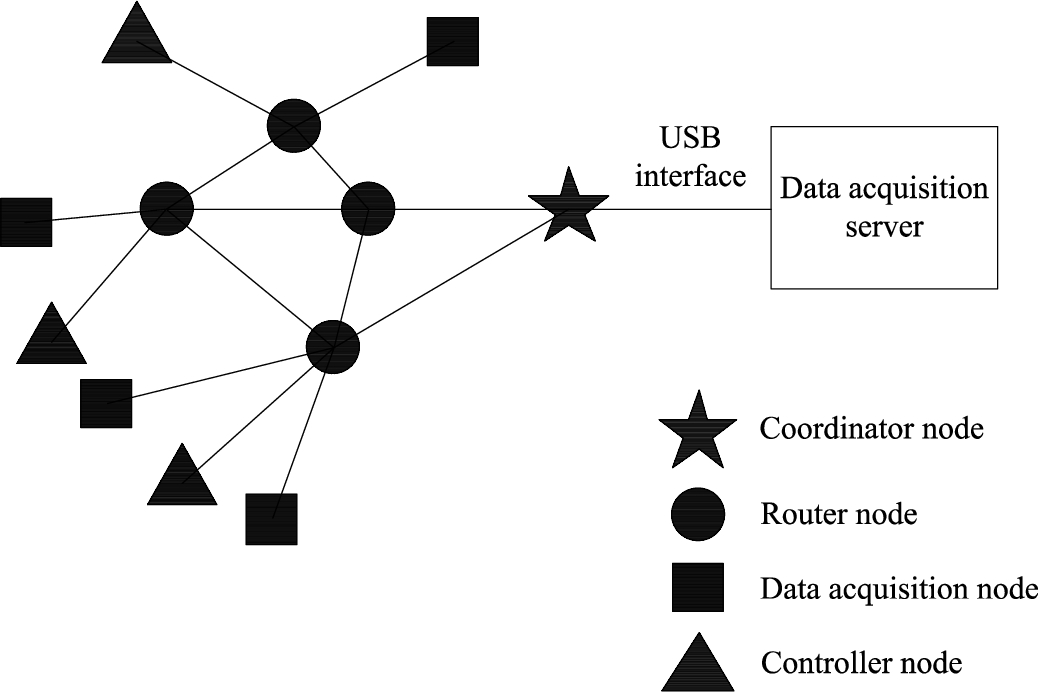
Structure diagram of data acquisition unit for running status of laboratory equipment in the environment of Internet of things.
In Fig. 1, the whole acquisition unit is composed of a ZigBee coordinator, multiple ZigBee routing nodes and control nodes. The data acquisition server uses USB interface to form data interconnection with the coordinator. Each acquisition node sends the collected laboratory equipment running status data to the coordinator and transmits it to the ring acquisition management host via USB interface.
In the Internet of things environment, it is assumed that the rate at which node r collects the running state data of laboratory equipment is v. When dynamic node u arrives near static node r, its rate of data transmission to r is
Since there are homogeneous nodes in the Internet of things, the data cache length is set to D. In the process of data transfer from node u to node r, the remaining data in the cache area is the laboratory equipment running status data to be collected [3], namely:
Where,
At this stage, the more mature methods of data dimensionality reduction mainly include principal component analysis, linear discriminant analysis, multidimensional scaling analysis and local tangent space arrangement [1,9]. Among them, local tangent space alignment (LTSA) has a wide range of applications. LTSA achieves the goal of overall dimensionality reduction by mapping the sample points of the data set to the local tangent space.
As a typical nonlinear manifold learning algorithm, LTSA also has the unique neighborhood data dependency of this kind of algorithm. In the process of dimensionality reduction of big data running in laboratory equipment, data will be actively aggregated due to the neighborhood data dependency. This aggregation reaction limits the spatial mapping range of data and conflicts with the dimensionality reduction process [5,7]. At this time, we need to use the k-nearest neighbor method to separate the aggregated data in time to eliminate the dimension reduction interference caused by the neighborhood data dependency.
LTSA’s dimensionality reduction processing steps for laboratory equipment running big data are as follows: first, use the list algorithm to convert the laboratory equipment running big data into data set sample points under high-dimensional embedded coordinates, and then use the local tangent space arrangement method to map all data set sample points to the low-dimensional local tangent space [14]. Spatial data is actively aggregated under the action of neighborhood data dependency. In order to prevent this from happening, local tangent space is combined with k-nearest neighbor method to eliminate the aggregation phenomenon. The expression of list algorithm is as follows:
Where, ∂ represents the list constant, and N represents the large amount of data running in the laboratory equipment involved in the transformation, ε represents the conversion rate of data, and e represents the conversion error of data.
The expression of local tangent space arrangement method is as follows:
Where, δ represents the local tangent space permutation constant,
The process of eliminating polymerization by k-nearest neighbor method is as follows:
Where, μ represents k-adjacency constant, σ represents the elimination coefficient of polymerization phenomenon, and
Combined with the aggregation data separation process of k-nearest neighbor method, the mapping distribution of sample points in the local tangent space is obtained, as shown in Fig. 2.
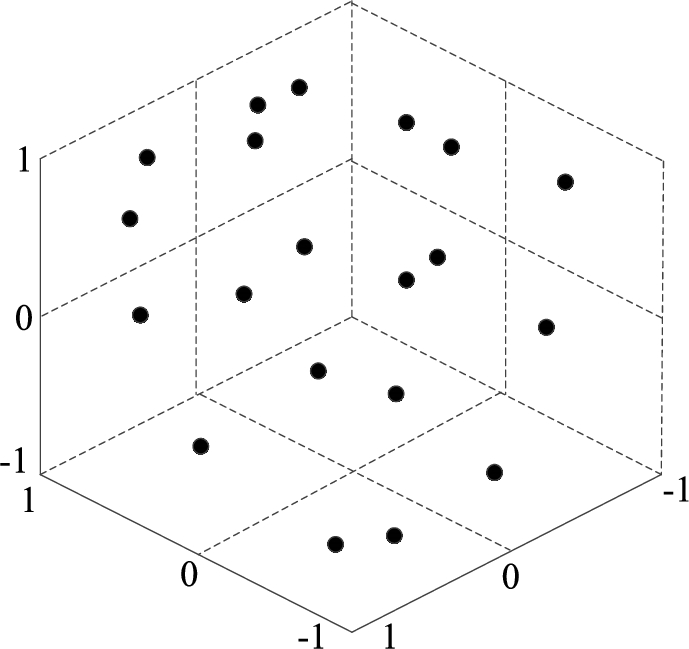
Mapping distribution of sample points of dataset in locally tangent space.
On this basis, in the low dimensional local tangent space, the dimension reduction processing of the big data of laboratory equipment running is completed according to the Euclidean principle. The process is as follows:
Where, O represents Euclidean constant,
On the basis of collecting the running data of laboratory equipment, the dimensionality of data is reduced by dimensionality reduction, that is, the running data of laboratory equipment in high-dimensional space is mapped to low-dimensional space in the form of mapping. Through the data dimensionality reduction processing, not only the noise information in the data can be removed, but also the unnecessary cost of feature extraction can be saved, thus reducing the time complexity.
Based on the above collected big data of laboratory equipment running and dimensionality reduction processing results, carry out early warning of abnormal state of laboratory equipment.
Wavelet transform is one of the important ways to extract the big data characteristics of laboratory equipment [15]. In this study, taking the vibration state of laboratory equipment as an example, the time-frequency information of dynamic acceleration of equipment can be obtained by wavelet transform processing the vibration acceleration signal of laboratory equipment. This signal is discrete. The discrete wavelet transform expression of vibration acceleration signal of laboratory equipment is as follows:
Where,
In the process of wavelet decomposition of the characteristics of the vibration acceleration signal of laboratory equipment, only the low-frequency part of the vibration acceleration signal is decomposed, and the high-frequency part of the signal is retained, so as to obtain the high-frequency coefficient and low-frequency coefficient of the vibration acceleration signal of laboratory equipment. Then calculate the sample entropy of the high-frequency coefficient, and the obtained sample entropy is the characteristics of the vibration acceleration signal of the laboratory equipment.
On this basis, the compensation distance evaluation algorithm is used to optimize the vibration acceleration signal characteristics of laboratory equipment. In the process of processing, we need to fully consider the impact of different characteristics on the running state of laboratory equipment, and screen out the sensitive characteristics.
Assume that the running state of laboratory equipment contains a feature set
Step 1: calculate the distance of all feature vectors in the characteristic sample set of laboratory equipment running status, and the expression is as follows:
After obtaining the average value of all eigenvector distances, obtain the average in class distance of the operating state characteristics of laboratory equipment:
Step 2: calculate the variance factor of the average intra class distance, and the process is as follows:
Step 3: obtain the compensation factor expression of vibration acceleration signal characteristics of laboratory equipment as follows:
Step 4: normalization processing φ. The evaluation expression for obtaining the compensation distance is as follows:
Where, γ represents the normalization coefficient.
It can be seen from the above analysis that the higher the h value, the easier it is to distinguish the obtained state characteristics of laboratory equipment. Therefore, for all the state sensitive features, the compensation distance evaluation factor h is used to construct the optimal feature set
When warning the abnormal state of laboratory equipment, input the abnormal characteristic data of laboratory equipment running state in the training and learning model, and then output the approximate value of local outlier factor of data points after training and learning. If there are differences between the calculated results and the expected results, the basic data need to be updated and supplemented. The new training process is as follows:
Step 1: calculate the error between the expected output and the actual output. For the abnormal feature set
Step 2: back propagation in the training process. Suppose the feature fusion layer j in the training and learning model, the output information of this layer is J, and its calculation process is as follows:
Where, ω represents the weight, b represents the offset, and f represents the activation function.
Step 3: update parameters. The random gradient descent method is selected to update the hierarchical learning parameters, and the process is as follows:
Where, φ represents the adjustment coefficient. In this way, the parameters of the training and learning process are updated.
Step 4: compare the obtained output features with the abnormal feature set
Where, t represents the monitoring time, μ represents the smoothing coefficient, ϑ represents local outliers. Judge whether the laboratory equipment is in an abnormal state according to the abnormal index Z. If it is in an abnormal state, start the early warning response procedure and send an early warning signal.
To sum up, the design of laboratory equipment abnormal state early warning method based on Internet of things and running big data is completed, and the specific process is shown in Fig. 3.
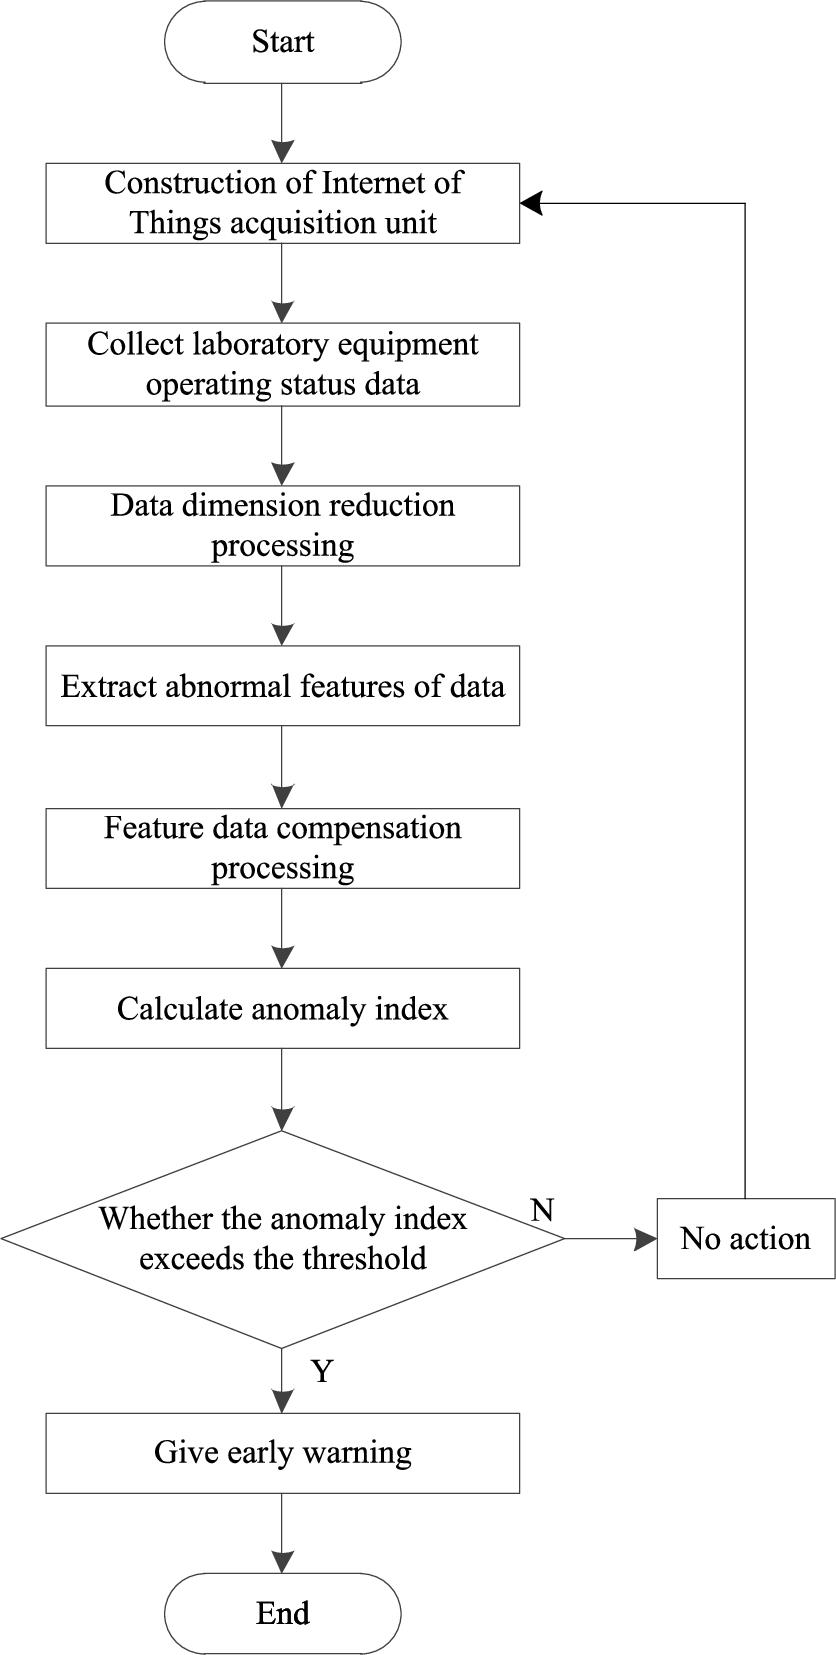
Early warning process of abnormal state of laboratory equipment.
In order to verify the practical application performance of the above designed laboratory equipment abnormal state early warning method based on the Internet of things and running big data, the following experiments are designed.
Experimental data
The experimental analysis tool is matlab R2019. Taking the Mechanical Engineering Laboratory of a university as the operating environment, the abnormal state of the internal toothed bearing test-bed is warned. The test-bed is a bearing system driven by a motor. The number of sampling nodes for equipment status information is 1200, and the management and scheduling load is 400. Before verification, the time domain waveform of vibration acceleration collected during the running of the test bench is shown in Fig. 4.
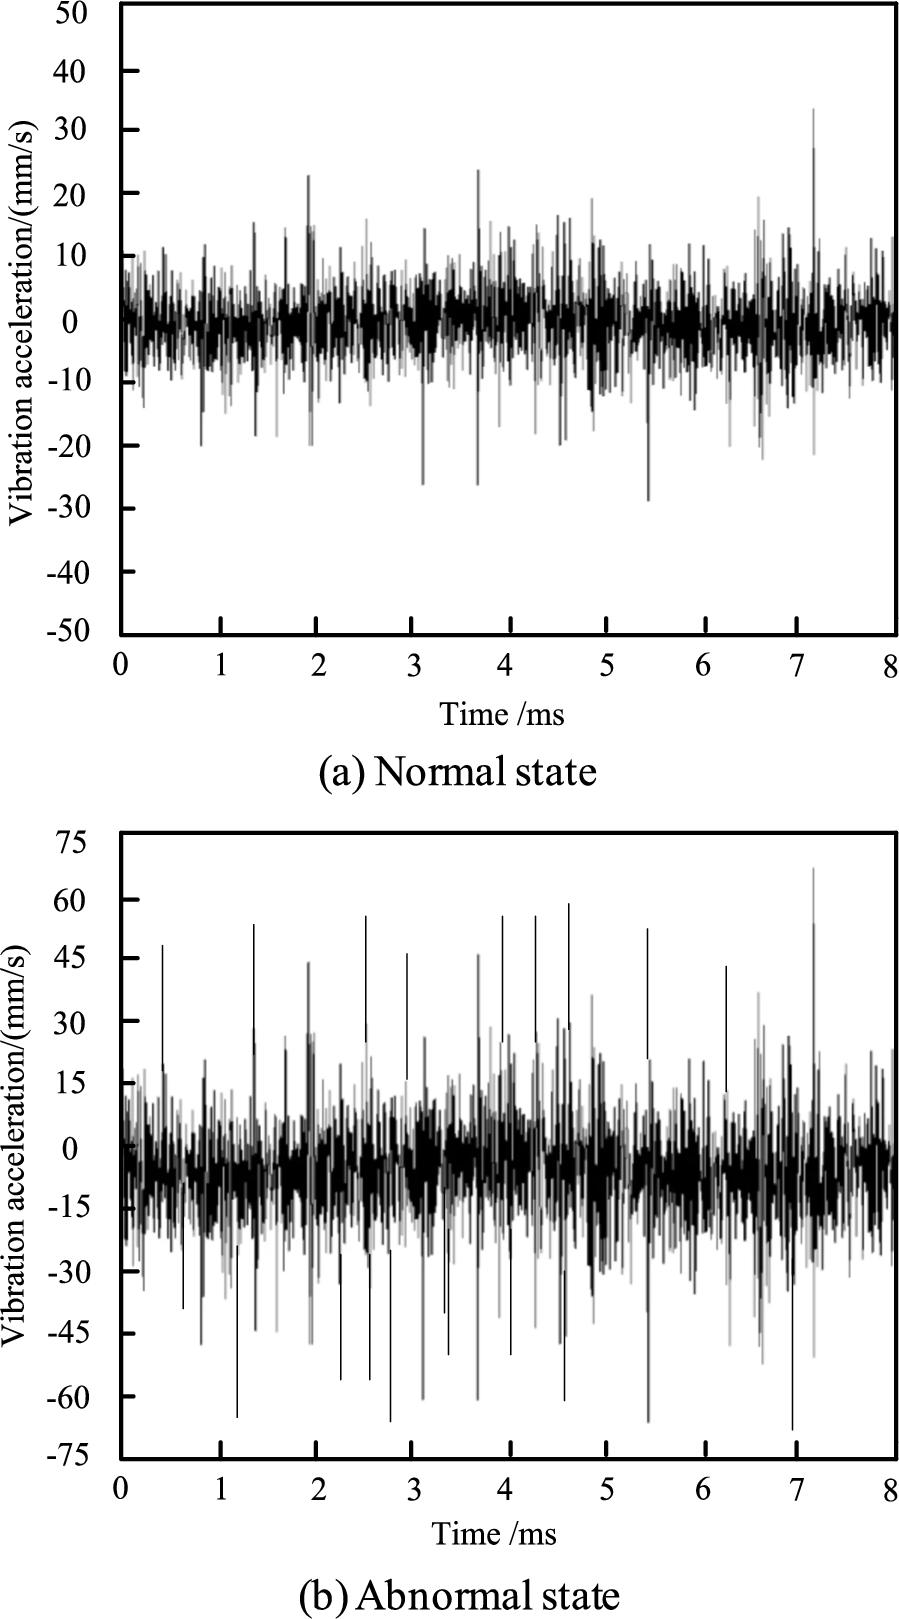
Time domain waveform of vibration acceleration of test-bed.
It can be seen from Fig. 4 that there is a significant difference in the time domain waveform of vibration acceleration when the test bench operates in normal and abnormal states. The experimental results shown in Fig. 4 show that it is highly effective to select the vibration acceleration as the feature of the evaluation equipment.
In the experiment, in order to avoid too single experimental results, the equipment state early warning method based on robust state estimation (method of reference [6]) and the equipment abnormal running state identification method based on multi classification support vector machine (method of reference [8]) were compared to complete the performance verification together with the method of this paper. Different methods are used to analyze the vibration acceleration of the internal gear bearing test-bed. After analysis, the performance of different methods is verified by taking the false alarm rate and the application time of abnormal state response as indicators.
First, test the false alarm rate of different methods, and the results are shown in Table 1.
False alarm rate test results of different methods
False alarm rate test results of different methods
By analyzing the data in Table 1, it can be seen that after the application of method of this paper, although the value of false alarm rate has always maintained a continuous upward trend, the increase is small, and the overall data is low. During the experiment, the maximum false alarm rate of method of this paper is only 1.34%. However, after applying the two traditional methods, the false alarm rate increases significantly. The maximum false alarm rate of method of reference [8] is 8.49%, while the maximum false alarm rate of method of reference [6] reaches 16.56%. From the perspective of limit value, the method of this paper has a more reliable warning effect.
Then verify that the abnormal state of different methods affects the application, and the results are shown in Fig. 5.
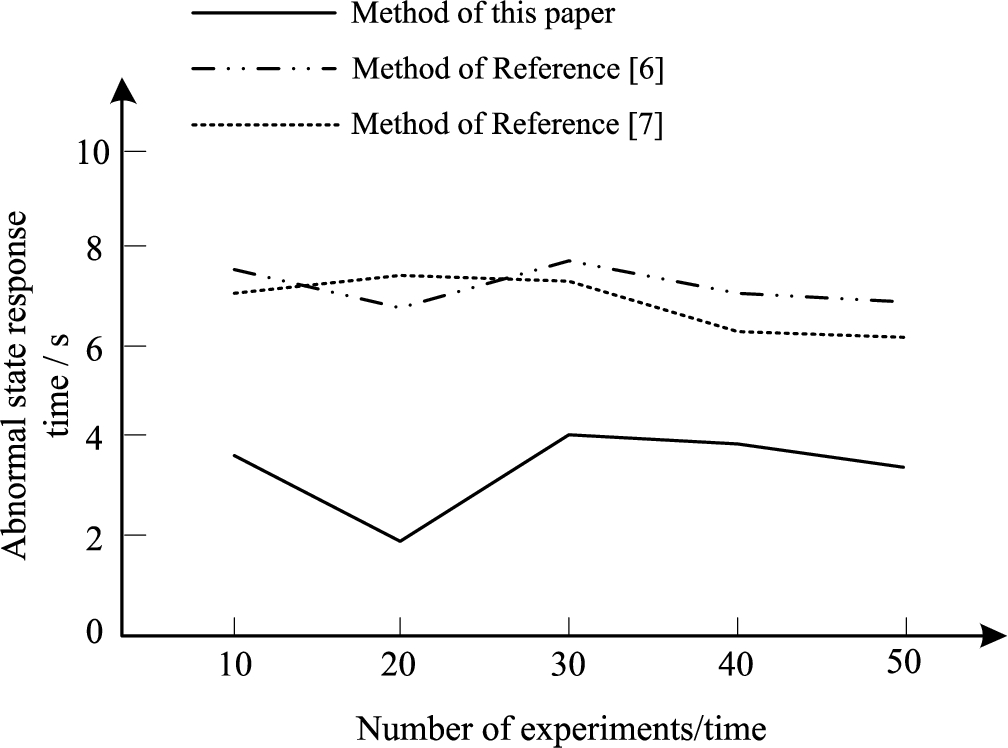
Comparison of application time of abnormal state response of different methods.
According to the results shown in Fig. 5, as the number of experiments increases, the abnormal state response of different methods also changes when applied. The abnormal state of method of reference [8] rises first and then decreases when it is applied, and the global maximum value is 7.4 s. The abnormal state of method of reference [8] fluctuates frequently when it is applied, and the global maximum value is 7.7 s. In contrast, the abnormal state of method of this paper is less responsive to application, and always remains below 4.0 s, indicating that method of this paper has higher timeliness and can give early warning of abnormal state of laboratory equipment in a short time.
To sum up, after the application of method of this paper, the maximum false alarm rate of laboratory equipment abnormal state early warning results is only 1.34%, and the abnormal state response is always kept below 4.0 s, which fully proves that method of this paper has high application advantages.
In order to improve the safety of equipment running, this paper designs an abnormal state early warning method of laboratory equipment based on the Internet of things and running big data. The performance of the method is verified from both theoretical and experimental aspects. This method has a low false alarm rate and abnormal state response when it is used in laboratory equipment abnormal state early warning. Specifically, compared with the early warning method based on robust state estimation, the false alarm rate of method of this paper is significantly reduced, and the maximum value is only 1.34%; Compared with the early warning method based on multi classification support vector machine, the application time of the abnormal state response of method of this paper is significantly shortened, and the longest time is no more than 4.0 s. Therefore, it fully shows that the proposed early warning method based on the Internet of things and running big data can better meet the requirements of abnormal state detection of laboratory equipment.
Footnotes
Acknowledgements
This paper is supported by the industry and Education Cooperation project of the Ministry of Education in 2019 ‘Teaching Content and Curriculum System Construction of Business Intelligence Analysis’ (Number: 201901104008); Topics of the 13th five year plan for the development of philosophy and Social Sciences in Guangzhou in 2020 ‘Research on the application of blockchain technology in supply chain financial risk aversion of Guangzhou Science and technology small and medium-sized enterprises’ (Number: 2020GZGJ293); Special fund for science and technology innovation strategy of Guangdong Province in 2020 (special fund for ‘climbing plan’) ‘Research on the path of high-quality development to help smart e-commerce service platform – Taking the small program’ not asking for people ‘as the platform’ (Number: pdjh2020b0696).