
Abstract
Alzheimer’s disease (AD), a neurodegenerative disorder, is the most common cause of dementia and continuing cognitive deficits. Since there are more cases each year, AD has grown to be a serious social and public health issue. Early detection of the diagnosis of Alzheimer’s and dementia disease is crucial, as is giving them the right care. The importance of early AD diagnosis has recently received a lot of attention. The patient cannot receive a timely diagnosis since the present methods of diagnosing AD take so long and are so expensive. That’s why we created a brand-new AD detection method that has four steps of operation: pre-processing, feature extraction, feature selection, and AD detection. During the pre-processing stage, the input data is pre-processed using an improved data normalization method. Following the pre-processing, these pre-processed data will go through a feature extraction procedure where features including statistical, enhanced entropy-based and mutual information-based features will be extracted. The appropriate features will be chosen from these extracted characteristics using the enhanced Chi-square technique. Based on the selected features, a hybrid model will be used in this study to detect AD. This hybrid model combines classifiers like Long Short Term Memory (LSTM) and Deep Maxout neural networks, and the weight parameters of LSTM and Deep Maxout will be optimized by the Self Updated Shuffled Shepherd Optimization Algorithm (SUSSOA). Our Proposed SUSSOA-based method’s statistical analysis of best values such as 57%, 53%, 28%, 25%, and 21% is higher than the other models like SSO, BMO, HGS, BRO, BES, and ISSO respectively.
Keywords
Introduction
A neurodegenerative illness known as Alzheimer’s disease (AD) causes b-amyloid peptide (Ab), and neurofibrillary tangles, including neuronal degeneration to accumulate in the brain tissues over time [7]. Additionally, it affects mental and memory processes [6,33]. There are currently no effective treatments for AD, and those that are available simply slow or stop it from progressing. Because of this, managing and halting the progression of AD requires early detection. Numerous genes as well as pathways perform crucial functions in the treatment of AD and the detection use of biomarkers. The gene that has undergone the biggest shift is PDHA1, which is a target gene for the treatment of AD. The primary morphological differences of brain structures addressed for a prompt and precise AD diagnosis include the size of the ventricles, the form of the hippocampus, the cortical thickness, as well as the volume of the brain [19,24,36]. A little medial subcortical brain area called the hippocampus seems to be important for both short- and long-term memory [13].
Mild Cognitive Impairment (MCI) is a term used to describe people who are in the early stages of Alzheimer’s disease (AD), whereas not every MCI patients go on to acquire AD. MCI is indeed a stage between normal as well as AD when an individual has subtle cognitive abnormalities that are visible to them and their relatives but who is still capable to carry out daily tasks. The existence of relevant genes inside a person’s genome & personal history is indeed the two biggest risk indicators for AD. A medical assessment and an in-depth discussion with the patients as well as their relatives serve as the foundation for an AD diagnosis. However, an autopsy has been required to provide a “ground truth” diagnosis of AD, that isn’t clinically important [8,15].
Detecting AD is often challenging as clear manifestations often don’t appear until several years after onset. Current forms of AD diagnosis are both time-consuming and expensive, which might explain why almost half of those living with AD do not receive a timely diagnosis [5,23]. Many neuroimaging techniques have been developed for exploiting brain functions and structures, such as diffusion tensor imaging, electroencephalography, magnetic resonance spectroscopy, and magnetic resonance imaging (MRI) [17,35].
Recently, MRI has become increasingly popular in studying brain nerve connections. MRI has shown tremendous promise as one type of well-developed brain imaging technology in providing detailed information for the diagnosis of high-level neurological disorders, such as depression and schizophrenia. Rapid developments in neuroscience and machine learning (ML) are widely used for automatic pattern recognition of clinical image data [25,27,30].
Detecting AD is difficult, and successful classification calls for a strong ability to discriminate certain features among similar brain image patterns [14]. Recently, several deep neural strategies for diagnosing AD were developed, and they function more effectively than traditional machine learning techniques. However, the majority of the already available computer-aided diagnostic algorithms ignored the medical and biological data of the patients and instead utilized neuroimaging characteristics for diagnosis. Because of this, the AD diagnosis has been inaccurate. The conventional methods of AD diagnosis have certain issues: AD does not receive a timely diagnosis. Although the implementation in DA appears straightforward, tweaking also requires parametric quantity. Therefore, the traditional methods are also not very effective. In order to overcome these issues and speed up execution, this research proposes a unique optimization strategy based on a feature selection. This strategy determines the constraints such as reduced error, computational time (complexity), and accurate AD detection. As a consequence, we created a novel and accurate AD detection technique that offers the following contributions.
To provide an efficient and accurate AD detection, we have developed a novel method with the hybridization of classifies such as LSTM and Deep Maxout neural network.
To provide better quicker data execution we have developed improved data normalization in our work.
In addition to statistical and mutual information-based features, we applied improved entropy-based features to achieve an accurate classification.
An improved chi-square test is developed in this work, which reduces the computational time by an effective feature selection.
In order to maximize the detection accuracy and reduce the error rating by tuning the weight parameter of neural networks, we have developed a Self Updated Shuffled Shepherd Optimization Algorithm (SUSSOA).
The following describes how this paper gets structured: Section 2 mentions specific literary works that are relatable to AD detection, Section 3 elaborates on the thorough operation of our proposed AD detection approach, Section 4 presents our work’s implementation outcomes, and Section 5, about the work’s conclusion, following that references are provided for this work.
Literature survey
The following is a description of a few recent types of research that are associated with AD diagnosis.
Deep learning (DL) was utilized by JananiVenugopalan et al. [31] to comprehensively examine imaging, and genetics, including clinical testing, sets & categorize people into MCI, AD, as well as controls (CN). Diagnostic as well as genomic information was utilized to retrieve features, whereas imaging data were processed employing 3D-convolutional neural networks (CNNs) plus stacked noise removal auto-encoders. To find the best-performing features that the neural nets using clustering, as well as perturbation assessment, learned a new data interpreting technique was also created.
Junghyun Koo et al. [21] have used a neural network and a modest database to recognize Alzheimer’s disease utilizing several multi-modal characteristics taken via pre-trained networks. A redesigned CRNN-based architecture was combined with those multi-modal characteristics to handle categorization as well as regression operations at the same time and thus is able to compute talks of varying lengths. The test findings beat the baseline by 18.75%, while the validation outcome for the regression problem reveals the potential of categorizing four types of cognitive disability having an accuracy of 78.70%.
Weiming Lin et al. [22] created a paradigm for AD multi-label assessment using a linear discriminant analysis (LDA) score technique to most economically integrate multimodal information. Pre-processing of positron emission tomography MR imaging, cerebrospinal fluid biomarkers, as well as genetic characteristics, began with age adjustment, and extraction of features, including feature reductions. They are then separately rated with LDA to determine the ratings that reflect the AD pathogenic progression in multiple modalities. Ultimately, utilizing these scores, an extreme learning machine-dependent decision tree was created to do multi-label diagnosis.
Qi Ying et al. [37] suggested a novel multi-modal DNN for Alzheimer’s illness assessment that combines both MRI as well as SNPs. The SNP branch serves to strengthen the effectiveness of the imaging branch whenever the prognosis confidence was poor. This concept is based on clinical practice, which dictates that if a healthcare professional is unsure about their choice, more tests are typically requested to aid in the decision-making process. Findings suggest that when every patient has both MRI as well as SNP data; the suggested methodology enhances Alzheimer’s diagnostic effectiveness to 93.5% AUC & 96.1% AP, correspondingly.
To recognize Alzheimer’s disease, Ning Wang et al. [32] established a modular multimodal strategy that employs four topologies that use CNN as well as multi-head attention just on the ADReSSo Trial training set. This approach makes use of 3 distinct characteristic sets: acoustic characteristics, linguistic, as well as embeddings. Some architecture only utilizes the acoustical characteristics, some only employ the linguistic features, some only employ the embeddings, and others incorporate all of those aspects.
A Multimodal Alzheimer’s Disease Diagnostic paradigm (MADDi) was published by Michal Golovanevsky et al. [18] to reliably identify the existence of AD including moderate cognitive impairment (MCI) via neuroimaging, genetic, as well as medical information. Cross-modal attention, which records communication amongst modalities, is indeed a novel feature of MADDi. Therefore, multi-class categorization was used, a difficult undertaking gave the close resemblances between MCI as well as AD.
Silvia Basaia et al. [10] used MRI data to construct a Deep Learning scheme to diagnose Alzheimer’s disease (AD) including moderate cognitive impairment. CNN had been performed on MRI scans, as well as its performance in differentiating AD, c-MCI, as well as s-MCI was evaluated. All classes demonstrated excellent rates of accuracy, only with the best rates attained in the AD vs HC categorization tests utilizing both the ADNI as well as the merged ADNI + non-ADNI datasets.
Abul Basher et al. [11] proposed a method that blends a CNN paradigm with a deep neural network (DNN) architecture. The left, as well as right hippocampi, were independently localized employing a 2-step ensemble Hough-CNN. The pre-processed 2-D patches are utilized to retrieve volumetric data out of each slice via a discrete volume estimating CNN (DVE-CNN) framework. The gathered volumetric characteristics were employed to train and evaluate the categorization network. Table 1 shows A review of recent literature on the diagnosis of AD
Sharma et al. [29] proposed a hybrid-based AI-based model that combines permutation-based machine learning (ML) voting classifier and transfer learning (TL) in terms of two fundamental stages. Two TL-based models, DenseNet-121 and DenseNet-201, are used in the first phase of implementation for extracting features, and three different ML classifiers, SVM, Nave base, and XGBoost, are used in the second phase for classification.
Balaji et al. [9] suggested a hybrid Deep Learning Approach. Magnetic resonance imaging (MRI), positron emission tomography (PET), and conventional neuropsychological test results are combined in a strategy for early AD identification utilizing multimodal imaging and Convolution Neural Network with the Long Short-Term Memory technique.
A review of recent literature on the diagnosis of AD
A review of recent literature on the diagnosis of AD
According to the review results, the previously existing methods for AD diagnosis have some shortcomings like reduced accuracy, lesser effort, simulation environment was complicated, impossible to isolate the possibility and specific parts are not visible, and so on. This article is driven to address the aforementioned issues with the extant models. Thus we have created a Self Updated Shuffled Shepherd Optimization Algorithm to adjust the weight parameter of neural networks in order to increase detection accuracy and decrease error rating (SUSSOA). The specifics of our suggested strategy are described in depth in the next section.
Alzheimer’s disease (AD) is indeed a neurological condition that can lead to dementia as well as other mental health issues in people. According to reports, there aren’t any recognized drugs or therapies which can stop or stop the spread of AD. As a consequence, it’s crucial to identify AD early on and create a treatment strategy to halt its development. We have developed a novel AD detection method that includes four working stages. In the initial pre-processing stage the input data get normalized by improved data normalization, for quicker and better detection. These pre-processed data get subjected to feature extraction where features such as statistical, Improved entropy-based, and mutual information-based features are extracted. An improved chi-square technique is developed in this work in order to provide an effective feature selection. In the final stage, the hybridization of classifiers including LSTM and Deep Maxout Networks was used in this stage for accurate AD detection and the parameter tuning of these classifiers was conducted by using SUSSOA, which is an improved form of Shuffled Shepherd Optimization Algorithm (SSOA). Figure 1 shows The architecture of our proposed SUSSOA-based AD detection has given below.
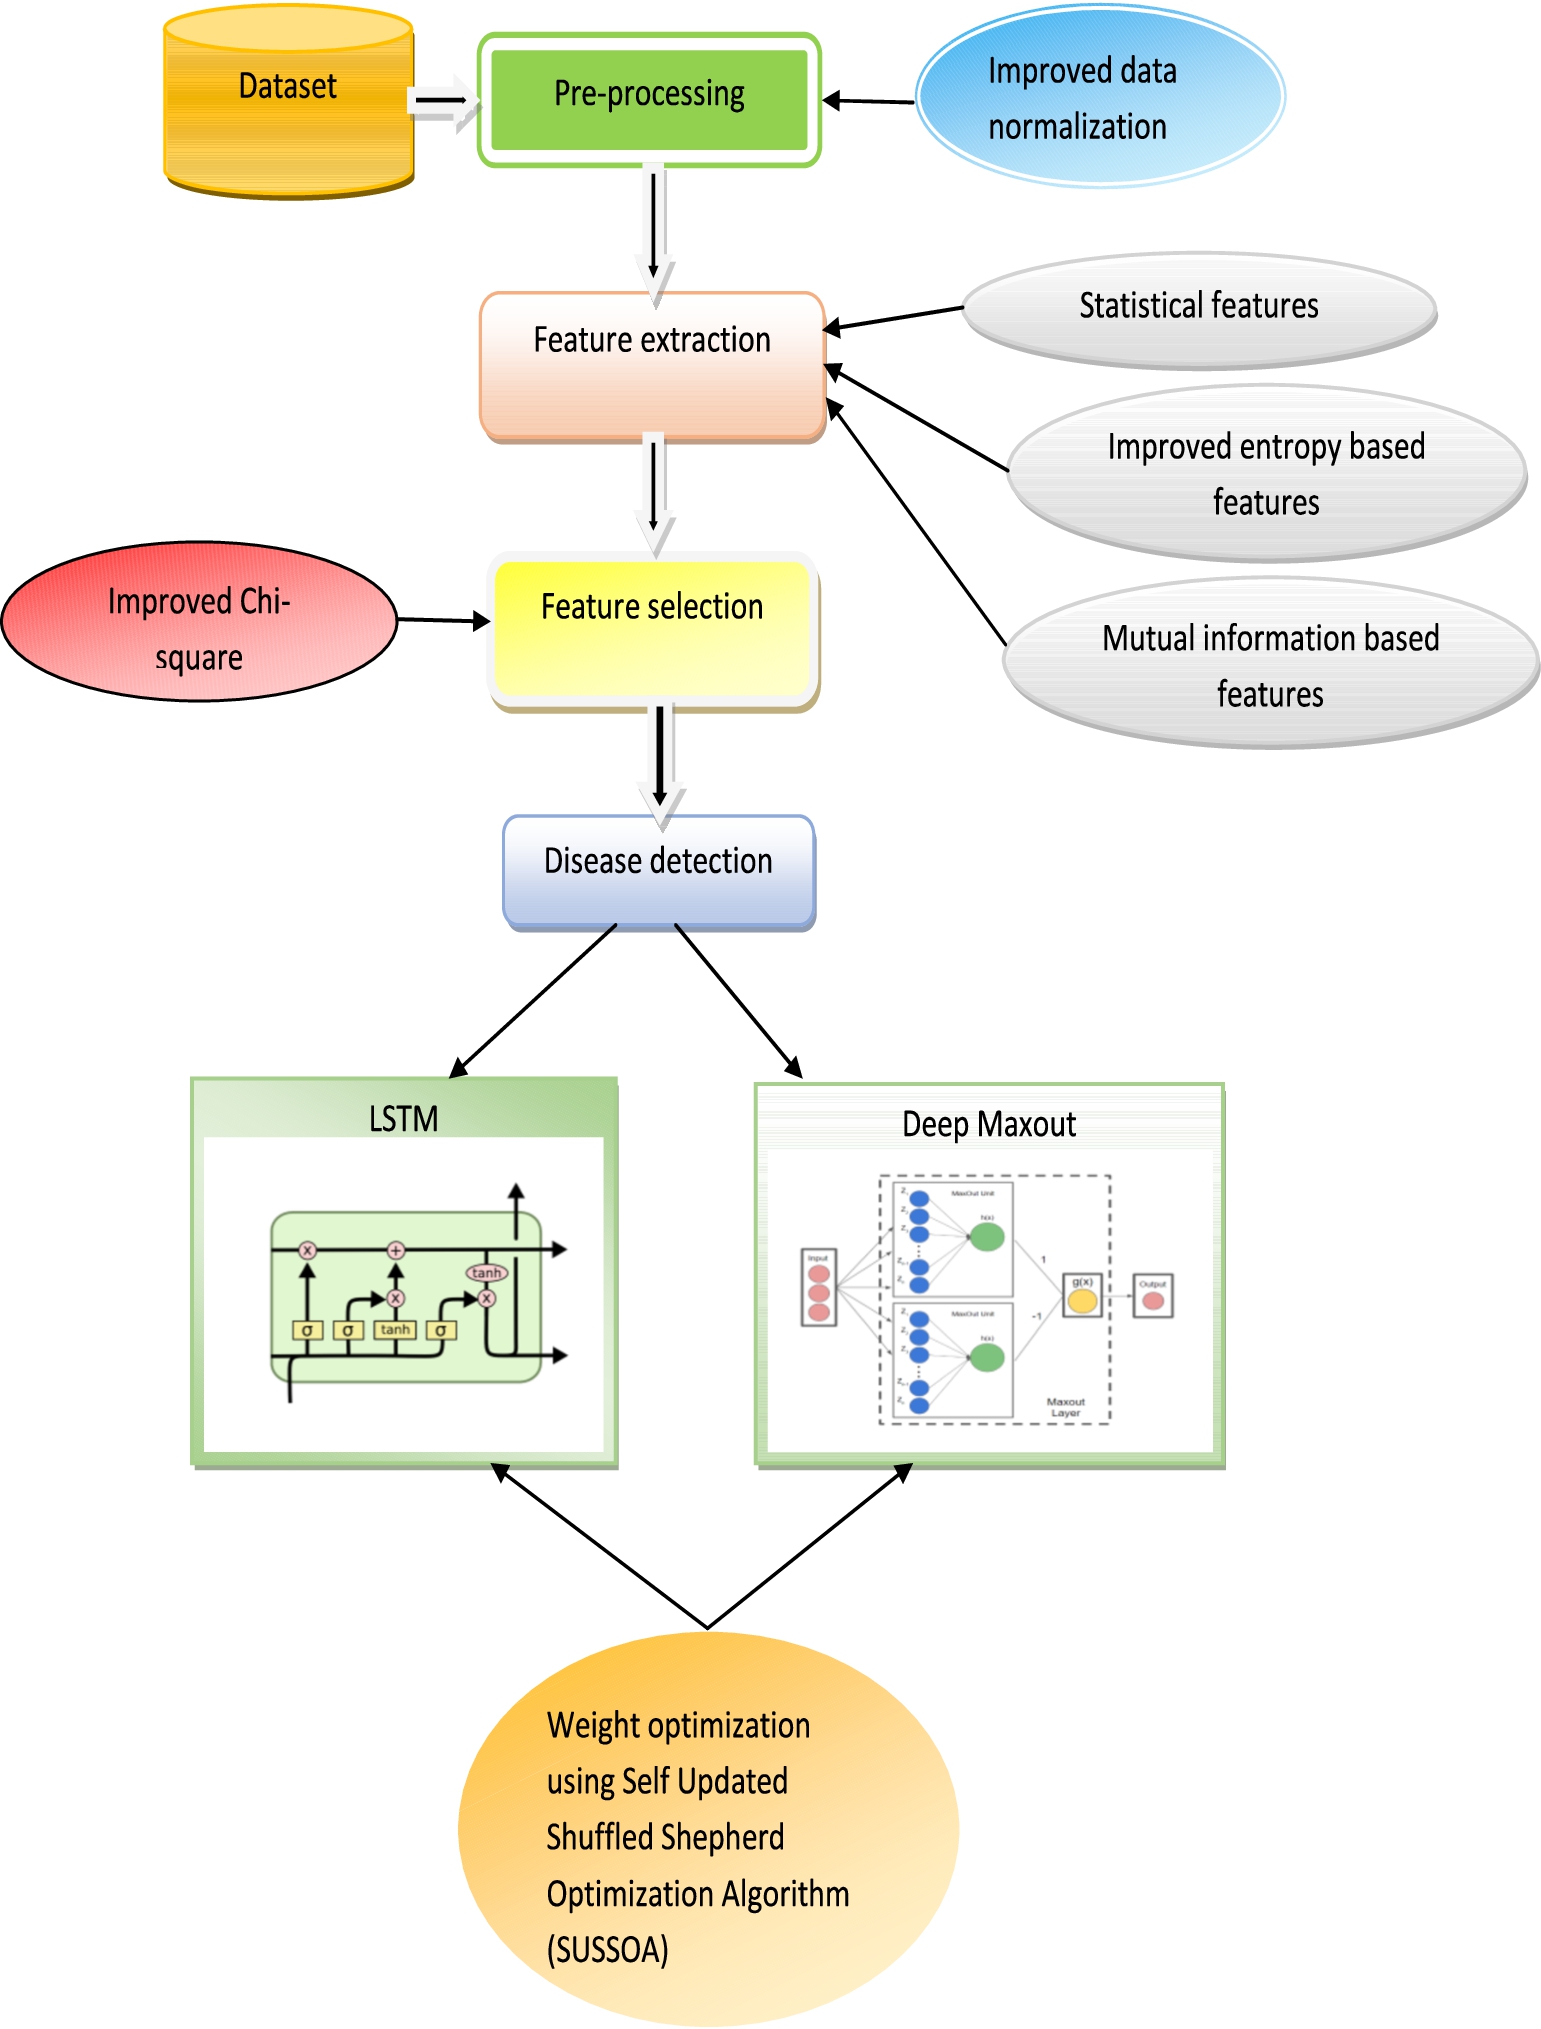
The architecture of the proposed SUSSOA-based AD detection.
Input data get pre-processed in this initial stage. Data manipulation or deletion before usage in an attempt to guarantee or improve performance is generally described as data preprocessing. In our work, we applied an improved data normalization technique to turn the data into formats suited for the AD detection process.
Improved data normalization
An attribute’s data is scaled via normalization to fall within a narrower range. When handling various attributes on multiple scales, normalization is usually necessary; else, the performance of a significant and extremely important attribute (on a smaller scale) could be diminished since other attributes have values on a greater scale. Z-Score, decimal scaling, and Min-Max were the three data normalization methods. In our research, we have used improved min-max normalization.
Min-max scaling works identically to z-score normalization because it uses a formula to exchange column’s each value with a newer value [1]. In this instance, the equation is:
Here m represents the new value, the original cell value gets indicated by x, the column’s minimum value gets signified by
Our improved data normalization uses the following equation (2), instead of using the conventional equation (1)
Here
Feature extraction
The approach’s second stage is feature extraction which involves turning patterns into features that have been viewed as a compressed form. The preprocessed data are then put through this feature extraction process, where features including statistical, improved entropy-based, and mutual information-based features are extracted. Below is a description of the entire procedure [16].
The following are the statistical features used in this work.
The arithmetic mean μ describes the average of the numerals
Equation (5) was employed to estimate the standard deviation σ as just a way of gauging how far spread out the values
It involves standardizing the K-th instant with regard to the mean. This was computed utilizing the formula.
Equation (7) was employed to determine kurtosis, which serves as a gauge of how skewed the data’s likelihood function is.
Skewness has been utilized to quantify the data’s asymmetries. Equation (9) was implemented to compute it.
Extracted statistical features were denoted as
Improved entropy-based features
To quantify the impurities connected to a random variable, entropy has been used. Shannon entropy has been employed in our work. It gauges the degree of randomness and expresses the expected value of the data inside a message, often in bit units.
A random variable Z’s Shannon entropy could be calculated using Eqns. (11) and (12), wherein
Our improved entropy uses the following formula (13), instead of utilizing the formula (11),
|B| is the cardinality of B, which refers to the number of elements in the given dataset.
To get an accurate AD detection, we have used these improved entropy-based features along with the conventional features in this work.
Mutual information-based features
A metric used to quantify the mutual dependence of two different variables would be called mutual information. This mutual information “
If D & E are both independent, D has no information of E and vice versa, hence its mutual information equals 0. If D & E were similar, then all data sent by D gets shared by E: realizing D discloses nothing unusual regarding E & vice versa, thus mutual information is identical to data given by D (or E) individually, specifically D’s entropy. Mutual information measures the gap between the joint allocation of E and D as well as the product of its marginal allocations in a certain manner [2].
The retrieved features were symbolized as
Feature selection
The extracted features were passed through the feature selection process. When creating a detection model, feature selection comprises the act of minimizing the count of input variables. It is preferable to decrease the count of input variables in order to lower modelling computational costs and performance improvement. We have used an improved Chi-square technique for an effective feature selection.
Improved chi-square technique
The chi-squared analysis determines the gap between the observed as well as anticipated values. Chi-Square illustrates or checks the link between two category variables that might be computed utilizing the provided observed as well as expected frequencies [3].
Chi-square formula
Where
Our improved chi-square technique uses the following expression (17), instead of using the equation (16).
The selected feature set gets denoted as
Disease detection
The final disease detection depends on those chosen features, and the hybrid classifiers including Long Short Term Memory (LSTM) as well as Deep Maxout neural networks have been used, and the weighting parameter of such classifiers have been optimized by Self Updated Shuffled Shepherd Optimization Algorithm (SUSSOA). The detailed AD detection process has been described below.
Optimized LSTM
This Optimized LSTM neural network receives the chosen features as input. This LSTM cell at the preceding time step gets depicted by the cell on the left, whereas the cell at the following time step has been indicated by the cell on the right. It is the midpoint of the present time step. The cell is entered by three lines. The output first from the preceding timestep is received in the bottom left corner, along with the input
Before it enters the four gates, the input
The cell state could be viewed as a data highway that travels throughout the entire chain of cells only with a few linear contacts, even if mathematically it is nothing more than a vector. It can be among the most essential elements, as it enables the LSTM to retain long-term input dependency. To such an internal memory, data can be read, written, and deleted. The new data must be added, never multiplied, towards the cell state in an attempt to overcome the vanishing gradient problem. This chain rule will never operate inside the backpropagation as well as addition distributes gradients uniformly. Four neural net layers, each having a unique purpose, make up the LSTM cell. The sigmoid function which has all three of these tiers produces a matrix having numbers from 1 to 0. The state of the cell being reset in Keras.
The forget gate seems to be the initial gate. It takes into account the outcome from the prior timestep, ht-1, as well as the present inputs,
If a matrix having values around 0 to 1 is produced by the forget gate:
This is then passed up to the Cell state to be updated (the cross above the arrow). If the preceding timestep’s state becomes
Uploading new data to the cell state: The gate containing the sigmoid as well as the tan h gate are the next steps. Specifically, the initial as well as second input gates. The input gate, like the forget gate, serves as a filter on the tan h layer. It has a value ranging from 0 to 1 and determines how much of the data must be preserved.
Candidates for the new cell state values are being created by the second gate only with tanh activation function. Evidently, since the cell state might add as well as subtract data as fresh candidate entries were presented to it. The following is the formula of the new candidate values
With the aforementioned “input filter,” one then estimates the component-wise multiplication of the potential candidate values.
Essentially in the calculations so far, what we have done is compute some neural nets with the same inputs. We have chosen which values to erase from the memory (the previous cell state) and we have decided which values to write to the memory and we have filtered these values with a sigmoid. Then we are ready to update the cell state, by simply adding the old state modified by the forget gate, element-wise with the new candidate values
In total the modifications to the cell state are:
Finally, we choose what data should be output from the cell. A classic neural layer receives the inputs as well as the previously hidden state. Before this output, a sigmoid activation is applied, and indeed the cell state that had been compressed in a Tanh layer gets multiplied point-wise to produce a vector of values between −1 and 1. The output of this operation is filtered by the cell status. The prior output as well as the current input appear to be the most crucial factors, however, the cell state might change the ultimate output by multiplying this by either positive or negative values. Finally, we can detect whether the AD is cognitively Normal (CN), Dementia, or Mild Cognitive Impairment (MCI) as output.
Optimized deep maxout neural network
The output from the feature selection stage is given as the input of this neural network. Every neuron inside a maxout neural network does have a grouping made up of r candidate pieces. The neuron activation has been determined to be the highest value obtained from all r components. Symbolize the ℓ-th hidden layers v-the node
Components of the ℓ the layer’s vector to be max pooled were
The gradient for every max out neuron throughout training has always been 1, while only the weights for the component having the highest level of activation inside every group,
The max out neuron is indeed a generalization of the ReLU neuron, the max-out nonlinearity is a universal approximator, as well as the max-pooling operation, offers comprehensive AD detection.
The max-pooling procedure, which has been initially used with convolutional networks, seems comparable to a winner-take-all operation. A highly active neuron gets chosen as a depiction of a location made up of r candidate neurons, with the remaining candidates being discarded. These candidate neurons in a maxout network could be thought of as many feature maps, each of which contains a distinct component of data from the layer beneath. The classifier is robust thanks to the maxout neuron, which chooses the most useful feature. To the ReLU nonlinearity, max-pooling occurs among a solitary feature map as well as 0, which functions like a maxout neuron having two components but only one of them is always 0. As opposed to ReLU, which simply discards data, maxout units intelligently choose features. The neurons instantly pick up the activation functions during the training of the maxout network and produce a useful output as to whether the AD is cognitively Normal (CN), Dementia, or Mild Cognitive Impairment (MCI).
The neural network weight optimization has been done in this work using the SUSSOA, which provides effective AD detection by minimizing detection errors, and the detailed weight optimization process is described below.
Self-updated shuffled shepherd optimization algorithm (SUSSOA)
During training, parameter tuning will be done by using SUSSOA, which is the enhanced form of the Shuffled shepherd optimization algorithm (SSOA). The primary source of motivation for the SSOA seems to be shepherds’ herding habits. Throughout time, people have discovered that they may harness animal traits to their advantage. Shepherds make an effort to lead their flocks in the correct direction. Shepherds typically use horses or herding dogs for such an objective, using the animals’ natural herding instincts to guide the herd and protect it from theft as well as predators. The information necessary to create the SSOA algorithm is based on this behavior. Illustrations of the herd as well as the shepherd’s mathematical formula are shown below [20,28].
When we split the flock of sheep into the “HE” count of herds with the “SH” count of sheep within every herd that we observe in ecology, we get the formula
Shepherds work to guide the sheep within every herd in the direction of the horse. The sheep were arranged for every herd in ascending order by the ratings of their objective functions. From the initial to the final sheep, the sheep are chosen. The chosen member is usually assumed as a shepherd to determine the step size of such sheep’s motion, and this is indicated via the symbol p. Of course, there really are sheep that are superior to and inferior to the ones that were chosen. Horses are indeed the superior sheep. As a result, each shepherd has a few horses as well as sheep. It is possible to determine the motion vector utilizing nature’s law. In the natural environment, the shepherd guides the sheep toward the horse. As a result, two animals are chosen at random: one horse plus one sheep from the leftover sheep. The first shepherd approaches the chosen sheep and afterward rushes toward the horse to guide the flock. Consequently, the following is how the motion vector gets acquired:
Where
The first component of the step size equals 0 for the initial sheep chosen from the herd as there are not any sheep there in the herd which is superior to it, it is also zero for the final sheep chosen first from the herd since it doesn’t contain any sheep inside the herd which are worse than it. A reduction in an as well as a rise in b eventually limits inquiry and boosts algorithmic exploitation.
The following formula is employed to determine the temple solution vector for every sheep inside a herd after determining the step size for every sheep in the herd:
The location of the sheep gets changed if the temple objective function was not inferior to the old objective function; so we get
Our SUSSOA uses the following equation (31), instead of applying the equation (30),
Q denotes the observation value
Objective function as well as solution encoding
The objective function of our SUSSOA-based AD detection is the minimization of detection error which is given in the following Eq. (34).
Here
The solution encoding obtained is given in the following Fig. 2, here
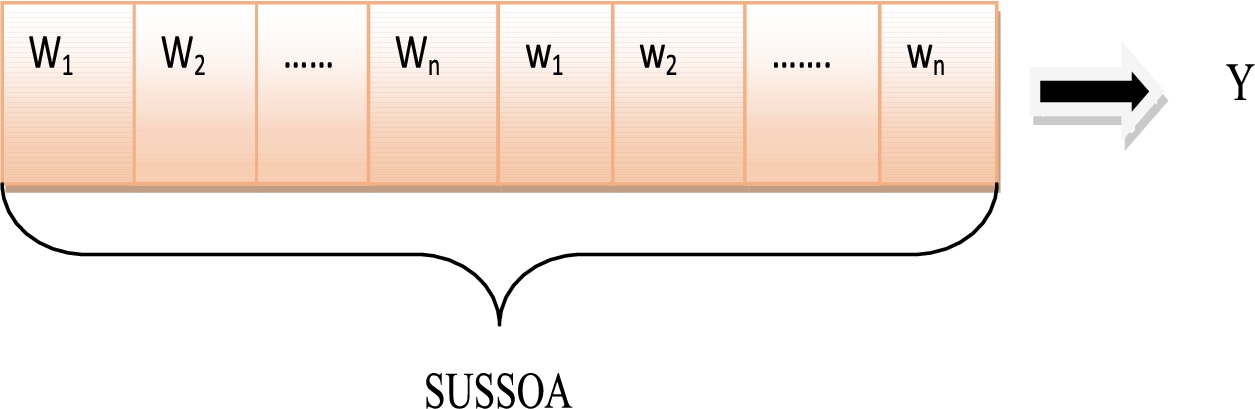
Solution encoding of proposed SUSSOA-based AD detection.
Our work implemented in Python 3.7.9 (tags/v3.7.9:13c94747c7, Aug 17 2020, 18:58:18) [MSC v.1900 64 bit (AMD64)] on win32 PYCHARM – 2021.2.3 and the dataset used is IDA, and is downloaded from [4]. Table 2 displays the details of the hardware. We have used three classes of AD in our work, which are MCI, CN, and Dementia. The results of our work are compared with techniques including SSO, BMO, HGS, BRO, BES, Bi-GRU, DBN, CNN, RF, 3-D CNN, and DNN+CNN to prove the superiority of our method.
Hardware details
Hardware details
We have conducted the convergence analysis of our proposed SUSSOA for 0–50 iterations and the results were given in Fig. 3. Initially for 0–30 iterations the cost function rating of HGS, BMO and BRO attain the lowest cost function rates i.e, between 1.04 to 1.05. Although the initial cost function rating of our SUSSOA is high i.e, approximately 1.07 in 0 to 10 iterations, it got reduced to 1.055 at (0–30) iterations. At that time SSO and BES still retained their highest cost function rates which are 1.088 and 1.075. When iteration increases from 30–50, our SUSSOA provides the lowest cost function value which is approximately 1.043, which makes sure that SUSSOA can offer efficient AD detection.
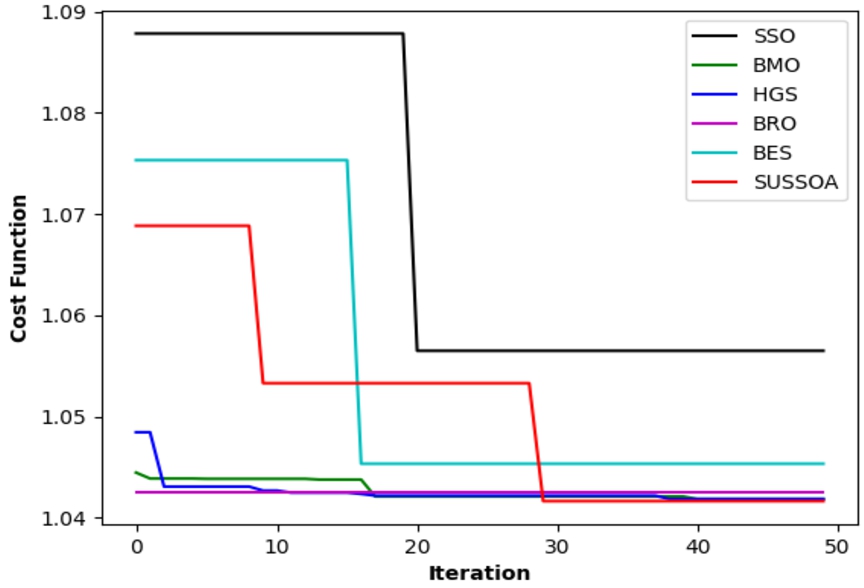
Convergence analysis.
Performance was evaluated using three categories of measures (“positive, negative, and miscellaneous”). Positive measures comprise “precision, specificity, accuracy, as well as sensitivity.” These positive indicators must be kept at higher levels. The findings achieved from our SUSSOA was depicted in Fig. 4. Detection accuracy is crucial among all these metrics. High detection accuracy was obtained using our SUSSOA. Surprisingly, for each difference in the learning percentage (LP), the detection accuracy of SUSSOA is demonstrated to be better than that of the extant techniques. SUSSOA’s accuracy value is significantly greater than 90% in all LRs. The detection accuracy observed via the SUSSOA at 60, 70, 80, as well as 90th LR, was approximately 91%, 95%, 93%, and 94%. Furthermore, the SUSSOA’s accuracy, specificity, as well as sensitivity were revealed for being higher than 90%. When SSO, HGS, BES, BMO, & BRO have precision ratings less than 0.8 for all LPs, but our SUSSOA offers rates of 0.91, 0.94, 0.92, and 0.93, which demonstrate our SUSSOA’s higher performance.
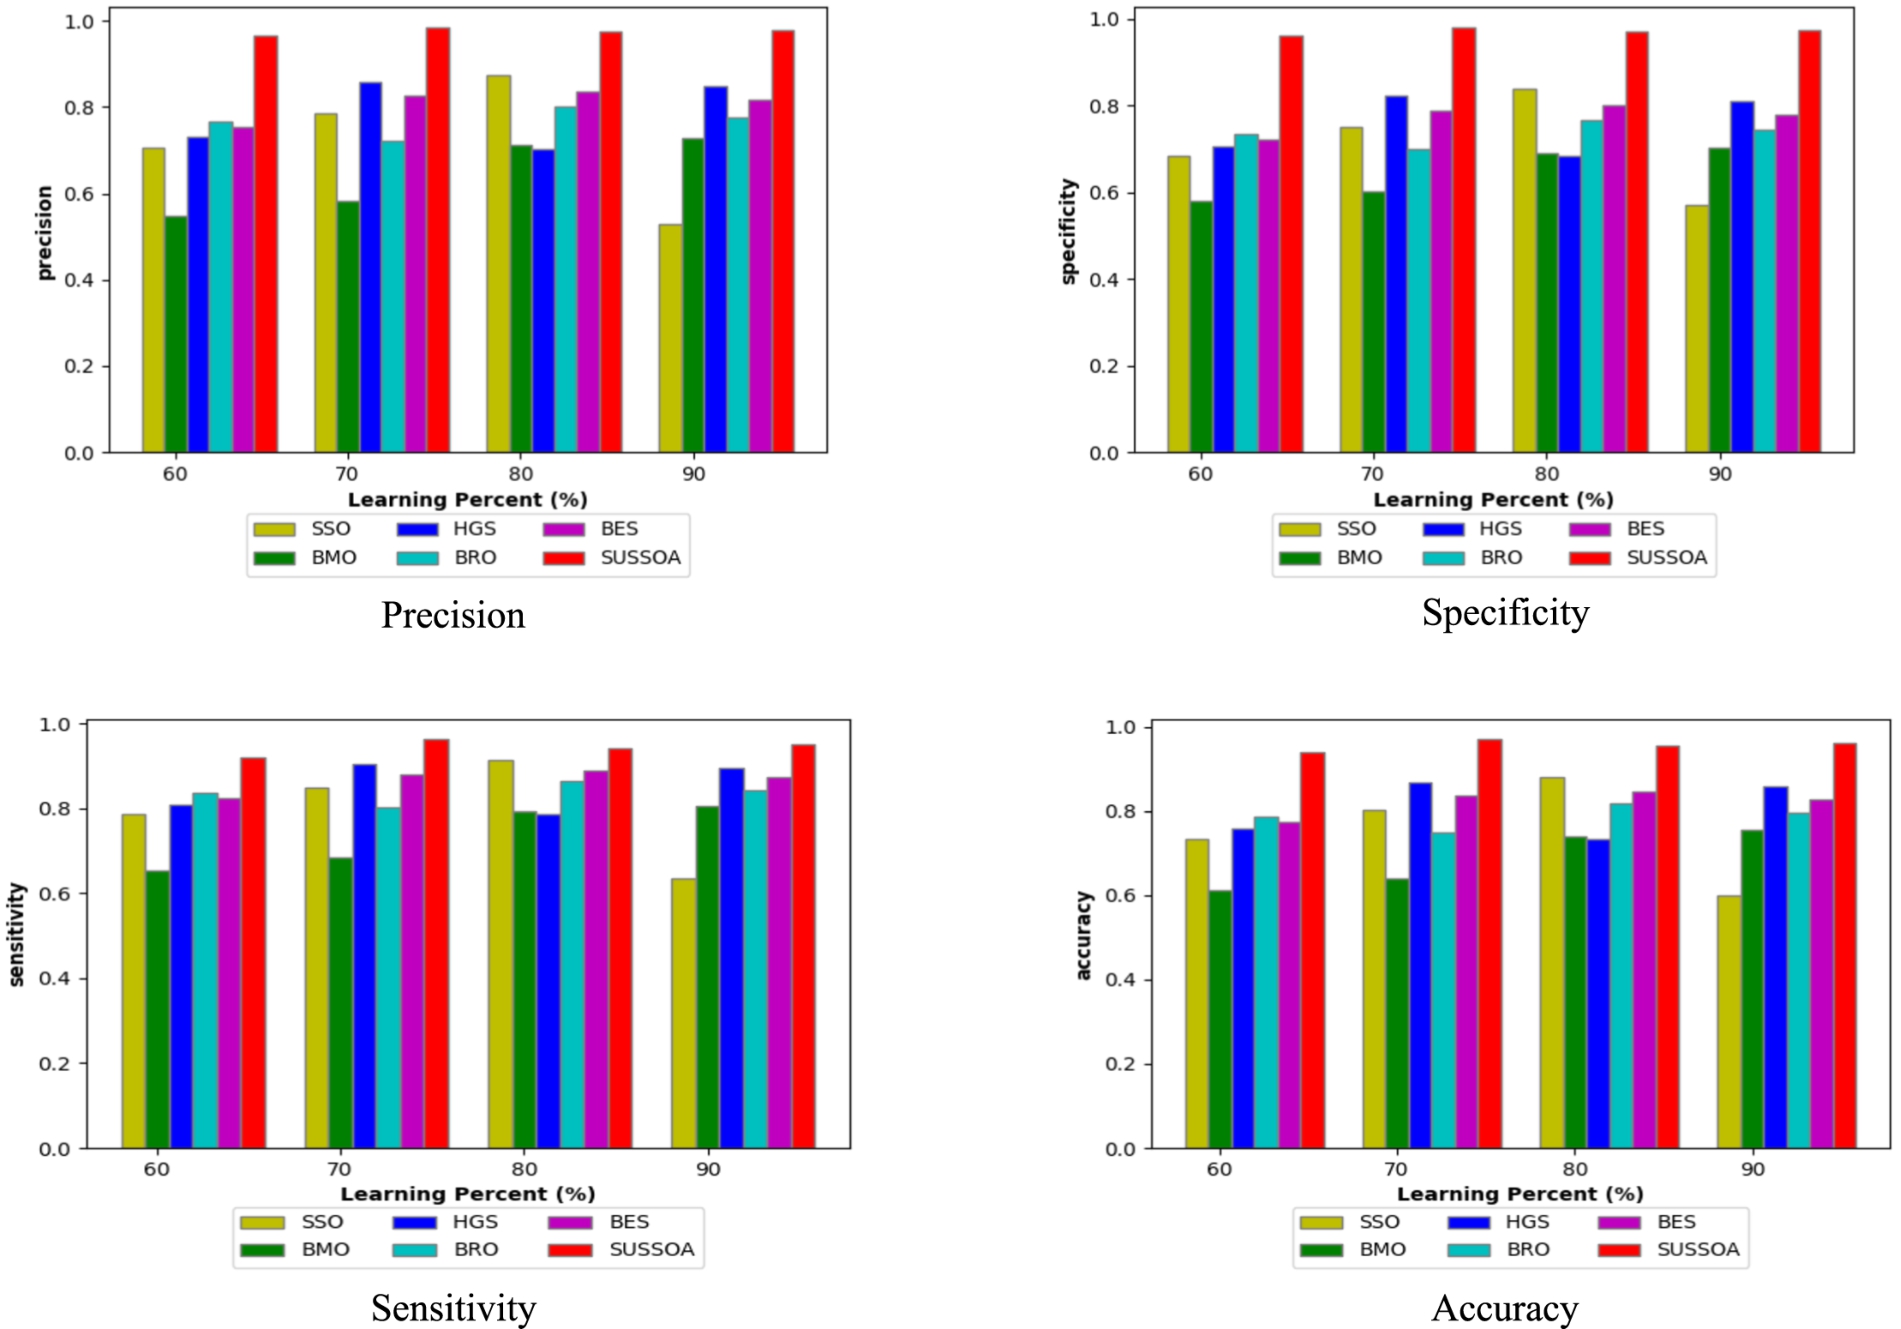
Proposed work’s performance compared with other algorithms.
The “F-measure, NPV, as well as MCC” is indeed the miscellaneous matrices. For good performance, such metrics must be sustained at higher levels. Furthermore, as seen in Fig. 5, the SUSSOA achieved the greatest F-measure of 96% at the 70th LR. In the 70th LR, the f-measure observed by the existing system is less than 90%. Not only in 70 LP, but also 60, 80, and 90 LPs, our SUSSOA has superior f_measure ratings of 0.9, 0.93, and 0.92, respectively, whilst other algorithms achieve lower rates (i.e, 0.6–0.85). Similarly, four SUSSOA attains recall of 0.9, 0.95, 0.92, and 0.94 approximately (from Fig. 5) whereas other techniques attain rates which are below 0.9. Furthermore, the SUSSOA has a larger NPV & MCC than the earlier models as demonstrated in Fig. 5. At all LPs, our SUSSOA achieves greater NPV and MCC ratings i.e, approximately >90%, which shows the superiority of our SUSSOA.
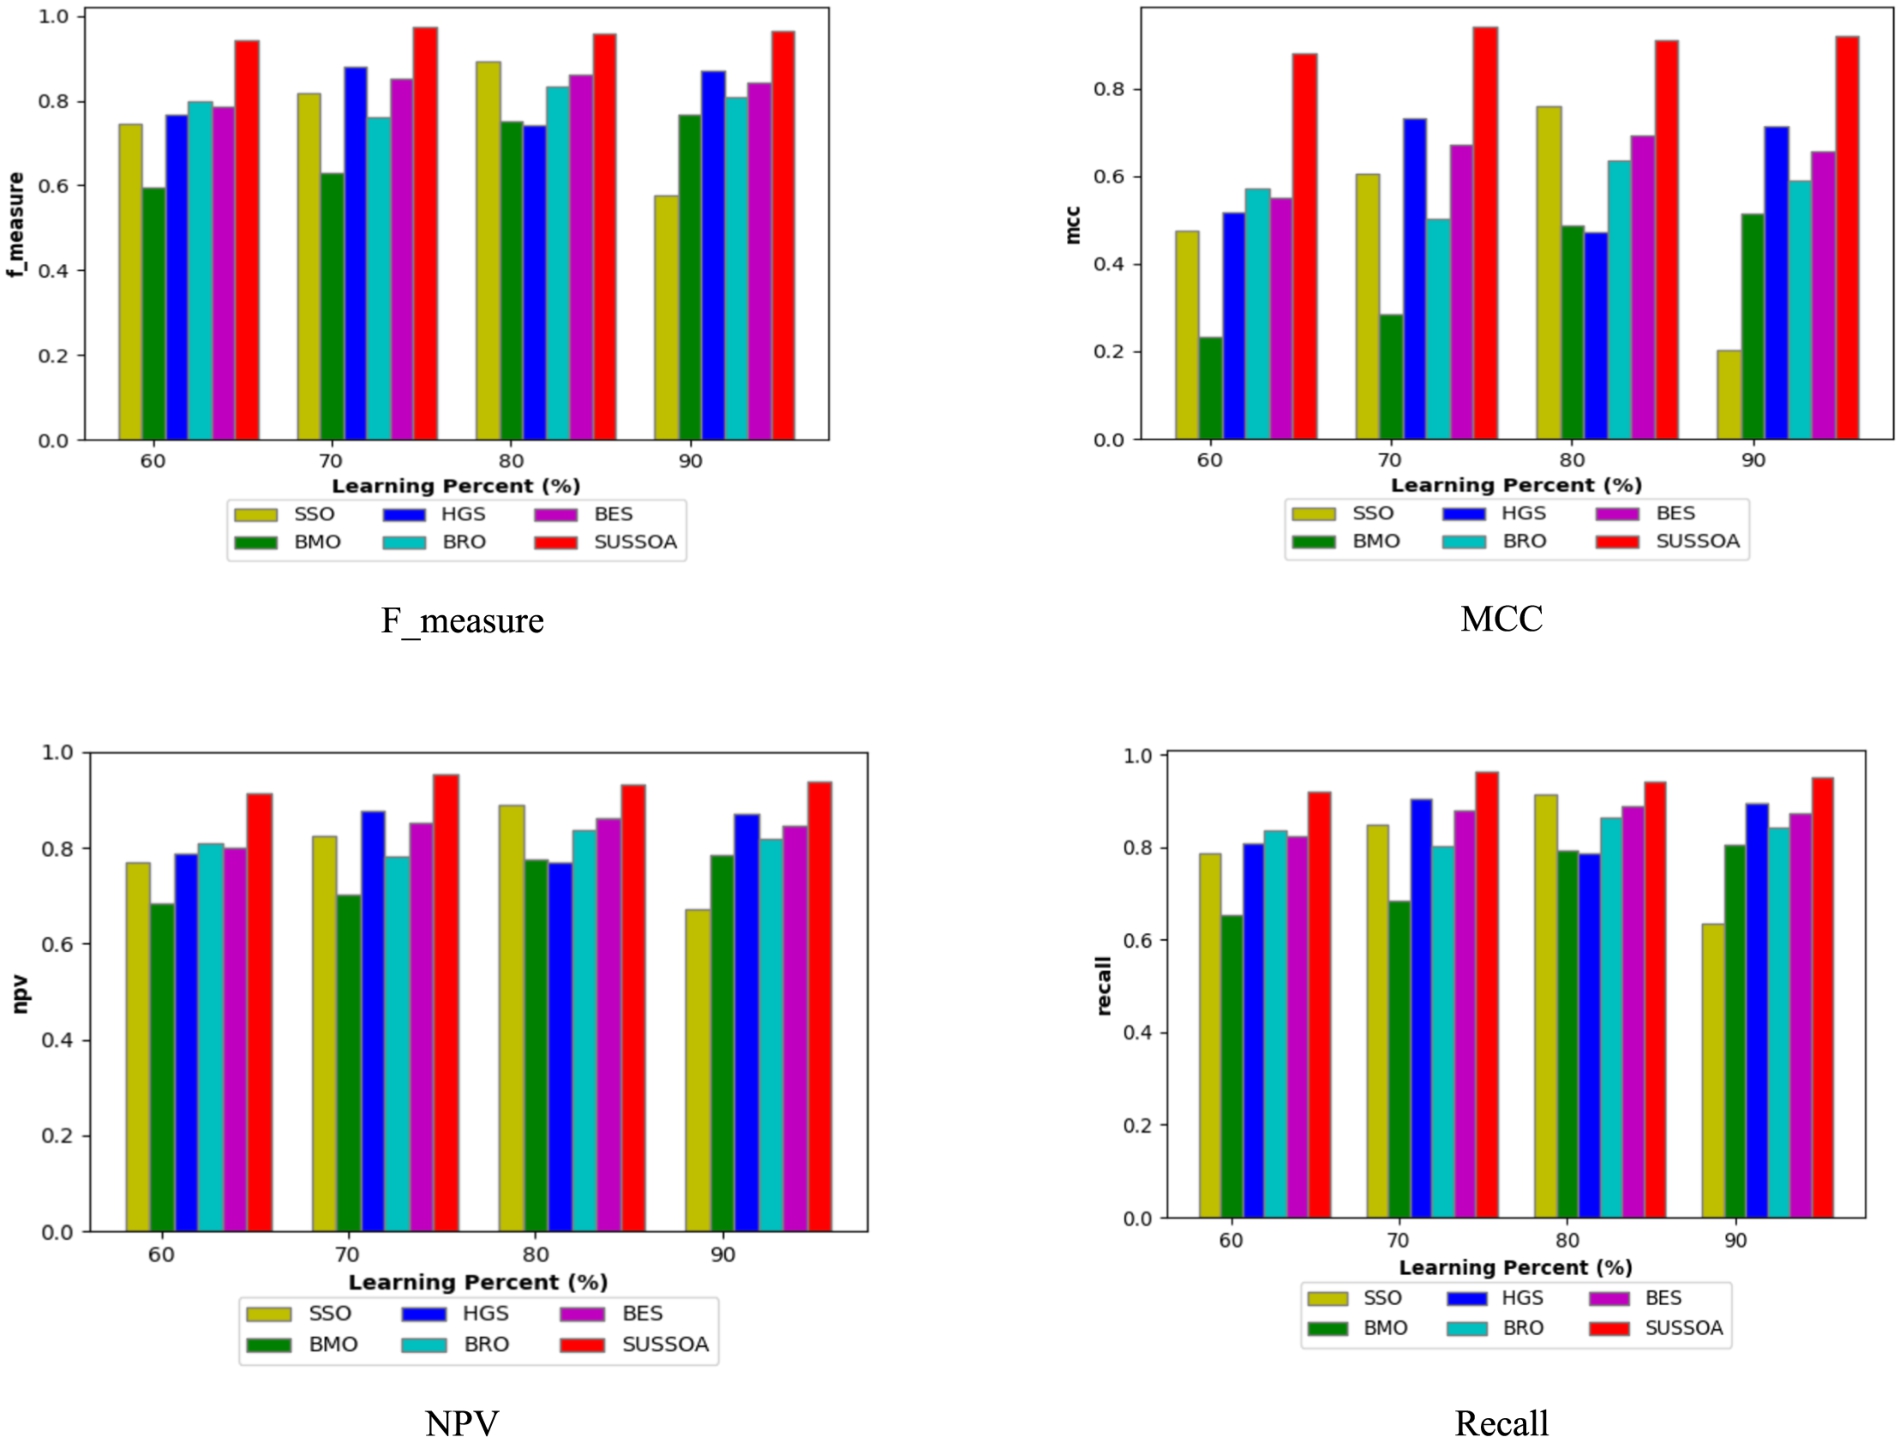
Proposed work’s matrices including f_measure, MCC, NPV, and recall comparison.
The “FPR and FNR,” are among the negative measures that must be as minimal as feasible. From Fig. 6, we can tell the SUSSOA has obtained the lowest FNR and FPR for each change in the LR. The FNR rating measured by the SUSSOA just at 70th LP is 0.04, the lowest value when comparing SSO = 0.15, HGS = 0.10, BES = 0.13, BMO = 0.32, and BRO = 0.20. Furthermore, the FPR of the SUSSOA has been discovered to be less than that of the earlier models under all LP variations.
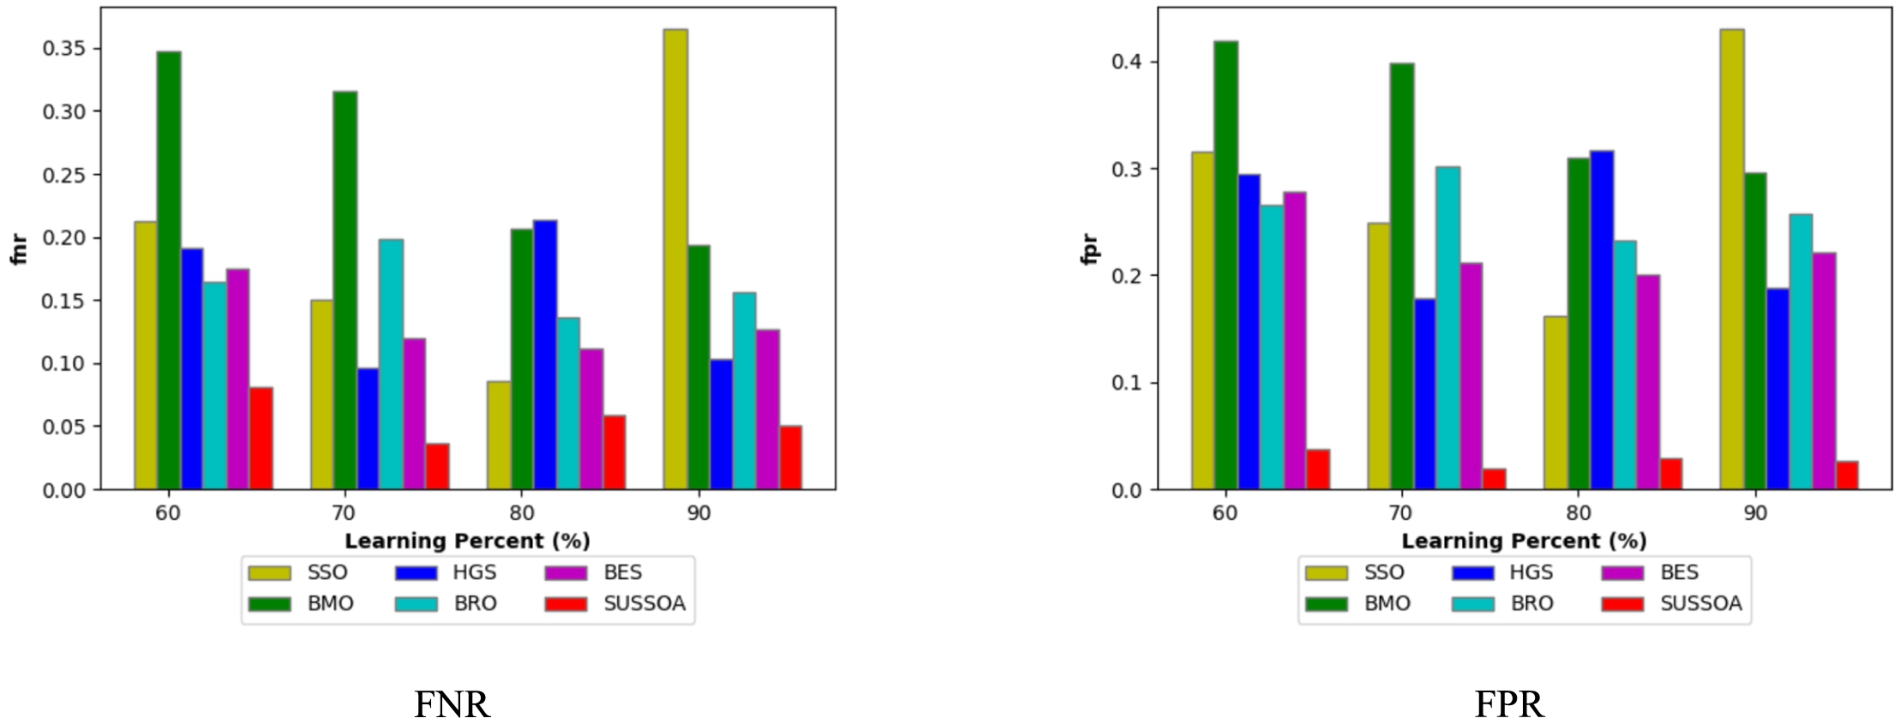
Proposed work’s negative measure comparison.
Statistical analysis was conducted in our work, in order to prove the effectiveness of our SUSSOA and is compared with algorithms such as SSO, BMO, HGS, BRO, and BES which is given in Table 3. Our SUSSOA obtains the highest best and worst measures i.e, > 0.9, whereas other methods obtain the approximate rates between 0.5–0.88. Similarly while analyzing standard deviation, median, and mean measures also our SUSSOA gets the highest rates of 0.9563, 0.9578, and 0.0113 which proves our SUSSOA method can offer higher accuracy rates in the AD detection task. Additionally, the best of the proposed SUSSOA-based method’s statistical analysis is 57%, 53%, 28%, 25%, and 21% higher than the other models like SSO, BMO, HGS, BRO, BES, and ISSO respectively. Therefore, the proposed model is suggested as an optimal approach for Alzheimer’s disease detection.
Proposed SUSSOA-based method’s statistical analysis comparison
Proposed SUSSOA-based method’s statistical analysis comparison
When analyzing our SUSSOA-based AD detection to other classifiers such as Enhanced Math Optimizer Accelerated Arithmetic with Ensemble Classifier (EMOAOA+EC), Bi-GRU, DBN, CNN, RF, 3D-CNN, as well as CNN + DNN which is given in Table 4. From that, we discovered that our SUSSOA-based AD detection yields greater positive measure ratings of 0.9704, 0.9631, 0.9800, and 0.9843, whilst EMOAOA+EC gets slightly lower values than that. Our SUSSOA-based AD detection outperforms not only EMOAOA+EC but also other strategies in terms of positive measures. While analyzing the measures including f_measure and recall, we have discovered that our SUSSOA-based AD detection can yield higher ratings (0.9631 and 0.9736) than other methodologies. While Bi-GRU, DBN, CNN, RF, 3D-CNN, and CNN+DNN offers the lowest MCC (between 0.38–0.68) and NPV(0.68–0.86) values. Not only in positive measures but in terms of negative measure also our SUSSOA-based AD detection offer superior outcomes i.e, 0.02 and 0.0369 than other techniques.
Proposed SUSSOA-based AD detection method’s performance comparison with distinct classifiers
Proposed SUSSOA-based AD detection method’s performance comparison with distinct classifiers
To demonstrate the efficacy of our proposed SUSSOA-based AD detection approach, we performed an ablation test utilizing 3 scenarios of our proposed method, as shown in Table 5. If we do not employ optimization, our method only has an only accuracy of 0.8438, but our proposed SUSSOA-based AD detection has a rate of 0.9704. When utilizing conventional normalization, our method achieves accuracy as well as sensitivity levels of 0.9306 and 0.9334, respectively, but our proposed method achieves ratings of 0.9704 and 0.9631, demonstrating the superiority of our improved data normalization strategy. To demonstrate the performance of our improved entropy-based feature extraction, our proposed methodology was tested with conventional entropy, yielding lower positive measure ratings of 0.7620, 0.7281, 0.8, as well as 0.8060. In terms of other measures such as recall, precision, MCC, NPV, and f_measure also our SUSSOA-based AD detection offers higher ratings i.e, >90%. When assessing the negative measure ratings, our SUSSOA-based AD detection yields lower ratings, notably 0.02 and 0.0369, but other scenarios of our proposed approach attain higher ratings.
Proposed SUSSOA-based AD detection method’s ablation analysis
Proposed SUSSOA-based AD detection method’s ablation analysis
We performed a comparative exploration to demonstrate the performance of our improved chi-square feature selection, and the outcomes have been shown in Table 6. When we use our proposed approach with traditional chi-square, we get positive measure ratings of 0.7894, 0.8303, 0.7451, and 0.7787, but when we use improved chi-square, we get ratings of 0.9704, 0.9631, 0.9800, and 0.9843. Instead of improved chi-square our method was conducted with LDA and PCA also, but the positive measure outcomes were very low. Our proposed method using improved chi-square offered excellent performance when analyzing recall, f measure MCC, as well as NPV ratings. Not only in terms of positive measures but in terms of negative measures also our proposed method with improved chi-square provided superior outcomes i.e, 0.02 and 0.0369.
Performance comparison of the proposed method with diverse feature selection techniques
The complexity analysis of the proposed SUSSOA model over the conventional methods such as SSO, BMO, HGS, BRO, and BES is illustrated in Table 7. based on the results, the proposed SUSSOA model computational time has reached the lowest value of approximately 55.36, which is inferior to the conventional schemes. This demonstrates that the proposed SUSSOA model is computationally efficient.
Time analysis
Time analysis
Wearable devices that enable the diagnosis and prognosis of small sensors and biomedical devices have been developed in recent years as a result of the enormous advancements in electronics, biocompatible materials, and non materials. This has significantly improved the quality and effectiveness of healthcare services. Future patient monitoring and clinical care will be built on effective and economical wearable device solutions, making it possible to monitor patients remotely and for an extended period of time in homes and communities, which was previously unattainable. The creation of individualized medical treatment and the expense of healthcare for the aged population are two areas where wearable technology is anticipated to have a considerable impact.
Conclusion
This work has developed a novel AD detection with 4 stages such as pre-processing, feature extraction, feature selection, and AD detection. An improved data normalization approach was used for pre-processing the input data during the pre-processing stage. These pre-processed data will then be put through a feature extraction process in which features including statistical, improved entropy-based, as well as mutual information-based features were extracted. Using the improved Chi-square approach, suitable features were chosen from these extracted features. LSTM and Deep Maxout neural network-based hybrid model was developed for AD detection that trained with the chosen features, and also the weight parameters of LSTM and Deep Maxout were optimized by the SUSSOA. Unsupervised and self-monitoring methods are developing study fields in medical pictures as a result of the scarcity of medical data. The success of deep learning technology cannot be discounted, despite the fact that the majority of the problems in the field of AD categorization remain unresolved. Its ability to detect AD can sometimes outperform that of medical professionals. We will keep researching deep learning-based AD diagnosis techniques in the future. The final evaluation has proved the betterment of the proposed work in terms of different performance measures.