
Abstract
BACKGROUND:
The use of information and communication technologies improves the versatility of learning environments by broadening the scope of educational practices, allowing students to communicate with other institutions and providing access to information in real time. However, these tools, in addition to environmental characteristics, can increase the internal thermal load, which is directly influenced by the external environment, with a consequent impact on body physiology.
OBJECTIVE:
The present study investigated the relationship between air temperature and blood pressure and heart rate among students performing cognitive tasks at computer laboratories in four public universities (three in Northeastern Brazil and one in Northern Brazilian).
METHODS:
Thermal conditions and physiological parameters were analysed over three consecutive days, and the participants were subjected to changes in air temperature from 20°C to 33°C. Blood pressure and heart rate were measured before and after testing.
RESULTS:
Analyses of the experimental data showed changes in heart rate at high temperatures, with a greater risk of students from Teresina and Manaus institutions presenting heart rates above 100 bpm during cognitive tasks.
CONCLUSIONS:
Within the temperature range applied, on the day of the highest temperature, we observed the highest percentage of participants who reported thermal discomfort (63%, 33°C; 58%, 29°C; 38%, 28°C) and a reduction of cognitive performance (15 to 10 points when the air temperature increases from 20 to 33°C).
Introduction
Young people spend a considerable amount of time in school buildings; consequently, the school environment requires attention because of the types of activities performed there and the amount of time spent there [1, 2]. This environment has undergone changes over time with the introduction of information and communication technologies (news ICTs), which increase the environmental thermal load and promote imbalances between humans and their work environment, thus opposing the principles of ergonomics [3, 4].
Healthy, quiet, safe and comfortable environments are important for the success of any work environment, especially one associated with teaching and learning activities [5–7, 63]. Air temperature is an environmental parameter with a strong impact students’ performance in the classroom [1, 8]. Among environmental comfort variables, temperature and classroom lighting have the greatest influence on students’ learning and are the most common reasons for student complaints [9, 10]. Therefore, satisfactory classroom performance is associated with an appropriate interaction between the individual and the environment, particularly the thermal acceptability of the environment [16].
In Brazilian regions with high temperature and relative humidity, the performance of cognitive activities may require additional efforts to achieve thermal neutrality and maintain homoeothermic [12]. An increase in the body’s thermal load can lead to reduced productivity because of decreased attention; it can also have health consequences, especially medium- and long-term effects on the cardiovascular system [11, 15]. Additionally, forecasted climate changes and global warming must be considered: according to a report on climate change by the Brazilian Ministry of Science and Technology, the mean air temperature in Brazil is expected to increase by 3 to 6°C in 2100 compared with the end of the 20th century. This change will increase the health risks to which workers are exposed as temperature elevation could increase the internal load in workplaces and classrooms [14, 19].
Within the context of health, some studies point to the effect of thermal load on an individual’s physiology: increased thermal load changes the immune response, the skin’s temperature perception and the heart’s electrical activity, in addition to increasing irritability, reducing precision and decreasing concentration and enthusiasm at work, with a consequent drop in productivity [18–20].
The circulatory system is the system that is most involved in controlling body temperature because of its intimate relationship with the thermoregulation system; thus, heart rate is among the most widely used parameters in studies examining the human response to gradual temperature changes [21]. Heart rate is an easily measured physiological parameter that should be considered in workload assessments because it is directly related to metabolic expenditure and thermal load; along with blood pressure, it reflects the processes of vasodilation and vasoconstriction [22, 23].
According [24, 64], the relationship between cognitive performance and health has been minimally investigated despite the relevance of cognitive performance to learning and professional training. Consequently, there is a need to investigate this relationship, particularly as it concerns the cardiovascular system, which becomes overloaded when thermal conditions are not ideal [13]. Monitoring for pathogenic conditions in the medium and long term should be considered because the heart is the main organ of the circulatory system and is susceptible to external thermal influences.
Given the need for research on the relationship between physiological parameters in the context of productivity and (1) the potential for climate change to increase air temperatures in the workplace, especially in areas where high temperatures predominate, such as Northern and Northeastern Brazil; (2) the inclusion of new technologies in the workplace; (3–64) architectonic factors; and (4) humans and the amount of time they spend in workplaces, the present study analysed the heart rate and blood pressure of university students in Northern and Northeastern Brazil as they performed cognitive tasks at a computer laboratory under conditions of thermal variation.
Methods
The experiments conducted in the present study were performed over three consecutive days under varied air temperature conditions in computer rooms at four public universities in cities in Northern and Northeastern Brazil. The rooms were equipped with climate control features (split air conditioners) and lighting systems, projectors, personal computers, wired and wireless networks.
Population
Students attending various engineering courses at public universities in Teresina, Piaui (A), Petrolina, Pernambuco (B), João Pessoa, Paraiba (C) and Manaus, Amazonas (D), were invited to participate in the study. The inclusion criteria were students attending higher education institutions, aged 18 to 30 years old and in a good state of health. Individuals who did not complete the BPR5 cognitive test and those who were absent on any of the three study days were excluded.
Legal issues
The present study was approved by an ethics committee, ruling no. CAAE 15012913.1.0000.5188, in compliance with 2012 Brazilian Health Council Resolution n°. 466. All the participants were informed of the study’s aims and signed a consent form.
Variables
Table 1 describes the variables assessed in the present study and their corresponding indicators.
Study variables and indicators
Study variables and indicators
The participants’ weight was measured with a G.tech BALGL10 digital scale with 150-kg capacity and 100-gram precision. Height was measured with a Sanny Standard stadiometer with the participants barefoot and standing next to the device with their feet close together [26]. Blood pressure and heart rate were measured before and after the cognitive tests using an OMRON HEM-7220 tensiometer, which was validated using the European Society of Hypertension international protocol. The procedures for measuring blood pressure complied with the VI Hypertension Guidelines [27]. A POLAR FT7 monitor was used to monitor the participants’ heart rate while they took theBPR5 cognitive test.
The thermal resistance of the participants’ clothing was calculated individually according to the ISO 9920/1993 thermal insulation table [28]. The metabolic rate was standardised to 70 W/m according to the type of activity performed [29, 30].
Subjective parameters, such as the participants’ thermal sensation and preference, were assessed using a 7-point perception and preference questionnaire included in ISO standard 7730/2005 [31]. Information on the participants’ lifestyle and physical activity practices was collected through a questionnaire administered after the BPR5 cognitive test.
Thermal variables
The thermal variables air temperature (Ta), wet-bulb temperature (Twb), globe temperature (Tg), mean radiant temperature (Trm) and air relative humidity (RH) were measured using a TGD 300 thermal stress metre and a BABUC microclimate station, both calibrated bythe National Institute of Spatial Research (Instituto Nacional de Pesquisas Espaciais – INPE), Rio Grande do Norte, Brazil. The devices were placed at the centre of the participating classrooms 60 cm from the ground, as recommended by ISO standard 7726/1998 [32]. Measurements were performed and recorded for each individual, and the mean and standard deviation values corresponding to the period during which each participant took the tests were considered for analysis. The devices were set to perform the measurements every minute starting when the participants entered the classrooms. For stabilisation, the devices were placed inside the classrooms 30 minutes before the onset of data collection.
Cognitive performance
The participants’ cognitive performance was assessed using the modified BPR5 test. The BPR5 is designed to assess overall cognitive functioning and is used by specialists, for instance, as an auxiliary measure for psychodiagnosis, job selection and learning assessment [33]. The instrument comprises five subtests that assess the following skills: Abstract Reasoning (AS), Verbal Reasoning (VR), Spatial Reasoning (SR), Numerical Reasoning (NR) and Mechanical Reasoning (MR).
Based on the study by Vasconcelos [15], the present study deconstructed the BPR5 and reorganised it into three summary tests with the same levels of difficulty [15]. One test was applied on each of the three study days. Table 2 describes the categories of each subtest.
Subtest categories
Subtest categories
A survey was created using the website qualtrics.com to apply the instrument and measure the amount of time the participant required to answer each question. The number of hits, the time required to answer and the relationship between these factors was calculated. The tests were randomly distributed; each participant completed one test on each of the study days.
The data were tabulated on an Excel spreadsheet and prepared for analysis using SPSS. Data analysis sought to describe and analyse the relationships among the investigated variables. For comparisons, normally distributed data were subjected to analysis of variance (ANOVA), and the remainder of the data was analysed using the non-parametric Kruskal-Wallis and Wilcoxon tests. Pearson’s and Spearman’s tests were used to investigate the correlations between the variables of interest. Ordinal logistic regression analysis using generalised linear models was performed to explain the relationships between variables, and the odds ratio of the independent variable to the dependent variable was used as a measure of the effect size [34].
Results
Sample profile
A total of 96 university students participated in the present study. After the exclusion criteria were applied, the final sample was n = 82. The demographic characteristics analysed in the present study are presented in Table 3.
Sample profile
Sample profile
The participants in this study sample were young students with weight within the normal range [35].
The study was conducted in computer laboratories at each of the four investigated institutions; the layouts of these laboratories are shown in Fig. 1. All the study environments had PC-type computers, Wi-Fi system, network communication and slide projectors. Similarly, they had ceiling lighting and split-type air-conditioning systems.
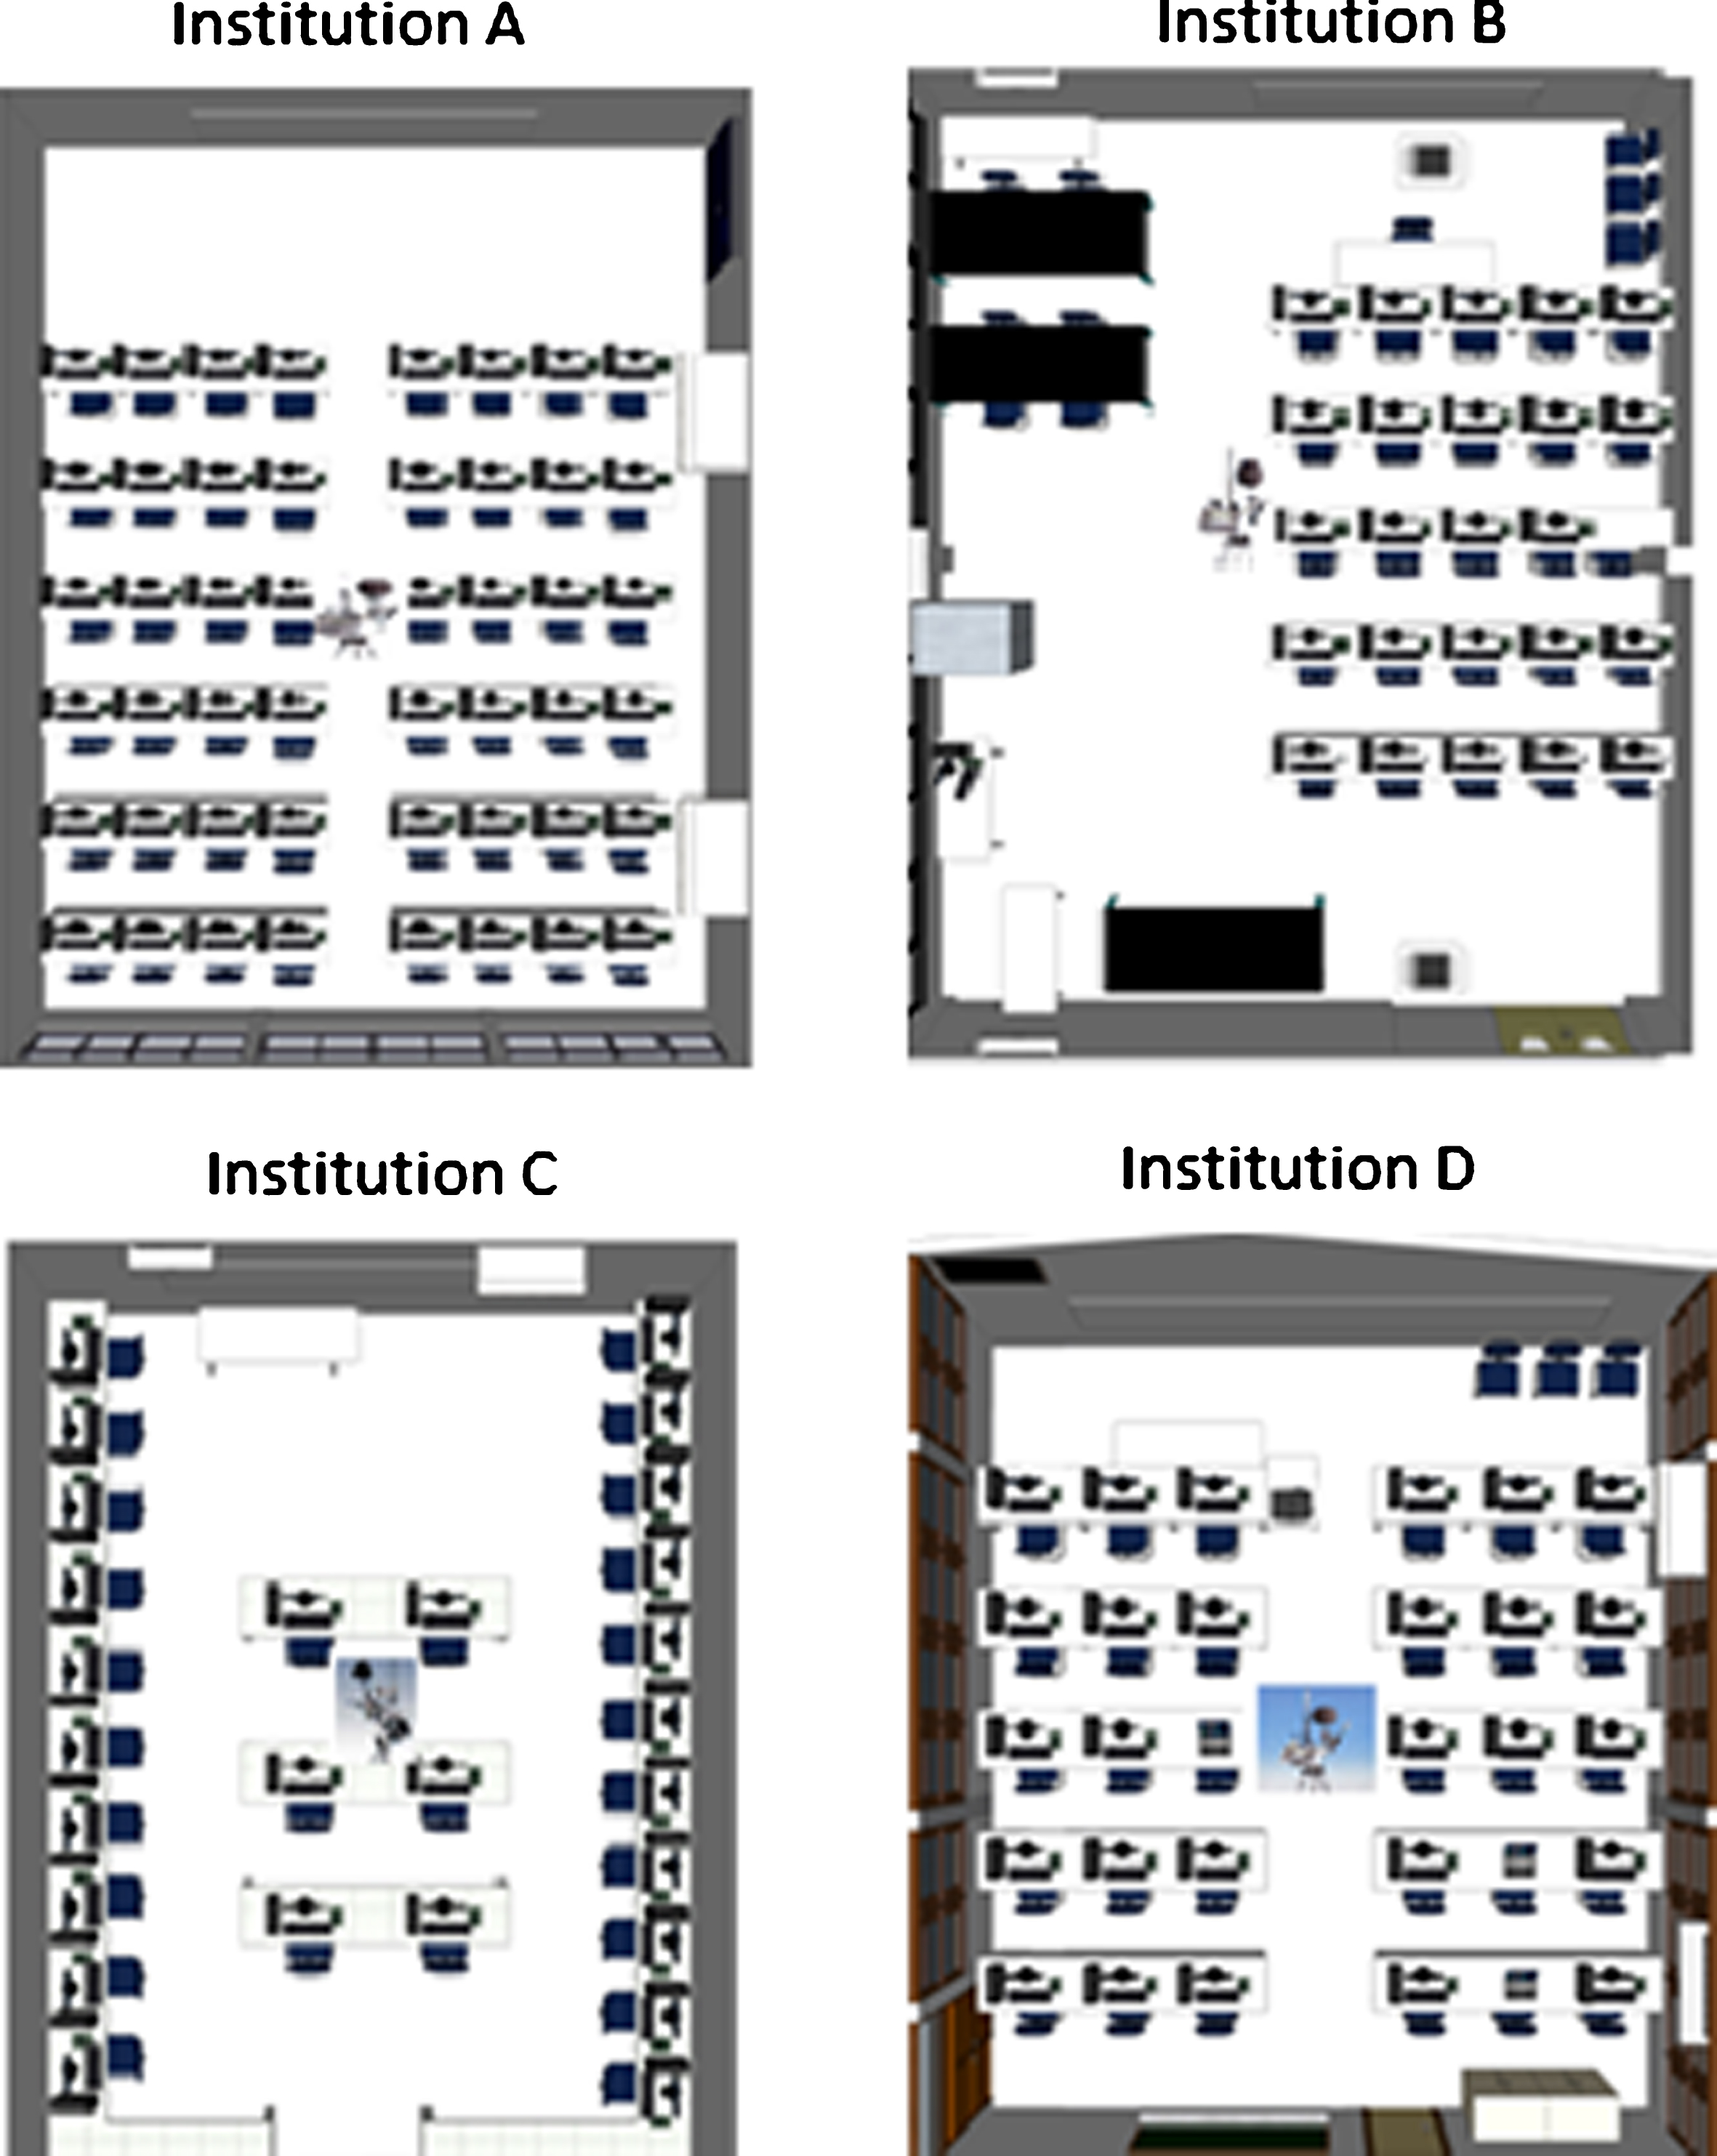
Layout of the computer laboratories at participating institutions.
The thermal data are described in Table 4. No significant temperature variation occurred on any of the study days. Despite the adjustment of Ta to pre-set values, there were differences in the actual measured temperature due to the influence of external thermal parameters and the limits of the available acclimation systems.
Thermal parameters of the computer laboratories
The variables Tg and Trm were similar for all three study days at all the investigated institutions. Small elevations in Tg compared with Ta were detected on the days with the lowest temperature; the elevation was approximately 1°C at institutions A and B and less than 0.5°C at institutions C and D. These findings indicate that radiation heat transfer occurred between the students and the environment.
The relative humidity at the assessed institutions varied from 50 to 77%; these levels are considered high and were caused by proximity to the sea in the cases of institutions A, B and C and by proximity to the Amazon rainforest in the case of institution D [36, 37].
The participants’ environmental thermal comfort and sensation were assessed according to ISO standard 10551/1995 [25]. Tables 5 and 6 summarise the participants’ responses on each study day. Predicted mean rating (PMR) and predicted percentage of dissatisfaction (PPD) were calculated based on the measured thermal data and the parameters assessed in the questionnaires.
Percentages of thermal perception ratings
Percentages of thermal perception ratings
Source: ISO 10551/1995 [22].
Percentages of thermal assessment ratings
Source: ISO 10551/1995.
An analysis of the participants’ perceptions per institution showed that most of the students at institutions A, B and D reported neutral thermal sensation at a temperature of 23°C. At this temperature level, most of the participants reported feeling thermally comfortable. On the day with the highest temperature, most of the students at all four institutions reported feeling “hot” or “very hot”.
Regarding the thermal environment analysis, the students from institution B reported feeling uncomfortable on all three study days, even when 62% of them reported feeling thermally neutral at 23°C.
On the day that the temperature was 20°C, 73% of the students reported feeling “slightly cold” or “cold”, while 59% of the students described the environment as “comfortable”.
On the days with the highest temperatures, almost all the students at all four institutions reported feeling uncomfortable. Only the students at institutions C and D disagreed; even when the temperature was 29°C, 21% of the students at institution C and 7% of those at institution D reported feeling thermally comfortable.
PMV was outside the ideal thermal comfort range (–0.5≤PMV≤0.5) on almost all the assessed days; the environment was characterised as slightly cold on days 1 and 2 at institutions A, B and C (Table 7). Relative to PPD, more than 10% of the students at institutions A and B reported being unsatisfied with the thermal environment at all three temperature levels. PPD, as recommended by ISO standard 7730/2005, was less than 10% at two time-points at institution C and on one day at institution D [31].
Thermal comfort indexes
The means for the physiological parameters assessed in the present study are listed in Table 8. The initial systolic arterial pressure (ISAP), final systolic arterial pressure (FSAP), initial diastolic arterial pressure (IDAP) and final diastolic arterial pressure (FDAP) did not vary considerably among study days as the corresponding mean and standard deviation values remained quite similar. In any case, these values tended to increase on the day with the lowest temperature.
Mean value of the participants’ cardiovascular parameters per institution
Mean value of the participants’ cardiovascular parameters per institution
The mean HR at rest (HRrest) and at the end of the experiment (HRfinal) were within the normal range for adults [38]. The maximum heart rate (HRmaximum) exceeded 100 bpm only on the day with the highest temperature among the students at institutions A, C and D; these values were above the upper limit of normal [38]. HRmaximum was above 100 bpm on all three days among the students at institution B.
The differences in the assessed physiological parameters on the three study days are described in Table 9.
Differences in physiological parameters on different study days
The HRrest, HRfinal, HRmaximum and HRmean of the students at institutions A and C differed among the three study days. IDAP and FDAP differed only among the students at institutions A and C. The results of Pearson’s correlation test, described in Table 10, showed moderate interaction between HRmean and Ta among the students at institution A. HRrest, HRfinal and HRmaximum exhibited weak correlations.
Correlations for blood pressure and heart rate
Heart rate was the physiological parameter that was most sensitive to air temperature; a higher number of participants exhibited HR maximum above 100 bpm on the day with the highest temperature (Fig. 2). During the experiments, the correlation between HR maximum and Ta was significant (p-value = 0.011) and the corresponding values were above the normal range for the students at all four institutions. A mathematical model was created to determine the extent to which the temperature variation from 28 to 33°C influenced HR maximum when it exceeded 100 bpm. Because a representative number of students from institutions A and D exhibited HR maximum over 100 bpm, one model was made for each of these two institutions and another was made for the full sample; the results of the likelihood ratio test (χ2) are described in Table 11.
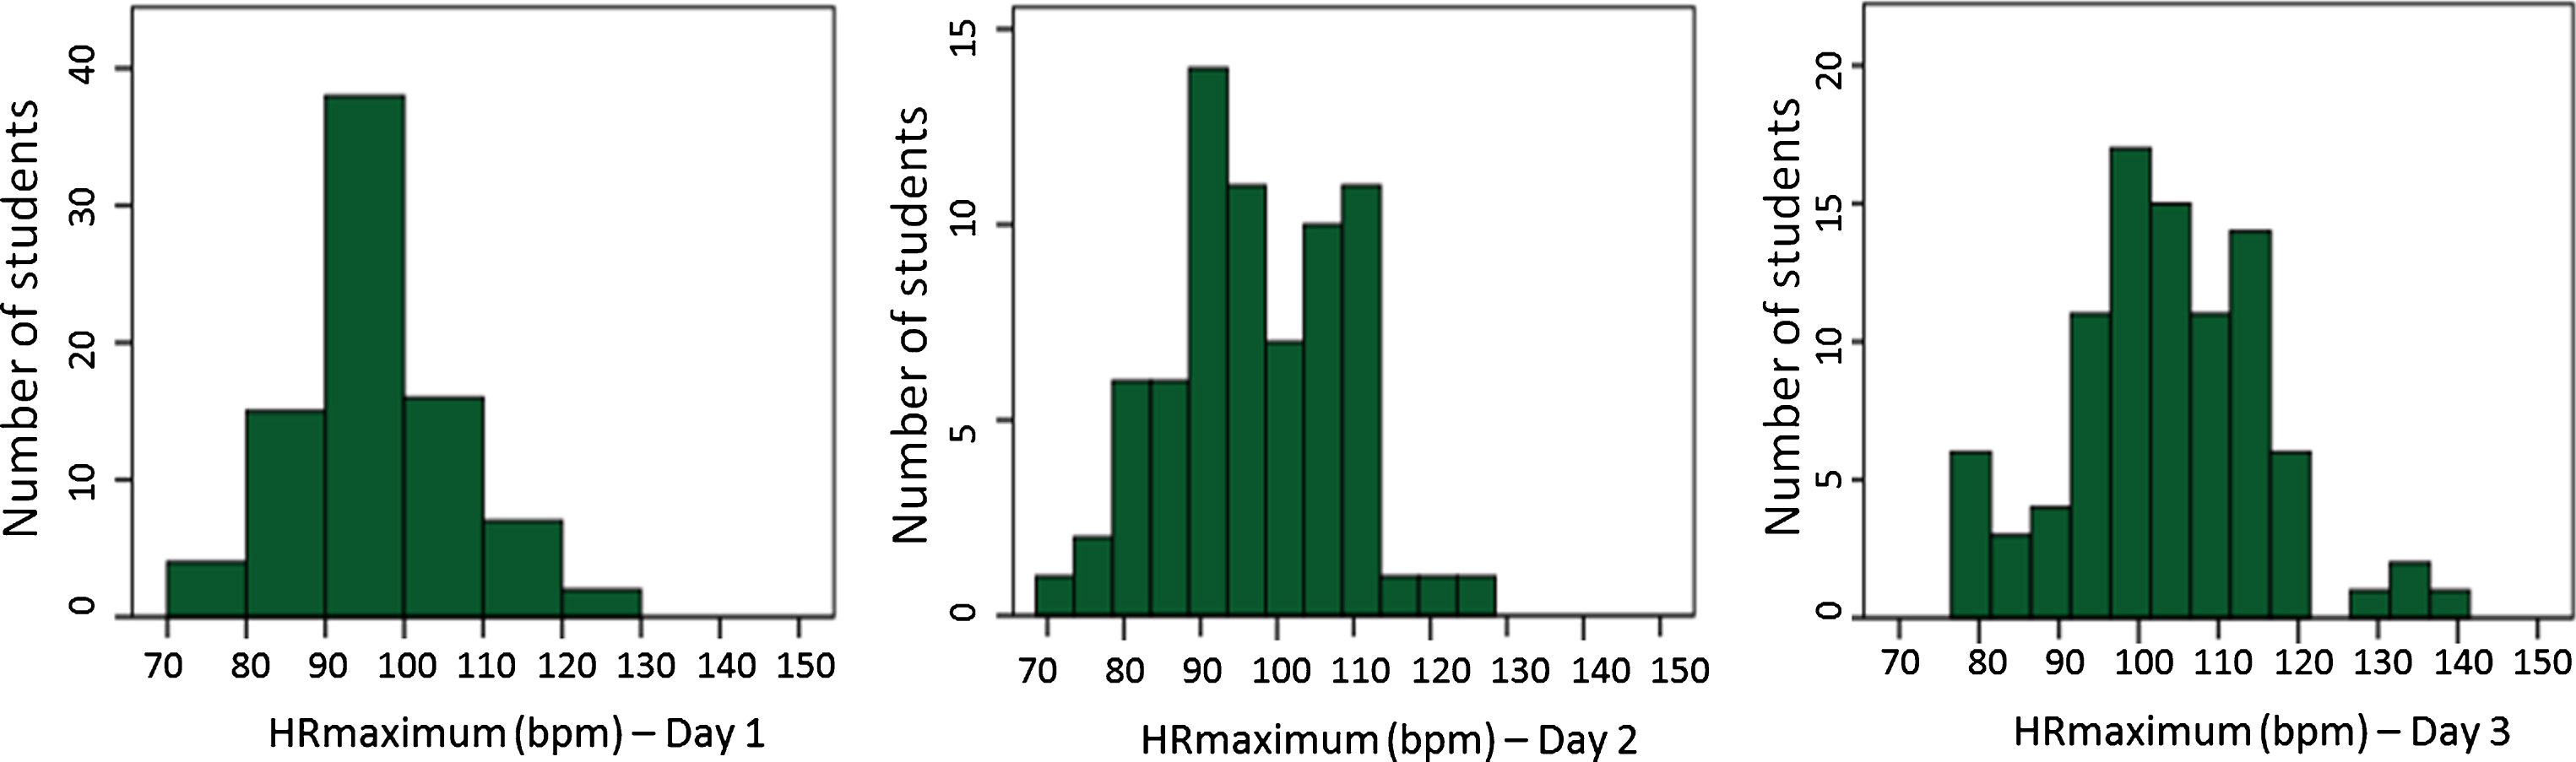
Distribution of the HRmaximum of all participants.
Mathematical model data
Note: <0.05*; <0.01**; <0.005***.
As Table 11 shows, the odds that the HR maximum of the students from institution A would be affected by an air temperature of 28–33°C were 15%. The corresponding proportion for the students from institution D increased to 32%. When all the analysed institutions were considered together, the percentage was 13.9%.
The cognitive performance of all the participants was assessed relative to the air temperature ranges (Fig. 3). The performance on the numerical reasoning test was best at the lowest temperature range. The results of the verbal and abstract reasoning tests were similar at all three temperature ranges. The results of the mechanical and spatial reasoning tests were similar for temperature ranges 1 (20–23°C) and 2 (23–26°C) and lower for temperature range 3 (26–33°C). Ina global analysis, the best performance occurred at the lowest temperature range (p-value = 0. 014), while performance decreased with increases in temperature.
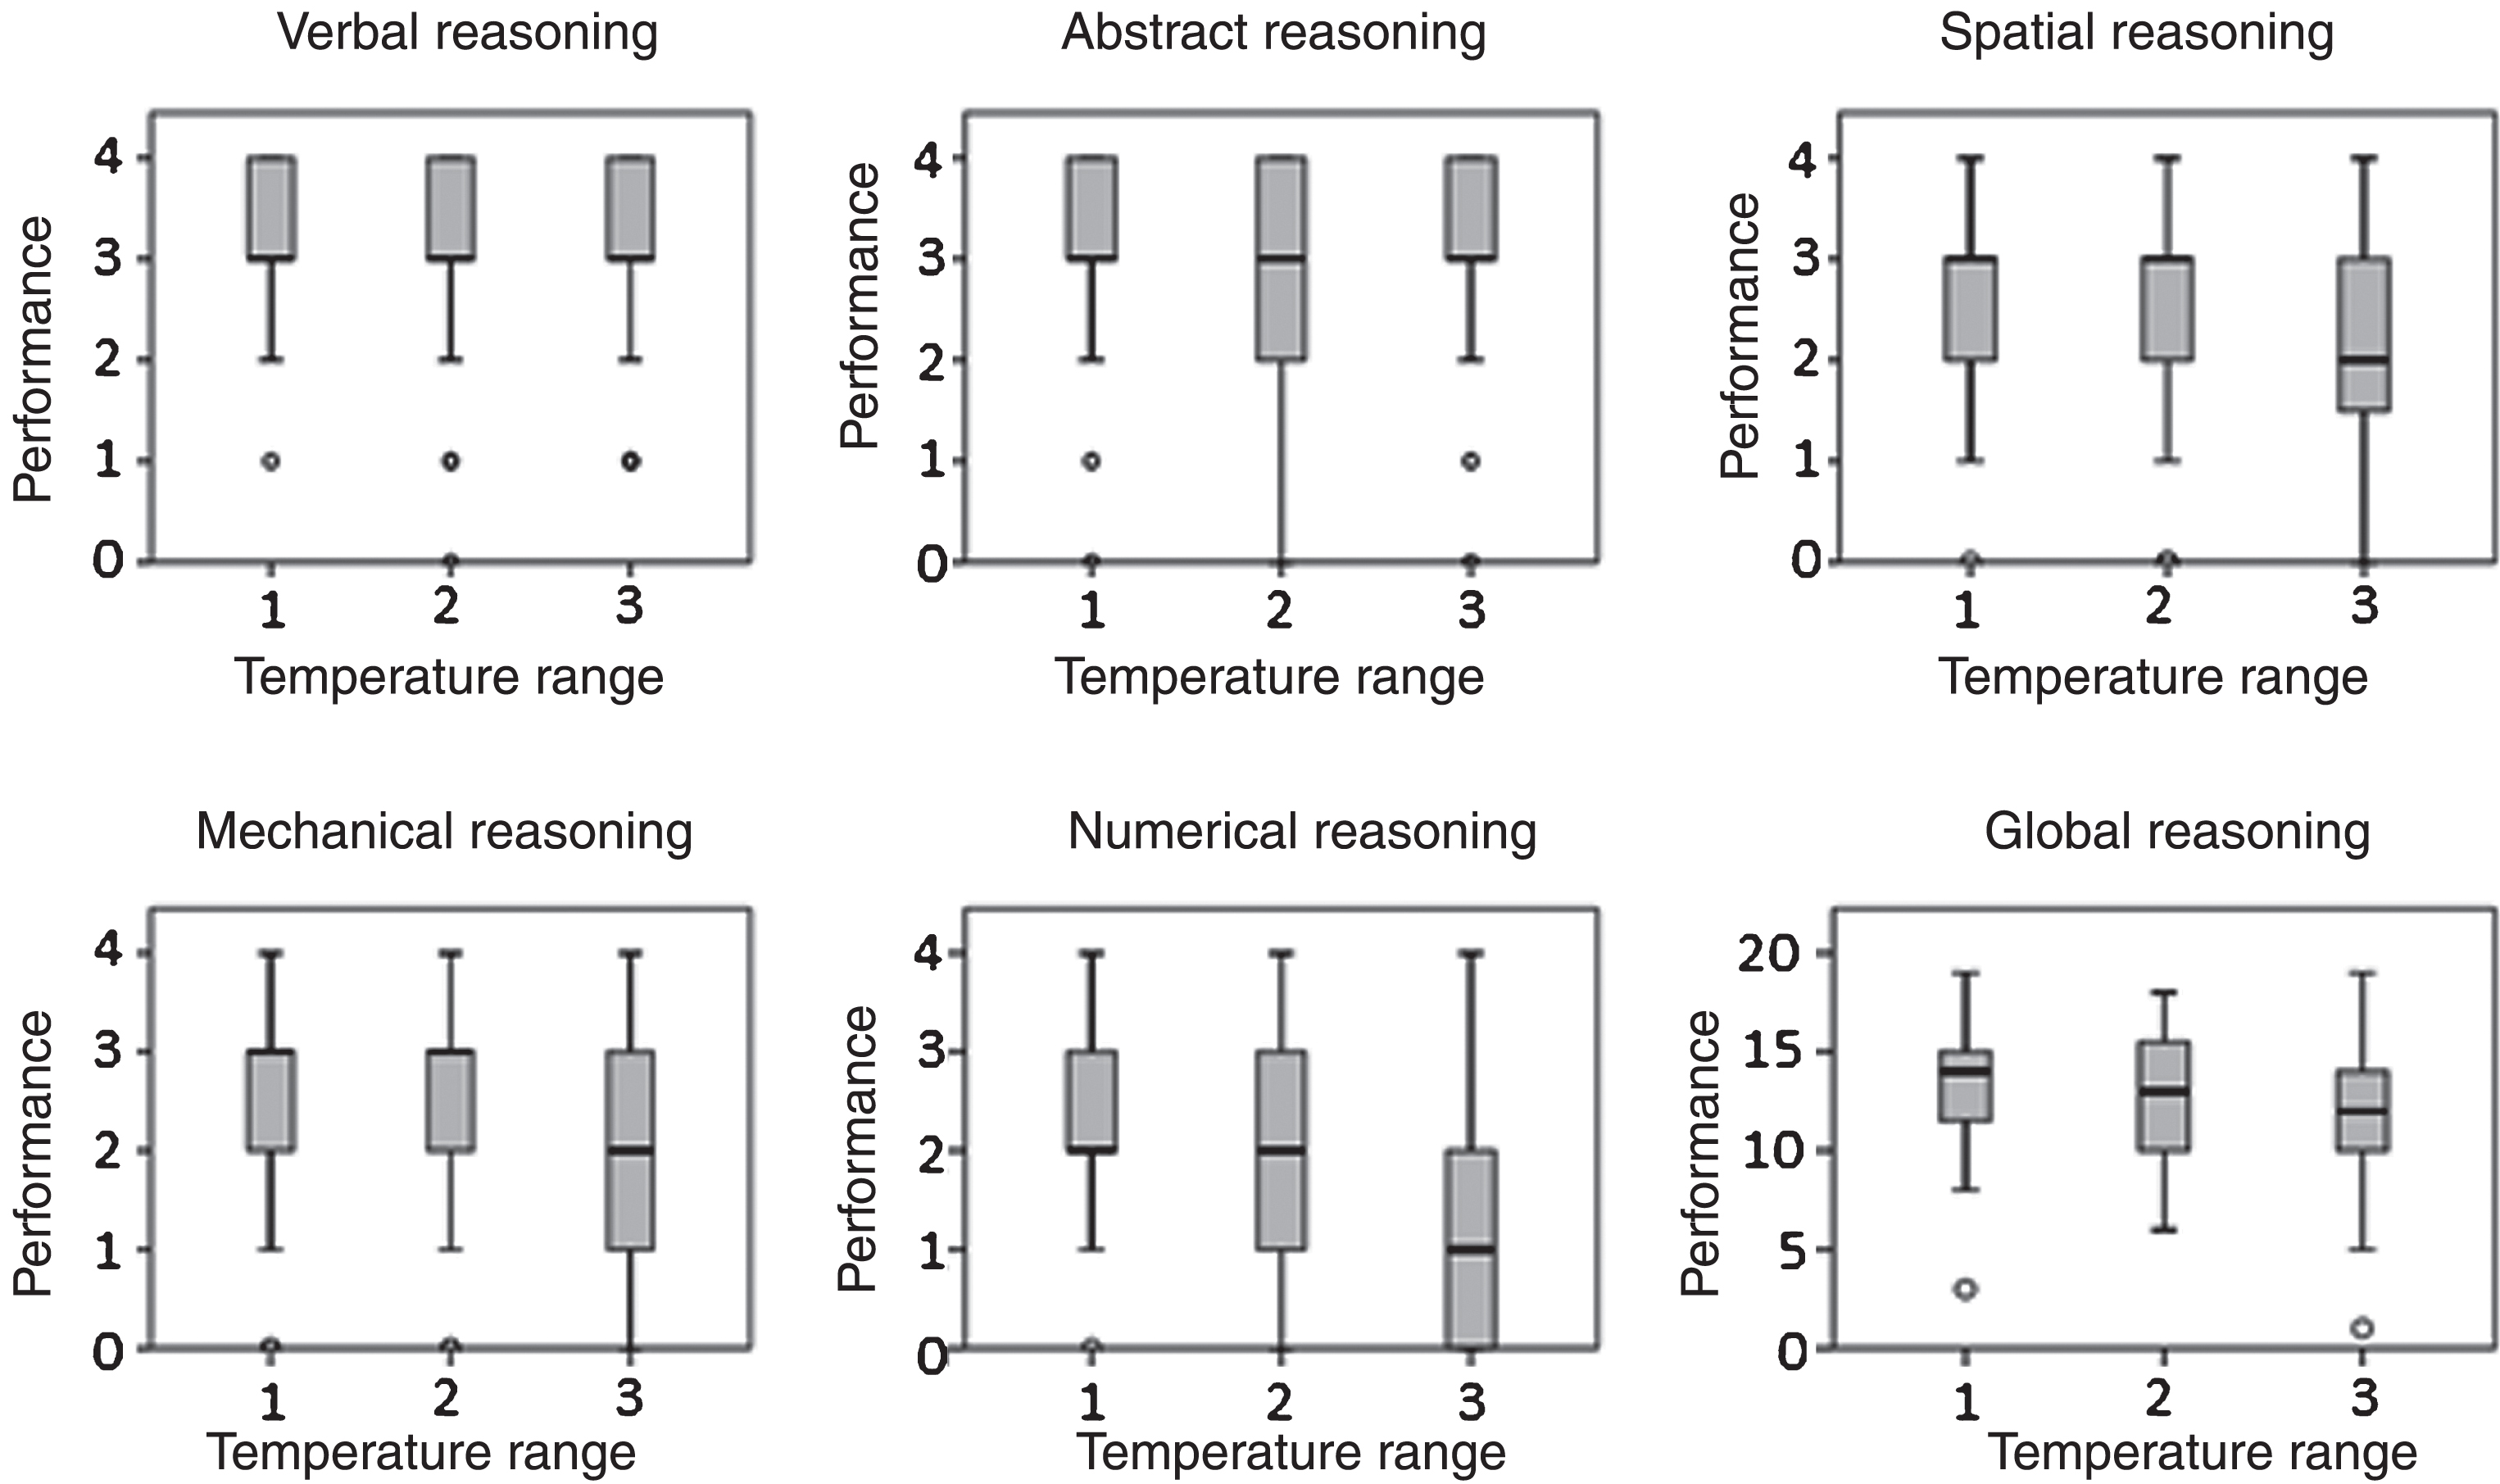
Cognitive performance.
No significant changes were detected in the students’ systolic arterial pressure across the three study days. However, the proportion of participants with systolic arterial pressure within the range corresponding to borderline level 1 hypertension was higher on the days with lower temperatures [39]. This finding was more noticeable among the students from Teresina (A) and Petrolina (B). Despite differences in diastolic arterial pressure among study days, it remained within the normal range in almost all the participants; borderline values were exhibited by just a few students from João Pessoa (C) and Petrolina (B).
Increases in blood pressure are mainly attributed to genetic and environmental factors; however, exposure to stressors such as cold, noise and pain might stimulate the sympathetic system, with a resulting in creasein vascular peripheral resistance and blood pressure [40–44]. Kuo et al. [45] found an important relationship between temperature decrease and blood pressure increase with potentially relevant implications, especially for individuals with some degree of cardiovascular impairment [45]. According to Breitner et al. [46], youths with borderline hypertension are more sensitive to decreases in temperature, and sympathetic activity in particular is higher in such cases [47]. Zomorodian, Tahsildoost and Hafezi [2] assert that the neutral temperature is higher among people residing in warmer areas and that consequently, those individuals become uncomfortable more quickly at lower temperature levels [2]. A reduction in the environmental temperature that produces thermal discomfort is sufficient to elevate the blood pressure, even after a few minutes of exposure to low temperatures [4, 47].
The frequency distribution for heart rate differed significantly among study days for the students from Teresina (A) and Manaus (D); the same was the case for HR final among the students from João Pessoa (C). These differences occurred on the day with the highest temperature. According to Charkoudian [48], changes in heart rate exhibited by individuals in environments characterised by thermal discomfort are related to activation of the thermoregulation system, which employs peripheral vasodilation and sweating to regulate body temperature [48]. Increased blood flow to the skin requires the cardiovascular system to maintain heart output, with a consequent increase in cardiovascular parameters [49].
The differences in the heart rate found among the students from different institutions may be associated with local adaptive processes that occur in areas with high temperatures. According to Haddad, Osmond and King [50], body metabolism is higher among students in warmer areas [50]. Zomorodian, Tahsildoost and Hafezi [2] proposed that the value of the neutral temperature varies considerable according to climate because continuous exposure to atropical climate might prepare the body to produce more efficient responses, such an increase in the number of sweat glands in individuals who grow up in such areas [2, 13].
Some participants exhibited a heart rate over 100 bpm, which indicates tachycardia [35]. This finding was more remarkable among the students from Teresina (A) and Manaus (D). Consequently, the relationship between heart rate and air temperatures of 20 to 33°C during the performance of cognitive tasks was assessed for these students. The data described in Table 11 show that among the students from Manaus (D), the risk of presenting a heart rate over 100 bpm increased 32% per 1°C increase in air temperature. This risk decreased to 15% among the students from Teresina (A) and to 13% when all institutions were analysed as a group, as a low number of students from Petrolina (B) and João Pessoa (C) had a heart rate over 100 bpm. With a temperature range of 28 to 33°C, i.e., when the air temperature was higher, the risk of presenting a heart rate above 100 bpm was 45% to 52% for the students at institutions A and D.
Heart rate is quite sensitive to the demands of the sympathetic and parasympathetic systems, and variability in heart rate is a sign of adequate adaptation that characterises healthy individuals with efficient autonomic mechanisms [48, 51]. However, high heart rate at rest is a cardiovascular risk factor, even for healthy individuals and it could further exacerbate an individual’s cardiovascular peculiarities [52–54].
Relative to the thermal perception of the environment, most of the students from Teresina(A) and Petrolina (B) felt discomfort at the lowest temperatures tested, which were near 20°C. This finding was unexpected because these participants resided in areas with warm weather; in addition, their metabolism rate was high because they were young adults and were mostly males. This result might have been due to an increase in the neutral temperature, which Zomorodian, Tahsildoost and Hafezi [2] reported is more common in areas with a tropical climate [2]. The magnitude of physiological adaptation depends on the variations in temperature to which individuals are exposed [55].
These findings are consistent with the ratings of most of the students from all four investigated institutions, who reported feeling discomfort at higher air temperatures. Discomfort was expected because of the activation of the thermoregulation system at temperatures above 28°C [56]. According to Singh, Mahapatra and Teller [57], it is not possible to define comfort ranges for individuals from different climate zones because comfort depends on expectations, perceptions and social factors rather than on the physiological responses of the human body alone [57].
In the present study, some of the students at three institutions scored lower on the BPR5 cognitive test on the day with the highest temperature, which was also the day when HR maximum exceeded 100 bpm. Studies such as those by Wargocki and Wyon (2006), Mäkinen et al. [58], Thamand Willem (2010), Lee et al. [60], and Vimalatan and Batu (2014), reported similar findings relative to the participants’ performance [9, 58–61]. The discomfort caused by temperature elevationcan trigger irritation, fatigue and changes in workload perception, with consequent effects on performance [62]. Additionally, high heart rate can cause symptoms such as palpitations, weakness and even dizziness that can further contribute to the feeling of discomfort in thermally uncomfortable environments.
Conclusion
Several studies have assessed the relationship between cardiovascular parameters and air temperature; however, those studies examined the association between the development of certain diseases and high or low temperatures. Hensel et al. [65] observed that few studies have investigated the association between health problems and changes in moderately high or low temperatures [60]. In the present study, moderate temperature ranges (from 20 to 30°C) were tested in the classrooms where the participants completed the cognitive tests and underwent heart rate and blood pressure measurement. Thus, no significant changes were detected in the participants’ blood pressure. In most cases, blood pressure was rather stable in response to changes in the environmental temperature.
However, when the air temperature was close to 30°C, the heart rates of the students from institutions in Teresina and Manaus increased above the upper limit of normal (>100bpm). This elevation may have been associated with the air temperature in the classroom (30°C) and the fact that data collection was performed at a time when the external air temperature was approximately 35 to 42°C in both cities. This finding agrees with the student’s thermal perceptions because on the day their performance was best, the internal air temperature was not high, they reported feeling comfortable with the temperature. There were significant differences in the heart rate of the students between the three days of the experiment.
Conflict of interest
None to report.