
Abstract
BACKGROUND:
In workplaces heavily reliant on visual tasks, various factors can significantly influence an individual’s performance, necessitating the use of reliable tools to identify and mitigate these factors.
OBJECTIVE:
This study aimed to develop a swift assessment method for visual ergonomics and lighting conditions, evaluating its validity in real-world scenarios.
METHODS:
The questionnaire’s content validity was determined by a panel of experts using the content validity ratio (CVR) and content validity index (CVI). Construct validity was assessed through exploratory factor analysis (EFA), confirmatory factor analysis (CFA), and latent class analysis (LCA). Internal consistency was measured using Cronbach’s alpha coefficient. The RAVEL index, derived from the calculated effect coefficients of items, classified total scores through receiver operator curves (ROCs).
RESULTS:
The rapid assessment method, comprising two parts with 30 items, demonstrated acceptable reliability with CVR, CVI, and Cronbach’s alpha coefficient (α) at 0.75, 0.87, and 0.896, respectively. The EFA on the first part’s 22 items identified three factors, confirmed by CFA. The LCA on the second part’s eight items revealed that a two-class model best fit the data, with Bayesian information criterion (BIC) = 24249, 17, Akaik information criterion (AIC) = 2179.89, and an entropy R-squared of 0.83, indicating appropriate subject classification based on the model. The RAVEL score was categorized into three levels, with optimal cut points of 55 and 63.
CONCLUSIONS:
In conclusion, the study demonstrated that this method based on visual ergonomics serves as a rapid and reliable tool for assessing visual ergonomic risks of display users in the workplace.
Keywords
Introduction
In recent decades, visual displays have undergone rapid technological advancements and have become an integral part of modern life, having a significant impact on human-system interaction. They are essential in various aspects of daily life, such as work, communication, and education [1]. However, this increased use of computers has several consequences, and its effects on people’s health have been the subject of numerous studies [2–4].
Various factors affect visual and musculoskeletal problems in computer users, including physical environment factors (lighting, ergonomics, and workplace design), work task factors (subject matter, vision, contrast, and readability), and visual ability factors (visual acuity, age, and visual impairment) influence the visual environment of people [5–7]. The visual work environment can also impact human productivity in different ways [5]. Extensive research has been conducted on the potential effects of visual problems [8] and musculoskeletal disorders [9, 10], together with lighting and luminance conditions [11].
Visual environment conditions and visual factors
Computer users may face new visual challenges while working with such tools in their work environment. Studies have shown that nearly 75% of computer users experience visual problems with asthenopic symptoms, visual blurring, dry eyes, and long-term work with monitors can lead to eye signs and symptoms in 66% of users [5, 12–14]. According to a review study by Parihar et al., the prevalence of Computer and Visual Display Terminals (VDT) Vision Syndrome (CVDTS) ranges between 9 and 90% [15]. One study of reported complaints found that eye strain was the most common complaint in over 80% of people, particularly in those who used a video display terminal (VDT) for at least 7 hours a day, as opposed to those who used screens for shorter periods of time [16]. In a study by Darsanj et al., 24% of participants reported moderate eye fatigue, while 43% reported severe eye fatigue. Furthermore, the number of hours spent using a computer was directly related to vision problems and eye fatigue [2]. In Shrestha et al.’s study, office workers who used computers for an average of 7 hours a day experienced decreased visual acuity and teary, and the most common symptoms were dry eyes and headaches [17]. Meanwhile, a 10-year follow-up study by Larese Filon et al., on 3054 office workers found that eye fatigue was the most common visual disorder in VDT users, and was associated with anxiety, the duration of VDT use, the use of corrective lenses, and stress [18]. In another study by Noreen et al., 67.2% of participants claimed to have experienced at least one symptom related to computer visual syndromes, including headache, eye fatigue, burning sensation, eye burning, shoulder and neck pain. The prevalence of ocular symptoms included eye irritation (48%), burning sensation (33%), eye fatigue (15%), while non-ocular complaints including shoulder and neck pain (21.8%) and headache (38%). Eye fatigue and headache were also related to the amount of time spent using computer (4 hours) [19]. In addition, studies have shown that if the task content is mentally challenging, eye blink frequency may decrease, which can be a risk factor for dry eye symptoms [20, 21]. Other factors that may be related to these issues include underlying problems with double vision, underlying eye diseases, and the use of corrective glasses or lenses [22, 23]. Various studies have also shown that a regular rest time can improve the quality of work and increase working performance [24, 25]. Additionally, regular rest breaks increase the power of adaptation and reduce symptoms of eye fatigue [26].
Furthermore, non-visual exposure, such as flicker and glare from materials and work surfaces [27, 28], lamps [29], screens, or windows, can cause eye discomfort and reduce visual performance or other visual disturbances such as headaches [7, 30]. Studies have found that glare is associated with visual disturbances that are clearly linked to neck and shoulder pain. Appropriate interventions can increase illuminance and decrease glare and musculoskeletal disorders [4, 32]. On the other hand, the luminance of the screen should be proportional to the luminance of the work environment and should not cause glare for the user. A significant difference between the luminance of the screen and environment, can lead to problems such as burning, tearing, fatigue feeling, and eye dryness [33, 34].
Display adjustment and musculoskeletal disorders factors
Multiple factors contribute to musculoskeletal disorders, including work organization, job design, technology [35], environment [36], and economic conditions [37]. Studies have also shown that the use of computers can lead to musculoskeletal disorders (MSDs) associated with visual demands [3, 38]. In the Ricco et al. study, Inappropriate workstation design was confirmed to be an important risk factor for MSDs [39]. The results of a study performed by Bergqvist et al. showed that improper hand posture and inappropriate keyboard position and lack of lower arm support can led to arm-hand problems, highlighting important factors that contribute to musculoskeletal problems among VDT operators [40]. In the Das et al. study, on VDT users, the most common musculoskeletal complaints included pain in the lower back (61.5%), neck (45.2%), and shoulder (39.4%). These complaints were significant related to not employing preventive measures, working longer hours (Total computer use/day≥8 hours), and having an incorrect viewing distance [3].
The results of studies have shown that the upper limbs and neck are the most commonly affected areas in musculoskeletal disorders [41, 42], However, it is important not to ignore the involvement of the lower back and lower limbs [43–45].
Related tools and questionnaires
To prevent the problems as mentioned above in the workplace and to evaluate the influential factors in all aspects of the work environment, such as workstation conditions and user’s visual comfort, valid and reliable methods are needed [46, 47]. Several tools have been introduced to assess visual function and musculoskeletal disorders among computer users, each with a set of questions on eye disease, workplace conditions, and musculoskeletal disorders [48, 49]. One such tools is a questionnaire developed by Steenstra et al., which is a reliable tool for easy assessment of eye complaints in office work. However, it is important to consider the time of day when the questionnaire is completed [50]. Seguí et al. designed and validated a computer vision syndrome questionnaire to assess visual symptoms related to the use of VDT. This tool only considers visual symptoms in the workplace and does not address other aspects affecting visual ergonomics as musculoskeletal disorders and visual design [48].
Heiden et al. developed the Visual Ergonomics Risk Assessment Method (VERAM), a risk assessment tool that includes subjective ratings via questionnaires as well as objective assessments (performed by trained assessors) of the risks in the visual environment. Both work tools and workload assessments are included in VERAM. The VERAM's questionnaire includes eyestrain, musculoskeletal strain, subjective rating of the visual environment (such as to bright luminaires in the visual field, i.e., glare), visual ability, headache, and migraine. The VERAMs objective risk assessment includes measurements of luminance and illuminance, risk assessments (red-high risk, yellow – low risk and green – no risk) for eight different factors such as musculoskeletal load, work task (visual angle to screen and other screen settings/types or settings for “other work”) glare, illuminance levels, daylight, and flicker [51]. However, ergonomic conditions of work tools should also be considered in evaluating work environments in this tool.
The visual ergonomics encompasses various environmental and occupational aspects [52]. Therefore, to comprehensively assess hazards related to visual ergonomics in the workplace, it is necessary to consider the specific demands of the workstation and job [1, 32]. However, a literature review of various studies reveals that existing measurement tools have predominantly focused on only individual aspects, such as visual symptoms or musculoskeletal disorders [48, 53]. Additionally, practical limitations, including cost and experts, hinder the use of objective tools in environmental assessments. Hence, there is an increasing need for a novel approach to visual ergonomics assessments that leverages subjective measurements. Also, developing a comprehensive tool to assess people’s workplaces and determine visual ergonomic problems can help provide effective control solutions to reduce these problems in visual environments. This study introduces the RAVEL method, which provides a rapid yet comprehensive approach to assessing visual ergonomics and lighting conditions. Unlike traditional evaluations, the RAVEL process simplifies assessment and focuses on various visual ergonomics dimensions, including visual comfort, musculoskeletal disorders, and environmental and task-related visual conditions. Rigorous development and psychometric evaluation ensure the reliability and practical suitability of RAVEL for enhancing workplace well-being and productivity. Therefore, this study aimed to develop and evaluate the psychometric properties of this new method, intending to provide effective solutions for reducing visual ergonomic problems in the workplace. The objectives of the study are summarized into two important issues: Researching and finding visual ergonomics and lighting condition affecting factors Investigating the relationship between visual ergonomics, lighting conditions, and their impact on performance and eye discomfort Designing and development of the initial questionnaire Determining the face and content validity of the questionnaire Determining the construct validity of the questionnaire Determining the reliability of the questionnaire Determining the final score and categorizing the final scores of the questionnaire Development of the final version of the new questionnaire
Methods
Study design and participants
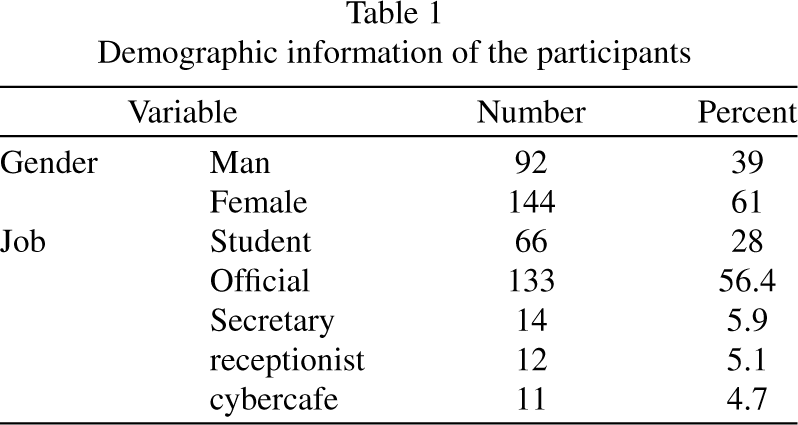
This cross-sectional analytical study was conducted in 2023 to develop and validate a tool for assessing ergonomic risk factors among 236 computer users with various occupations, including office workers, students, receptionists, cybercafé users, and secretaries. These occupational categories have shown impressive prevalence of visual ergonomics-related injuries [54]. The study’s first step involved reviewing existing valid texts and articles, followed by evaluating the tool’s validity and reliability using both quantitative and qualitative methods [48, 51]. The expert panel’s inclusion criteria required a Ph.D degree in occupational health and ergonomics and at least one year of work experience as a faculty member, At the same time, incomplete answers to the questions provided served as exclusion criteria. This multiprofessional expert panel is briefed by Beaton et al. to conduct the expert review [55].
For the users, inclusion criteria were determined based on the of expert panel’s opinion and included having daily activity with a computer monitor and not having conditions such as migraine and sinusitis [56]. Exclusion criteria for users included their unwillingness to cooperate in answering questions [39]. The steps of the study were explained to participants by an occupational health and ergonomics expert via face-to-face, and they confirmed the informed consent. Accordingly, this study was conducted based on the following steps (Fig. 1).
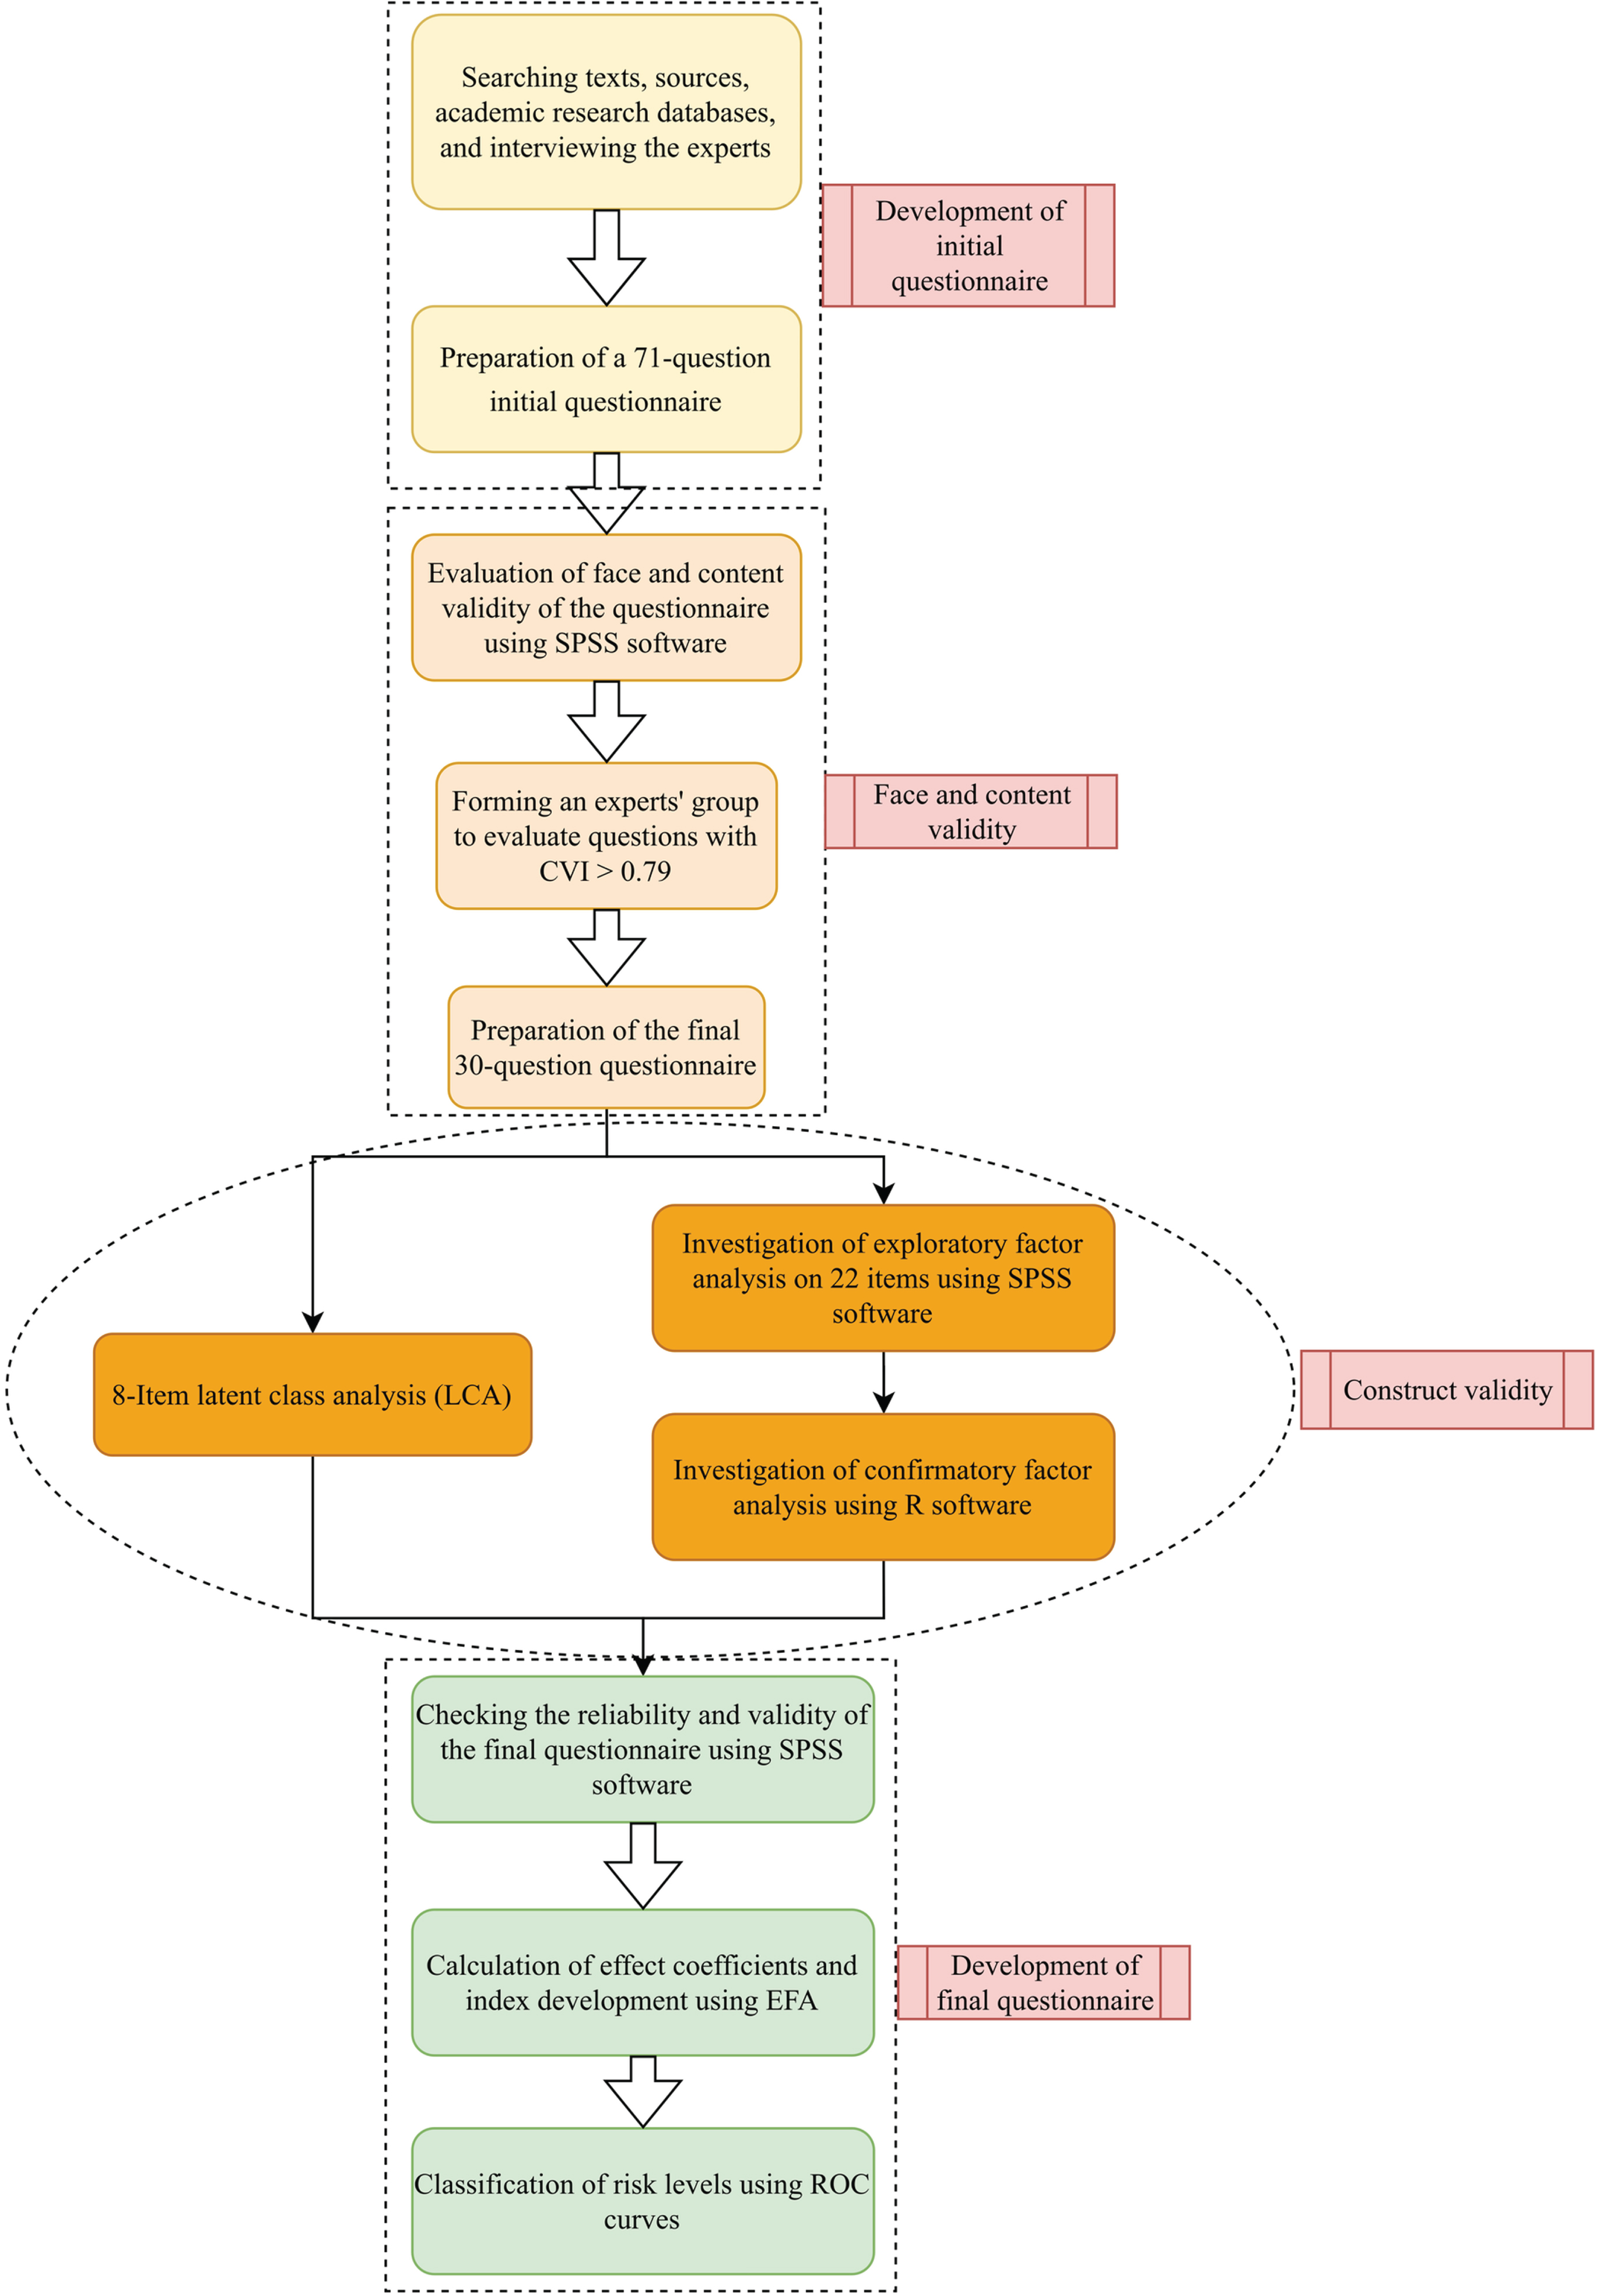
Study flow diagram.
To identify effective and relevant items for the questionnaire, a systematic review was conducted using various databases, including Web of Science, Scopus, PubMed and Science Direct. The review covered articles published between 2000 and 2023 and used keywords such as ‘visual ergonomics’, ‘visual discomfort’, ‘musculoskeletal disorders’, ‘Visual Performance’ and ‘Eye Strain’ and ‘Lighting’. The review identified 4953 articles related to the keywords and title, of which the research team examined approximately 450 articles. After reviewing the relevant studies, the identified items were investigated for the design of the initial version of the questionnaire, and irrelevant and duplicate items were removed. To determine the appropriate answers for each item, the research team consulted with five ergonomics and occupational health experts. The draft questionnaire was then sent to the relevant experts, and modified several times based on their feedback. The initial questions were then designed using information gathered from the interview and search results. The result is a comprehensive questionnaire that covers various aspects of visual ergonomics and is validated by experts in thefield.
Face and content validity
To confirm face validity, we engaged five experts in ergonomics and occupational health, who had prior research experience in visual ergonomics to participate in interviews and surveys. These experts were identified through the Iranian Scientometrics Information Database (ISID). The items were qualitatively evaluated in terms of level of difficulty of the concepts, ambiguity, appropriateness and necessity. These experts provided their opinions, and we modified or replaced the items accordingly.
To ensure content validity, we enlisted the help of 11 experts with research experience in visual ergonomics, consisting of six ergonomists and five occupational health specialists.
To assess the items, we employed a 3-point Likert scale to ascertain their necessity. Respondents were given the options of ‘essential (1)’, ‘useful but not essential (2)’, and ‘not necessary (3)’. Additionally, we evaluated the relevance of each item using a 4-point Likert scale, with options ranging from ‘not relevant (1)’ to ‘very relevant (4)’. We also assessed the clarity and simplicity of the items using a 4-point Likert scale, where options ranged from ‘not clear (1)’ to ‘very clear (4)’ and ‘not simple (1)’ to ‘very simple (4)’, respectively.
To determine the CVR and CVI, we employed the Lawshe and Waltz as well as Basel methods, respectively [57, 58]. CVR calculated using Eq. (1):
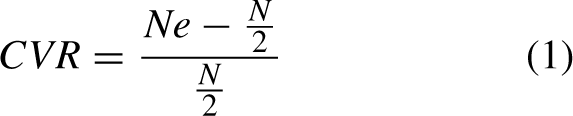
In addition, we calculated the average of all three criteria (relevance, clarity, and simplicity) for each question, which was considered the average CVI. A CVI value of more than 0.79 for each question was considered acceptable, while a CVR value of more than 0.59 was considered acceptable. Questions with a CVI of between 0.70 and 0.79 were corrected. Finally, the average values of CVI and CVR for the remaining questions were calculated.
There is currently no consensus on the appropriate sample size for studies using structural equations and tools. While one common method to calculate the minimum required sample size is to use the subject-to-item ratio [59]. A general rule of thumb is that larger sample sizes tend to yield more reliable results. Additionally, the appropriate sample size is influenced by the number of items being analysed. The sample size of 200 people has been determined for the size of the testing groups for prototype tools. Also, previous studies have recommended a minimum sample size ratio of 5 : 1 [60, 61]. In this study, we used a subject-to-item ratio of 10 : 1 as our minimum sample size.
Construct validity
The construct validity was assessed using both exploratory and confirmatory factor analysis as well as LCA [59, 60]. For this purpose, SPSS software version 26 (IBM Corporation, Armonk, NY) and the default model of the R statistical software version 3.2.2 were used.
Exploratory factor analysis
In the investigation stage of the EFA, the Principal Axis Factoring method was applied to extract the factors (structures) and the Varimax rotation method was used for the component period. To evaluate the adequacy of the model, we used both Bartlett’s Test of Sphericity and the Kaiser-Meyer-Olkin (KMO) sampling adequacy test. In this case, a KMO output value of more than 0.7 for this index indicates the optimal status of the factor analysis model based on the data. Additionally, if the p-value in the Bartlett’s Test is less than 0.05, it is considered confirmed. We also examined factor interpretability and retained items with a factor load above 0.3, preferably higher, for extracting factors [59, 62].
Confirmatory factor analysis
To confirm the factors extracted from the EFA stage, we utilized the CFA method. In this analysis, model fit indices, including chi-square/df, the root mean square of the relative error (RMSEA), the comparative fit index (CFI), and the Tucker-Lewis index (TLI) were evaluated. Acceptable limits for these indices were defined as relative chi-square higher than 0.05, CFI values higher than 0.9, TLI higher than 0.9, and RMSEA higher than 0.08[63, 64].
Latent class analysis
The LCA method was used to assess the latent structure of the visual ergonomics questionnaire. In other words, the level of visual ergonomics (work environment lighting conditions and display status) was considered as a hidden structure and evaluated using LCA. Unlike factor analysis, LCA does not assume that unobserved infrastructure variables (dimensions) are continuous and can be used for both classified and discrete variables [65]. This model examines the pattern of relationships between a set of observed classification variables (including workplace lighting conditions and display status) and classifies similar individuals into homogeneous lattice classes based on the desirability of lighting conditions and display status. This leads subjects within each latent class which are highly similar to each other and uniquely different from the other classes across the set of evaluated variables. Accordingly, comparisons can be made across latent classes with regard to correlates and other adjustment variables. In the LCA method, the adequacy of the fitted models was evaluated by comparing the Bayesian information criterion (BIC), the Akaik information criterion (AIC), and entropy indices among the models. A model with lower “BIC and AIC” values and higher “entropy” values indicates a better class fit and separation, respectively [65].
Reliability evaluation
To assess the reliability of the instrument, a draft of the modified questionnaire was completed by 236 employees working with a display on a daily basis. After the researcher reviewed the incomplete questionnaires, in order to avoid missing data from the type of missing at random (MAR) [66], the participant was reminded to complete them again. Then, Cronbach’s alpha (α) coefficients [67] were calculated for all the questionnaire questions as well as for each dimension of questions. Cronbach’s α measures how well a set of items measuring a construct fits together. Values of Cronbach’s α greater than 0.7 were considered acceptable. In addition, we calculated the item-total correlation coefficient (ITC), and considered questions with an ITC of more than 0.2 were considered as acceptable items [68].
Calculation of effect coefficients and index development
The collected data was analysed using SPSS software version 24. The EFA was used to calculate the effect coefficients of items, and the direct effect coefficients of items on visual ergonomics were calculated by the Varimax rotation method. First, the frequency value was multiplied by the intensity of each item and its score was computed. Then each of the coefficients were multiplied by the score of the related item, and the resulting values were added together to calculate the total score of the new index. After that, the new index was developed using the direct effect coefficients of the items in the model.
To determine the optimal cut-off points, the researchers completed a checklist, including observational questions based on the ROSA method [53] and the Occupational Exposure Limits (OEL) standard of Iran [69]. Additionally, the levels of luminance and illuminance in the visual environment of the participants were measured according to ISO/CIE 19476 : 2014. Objective observational questions were completed based on the results of measurements and field inspection conducted by occupational health experts. These questions included the values of illuminance and luminance of the workplace, the presence of flickering (blinking) of light sources, the type of lighting system, the colour of the lighting system, and the ergonomic workspace.
Classification of risk levels
Finally, ROCs analysis was used to classify the total score of the novel index [70]. In the ROC curves, the closest points to the ideal state were considered as the optimal cutting points.
Results
Participant characteristics
A total of 236 people participated in this study and completed the questionnaire face-to-face. The age range of participants was between 20 and 55 years and the mean±SD values of their age were equal to 31.5±7.4 years (Table 1). This range of different age groups can improve the generalizability and applicability of the study results.
Demographic information of the participants
Demographic information of the participants
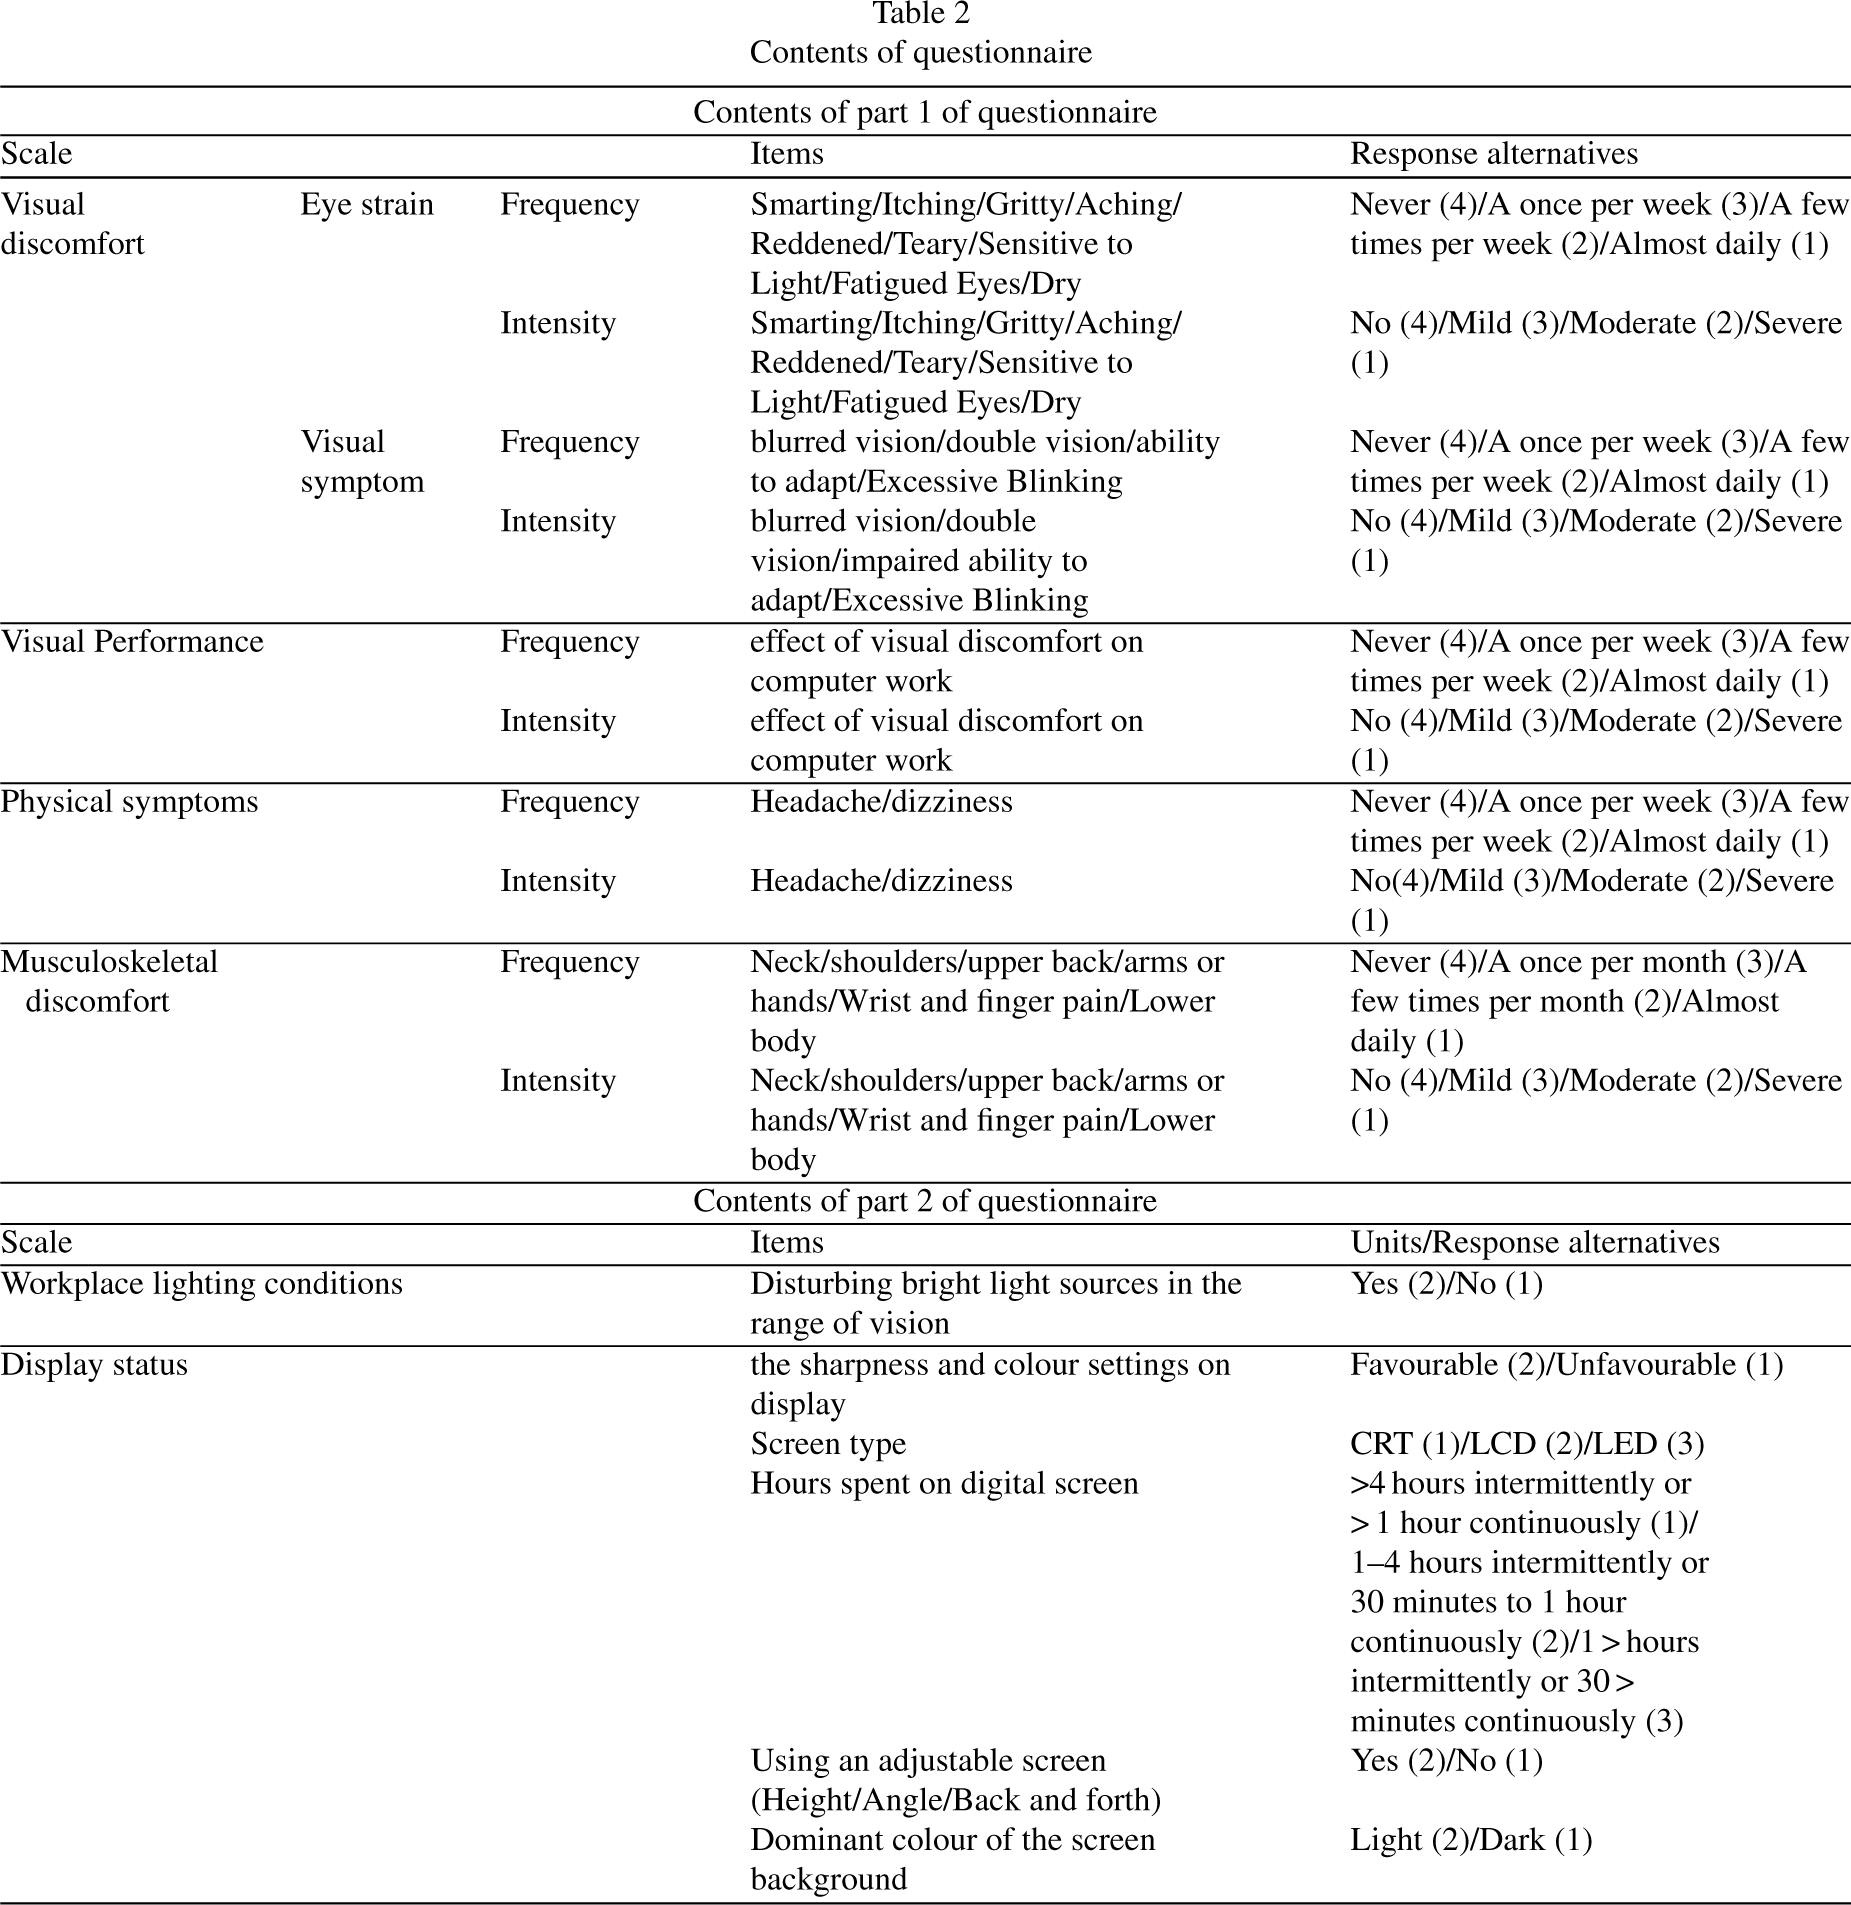
After conducting extensive research in scientific sources, and consulting with experts, we collected a total of 71 initial items for the questionnaire. These items were categorized into two parts. The first part assessed eye discomfort including two subscales of eye strain and visual disturbances, visual function, and physical symptoms experienced during the past week. The second part assessed musculoskeletal pain during the past month. For each item, the individual was asked to assess the extent of the disturbance and the perceived visual function. If a person reported any symptoms such as eye irritation (example e.g., frequency = 1), they were asked to evaluate the severity of those symptoms as well. To quantify the items, equivalent scores were assigned to each response based on the 4-point Likert scale, and the total score of each item was calculated by multiplying intensity by frequency.
The second part of the questionnaire included questions on workplace lighting conditions and display status. To quantify the items in this section, equivalent scores were determined for each answer and corrected based on the opinions of several experts. The answer options in this section ranged from 1 and 4 in some questions and from 1 and 3 in others (Table 2).
Contents of questionnaire
Contents of questionnaire
Face validity
After collecting all of the items, the face validity of the RAVEL tool was confirmed with the approval of five ergonomics and occupational health experts. The experts reviewed 71 items, and they removed or combined duplicate, unrelated, and unnecessary items. Based on their feedback, the draft-RAVEL tool was designed to assess content validity with 44 items (Table 2).
Content validity
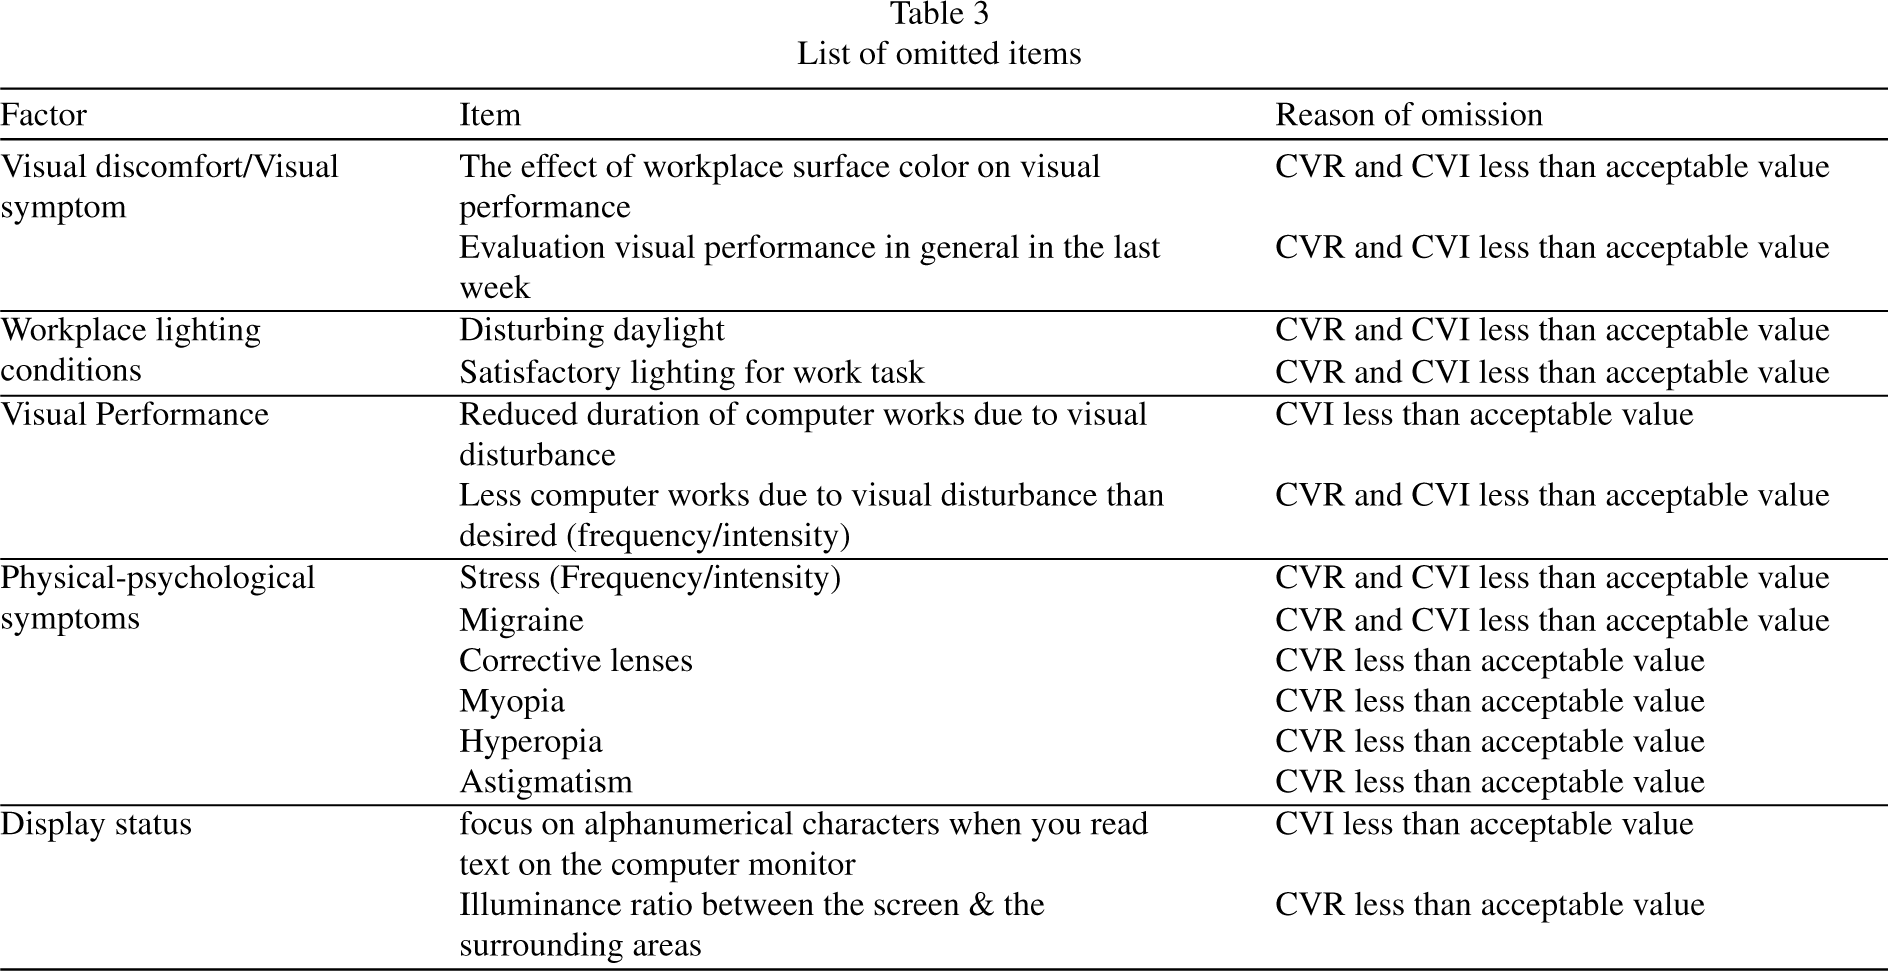
In evaluating the content validity of the initial questionnaire with 44 items by the experts panel, 14 items with CVI less than 0.70 and CVR less than 0.59 were removed. Ultimately, 30 items with the appropriate validity were retained in the study. Table 3 reports the deleted items after reviewing the content validity. Table 4 represents the CVR, CVI, and item-total correlation coefficient (ITC) values of the remaining questions. The mean values of CVR and CVI were calculated as 0.75 and 0.87, respectively. The values of ITC were not reported for items of Q23-Q30 due to the use of hidden class analysis for them.
List of omitted items
List of omitted items
The values of CVR and CVI of remained questions
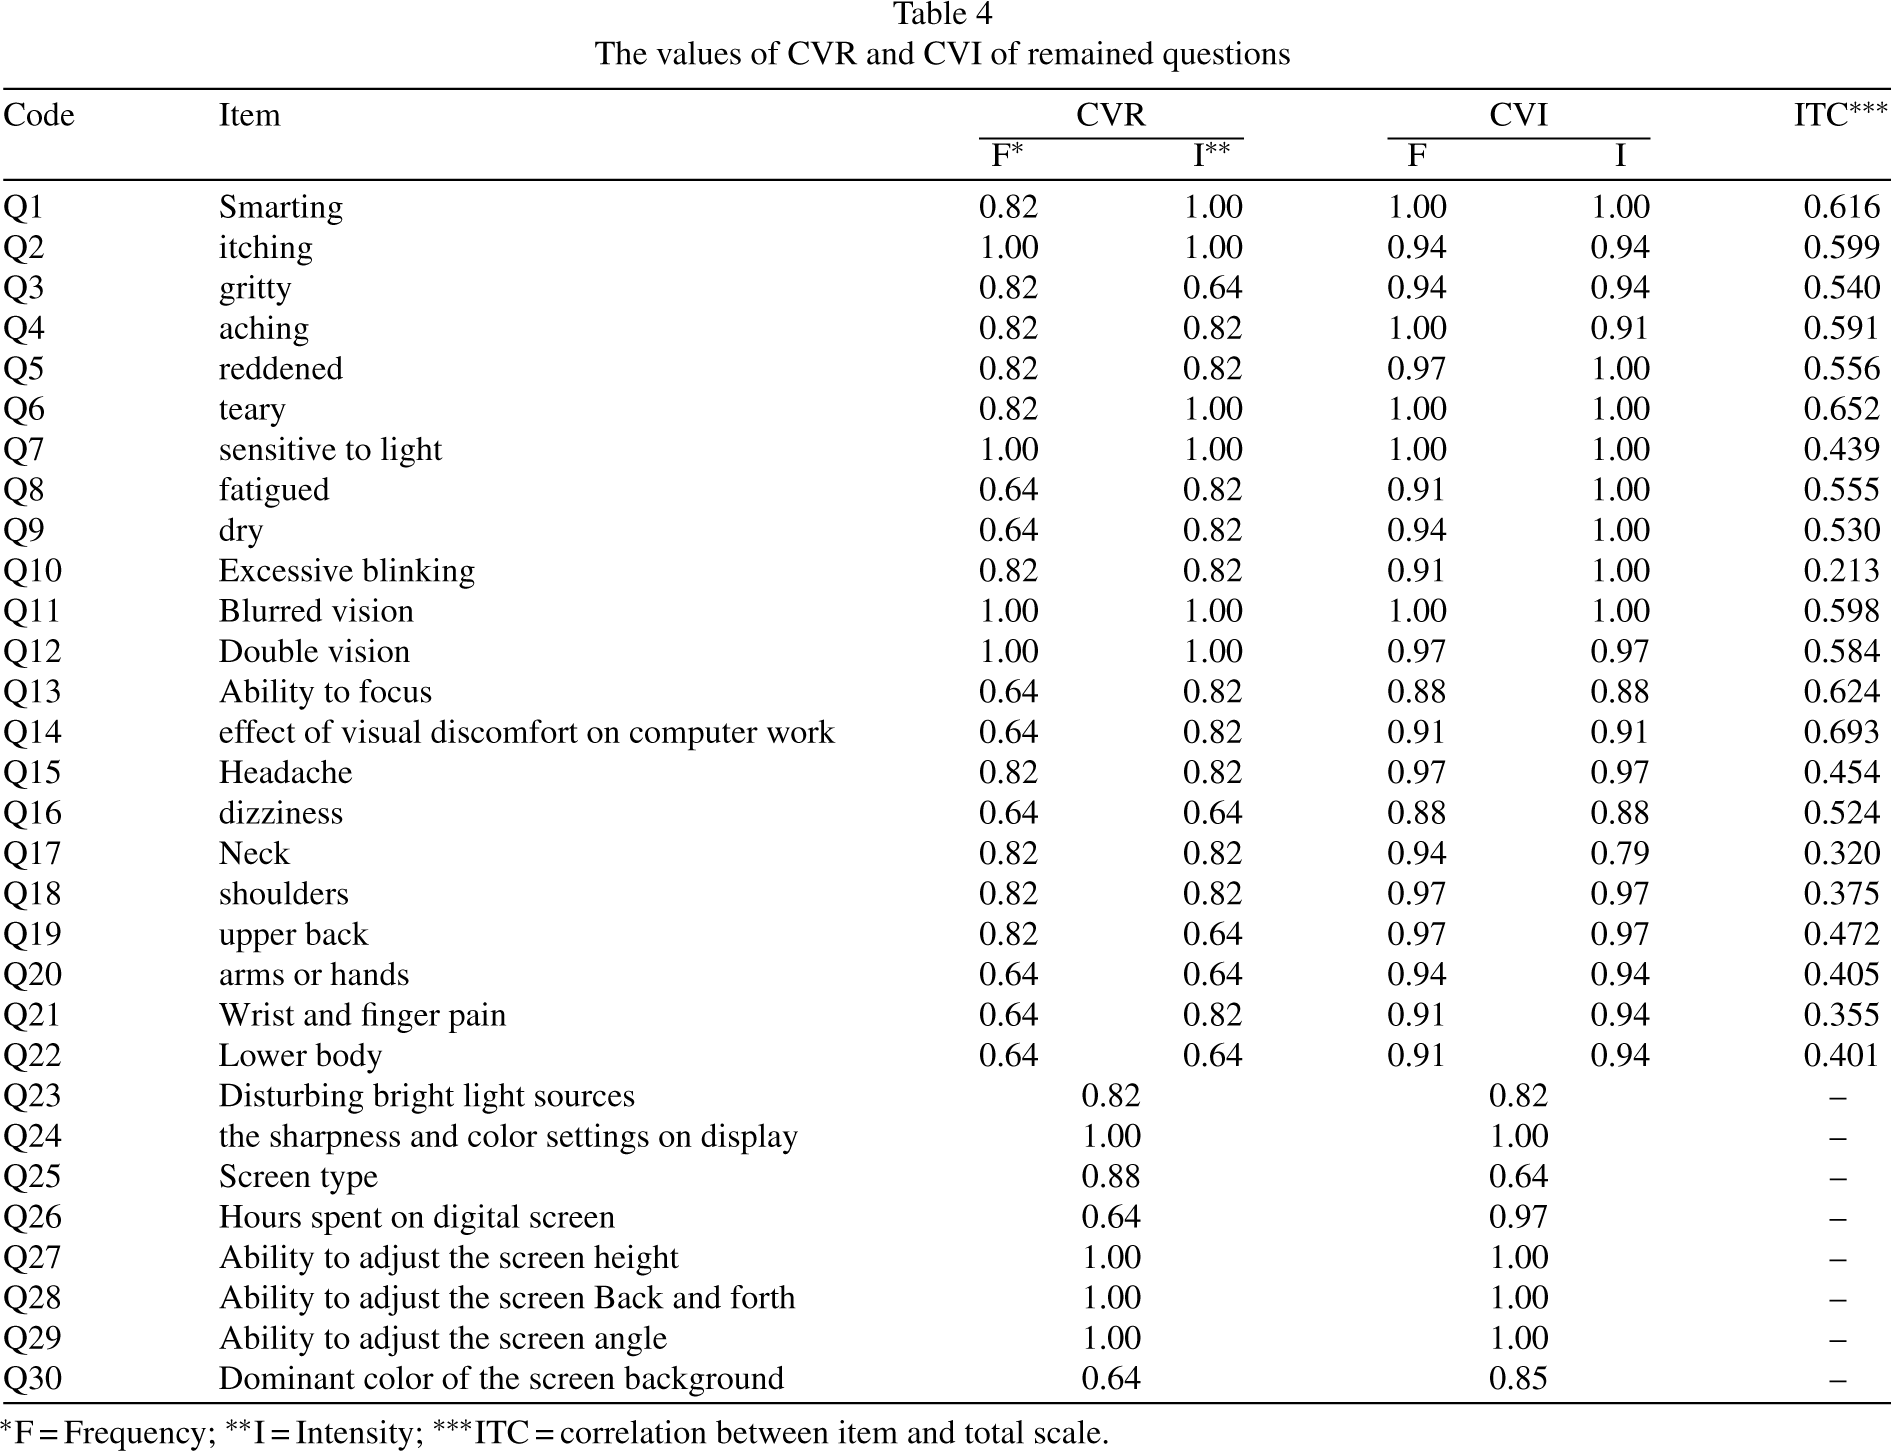
*F = Frequency; **I = Intensity; ***ITC = correlation between item and total scale.
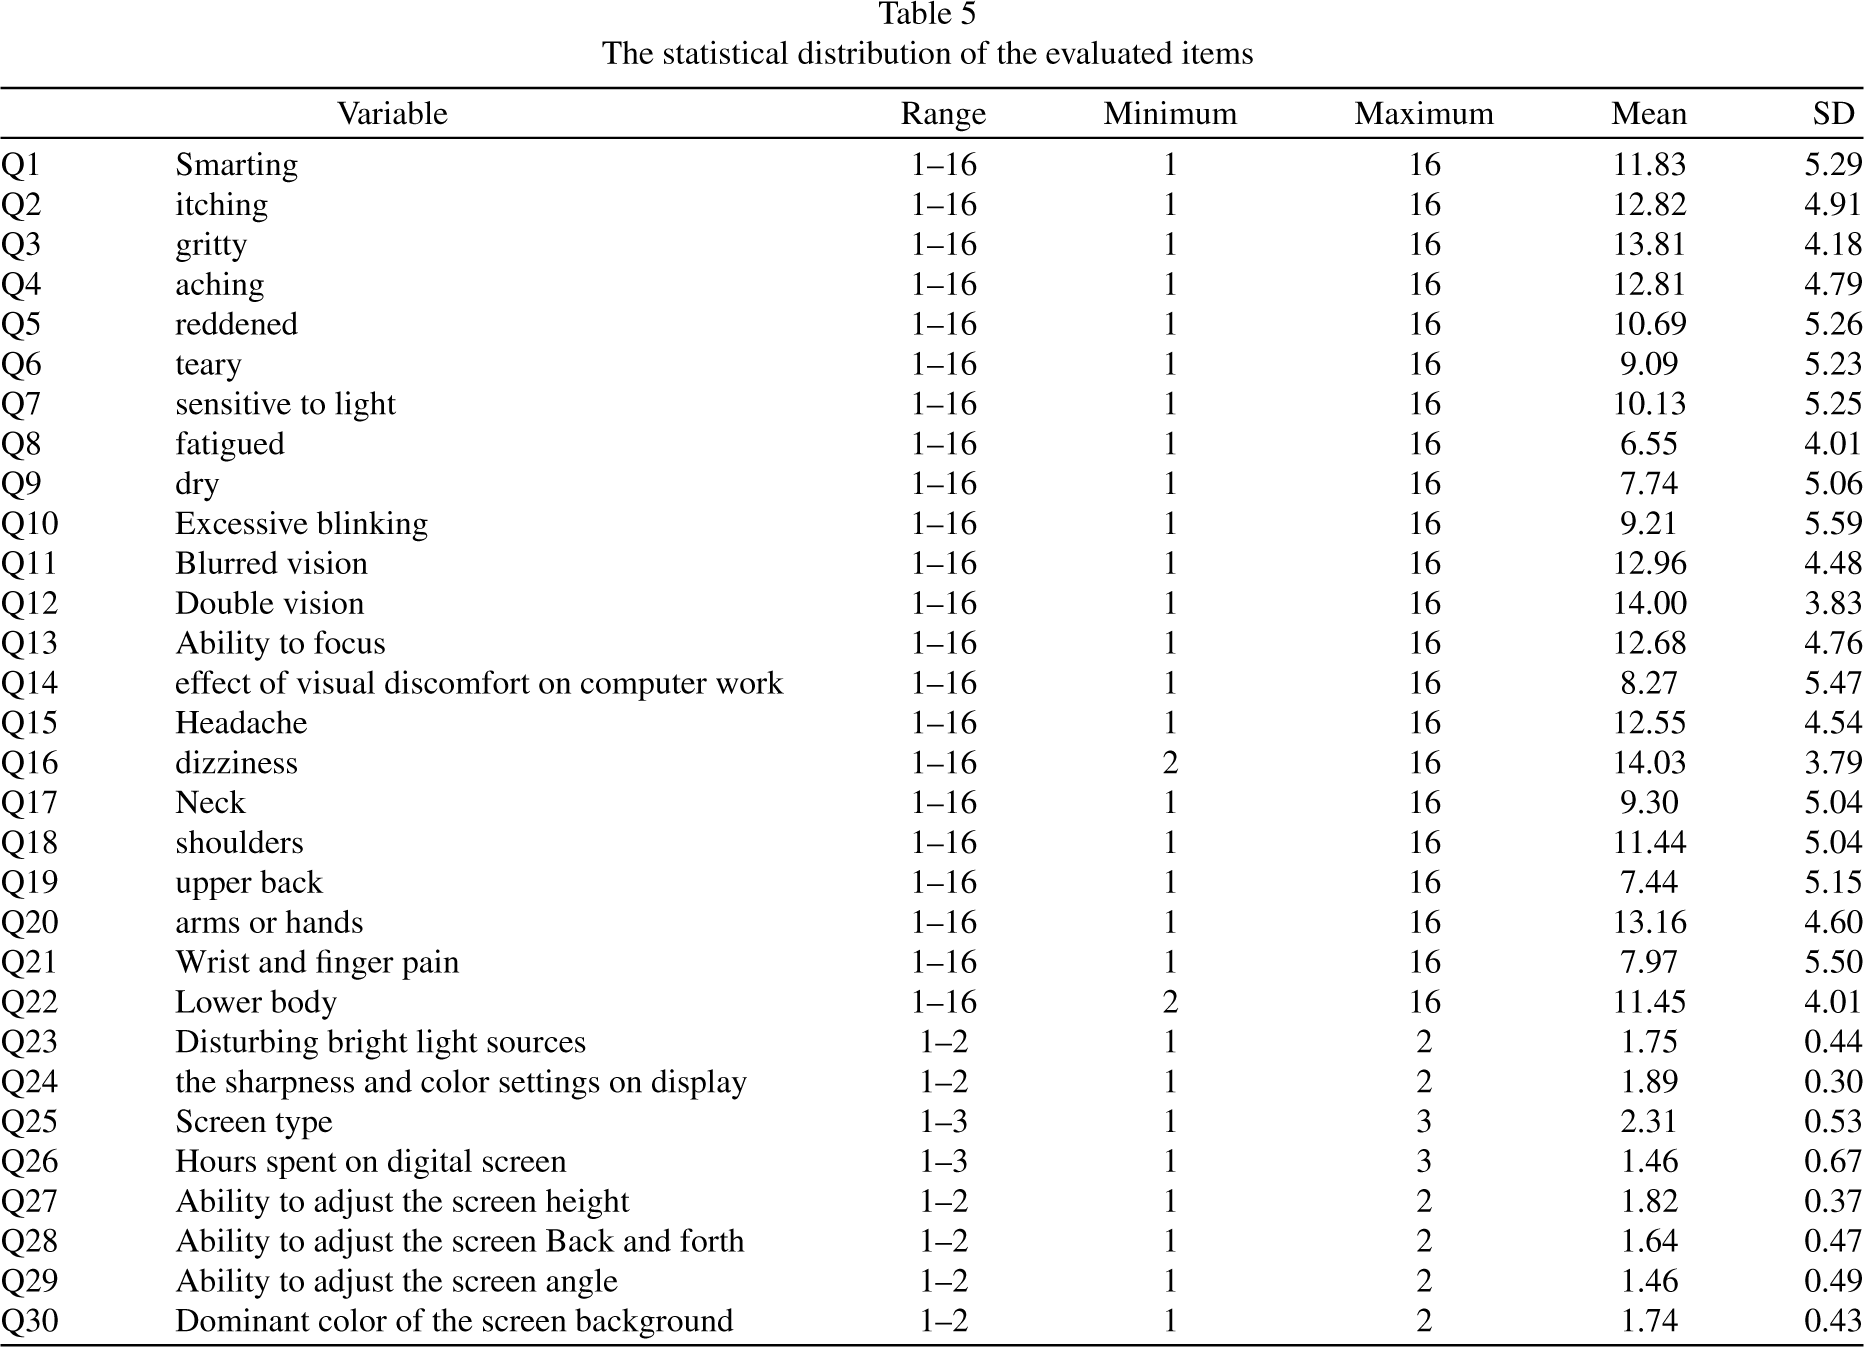
Table 5 also provides insight into the statistical distribution of the items that participants were measured on. It’s worth noting that questions 1 through 22 pertain specifically to the first section of the questionnaire.
The statistical distribution of the evaluated items
Exploratory factor analysis
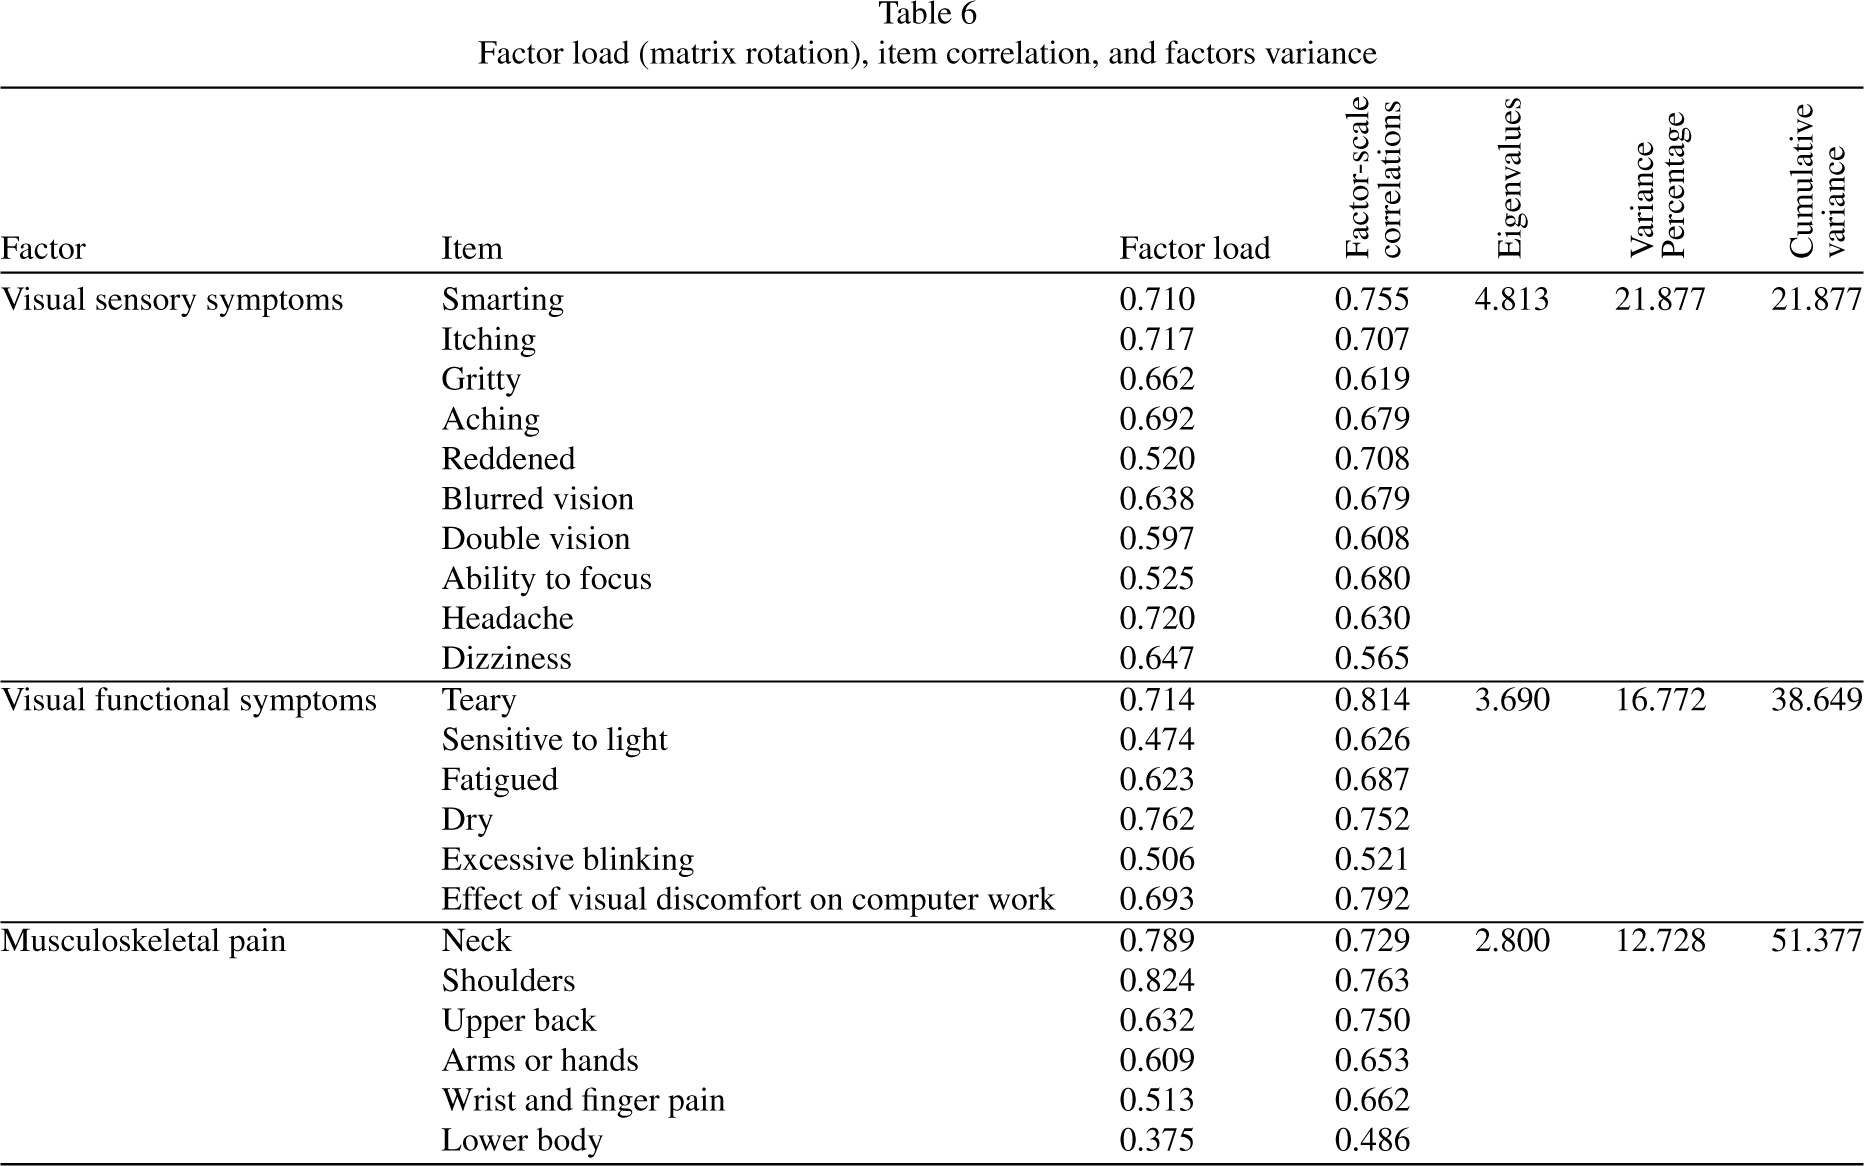
During the factor exploratory analysis step, we first checked the Kaiser-Meyer-Olkin (KMO) values, which came out to be 0.869, and the Bartlett’s Test showed p < 0.05, confirming the data operability and the adequacy of the sample size. Based on the results of EFA, three factors were extracted from the first part of the visual ergonomics subscale. To better explain and interpret the factors, we categorized the knee pain item and the pelvic/thigh pain item as “lower body region”. The three factors were named “visual sensory symptoms”, “visual functional symptoms” and “musculoskeletal pain”, which explained 21.877, 16.772, and 12.728 of the total variances, respectively. Table 6 presents factor loadings of the three factors extracted from the EFA for the firstsection.
Factor load (matrix rotation), item correlation, and factors variance
Factor load (matrix rotation), item correlation, and factors variance
To perform CFA, the research model was drawn first based on EFA results (Fig. 2). The results of CFA confirmed that the structure extracted from EFA method was adequate, and all factors were significantly loaded on the relevant factors. Additionally, the fit indices were within acceptable limits (Chi-square/df = 2.57, RMSEA = 0.082, CFI = 0.901, TLI = 0.835).
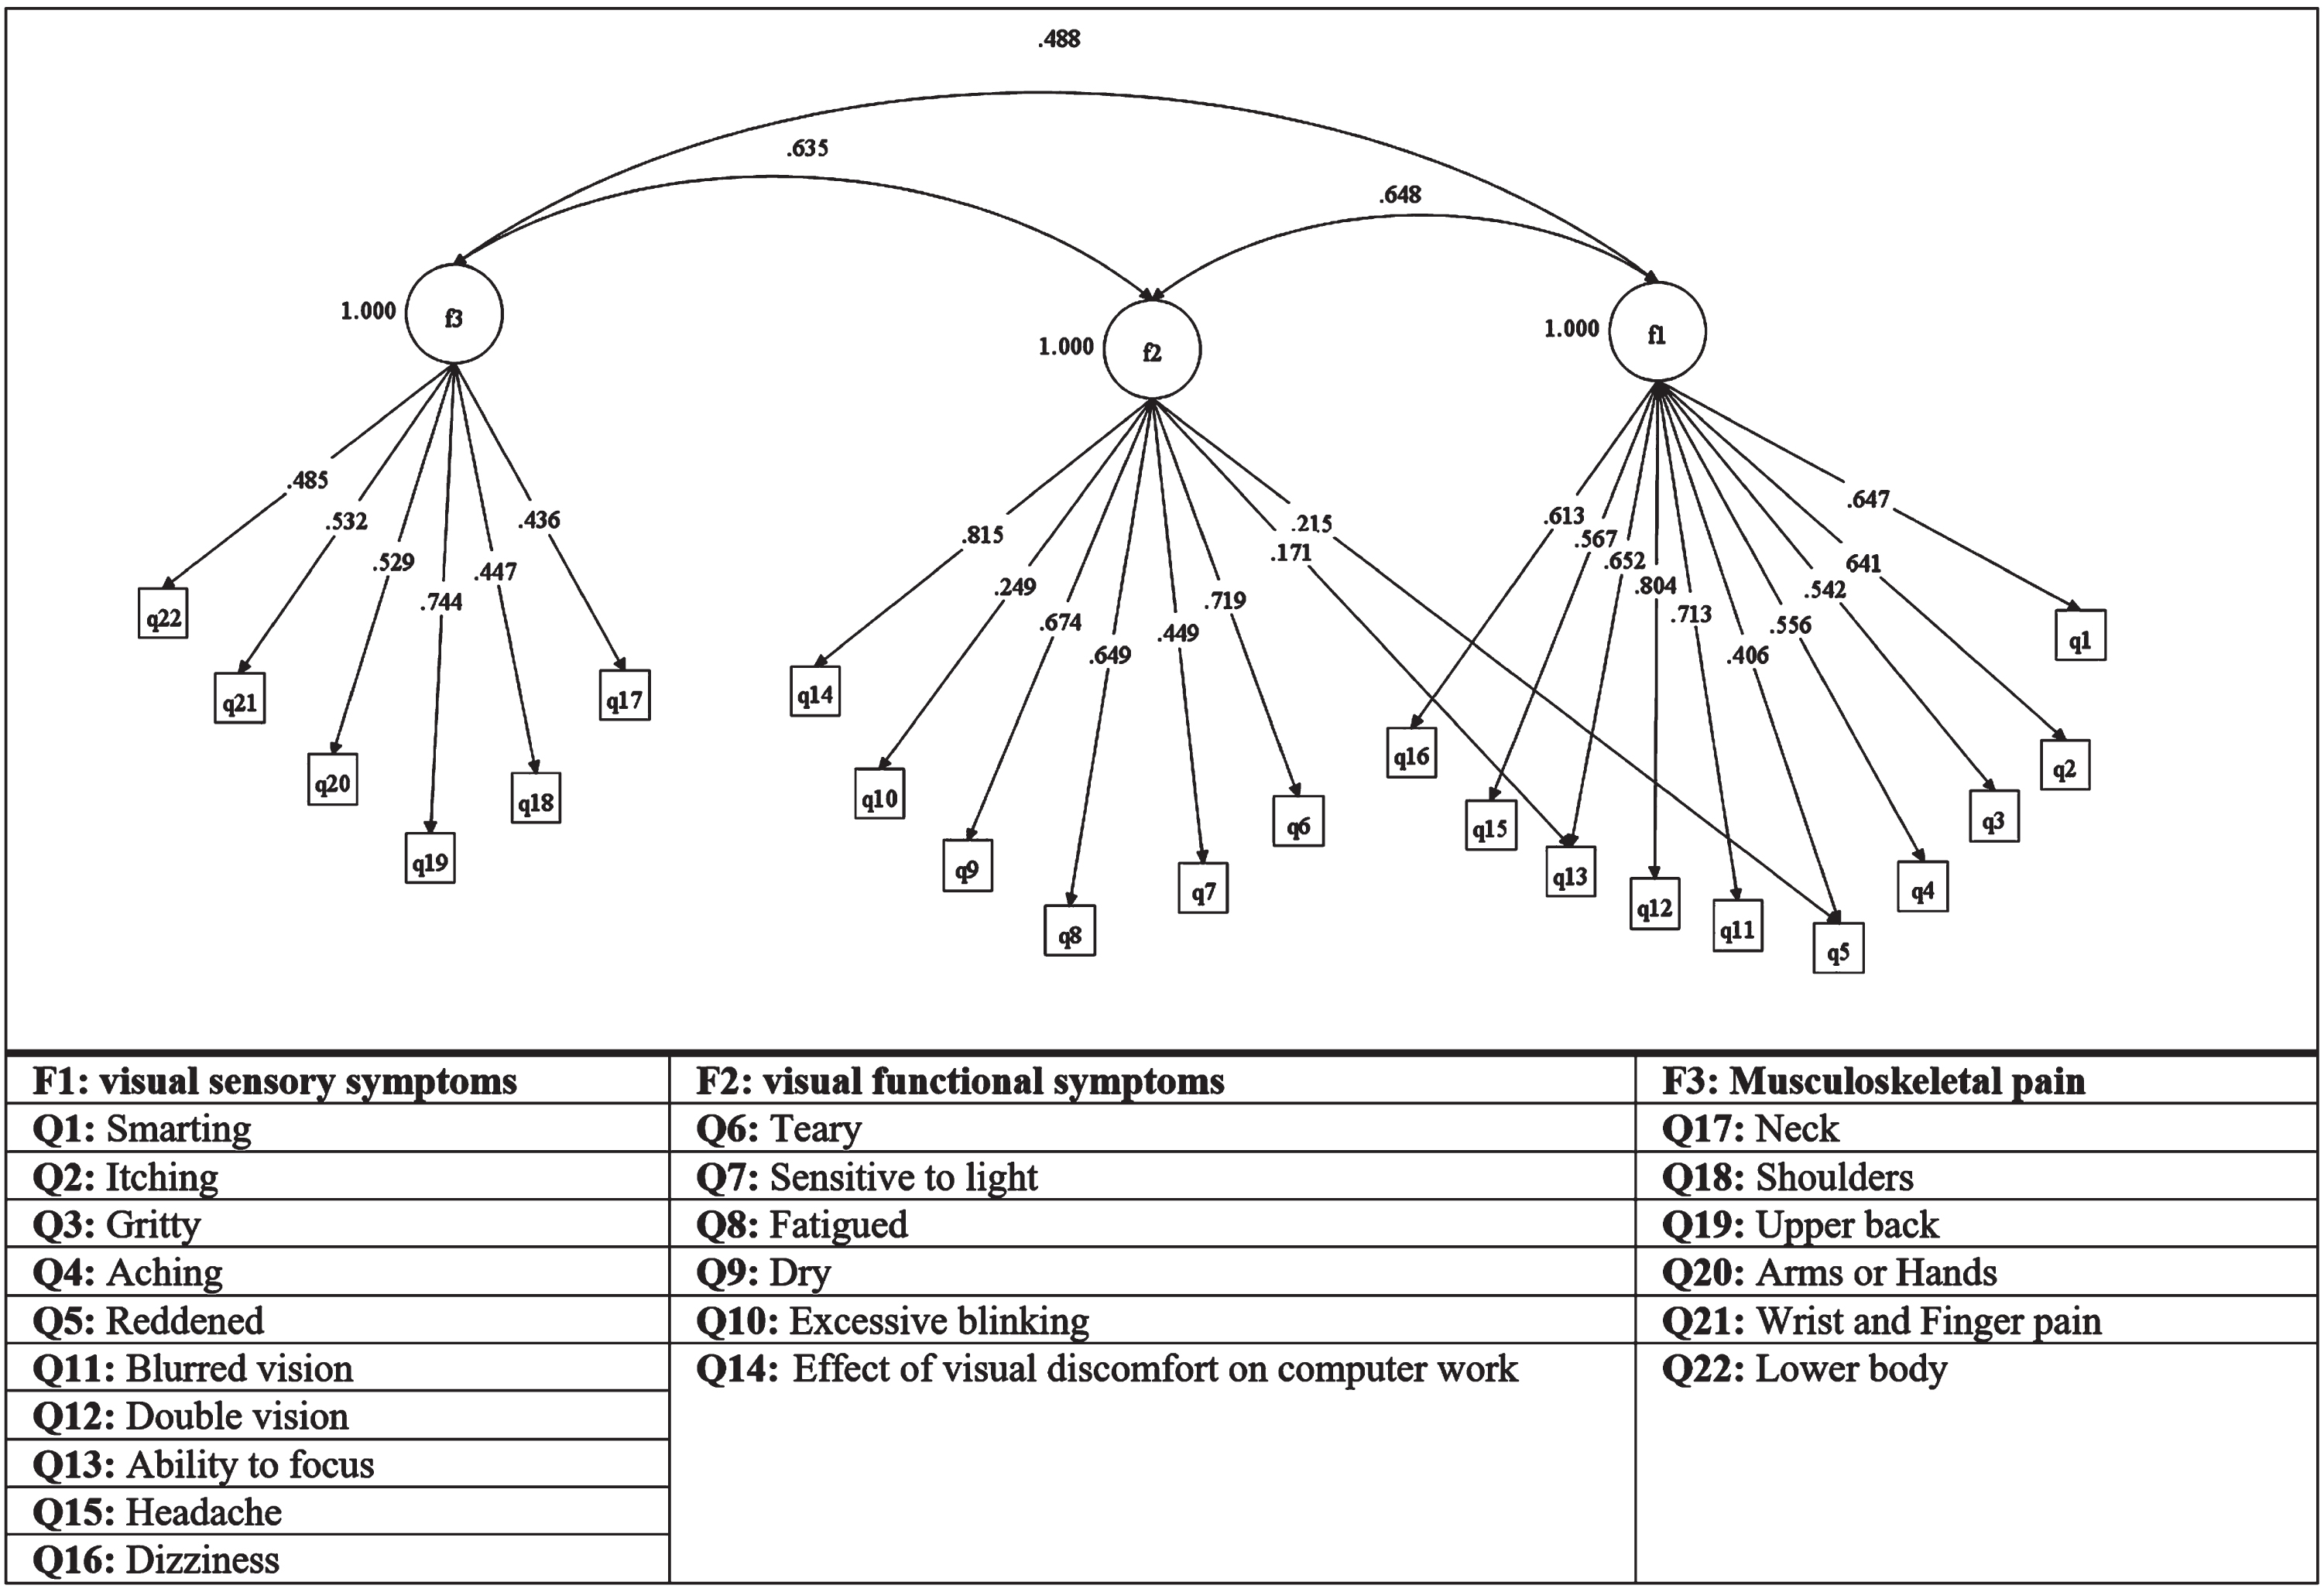
Confirmatory factor analysis of the structure extracted from EFA.
In the second part of the study, we conducted LCA on eight items related to lighting conditions and display status, which were part of the visual ergonomics subscales. The results showed that the model with two classes had the best-fit quality (BIC = 24249.17, AIC = 2179.89). The entropy R-squared value was 0.83, indicating that people were properly classified based on the fitted model [65]. The nature of was easy to interpret based on the levels of conditions desirability. Class 1 included 54.2% of the study population with favourable conditions, while class 2 included 45.8% of participants with unfavourable conditions (Fig. 3).
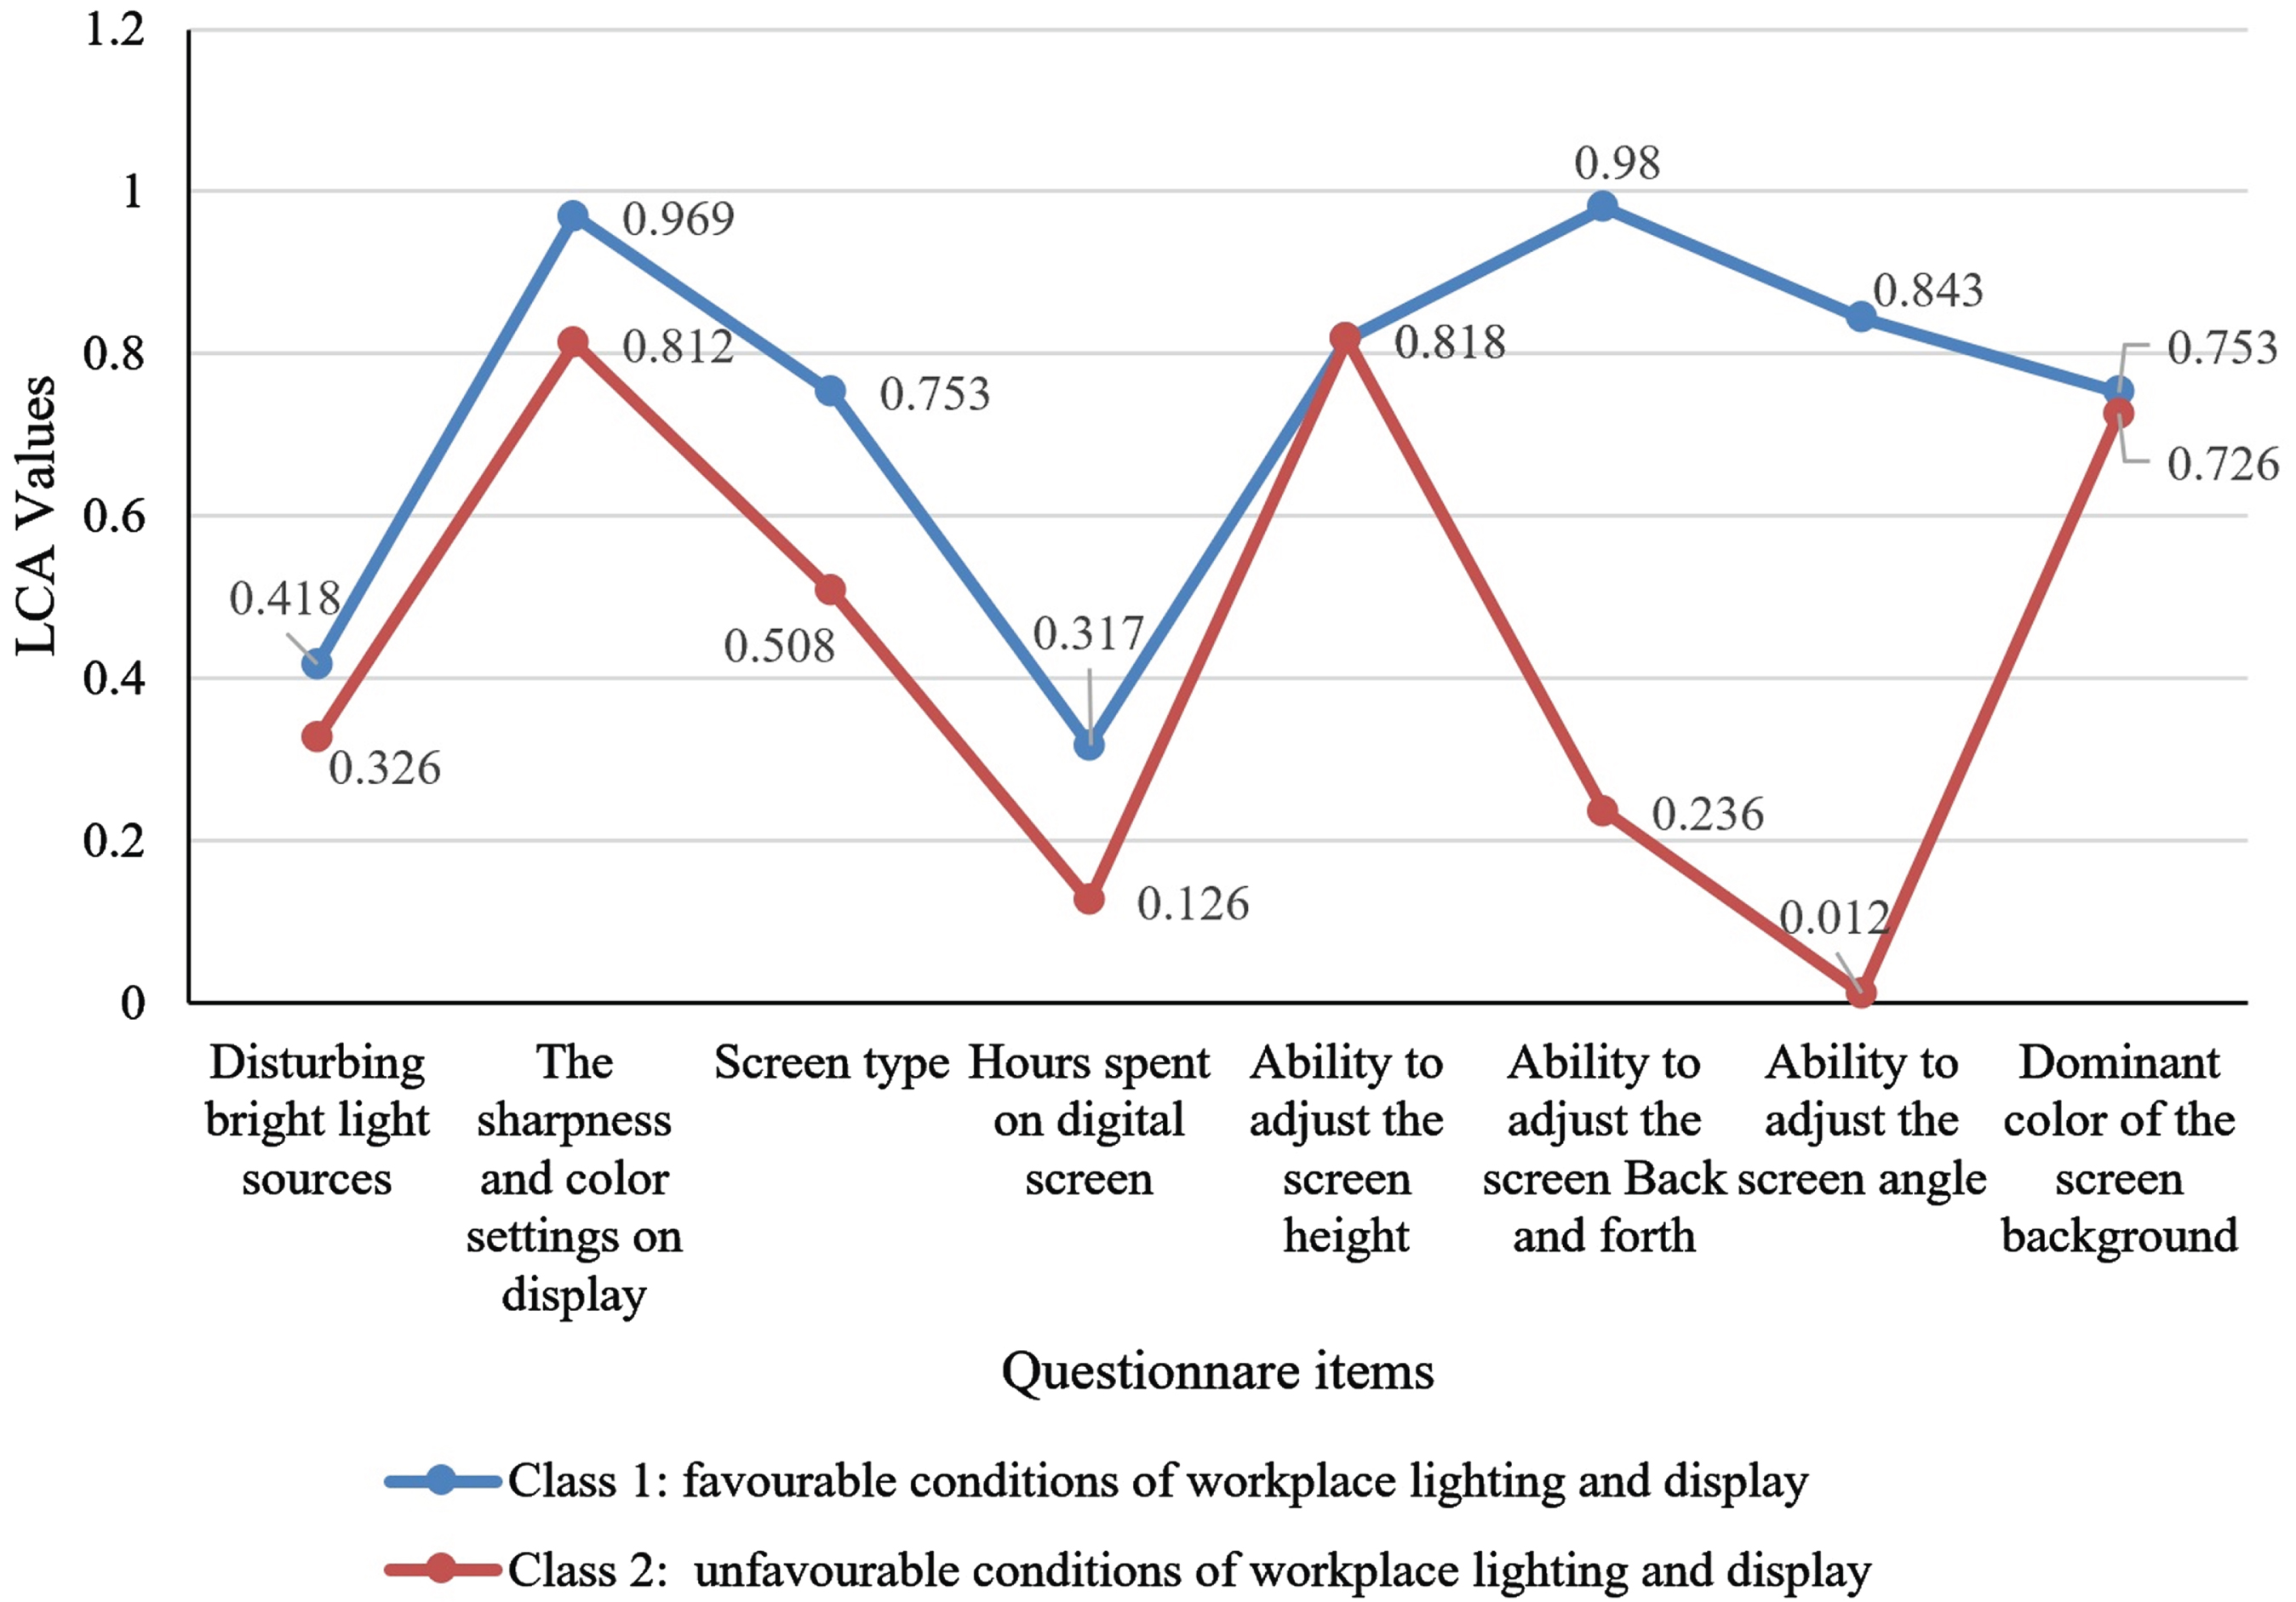
Graphic representation of the possibility of the desirability of the workplace lighting conditions and display status for the two latent classes of study participants.
The internal consistency of the visual ergonomics scale was determined by calculating Cronbach’s alpha, which came out to be 0.896. Among the variables, “teary” had the highest value of ITC at 0.652, while the variable of “excessive blinking” had the lowest value of ITC at 0.213. Cronbach’s alpha coefficient for “visual sensory symptoms”, “visual functional symptoms” and “musculoskeletal pain” were 0.884, 0.787, and 0.753, respectively. These results confirmed the validity and reliability of the questionnaire.
Calculation of effect coefficients and index development
Figures 2 and 3 depict the theoretical model of the effect of items on visual ergonomics. Based on Table 6, the results showed that the items of shoulder
pain, neck pain, and dry eyes, had the greatest impact on the visual ergonomic, with significant coefficients of 0.824, 0.789, and 0.762, respectively. Additionally, according to the results of Fig. 2, the dominant color of the screen background and the ability to adjust the screen to back and forth had the greatest impact on the desired position, while the ability to adjust the screen angle had the greatest impact on the unfavourable position. Table 6 describes the effect coefficients of the items. To compute the total score of the RAVEL index, we used the direct effect coefficients of the items [71] as shown in Eq. (2):
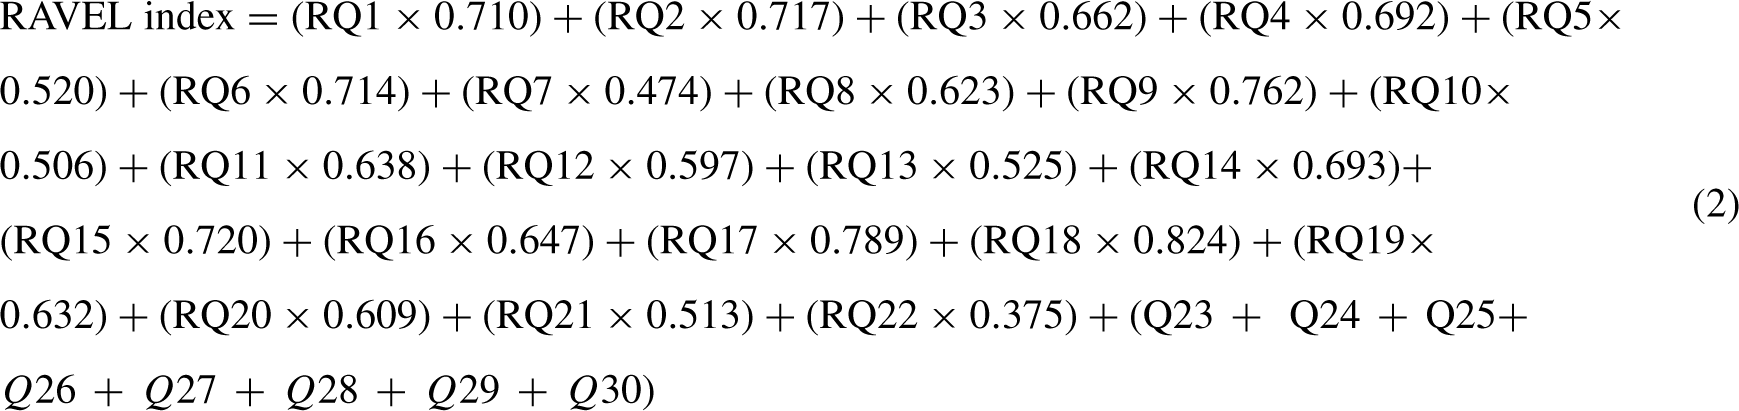
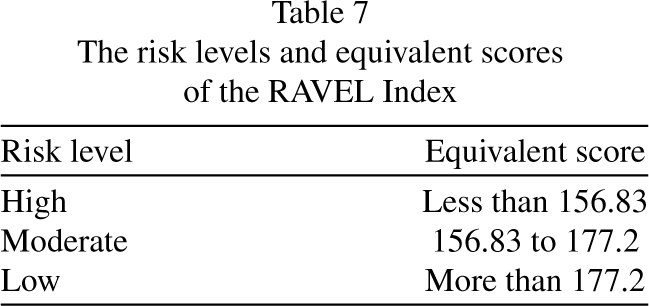
Table 7 represents the risk levels and corresponding scores of the RAVEL index. The total scores of the RAVEL index were divided into three categories, namely low, medium, and high-risk levels, based on the ROC curves.
The risk levels and equivalent scores of the RAVEL Index
The risk levels and equivalent scores of the RAVEL Index
ROC curves were used to determine the appropriate cut-off point and validate the developed method as a tool for visual ergonomics risk assessment. Figure 4 shows the ROC curves for different levels of risk based on two cut-off points, 55 and 63. The optimal cut-off points were determined based on experts’ opinions, weighting, and combining the results of objective measurements with the total score of the ROSA questionnaire [53]. We established the standard limits of illuminance and luminance at 300 lux (Acceptable with modification between 270–300 lux) and 1000 cd/m2 (Acceptable with modification between 500–1000 cd/m2), respectively, based on the Occupational Exposure Limits (OEL) standard of Iran (access 5th edition: https://arakmu.ac.ir/file/download/regulation/1618121551-.pdf). Furthermore, the total score of the ROSA questionnaire was classified into two categories: less than 5, indicating no need for corrective action, and more than 5, indicating a need for corrective action (Table 8)
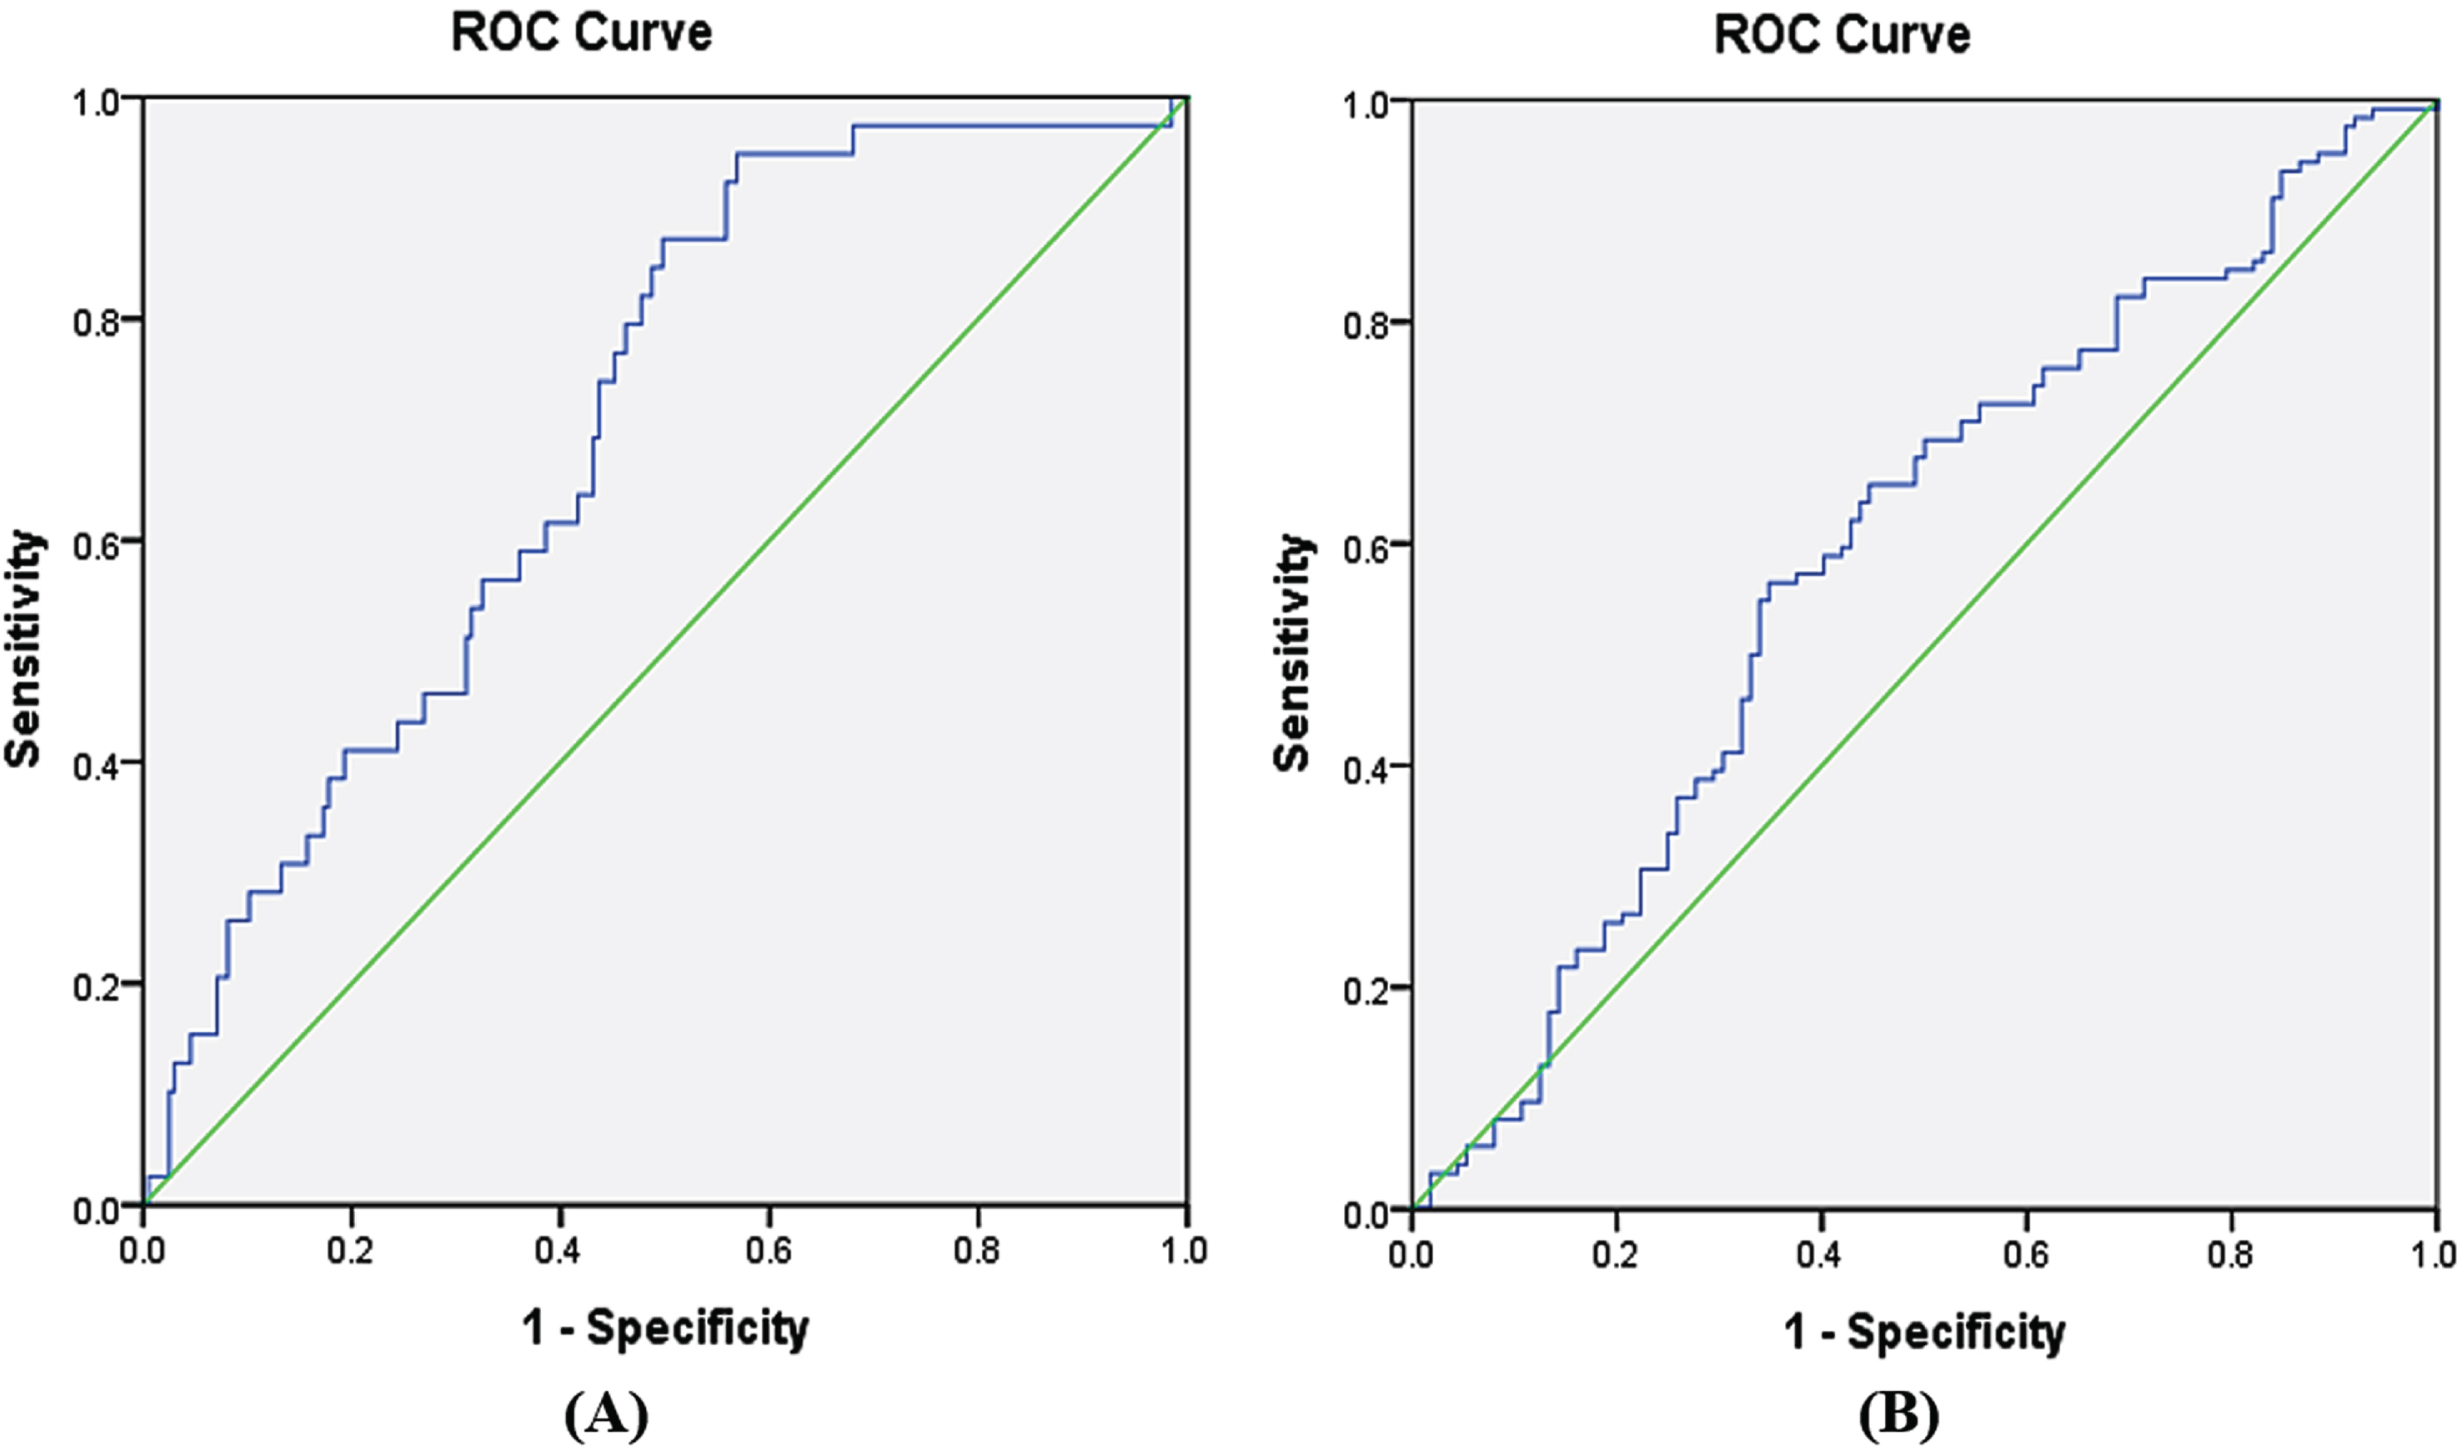
Receiver operating characteristic (ROC) curves related to (A) low and moderate-risk zones, (B) moderate and high-risk zones.
The measured values to determine cut points (N = 236)
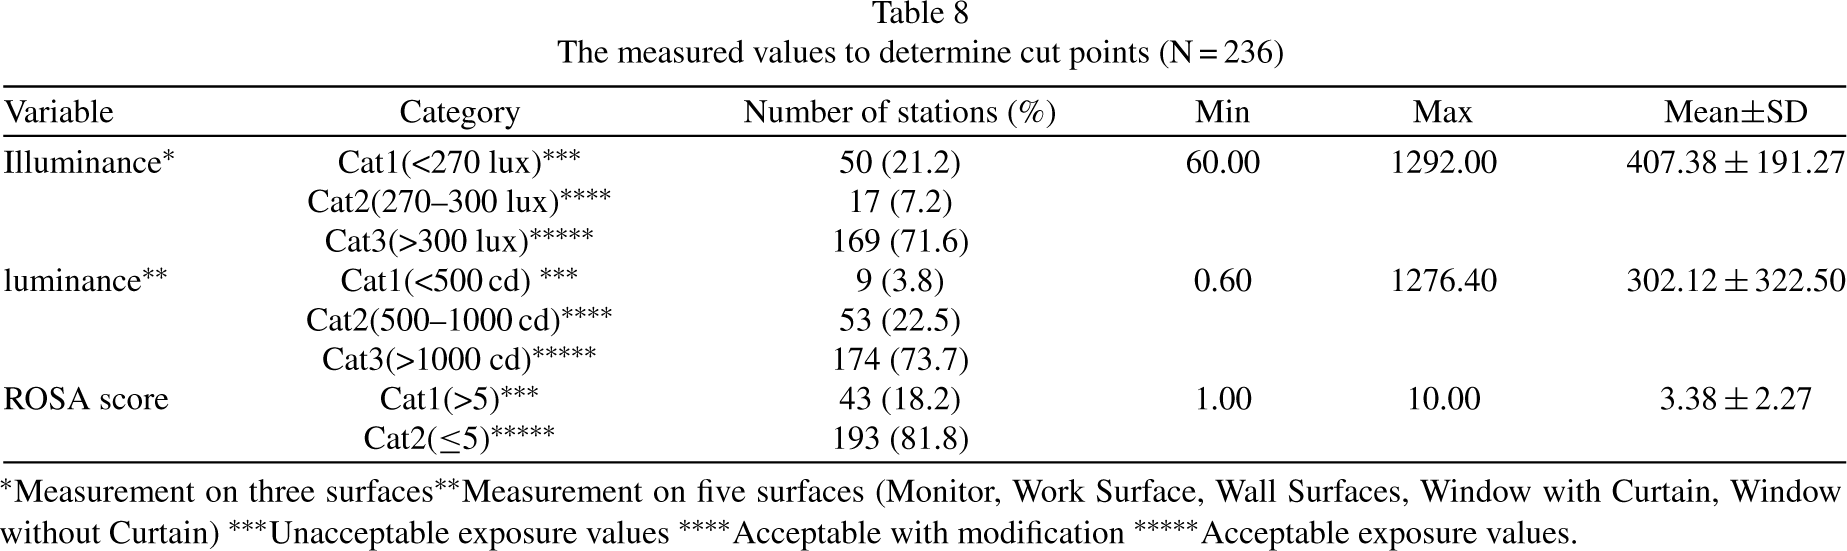
*Measurement on three surfaces **Measurement on five surfaces (Monitor, Work Surface, Wall Surfaces, Window with Curtain, Window without Curtain) ***Unacceptable exposure values ****Acceptable with modification *****Acceptable exposure values.
In Fig. 4, where the ROC curves are shown, the cut points with the highest sensitivity and specificity have been considered the best cut-off point. The results indicated that the optimal cut-off points for the border between low, medium, and high-risk areas were equal to 177.20 (sensitivity = 0.565 and specificity = 0.652) and 156.83 (sensitivity = 0.949 and specificity = 0.431), respectively. The area under the ROC curves of A and B (AUC) in Fig. 4 was 0.591 (95% CI: 0.518, 0.665) (P < 0.05), and 0.698 (95% CI: 0.617, 0.778) (P < 0.001), respectively. An AUC greater than 0.50 indicates acceptable diagnostic accuracy of the developed method and the closer this value is to one, the higher the diagnostic accuracy of the tool.
A valid tool for accurately assessing the likelihood of visual ergonomics-related hazards in the visual workplace is crucial for designing effective preventive measures. According to the definition of visual ergonomics [52], several latent and observable factors affect the occurrence of visual ergonomics risks. Identifying and evaluating these factors is the first and most crucial step [51, 72]. Based on this, the present tool aims to quantitatively evaluate and classify these factors in the visual workplace, where people use the display. This tool provides unique information to address visual challenges and can be used as a part of preventive action plan to minimize the risk of disorders and diseases. This approach is much preferable to a treatment-oriented plan, which is reactive rather than proactive [25].
Although some instruments have been developed to assess the status of visual symptoms or musculoskeletal pain in specific visual workplaces [48–50], this is the first study to comprehensively evaluate the factors influencing the occurrence of visual ergonomic hazards, including visual problems and musculoskeletal discomfort without any objective observational tool. In this study, we developed a method to rapidly evaluate visual workplaces based on visual ergonomics, particularly for computer users. Consequently, the present study proposed a standard tool to identify and model the primary factors contributing to the occurrence of visual ergonomic hazards, enabling corrective measures to be taken before they lead to disease or disorder (Table 2).
The 22 variables in this study were classified into three groups: visual sensory symptoms, visual functional symptoms, and musculoskeletal pain. Additionally, eight variables were related to display status and conditions of workplace lighting condition. Heiden et al. also developed a questionnaire with four sections, including individuals’ subjective ratings as well as objective measurements of the workplace [51]. However, in the present study, only the subjective rankings of individuals were included, and no measuring tools were required to assess workplace conditions. Furthermore, this study identified more items and factors that affect visual ergonomics, such as display status and workplace lighting conditions, compared to other studies. Although some questions in the steps of validity and reliability were eliminated, the study still included 22 questions on visual symptoms and musculoskeletal pain with two dimensions of frequency and intensity, as well as eight questions on ambient light status and display status.
In the designed questionnaire, the values of CVR, CVI, and Cronbach’s alpha were calculated as 0.75, 0.87, and 0.89, respectively, confirming the content validity and reliability of the questionnaire. Although, Reliability is calculated in both internal and external ways, in this study, we have only examined the internal consistency of the scale. Test-retest reliability should also be done to evaluate external consistency, but the present study was conducted during COVID-19 and re-access to people was difficult. In comparison, Heiden et al. reported Cronbach’s values of 0.76 for the frequency of musculoskeletal pain, 0.77 for the severity of musculoskeletal pain, 0.85 for the frequency of eye fatigue, 0.86 for the severity of eye fatigue, 0.70 for the symptoms of vision, and 0.84 for the light conditions, without reporting the CVI and CVR values of the questionnaire [51]. Additionally, Segui et al. computed the internal consistency (Cronbach’s alpha) of 16 variables of ocular symptoms (including frequency and severity) as 0.78 [48]. A comparison of these results shows that the questionnaire designed in the present study has higher reliability than previous instruments. Moreover, the present study examined musculoskeletal pain, lighting conditions, and display status, in addition to visual symptoms, providing more accurate results [73, 74].
The present study was conducted in different environmental and working conditions. The EFA of the first part of the RAVEL questionnaire with 22 variables led to the extraction of three factors, including visual sensory symptoms, visual functional symptoms, and musculoskeletal pain. The adequacy of the extracted structure was also confirmed by the CFA. The results showed that visual sensory symptoms, with 10 variables, had the most significant impact on visual ergonomics among the factors, and the variable of pain in the scapula and shoulders had the most significant effect on explaining this model, with a factor loading of 0.824. In this model, the variable “teary” had the highest correlation with the total item, with a value of 0.652. These results are consistent with those of previous studies [4, 76]. For instance, Zalat et al. found that the most common symptoms of users who worked with monitors were dry eyes, itchy eyes, headaches, poor eyesight, and difficulty concentrating which were associated with musculoskeletal pain such as neck pain and increased working time [75]. The findings of the present study are in line with these previous studies.
The construct validity of the second part of the questionnaire, which had different answers than the first part, was evaluated using an advanced statistical method called the LCA model [65]. LCA examines the pattern of relations among a set of observed categorical variables and identifies and classifies similar individuals into latent classes. Therefore, the findings of the present study cannot be easily compared with those of other studies because they did not use this method. Figure 3 is a profile plot. On the Y-axis the conditional average scores-these are the average of each item given the latent class cluster-are given. This plot is commonly used to portray the relationship between indicators and the latent variable (LCA clusters). The plot shows two distinct lines that portray the different clusters. Based on the results of the LCA method, it was observed that the study population can be classified into two hidden classes in terms of the desired level of lighting conditions and display status. Class 1, which included 54.2% of the study population, showed that more than half of the people had the desired conditions of workplace lighting and display status. In this study, the people in the favorable conditions group had better lighting and display status than those in the unfavorable conditions group. Considering that the visual design of workplaces can be different according to the culture and budget of each organization, the different results could also be attributed to the culture and socio-economic status of the studied communities [77].
Unlike some previous studies [50, 74], this tool categorizes risk and has an interpretation table for the level of visual ergonomic risks in the workplace (Eq. (2) and Table 7. By analysing the ROC curves, two cut points and three risk levels (low, medium, and high risk) were presented to classify the occurrence of visual ergonomic risks and define preventive measures. Therefore, after completing the RAVEL instrument and calculating the total score using the equation and the risk estimation table, the risk level can be easily determined. A low-risk level indicates that there is no current need for intervention measures, while medium to high-risk levels indicates an increasing need to develop a preventive action plan. Some key recommendations as workstation redesign, optimizing work-rest schedules and limiting overtime, improving posture and body mechanics, providing vision screenings and eye protection, ensure adequate lighting, and promote regular eye exams and providing training on visual ergonomics and encouraging employees to report visual discomfort or symptoms to enhance the practical applicability and relevance of the findings and mitigating identified risk factors of visual ergonomics can be implemented in high-risk levels [72, 78]. Therefore, the RAVEL method can be used to identify the primary risk factors in the visual workplace so that control measures can be focused on them.
Although the results obtained from the present study may vary in different settings, they demonstrate the tool’s ability to accurately identify and prioritize the most important factors contributing to visual workplace hazard occurrences. Therefore, the integrating these findings and determination of risk levels can lead to the adoption of appropriate and realistic preventive measures for people exposed to visual ergonomic risks in organizations.
Strengths and limitations
Although the RAVEL method can be applied to various jobs that entail working with monitors, the participants in the present study were mainly from office workplaces. Therefore, to validate the questionnaire in other occupations, further studies are necessary to interpret the results and evaluate the proposed model in different domains. Additionally, while the present study focused on perceptual signs and symptoms from the perspective of people, investigating the experts’ perspectives on visual workplace conditions could lead to the identification of new factors that can be considered in future studies. Also, approaches based on computational psychophysiology (CPP) [79] and high-tech [80] as machine learning could be utilized to discover the link between psychological quantities and physiological quantities in future studies. Another limitation of this developed tool is that it was only tested on people working at a sitting workstation, which can limit its generalizability to other types of workstations.
Despite these limitations, the present study’s strengths include investigating various aspects of visual ergonomics and signs and symptoms perceived by people to develop a comprehensive tool and model for different occupations. This approach allows for the generalization of the findings to a wider context. To the best of the authors’ knowledge, the present study was the first conducted to develop a comprehensive tool to identify the risk factors of visual ergonomics in the visual workplace.
Conclusion
Identifying the factors that contribute to visual ergonomic risk occurrence in the visual workplace is critical for recommending effective preventive measures. The present study aimed to develop a comprehensive tool to identify these risk factors. Throughout the research process, special emphasis was placed on item development, validation, reliability, and the determination of risk levels. The developed tool consists of two parts, with a total of 30 items. The first part comprises 22 questions related to visual symptoms and musculoskeletal pain, while the second part consists of eight items related to workplace lighting conditions and display status, which can impact the items in the first part.
The content validity and reliability scores of the tool showed acceptable levels of validity and reliability. Furthermore, the CFA findings confirmed the consistency between the data obtained from the comprehensive field study and the presented model. The LCA findings on the second part of the instrument also supported the study’s results. The findings of the present study suggest that the RAVEL method, as a computer-based method, is a reliable and valid tool for evaluating visual ergonomics. The combination of the user’s subjective ratings and the conditions of workplace lighting and the display status provides valuable information for making recommendations. Additionally, conducting longitudinal studies to evaluate the sensitivity of this tool could further enhance the evaluation of RAVEL.
Acknowledgements
The authors express their sincere gratitude to the Isfahan University of Medical Sciences for their support in conducting this study. We would also like to extend our heartfelt thanks to the esteemed professors of ergonomics and occupational health across the country that participated in this study and provided valuable support. Their contributions were instrumental in the success of this study.
Ethical approval
This study was approved as a research project by the ethics committee of Isfahan University of Medical Sciences with code number IR.MUI.RESEARCH.REC.1400.022 and was performed in accordance with the Declaration of Helsinki.
Informed consent
In the present study, all participants were above 18 years old and signed an informed consent form prior to taking part in the study. All methods in our study were performed in accordance with the guidelines and regulations approved by the Ethics Committee of Isfahan University of Medical Sciences. After being informed about the study, participants provided written consent, which was approved by the ethics committee. They were also provided with an explanation of the purpose and method of the research.
Conflict of interest
The authors have no conflict of interests.
Funding
Not applicable.