
Abstract
BACKGROUND:
Computed Tomographic (CT) imaging procedures have been reported as the main source of radiation in diagnostic procedures compared to other modalities. To provide the optimal quality of CT images at the minimum radiation risk to the patient, periodic inspections and calibration tests for CT equipment are required. These tests involve a series of measurements that are time consuming and may require specific skills and highly-trained personnel.
OBJECTIVE:
This study aims to develop a new computational tool to estimate the dose of CT radiation outputs and assist in the calibration of CT scanners. It may also provide an educational resource by which radiological practitioners can learn the influence of technique factors on both patient radiation dose and the produced image quality.
METHODS:
The computational tool was developed using MATLAB in order to estimate the CT radiation dose parameters for different technique factors. The CT radiation dose parameters were estimated from the calibrated energy spectrum of the x-ray tube for a CT scanner.
RESULTS:
The estimated dose parameters and the measured values utilising an Adult CT Head Dose Phantom showed linear correlations for different tube voltages (80 kVp, 100 kVp, 120 kVp, and 140 kVp), with R2 nearly equal to 1 (0.99). The maximum differences between the estimated and measured CTDIvol were under 5 %. For 80 kVp and low tube currents (50 mA, 100 mA), the maximum differences were under 10%.
CONCLUSIONS:
The prototyped computational model provides a tool for the simulation of a machine-specific spectrum and CT dose parameters using a single dose measurement.
Keywords
Introduction
Computed Tomography (CT) scanning is utilised extensively by medical practitioners in the field of diagnostic radiology. It is involved in the diagnosis and management of a wide range of clinical conditions. The utilisation of CT technologies has increased dramatically, with approximately 81 million imaging investigations carried out in recent years in US only [1].
CT images have provided medical practitioners with optimal diagnostic details, proven by the superior sensitivity and specificity values recorded by CT procedures compared to other radiological and ultrasonic methods. For instance, CT procedures have provided the highest specificity (98%) and sensitivity (95%) for the detection of urinary stones compared to other medical imaging techniques, including ultrasonographic and conventional radiographic procedures [2–4]. The ionising radiation dose received from CT chest scan is considered 45% of the total dose received by x-ray imaging modalities (5). Numerous studies have been conducted on the relative contribution of CT examinations to the total medical radiation dose [5–13]. The potential danger of the delivered radiation dose connected to CT scanning has become of increased concern, particularly for paediatric patients due to their greater radio-sensitivity and longer life expectancy. Accordingly, justifications for examinations and the optimisation of the imaging protocol to achieve high image quality while maintaining low patient dose have become increasingly important [14–18].
Several parameters are used to estimate the amount of CT radiation output, the most common being the Dose Length Product (DLP) and Volume Computed Tomography Dose Index (CTDIvol), both of which are displayed on the CT scanner console. These parameters are estimated from the measured Computed Tomography Dose Index (CTDI) in 2 standard 16 cm or 32 cm diameter cylindrical phantoms for the head and body, respectively, using an ionisation chamber placed in the middle and periphery of the phantom.
Various computer models have been developed to help in the process of performance evaluations for digital x-ray systems [19–23]. Vedantham et al 2010 [18], Hussein et al. 2009 [20], Cunningham et al. 1994 [21] and Siewerdsen et al. 1998 [22] models rely upon the transport of radiation energy and the linear analysis of the propagation of signal and noise across the imaging system, while others models [23–25] are focused on a variety of qualitative methods to assess the performance of a digital x-ray system. Siewerdsen et al. 2004 [26] developed computer tools that adopted the Boone et. al Tungsten Anode Spectral Model using Interpolating Polynomials (TASMIP) spectral generation model to a high-level language program (MATLAB) for a flat-plane imager [25]. Punnoose et al. 2016 [27] updating the previous work of Siewerdsen et al. for more energy spectrum optimisation and the extension of tube voltage up to 640 kV. These computer tools can aid the optimisation process of digital x-ray detectors by improving the image quality and optimising the delivered radiation dose. In addition, it could be used as an educational tool for radiological practitioners to study the influence of different technique’s factors on the delivered dose and image quality.
This research presents a computational tool for the estimation of CT radiation dose parameters for different imaging technique factors using interpolating polynomials developed by Boone and Seibert’s (1997) [28]. These fitted polynomial equation generates the raw spectral data in diagnostic range for tube voltage ranging between 30 and 140 kV. As the estimation of radiation output depends on the characteristic and geometrical shape of the x-ray source, and as most of model depends these details information, this computational model allows the user to calibrate the energy spectrum for specific-CT x-ray tube using single set of a selected technique factor. The computed Tomography dose indices such as CTDI100, CTDIw, and CTDIvol were estimated using the calibrated x-ray energy spectrum for a reference technique setting (Tube voltage of 100 kVp, Tube current of 100mA, rotation time of 1sec, and Beam width of 20 mm). The model was validated by comparing the estimated dose parameters with the measured dose in the CT Head Dose Phantom for different tube voltages and tube currents and the displayed dose parameters of the CT scanner. All the equations used for the estimation of CT radiation output and the CT dose parameters were implemented as functions using MATLAB (MATLAB™, The MathWorks, Natick, MA). These functions included the generation of x-ray raw spectrum using the interpolating polynomials developed by Boone and Seibert’s (1997) [28] for the selected setting, calibration of the CT x-ray tube spectrum using the measured value at the specific technique setting, then using the calibrated spectrum for the estimation of the CT dose indices for different setting techniques. Furthermore, the proposed computation tool has been validated using set of measured doses at different technique factors.
Materials and methods
The computational tool was developed using MATLAB in order to estimate the CT radiation dose parameters for different technique factors using interpolating polynomials developed by Boone and Seibert’s (1997) [28]. The spectrum raw data was calibrated for the CT x-ray tube using a single technique factor setting (Tube voltage of 100 kVp, Tube current of 100 mA, rotation time of 1 sec, and Beam width of 20 mm). The CT dose indices for different tube voltages and tube currents were estimated using the calibrated x-ray energy spectrum. All equations used for the estimation of CT radiation output and the CT dose parameters were implemented as functions using MATLAB. Figure 1 shows the graphical user interface (GUI) developed for the CT dose estimation. The user can add the parameters of the technique factors manually. The study was performed on CT system-16 slices per gantry rotation; manufactured by GE Company (last calibration on October 18, 2019) at emergency department in a large hospital in Asir region, Kingdom of Saudi Arabia.
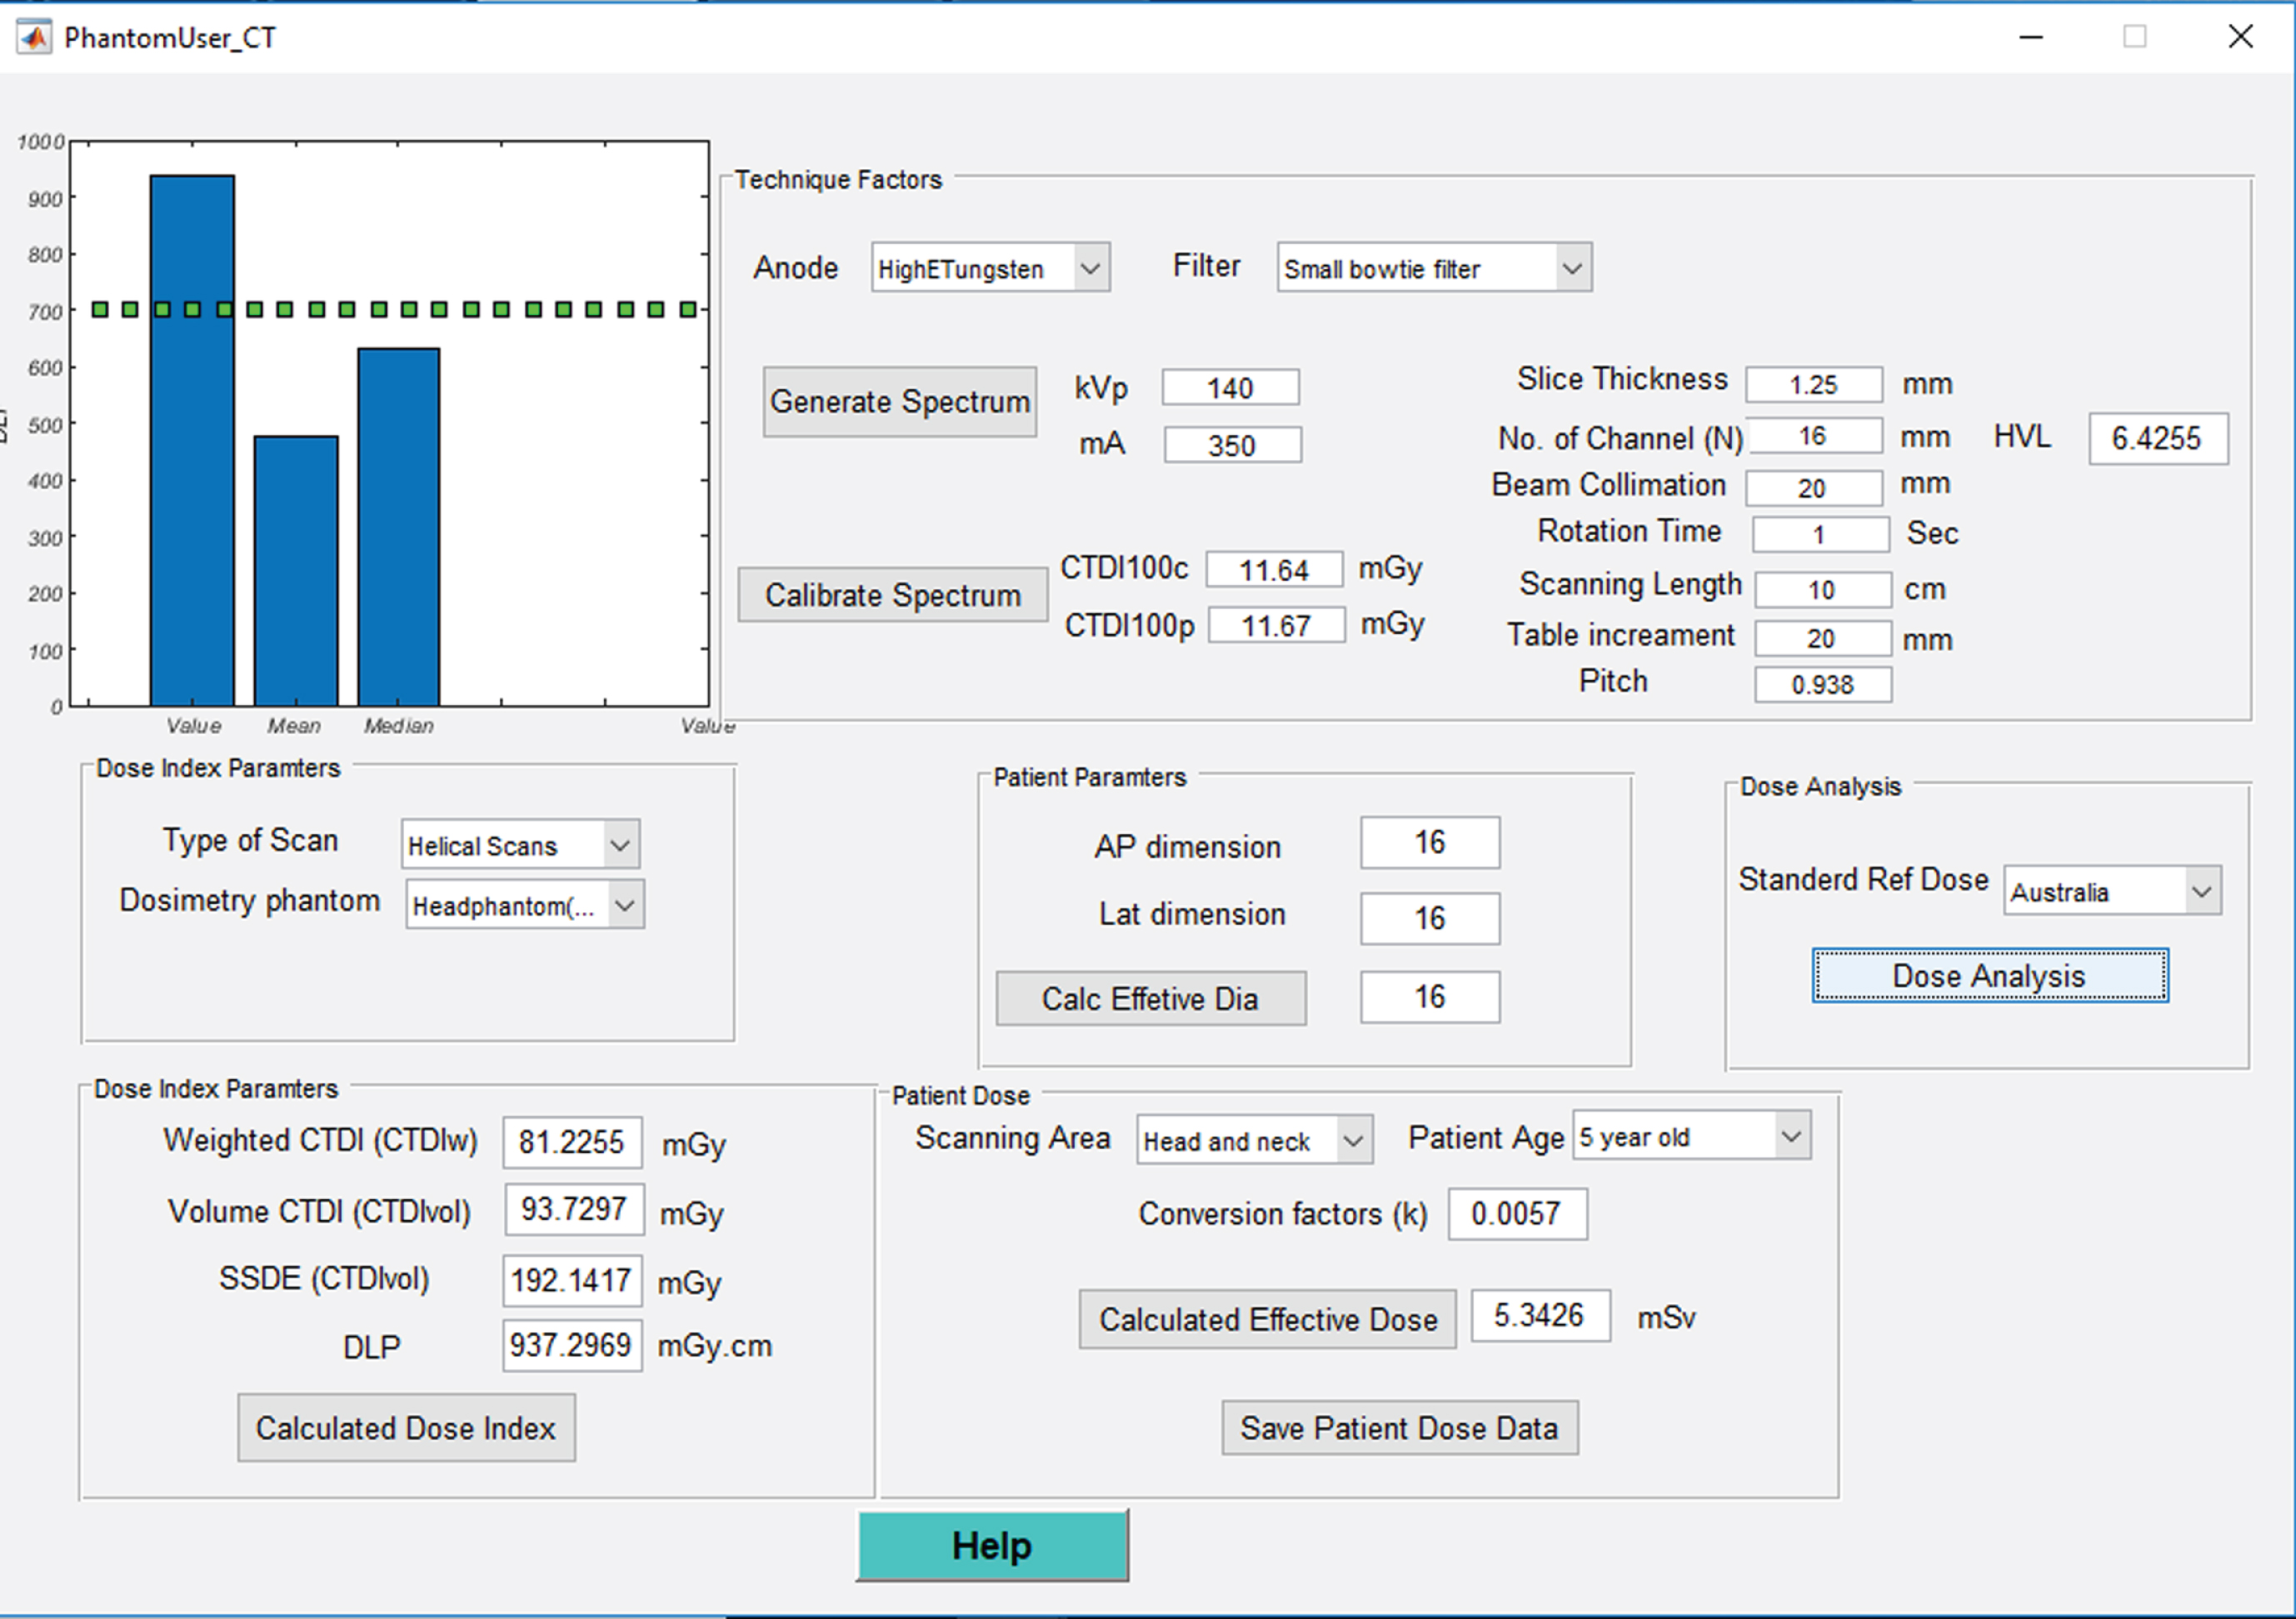
The graphical user interface (GUI) developed for the CT dose estimation, coded using MATLAB. All equations shown above were implemented as a function in the graphical user interface.
The photon fluence in photons/mm of CT fan beam for a particular tube current along with effective rotation time (mAs), can be estimated using the following equation:
Data for the filter materials were taken from the CT x-ray tube manufacturer specifications (MX200 Performix Ultra tube GE). The attenuation coefficients of the filter materials were obtained from NIST [29]. The mAs is tube current and the rotation time. CF
CTTube
is the calibration factor for specific CT x-ray tube, accounts for the primary and the secondary components (due the effect of penumbra and scatter radiation, which represent by the tails of dose profile). The calibration factor (CF
CTTube
) is calculated for a given calibration technique factor (Tube voltage of 100 kVp, Tube current of 100 mA, rotation time of 1sec, and Beam width of 20 mm) for the dose at the central and peripheral positions of the CT Head Dose Phantom using the following equations:
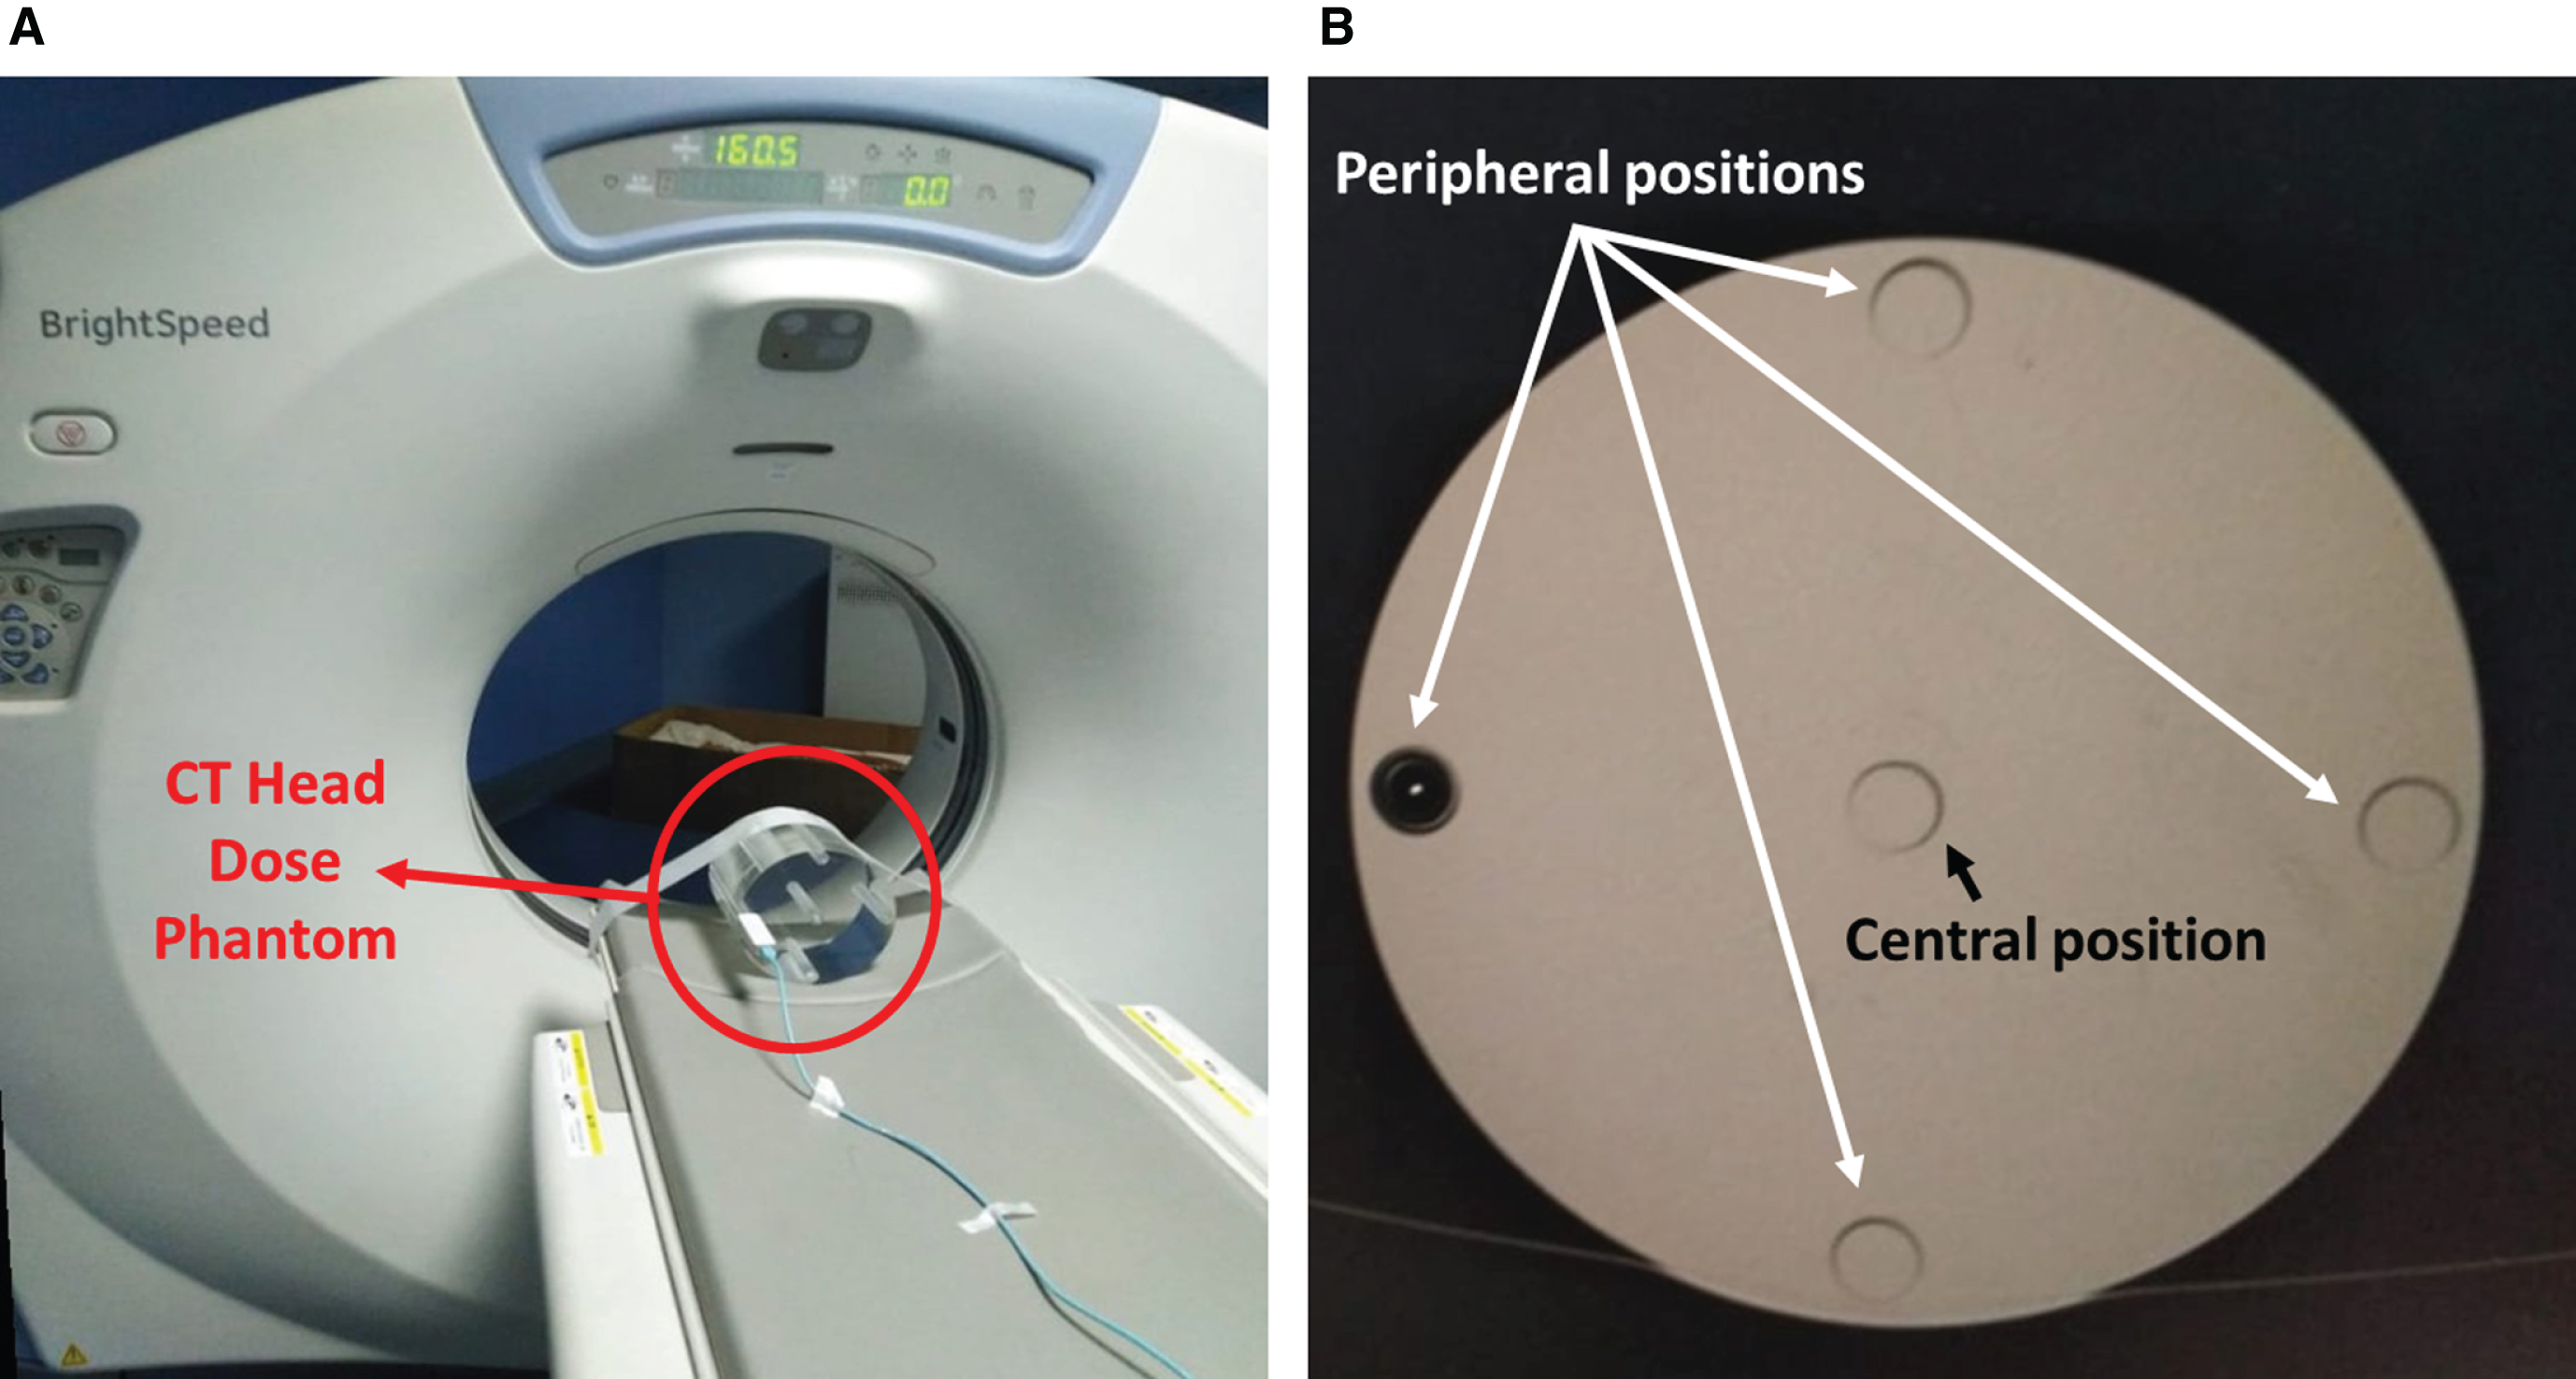
(A) A photograph showing the experimental setting; (B) CT image for the CT Head Dose Phantoms fitted with the ionization chamber detector.
DE is the estimated dose in (milliGray) calculated from the photon fluence in photons/mm of the uncalibrated raw spectrum using equation given by Dobbins, 2000 [30]:
The x-ray fluence per unit exposure (photon/mm/milliroentgen), ξ(E) can be estimated utilising the empirical equation driven by Dobbins, 2000 [27]:
The values of x, y, and z are constants corresponding to –5.0e–06, 1.81e07, and 8.8e–03, respectively. Using equation 4 and the calculated calibration factor CF
CTTube
, the estimated dose for specific CT x-ray tube can be given by the following equation:
The dose index parameters that characterize the CT radiation dose (CTDI100, CTDIw, and CTDIvol) can be estimated from the CT x-ray spectrum for the specific CT x-ray tube using the following equations:
The average CTDI across the FOV is found out by the Weighted CTDI (CTDI
w
) [31], where
Then, the main dose index volume CTDI can be calculate using
The computational tool was validated utilizing a series of measured, estimated, and displayed volume CT dose Index (CTDIvol). The estimated dose indices values using the calibrated spectrum for different techniques setting, the measured values at the same technique setting along with the recorded display values were used to validate the simulation of the computational tool. The displayed CTDIvol were recorded from the calibrated CT scanner.
The dose in the centre and 4 periphery positions for various tube currents and tube voltages were measured using an Adult CT Head Dose Phantom (Nuclear Associates 76-419-4150, USA), 15 cm long acrylic cylinders, 16 cm in diameter and a calibrated CT ionization chamber (X2 CT, SN: 252154 RaySafe, last calibration on 16 Feb 2108 (eff. length ∼10 cm) connected to electrometer (RaySafe SWEDEN). The CT chamber was placed in the centre hole of the CT phantom and then at 4 periphery positions. The setup technique factors (a range of tube voltages 80–140 kVp and different tube currents) that were used to measure reference doses are shown below in Table 1.
Summary of the dose measurement parameters using CT phantoms (16 cm, Nuclear Associates 76-419-4150, USA) and a calibrated CT ionisation chamber (X2 CT, SN: 252154 RaySafe)
Summary of the dose measurement parameters using CT phantoms (16 cm, Nuclear Associates 76-419-4150, USA) and a calibrated CT ionisation chamber (X2 CT, SN: 252154 RaySafe)
The CTDI100, CTDIw, and CTDIvol, were calculated from the measured dose in the centre and periphery using equations 7, 8, and 9. The displayed dose parameters values were taken from the calibrated CT scanner (last calibration was in October 2019).
The calculated spectra for the different technique factors (calibrated for machine-specific spectra) are shown in Fig. 2. This shows the energy x-ray spectra for the tube voltages and tube currents that were used for the estimation of the CT dose parameters.
Figures 4 and 5 show the estimated dose index (CTDI100) at the centre and periphery of the 16 cm CT phantom for various tube voltages and currents compared to the values measured using the calibrated CT ionisation chamber and the Adult CT Head Dose Phantom. Linear correlations are visible between the estimated and the measured doses. The fitted lines show linear correlations, with correlation coefficient values ranging between 0.99847 to 0.99999 for the given tube voltages as shown in Figs. 4 and 5.
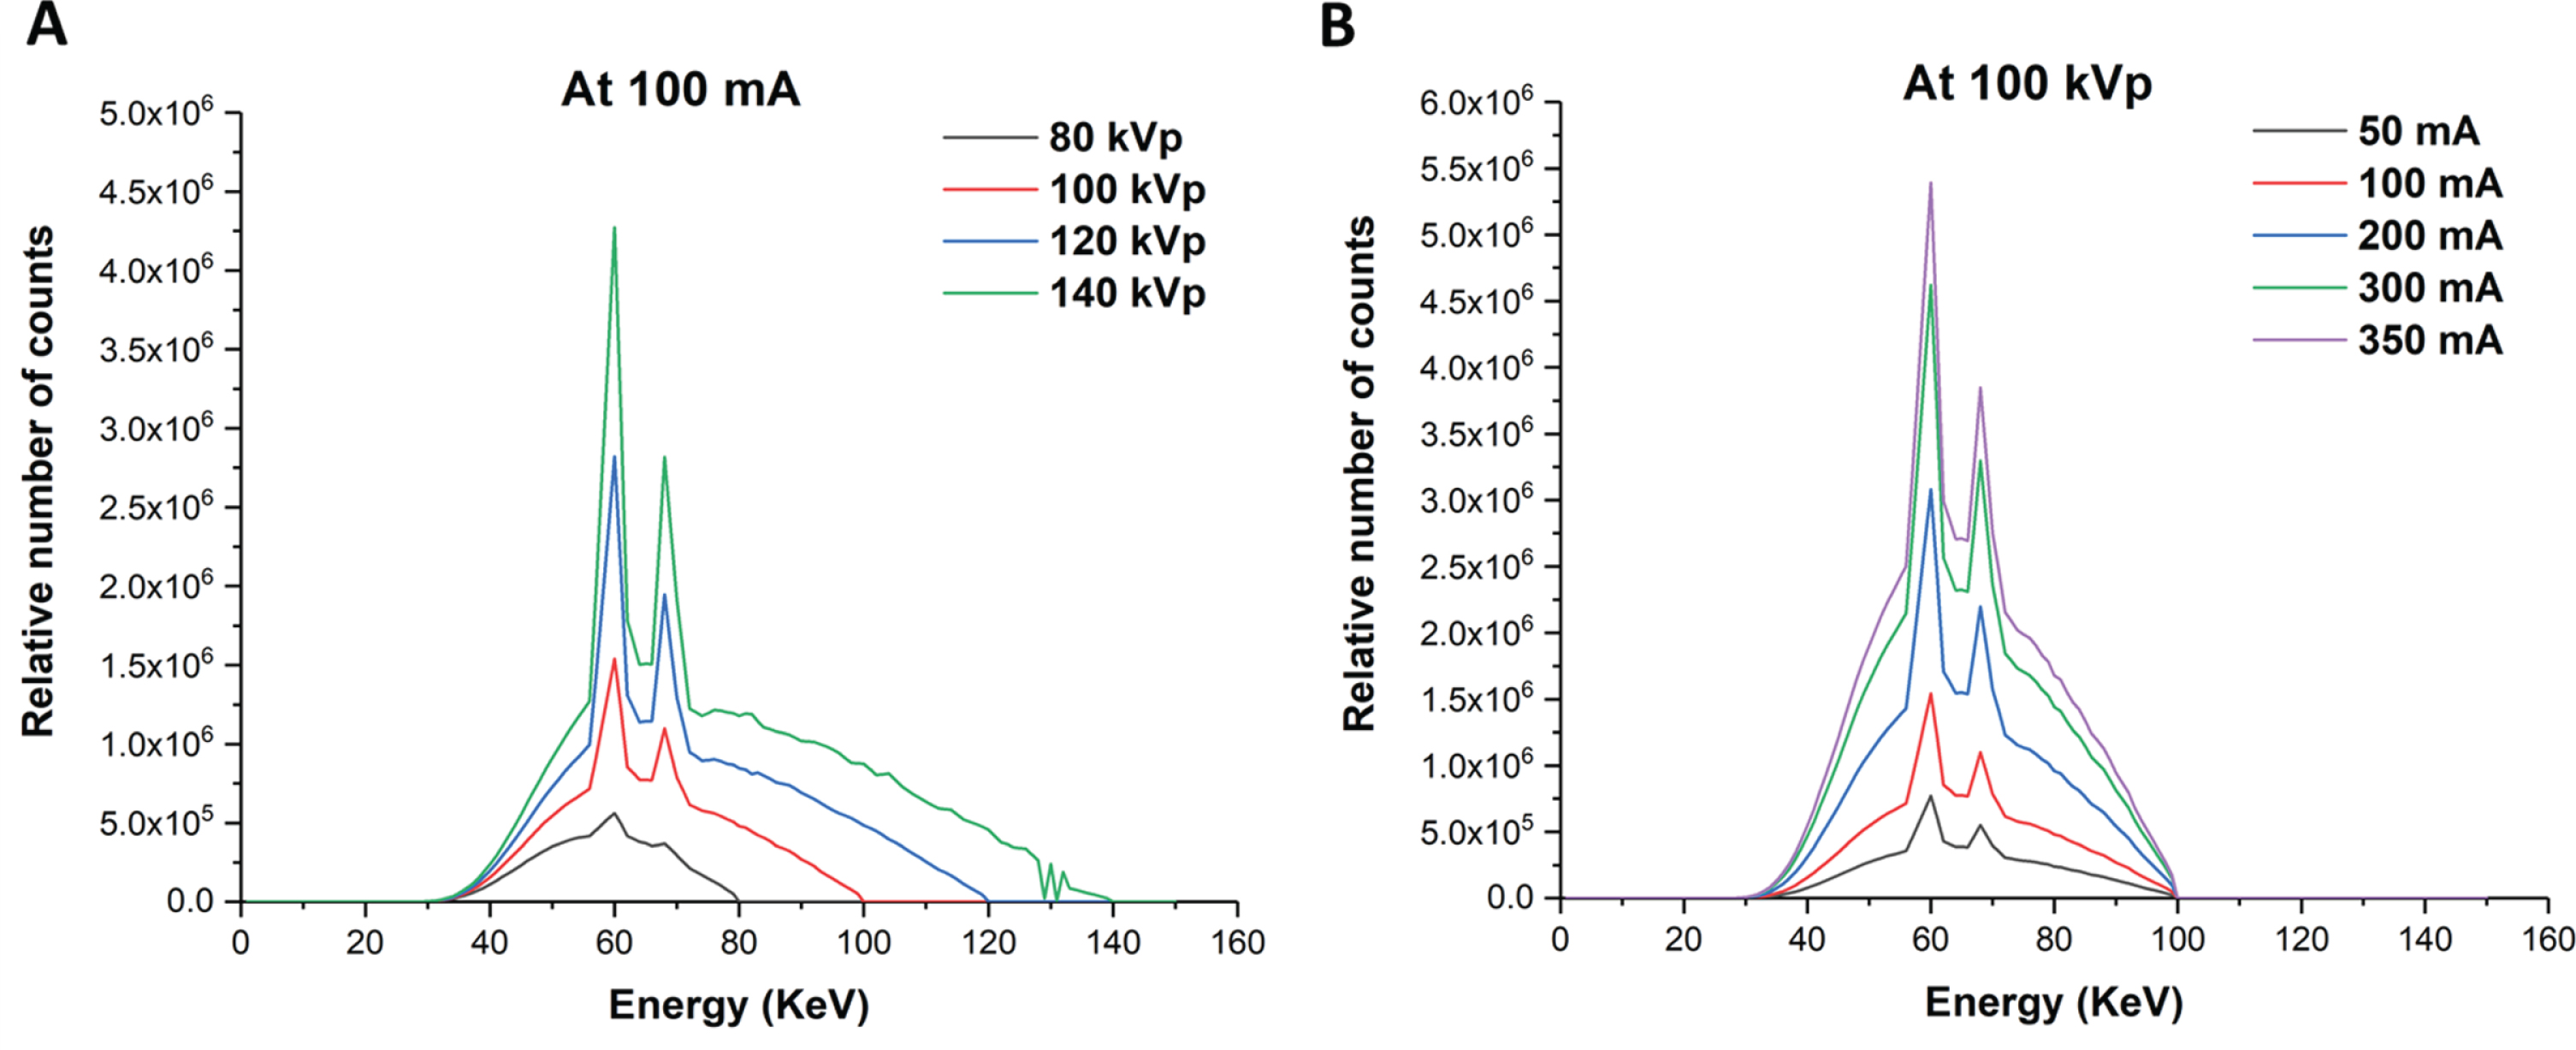
The calculated CT x-ray spectrum using equation 4 for (A) different tube voltages (kVp) at 100 mA and (B) different tube currents (mA) at 100 kVp.
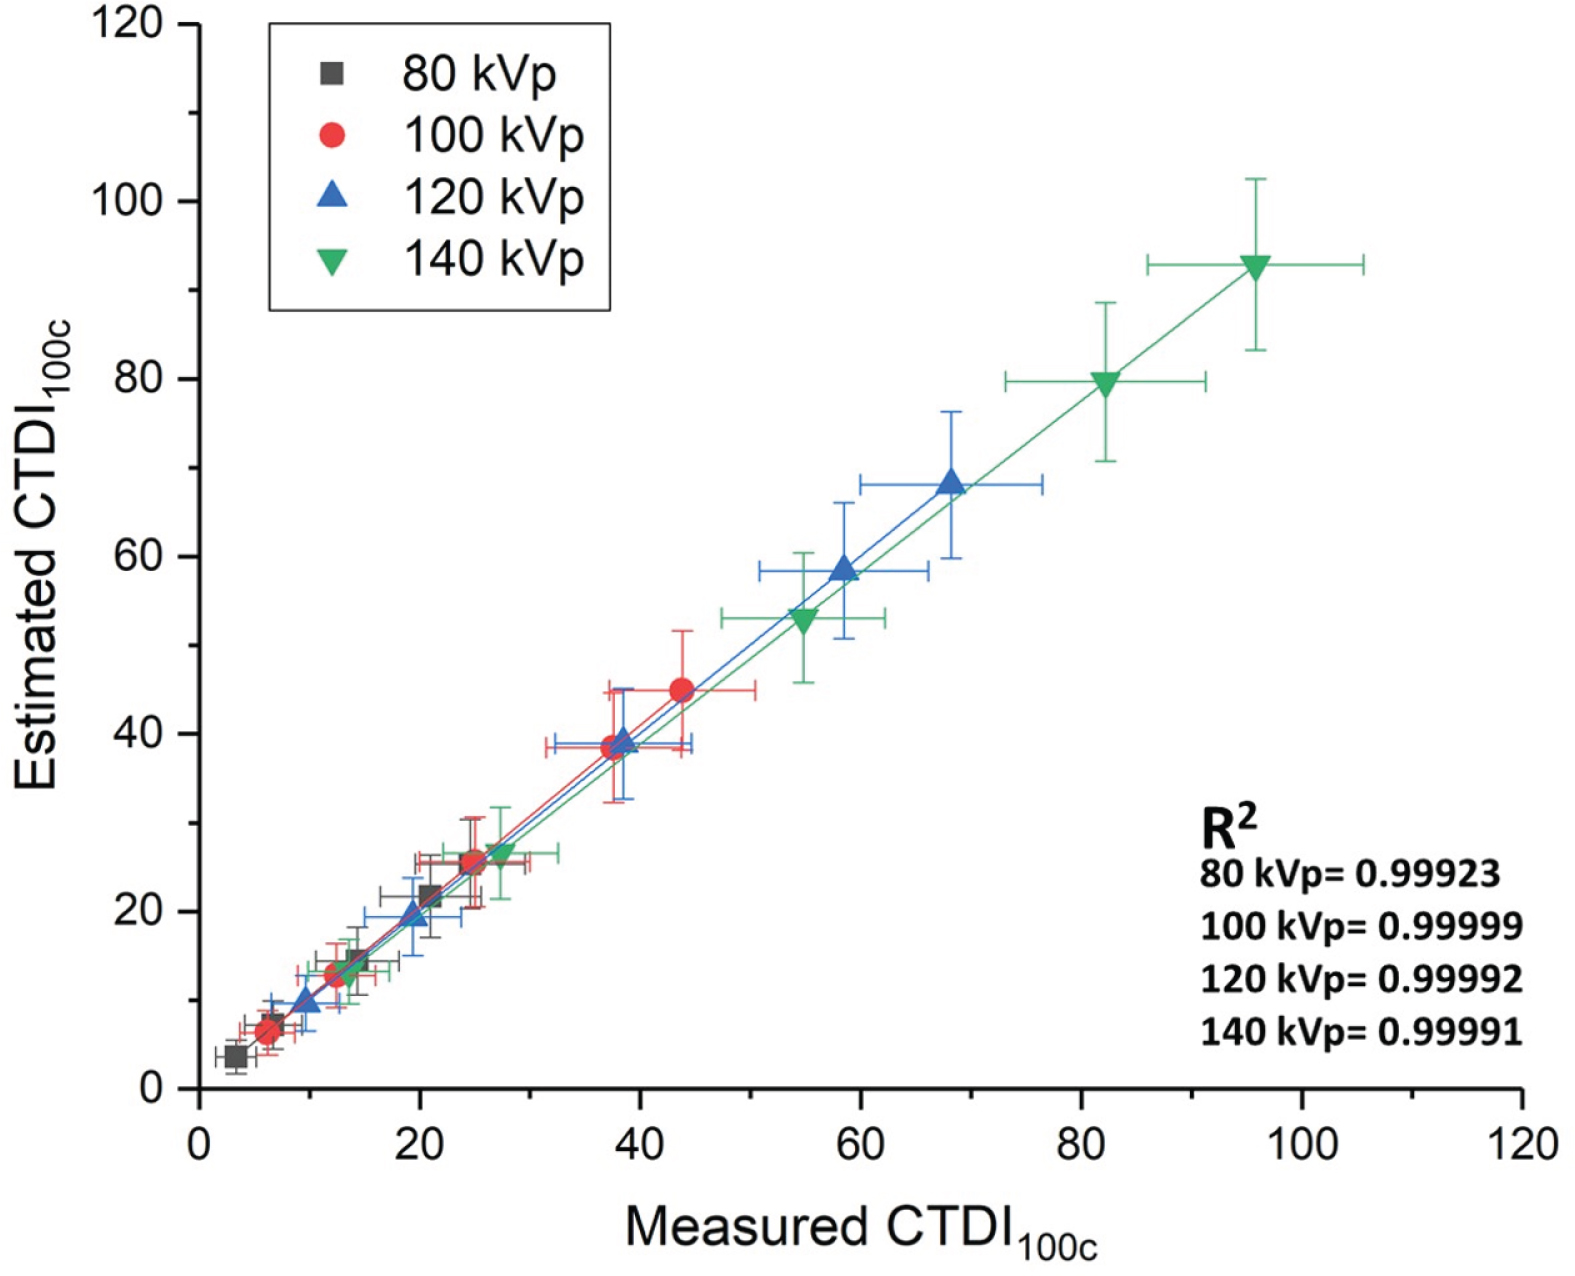
The estimated and calculated dose (CTDI100C) at the centre of the CT phantom at different tube voltages (kVp) and currents (mA), with a correlation of 1 and a slope of 0.960 for 140 kVp.
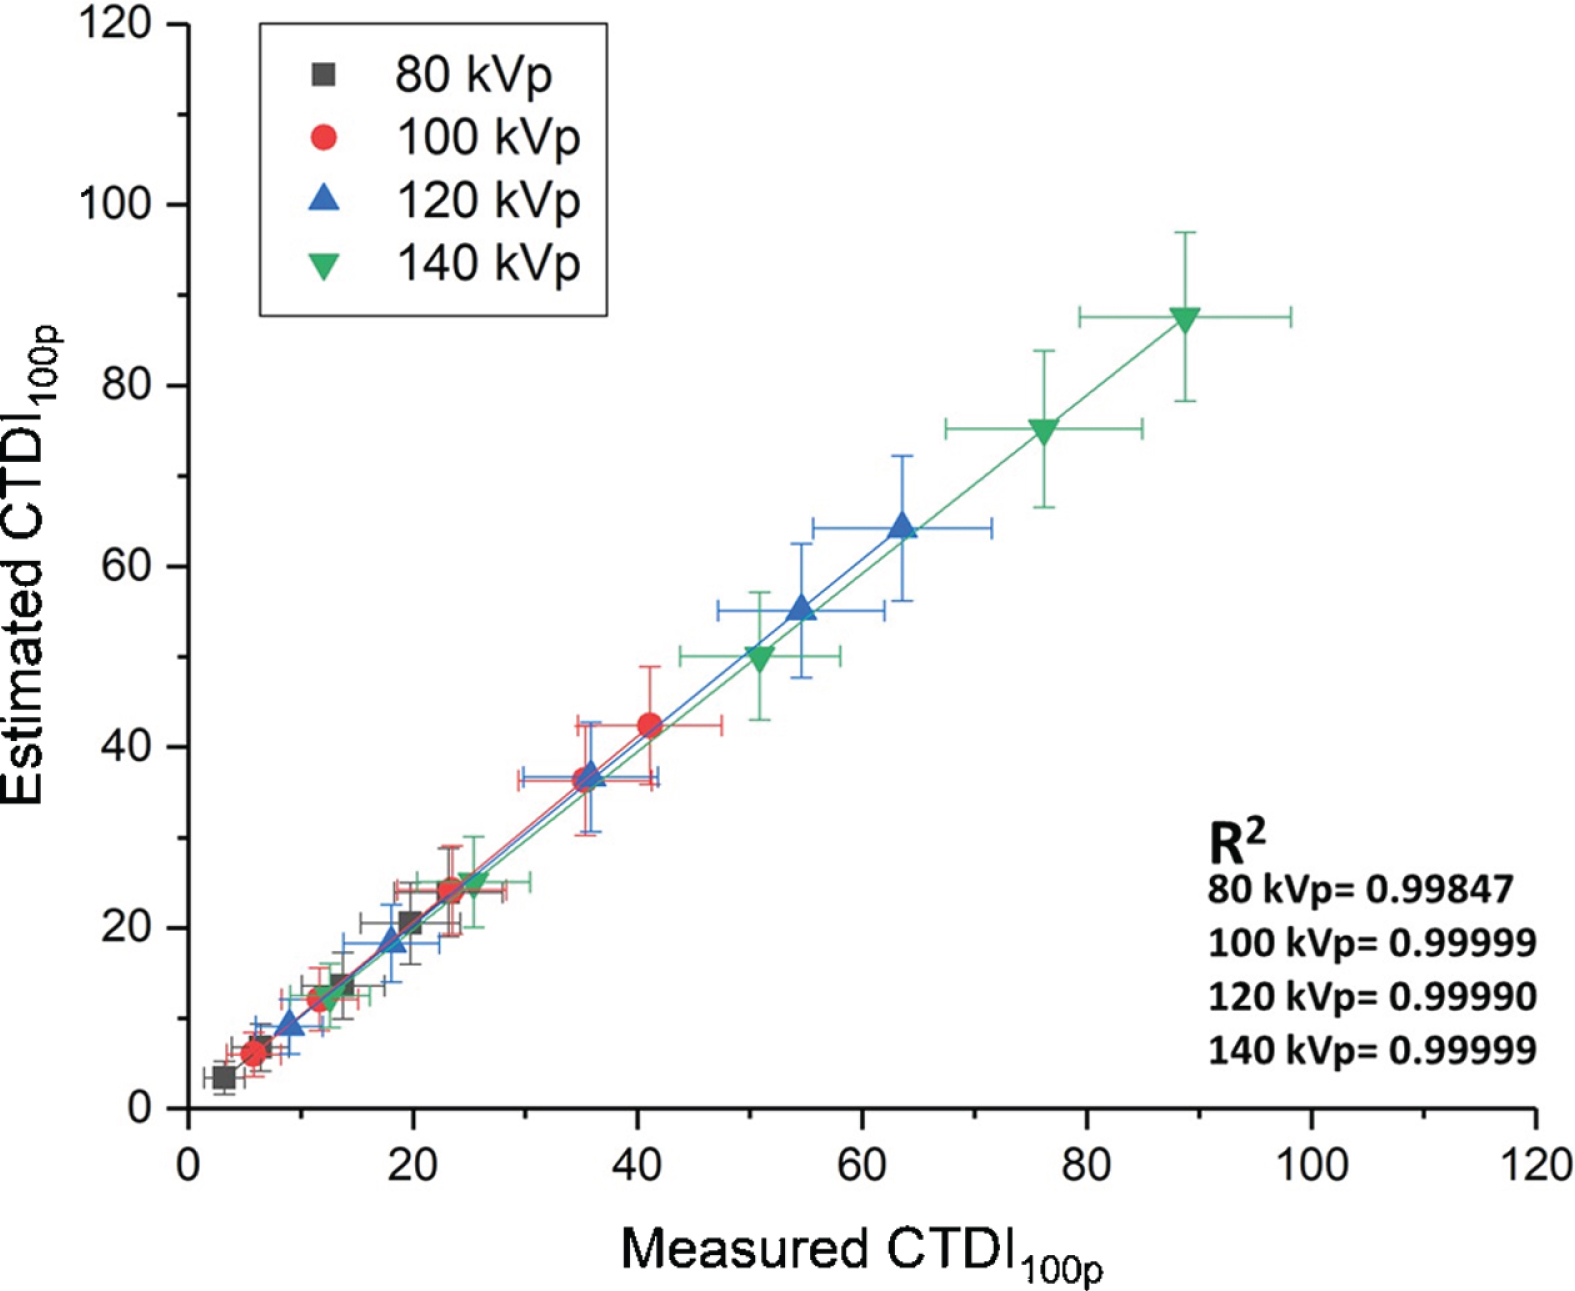
The estimated and calculated dose (CTDI100P) at the periphery of the CT phantom at different tube voltages (kVp) and current (mA), with a correlation of 1 and slope of 0.986 for 140 kVp.
The measured, estimated, and displayed CTDIvol for various tube voltages and tube currents are shown in Fig. 6. This also shows linear correlations, with correlation coefficient values of nearly 1 for the given tube voltages. These results demonstrate a close alignment between the measured and estimated CT dose parameters.
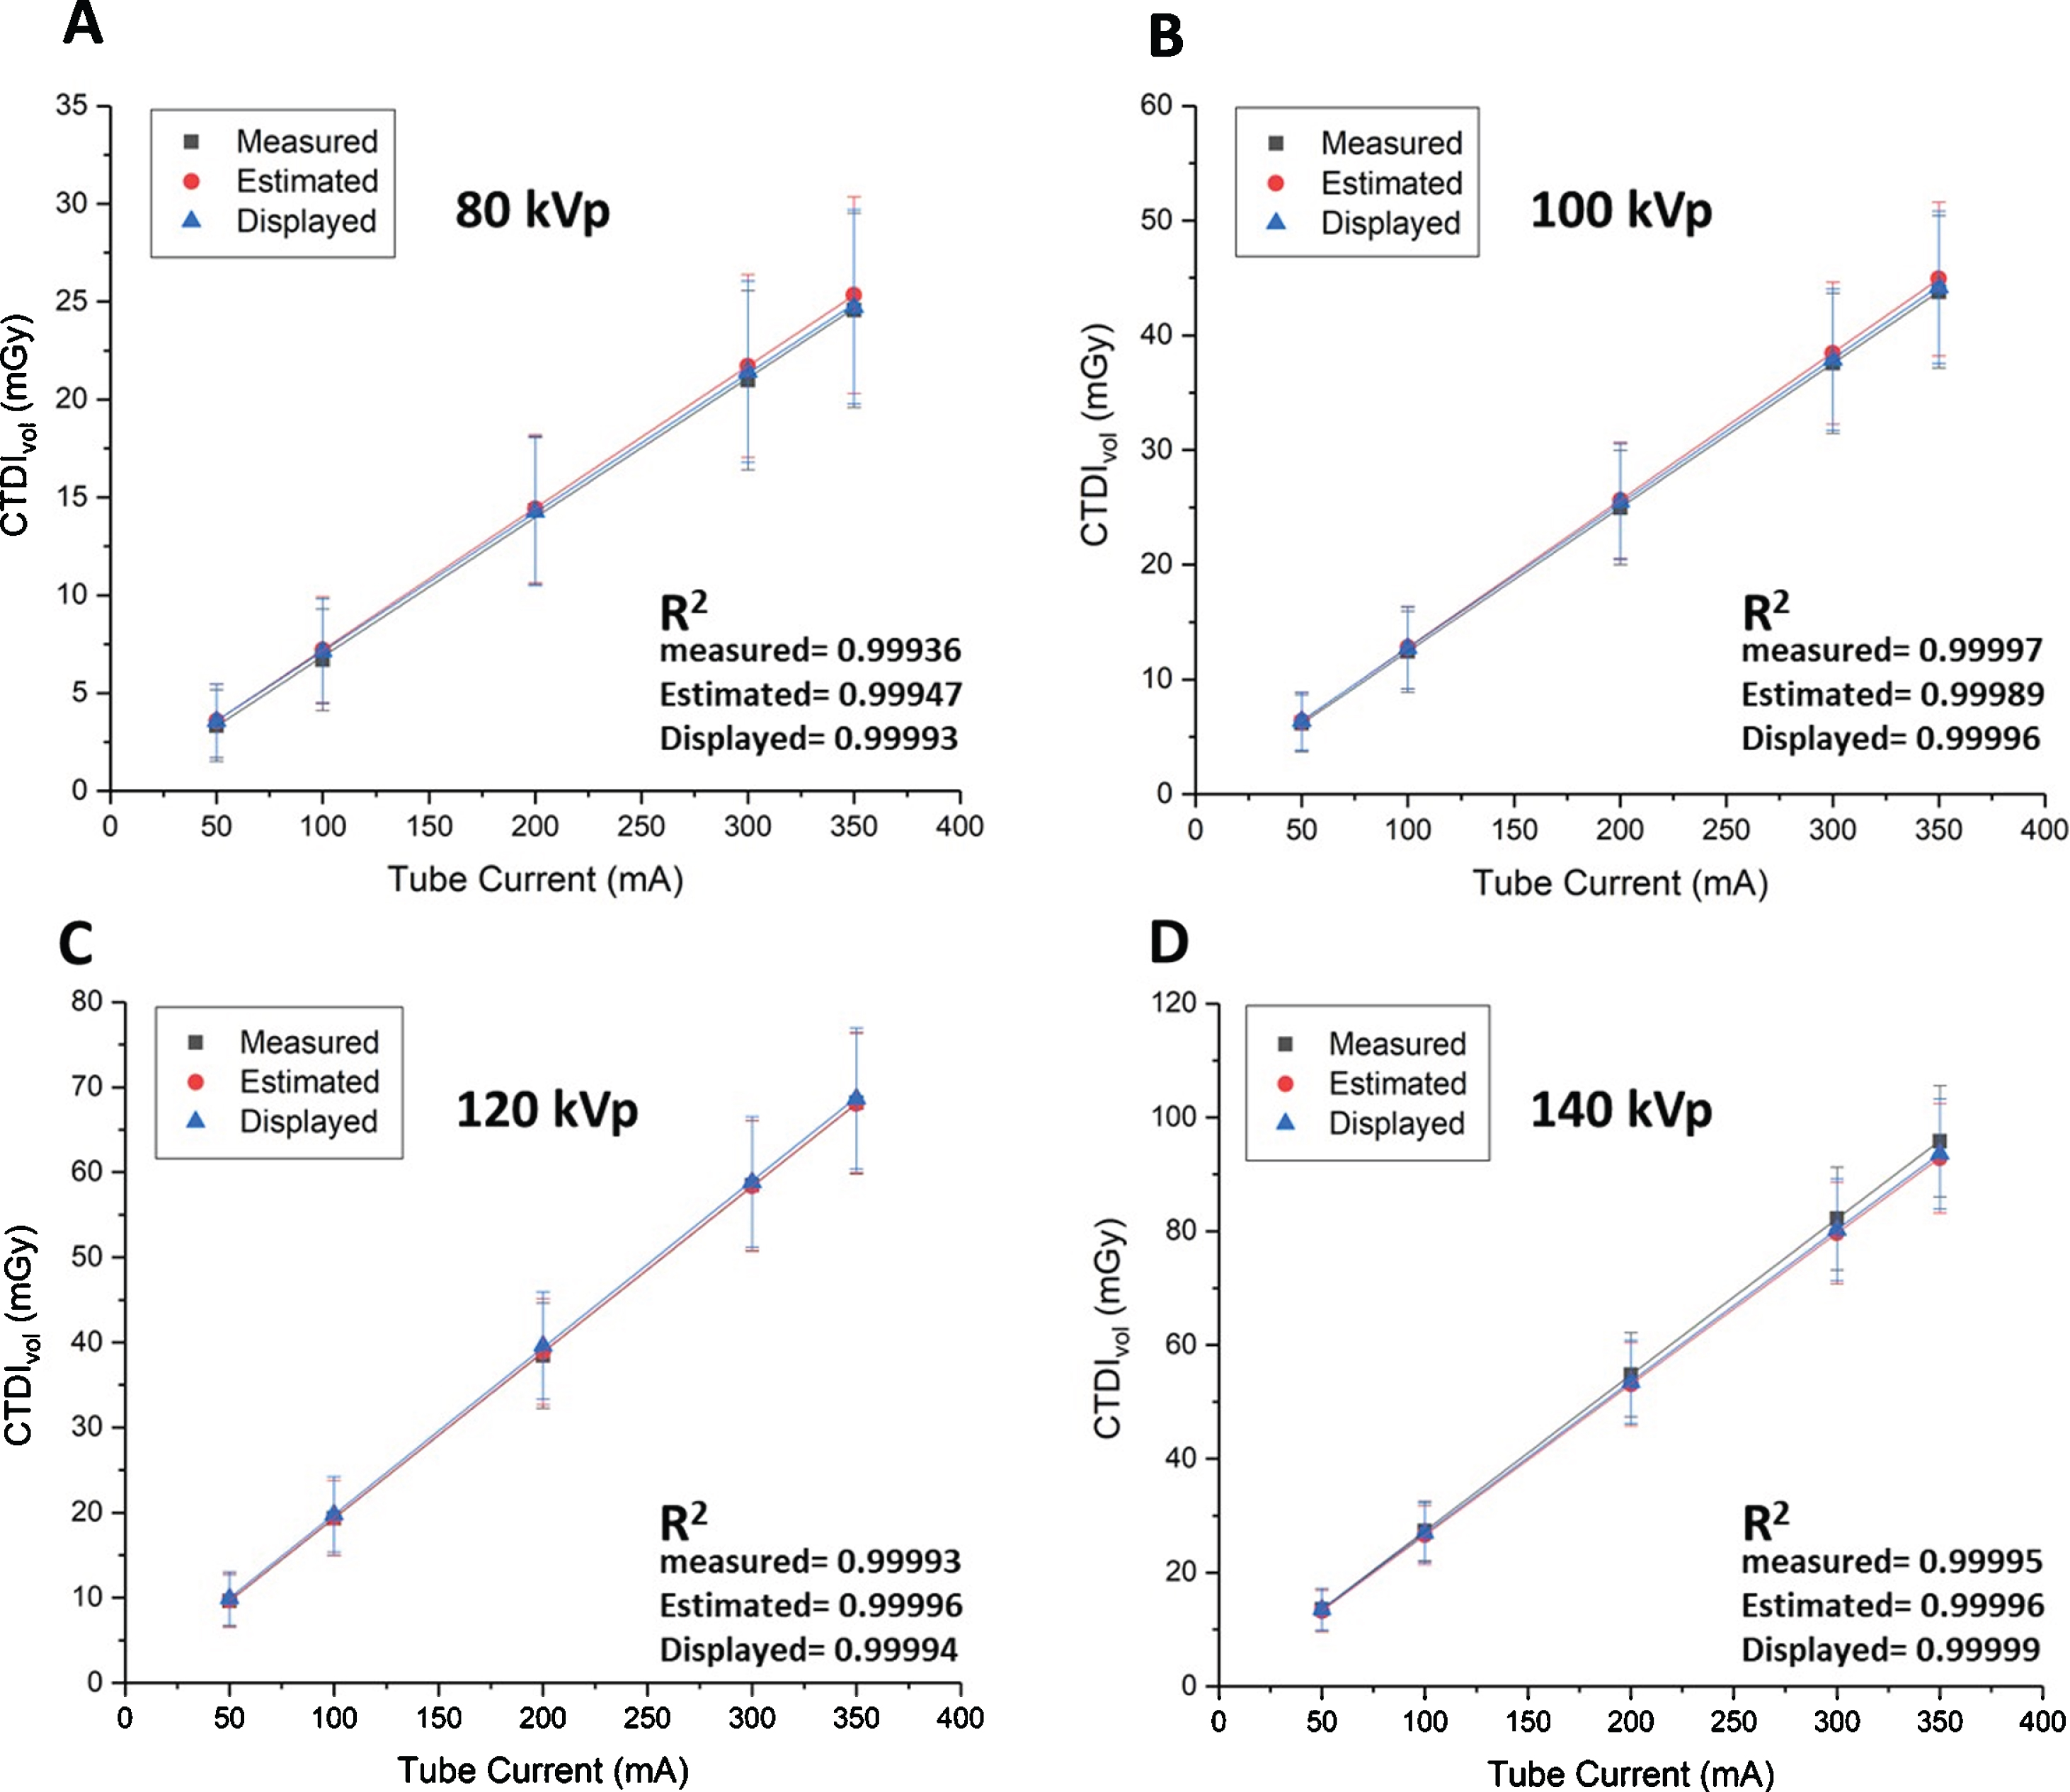
The measured, displayed, and estimated volume CT dose index (CTDIvol) for different tube voltages (kVp) and currents (mA).
The percentage differences between the measured and estimated volume of the CTDIvol for different tube voltages and currents are shown in Fig. 7. For a given tube current, the percentage differences for tube voltage at 100 kVp, 120 kVp, and 140 kVp were less than 5%. The greatest differences were identified at 80 kVp for low tube currents (50 mA, 100 mA), but these remained less than 10%. These results also demonstrate a close alignment between the measured and estimated CT dose parameters.
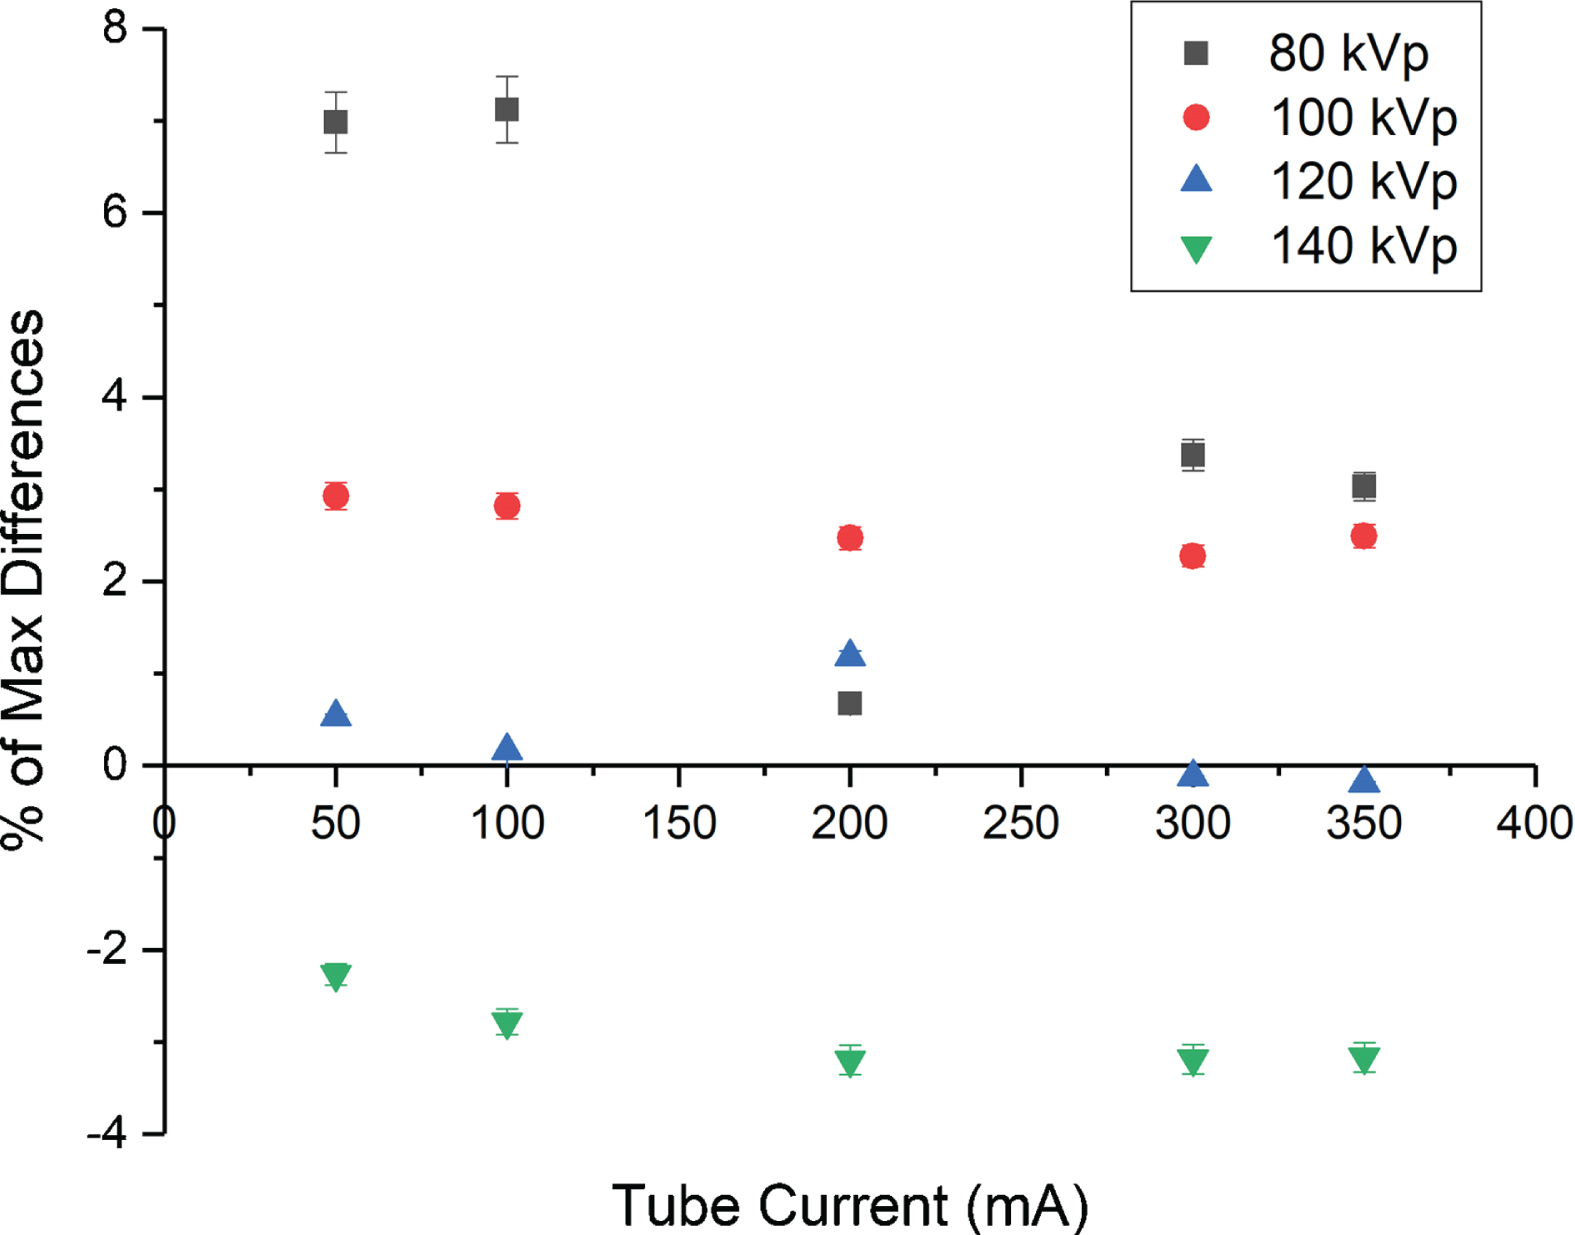
The percentage differences between the measured, displayed, and estimated volume CT dose index (CTDIvol) for different tube voltages (kVp) and currents (mA).
The CT dose parameters (CTDIw, CTDIvol) were simulated using a calibrated CT x-ray energy spectrum. The CT x-ray spectrum was calibrated from the raw data using the calibration factor for the specific CT x-ray tube (Equation 2). The estimated CT dose index at the centre and periphery of the CT phantom (CTDI100C, CTDI100P) at various tube voltages and currents demonstrated close alignments with the measured values (with a strong correlation and a slope of nearly one, as shown in Figs. 4 and 5). The estimated and measured doses were used in the calibration of a CT x-ray energy spectrum and the estimation of the CT dose parameters for a given technique factor.
The close alignment between the measured CT dose index (CTDI100C, CTDI100P) and the estimated values allowed the computational model to estimate the CT dose parameters for all technique factors. Attention should be paid to low tube currents (50 mA, 100 mA) for a tube voltage of 80 kVp as these produced greater percentage differences (under 10%) between the estimated and measured CT dose parameters index. Even with these greater percentage differences, which are within the range of errors reported by other computational models [32–34]; however, these results demonstrate that our computational tool can be used to effectively estimate CT dose and could provide a cost-effective educational resource to enhance the practical skills for the radiological sciences students, as the effect of various parameters that would contribute to the delivered dose can be virtually studied.
The percentage differences between the estimated and measured dose parameters (CTDIvol) for the tube voltages 100 kVp, 120 kVp, and 140 kVp were found to be less than 5%, agreeing with other calculation techniques [30–32]. These differences are due to the uncertainties within the estimation of the x-ray source beam characterisation parameters for accurate dose calculation.
Our model produces simulation tools that can be used to estimate the x-ray energy spectrum of any CT x-ray tube using a single dose measurement. This removes the need for a series of measurements, which is considered time consuming and requires highly-trained staff.
The CTDIvol was estimated for a fixed beam collimation (20 mm). In order to increase the effectiveness and capacity of the computational tool, and because the dependency of the CT radiation outputs on beam collimation is vendor-specific, a series of measurements are required to calibrate and characterise the energy spectrum for different beam configurations in order to accurately estimate the dose parameters for each machine-specific x-ray tube.
Conclusion
The presented computational model provides a tool for the simulation of a machine-specific spectrum and CT dose parameters using a single dose measurement. The percentage differences between the estimated and measured dose parameters (CTDIvol) for the tube voltages 100 kVp, 120 kVp, and 140 kVp were found to be under 5%. For the tube voltage 80 kVp, the differences were under 10%. Work is currently in progress towards an estimation of the CT image quality parameters for image quality and dose optimisation.
Footnotes
Acknowledgment
The authors extend their appreciation to the Deanship of Scientific Research at King Khalid University (KKU) for funding his research through project number (RGP-223-40).